Article

Effect of Doping of Cd1−xZnxS/ZnS Core/Shell Quantum Dots in Negative Dielectric Anisotropy Nematic Liquid Crystal p-Methoxybenzylidene p-Decylaniline

1
Department of Physics, University of Lucknow, Lucknow UP-226007, India
2
Department of Physics, Banaras Hindu University, Varanasi UP-221005, India
*
Authors to whom correspondence should be addressed.
Crystals 2021, 11(6), 605; https://doi.org/10.3390/cryst11060605
Submission received: 13 March 2021 / Revised: 24 May 2021 / Accepted: 26 May 2021 / Published: 27 May 2021
(This article belongs to the Special Issue Liquid-Crystal Polarization Gratings)

Abstract

:
We report the effect of the doping of Cd1−xZnxS/ZnS core/shell quantum dots (CSQDs) in nematic liquid crystal p-methoxybenzylidene p-decylaniline (MBDA) at 0.05 wt/wt%, 0.1 wt/wt%, 0.15 wt/wt%, 0.2 wt/wt%, 0.25 wt/wt%, and 0.3 wt/wt% concentrations of CSQDs in MBDA. Dielectric parameters with and without bias with respect to frequency have been investigated. The change in electro-optical parameters with temperature has also been demonstrated. The increase in the mean dielectric permittivity was found due to the large dipole moment of CSQDs, which impose stronger interactions with the liquid crystal molecules. The dielectric anisotropy changes sign on doping CSQDs in MBDA liquid crystal. It was concluded that the CSQD doping noticeably increased the dielectric permittivity of nematic MBDA in the presence of an electric field. The doping of CSQDs in nematic MBDA liquid crystal reduced the ion screening effect effectively. This phenomenon is attributed to the competition between the generated ionic impurities during the assembling process and the ion trapping effect of the CSQDs. The rotational viscosity of nematic liquid crystal decreased with increasing concentration of the CSQDs, with a faster response time observed for the 0.05 wt/wt% concentration. The birefringence of the doped system increased with the inclusion of CSQDs in MBDA. These results find application in the field of display devices, phase shifters, LC—gratings, TIR waveguide, industries, and projectors.

1. Introduction

Negative dielectric anisotropy (Δε < 0) liquid crystals have been extensively employed in direct-view and projection displays [1]. The widespread feature of a negative Δε liquid crystal is that lateral polar substituents induce a dipole moment perpendicular to the principal molecular axis [2,3]. As explained in [4], there are many techniques to induce polarity perpendicular to the molecular axis such as (i) using certain polar linking groups; (ii) a cyclohexane ring involving a polar unit at an axial position; (iii) an aromatic ring with polar unit(s) in lateral positions; and (iv) the use of heterocyclic rings with the heteroatom off-axis. However, the aspect ratio of the cylindrical molecular shape would decrease by the off-axis polar group, which tends to disturb the liquid crystal phase stability [4]. An adequately large Δε facilitates lower driving voltage, which in turn lowers the power consumption of display devices. Most nematic liquid crystal devices involve surface alignment layers in order to comprehend their electro-optic effect. A negative Δε liquid crystal can be utilized in planar or vertical alignment, depending on the electric field direction or mixing a suitable dopant. In an in-plane switching (IPS) cell [5] or fringe-field switching (FFS) cell [6], the electric field is mainly in the lateral direction, while in a vertically aligned cell [7] or multi-domain vertical alignment cell [8], the field is directed in the longitudinal direction. For mobile displays, IPS or FFS is a favored choice because they are more robust to external pressure, which is crucial for touch panels [9]. In this paper, we focus on the negative dielectric anisotropy (Δε) nematic liquid crystal doped with Cd1−xZnxS/ZnS core/shell quantum dots (CSQDs) for its applications in display devices, phase shifters, and antennas.
Basu et al. [10] provided the evidence for the formation of the self-assembly of CdS QDs in 5CB nematic liquid crystal. Gupta et al. [11] illustrated the phase retardation behavior of nematic 8CB (positive Δε) doped with CdSe QDs. It explained the formation of self-assembled arrays of QDs in nematic liquid crystal and thus, the improved alignment in doped systems was observed. Seidalilir et al. [12] reported the improved electro chemical and electro-optical properties of Ni:ZnCdS/ZnS core/shell QDs in positive Δε nematic E7 liquid crystal. It explained the self-assembled arrays of CSQDs in the nematic phase and reduction in the screening effect by the ion trapping effect of CSQDs. Misra et al. [13] explained the influence of dispersing Cu:ZnO in nematic MBBA liquid crystal and studied the dielectric properties and activation energies for the dispersed systems. Singh et al. [14] reviewed the effect of doping nanoparticles in nematic liquid crystals. Rastogi et al. [15] reported the effect of doping graphene oxide (GO) in negative Δε nematic p-methoxybenzylidene p-decylaniline (MBDA) liquid crystal and found that the rotational viscosity and threshold voltage increased with an increase in the concentration of GO in MBDA. GO effectively traps the ionic impurities in doped systems, which results in improved dielectric properties. The schematic illustration of the ion capturing phenomenon of Cd1−xZnxS/ZnS CSQDs in nematic 2020 was demonstrated by Rastogi et al. [16]. Pandey et al. [17] investigated the dielectric and electro-optical properties of felix 17/000 ferroelectric liquid crystal doped with Cd1−xZnxS/ZnS core/shell quantum dots. Alower operating voltage with faster optical response time was noticed. Singh et al. [18] reported the quenching in photoluminescence intensity with improved contrast of felix 17/000 by doping Cd1−xZnxS/ZnS CSQDs. The impact of doping CSQDs in negative Δε nematic liquid crystal BBHA on its dielectric and electro-optical properties was examined by Tripathi et al. [19]. It was found that the relaxation frequency of doped system shifted to the higher frequency side with bias voltage with improved birefringence and response time. The doping of Cd1−xZnxS/ZnS CSQDs in negative Δε (−1.36) nematic liquid crystal MBDA has never been reported thus far. Therefore, the present paper deals with the doping of Cd1−xZnxS/ZnS core/shell quantum dots (CSQDs) in nematic liquid crystal MBDA. The dielectric and electro-optical measurements were undertaken for different concentrations of CSQDs abbreviated as Mix 1, Mix 2, Mix 3, Mix 4, Mix 5, and Mix 6. The dynamic behavior of a mixture consisting of liquid crystalline MBDA and CSQDs in an electric field has been studied. The model is based on elastic continuum theory considering the interaction of the nematic molecules with the surrounding molecules [20]. The main findings of the work revealed faster electro-optic response time, reduced rotational viscosity, and improved birefringence for Mix 1. The self-assembled arrays of CSQDs in MBDA liquid crystal improved the orientational order and alignment of the doped systems. The dielectric anisotropy revealed the change in the sign of Δε for doped system compared to the pure nematic MBDA. CSQDs effectively trap the ionic charges on its surface, thus ablating the screening effect, leading to improved dielectric and electro-optical properties. One major issue with LC gratings is the average refractive index being too low (<1.7) for waveguide AR displays. However, the dispersion of nano-dopant or CSQDs can increase birefringence and hence the index. Therefore, this work becomes important for LC grating and TIR waveguide display society as well.

2. Experimental Details

The nematic liquid crystal material used in this study was negative dielectric anisotropy p-methoxybenzylidene p-decylaniline (MBDA), which exhibited the following chemical structure and phase sequence shown in Figure 1 [15]. MBDA was obtained from Frinton Laboratories Inc., USA. The optical anisotropy of MBDA is as follows: ΔnMBDA= 0.05 (56 °C, at 693.2 nm wavelength). We used negative dielectric anisotropic liquid crystal Δε = −1.36.
CSQDs were doped in MBDA liquid crystal and synthesized by the Gram-scale one pot synthesis method as described by Bae et al. [21]. The TEM and XRD characterization of CSQDs has already been provided in [18]. The Cd1−X ZnXS/ZnS (x = 0.85) core/shell implemented in the present study had a diameter of about 8.5 nm. x = 0.85 yielded high luminescence of blue emission and photoluminescence quantum yield. The core (diameter 5 nm) was well protected by the layer surrounding it called the shell (diameter 3.5 nm). The ZnS shell acts as a capping agent. The role of the ZnS shell over the Cd1−XZnXS core has been reported by D. Bera et al. [22].
The fabrication of a sample cell holder was conducted as per the method described in our work [15] and involves the use of conducting indium tin oxide (ITO) glass plates. The photolithographic technique was used to achieve the desired electrode pattern on the ITO substrates [15]. The active electrode area was 5 × 5 mm2. In order to achieve planar alignment, the rubbed polyimide technique was used. In this technique, the planar alignment was achieved by treating the conducting layer with an adhesion promoter and polymer nylon (6/6). After drying the polymer layer, substrates were rubbed unidirectionally in an anti-parallel manner. The capacitor was formed by placing the substrates one over another. The thickness of the sample cells used in the present study was 8 μm. The empty sample cells were calibrated using the analytical reagent (AR) benzene (C6H6). CSQDs and MBDA nematic liquid crystal composites were prepared by incorporating the desired concentration of CSQDs with pure MBDA. For that, the wt/wt ratio of CSQD was dispersed into the pure MBDA and then homogenized with an ultrasonic mixer for the uniform mixing of CSQDs. The CSQD doped MBDA composites were named Mix 1 (0.05 wt/wt %), Mix 2 (0.1 wt/wt%), Mix 3 (0.15 wt/wt%), Mix 4 (0.2 wt/wt%), Mix 5 (0.25 wt/wt%), and Mix 6 (0.3 wt/wt%). Pure MBDA and CSQD doped nematic liquid crystal materials were filled inside the cells in the isotropic phase by means of capillary action and then slowly cooled down to room temperature.

Preparation of Homogenous Mixture of CSQDs and MBDA Composites

A suspension of CSQDs (1 mg/mL) was prepared in toluene and ultrasonicated for 2 h to ensure a homogenous suspension. A fixed amount of MBDA nematic liquid crystal was doped with different weight percentage concentrations of CSQDs by taking 0.05 wt/wt%, 0.1 wt/wt %, 0.15 wt/wt%, 0.2 wt/wt%, 0.25 wt/wt%, and 0.3 wt/wt% concentration of CSQDs in MBDA. CSQDs and MBDA composites were then homogenized by magnetic stirring for 4 h at an isotropic temperature followed by ultrasonication for the next 3 h. This procedure was repeated several times to obtain a homogenous mixture of CSQDs in MBDA. Toluene was evaporated at an elevated temperature with a slow evaporation rate. The liquid crystal sample cells were filled by the capillary method.
The dielectric measurements were performed using a computer-controlled HP 4194A impedance gain/phase analyzer using a temperature controller (mK 2000, Instec Co., University of Colorado Boulder, Boulder, CO, USA) interfaced with computer software Wintemp was used to maintain the temperature of the hot plate (Instec HCS-302, University of Colorado Boulder, Boulder, CO, USA) with an accuracy of ±0.001 °C.
For the electro-optical set up: He–Ne laser (5 mW power, 693.2 nm wavelength), programmable function generator (Tektronix, AFG-3021B), photodetector (Instec PD02-L1), digital storage oscilloscope (Tektronix, TDS-2024C, and a temperature controller (mK 2000, Instec Co., University of Colorado Boulder, Boulder, CO, USA) interfaced with the computer software Wintemp was used to maintain the temperature of the hot plate (Instec HCS-302) with an accuracy of ±0.001 °C.

3. Results and Discussion

3.1. Polarizing Optical Micrographs

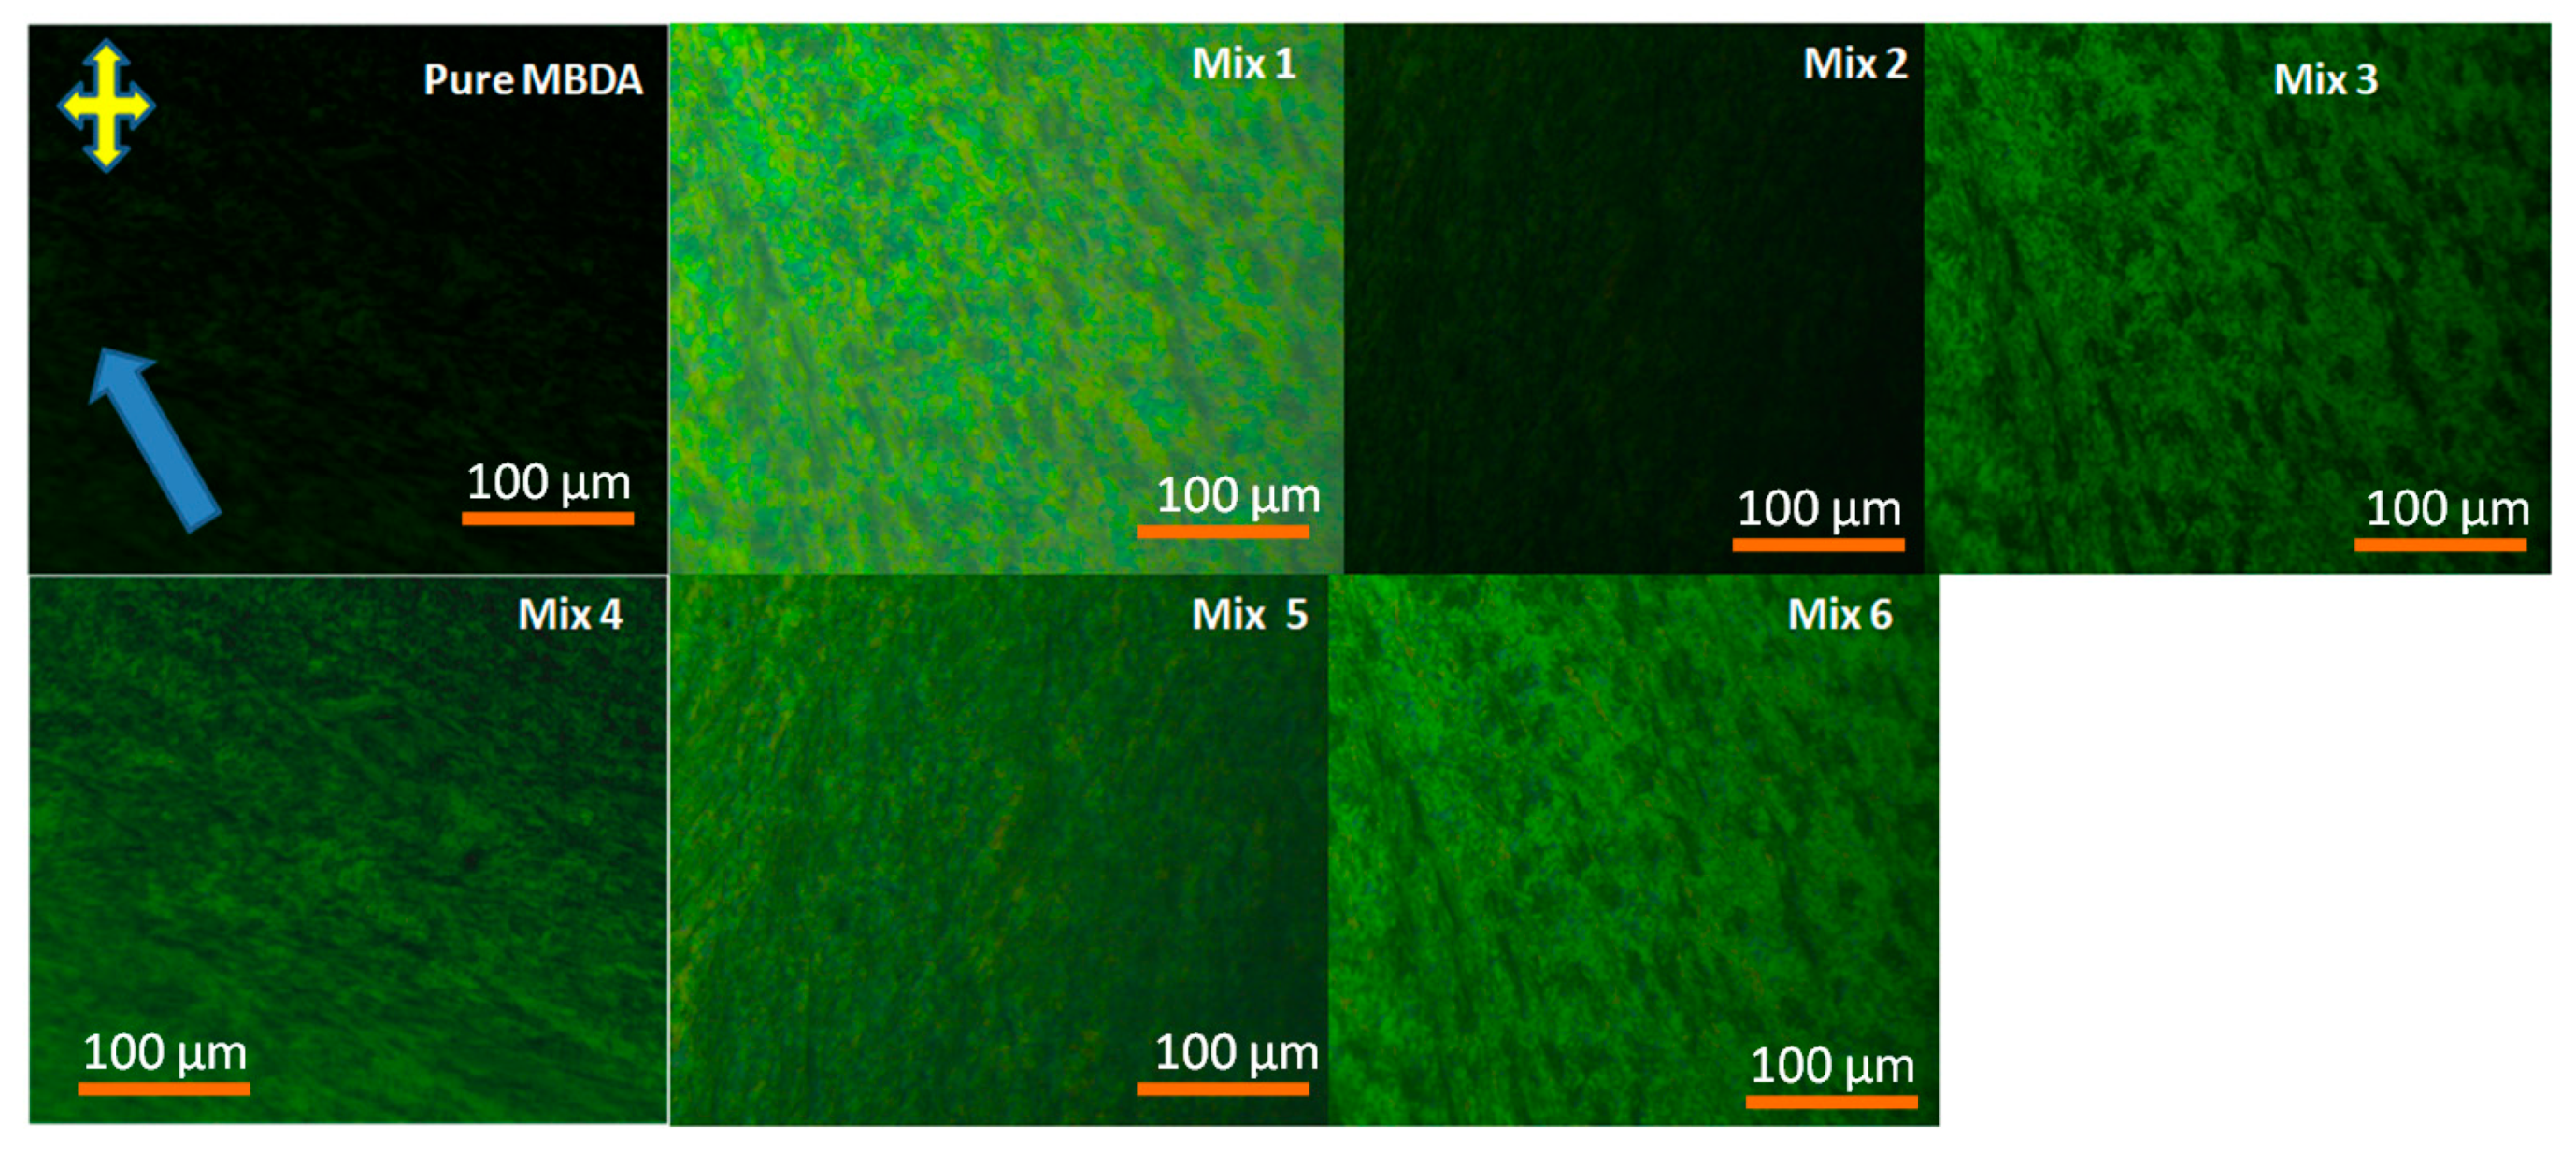
The polarizing optical micrographs for pure MBDA and its doped system with CSQDs (Mix 1 to Mix 6) at a temperature of 56 °C are shown in Figure 2 under the crossed polarizer condition. The uniform molecular alignment is clearly depicted in these texture images. Mix 1 shows the maximum light transmission with improved alignment and hence exhibited increased brightness in comparison to other mixtures and pure MBDA liquid crystal. This result was also evident from the birefringence measurement discussed in the later part of this paper.
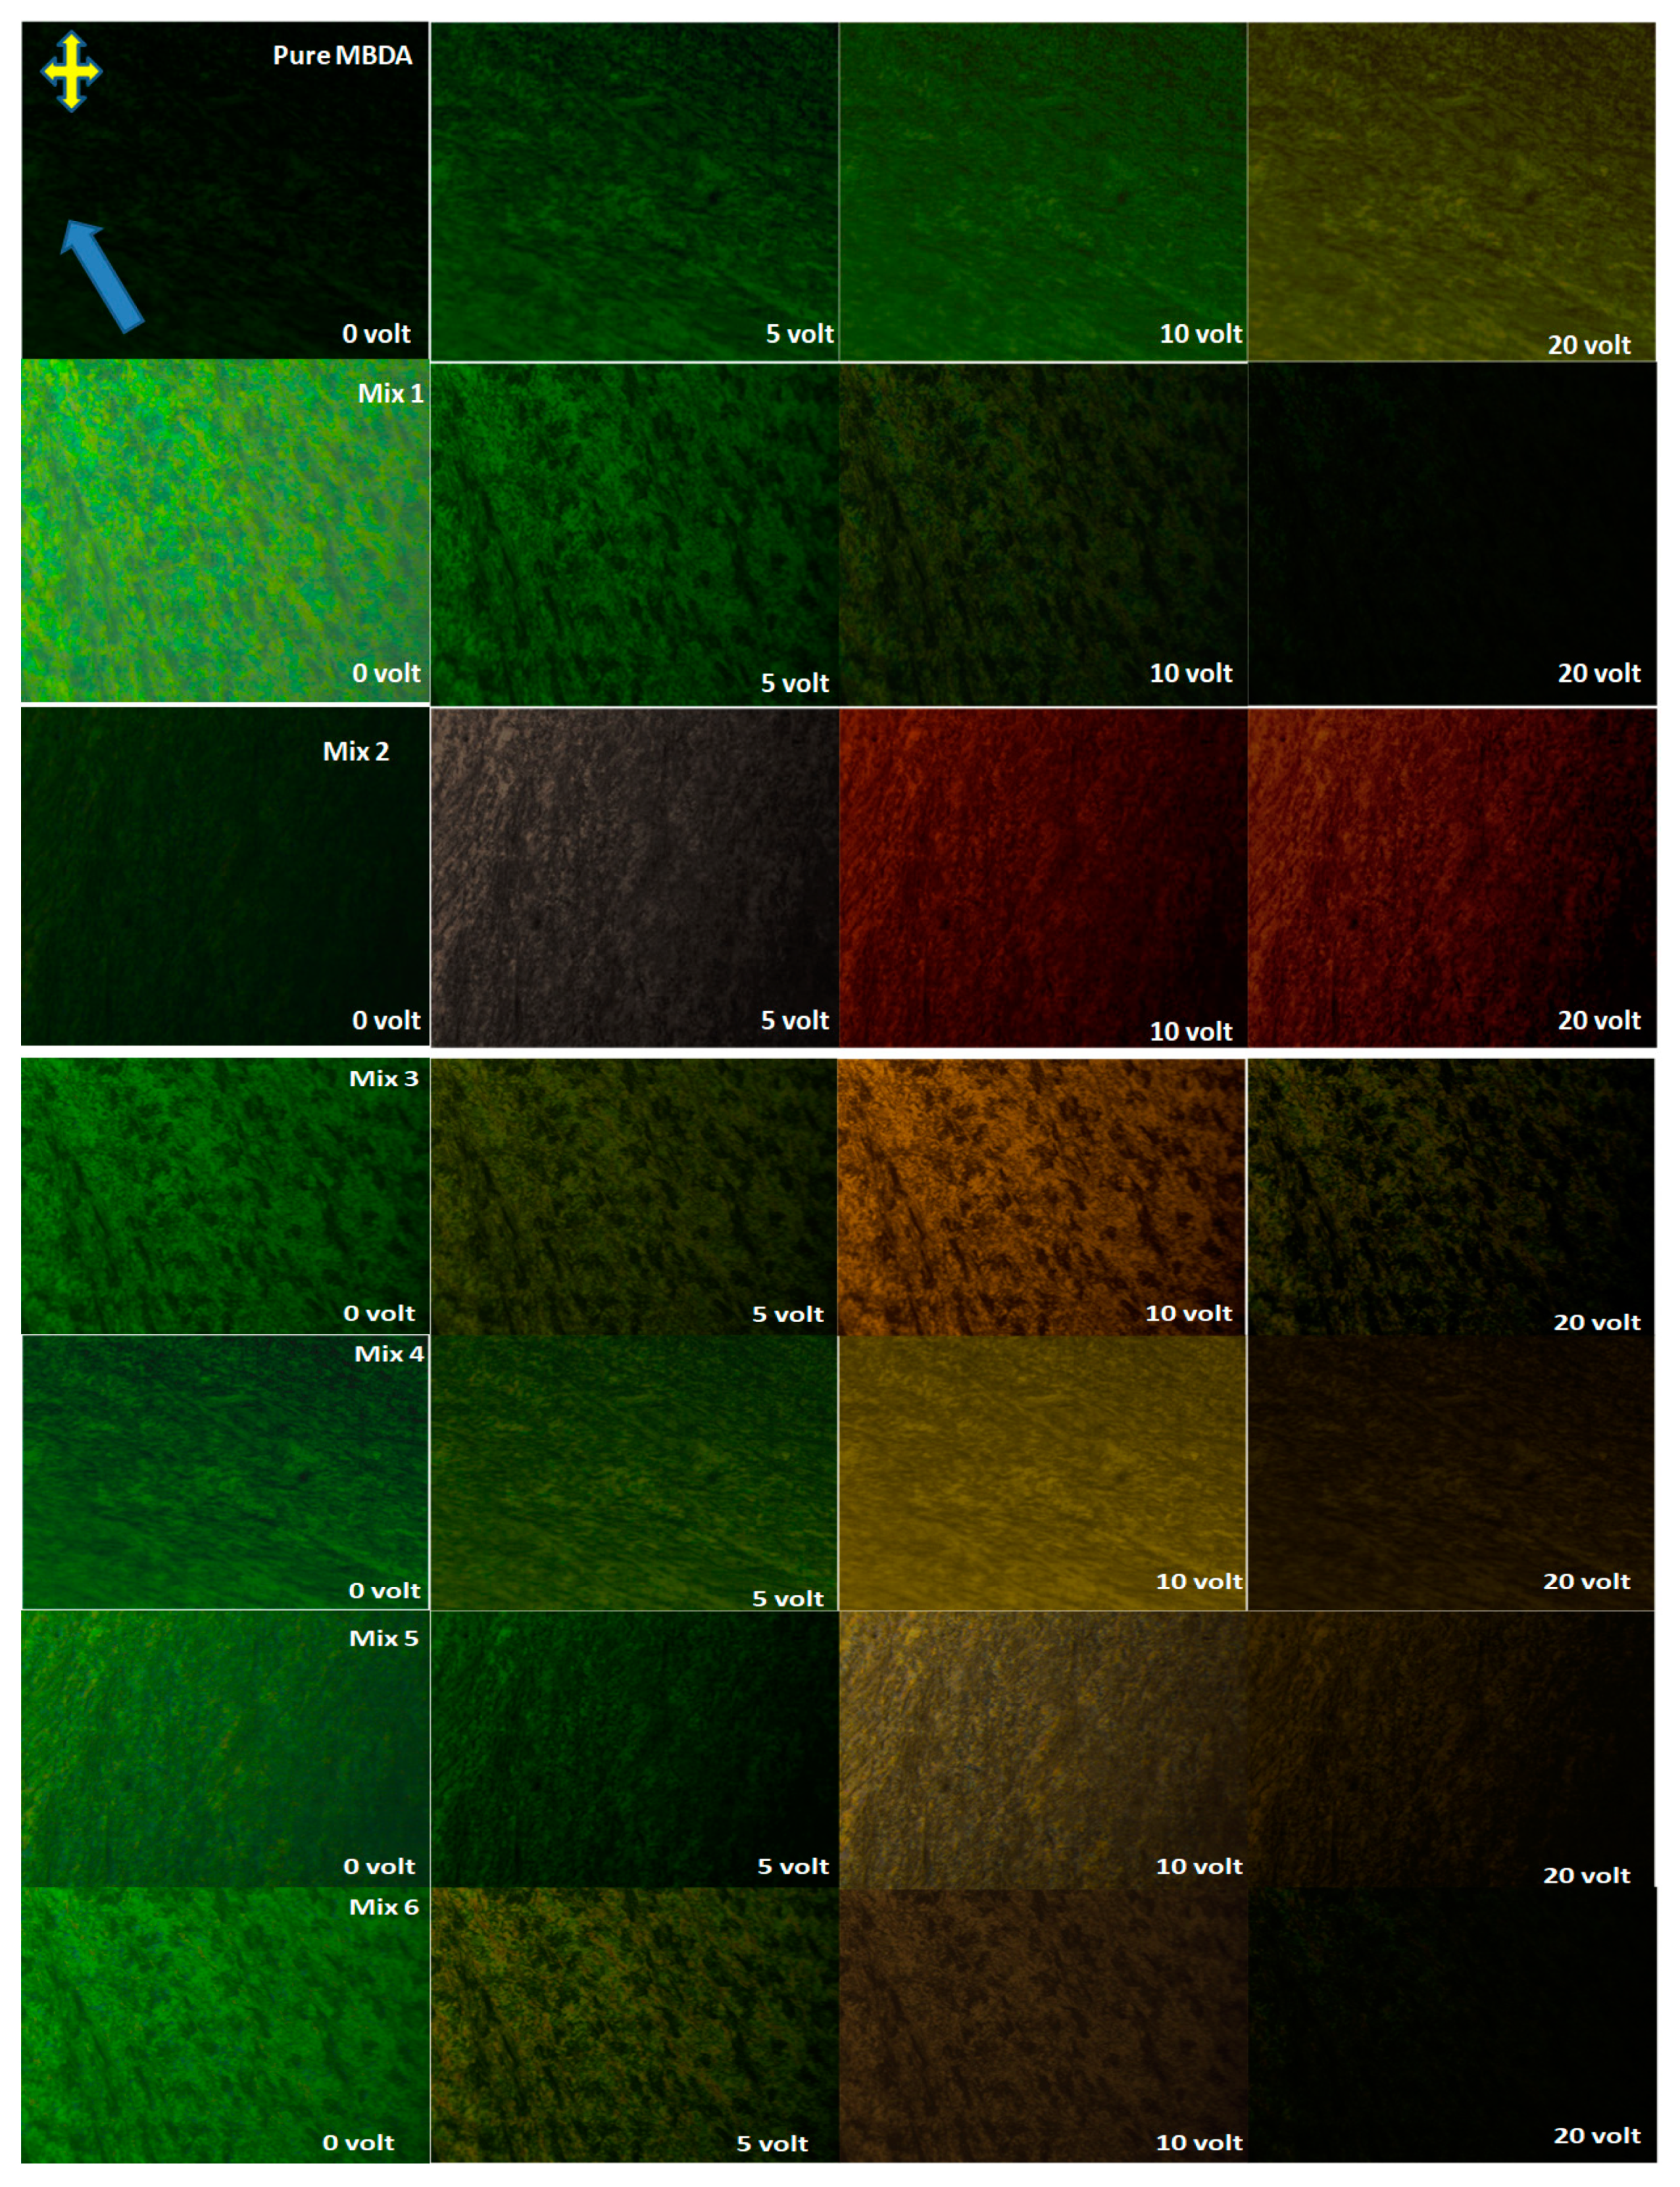
Polarizing optical micrographs for pure MBDA and its doped system with CSQDs corresponding to different applied voltages (0 V, 5 V, 10 V, and 20 V) at a 1 kHz frequency under the crossed polarizer condition are shown in Figure 3. It shows that for pure MBDA at 0 V, the nematic molecules were in a homeotropic state because of its negative dielectric anisotropy, therefore it exhibited a dark state at 0 V. For electric field addressing, the molecules switched from the homeotropic state to planar state and showed a bright state. In the CSQDs doped system without an electric field at 0 V, the nematic molecules were in a planar state, therefore it exhibited a bright state while the electrical addressing at 20 V produced the dark state due to reorientation of the liquid crystal molecules parallel to the electric field. Initially, when the applied voltage was low, pure MBDA molecules lay perpendicular to the plane of the cell substrate, and due to this, the dark state was obtained, which corresponded to the minimum intensity in optical images. This state continued from low voltages up to 1.80 V for pure MBDA, whereas for the CSQD doped system (Mix 1 to Mix 6), the molecules favored the planar state due to its positive dielectric anisotropy and the bright state was obtained, which corresponded to the maximum intensity in optical images. This state continued from low voltage up to 1.20 V for Mix 1, 1.62 V for Mix 2, 1.52 V for Mix 3, 1.39 V for Mix 4, 1.30 V for Mix 5, and 1.23 V for Mix 6. When applied voltages were increased from the afore-mentioned values corresponding to the respective samples, transmitted light intensity reduced gradually, and finally, the minimum transmitted light intensity was observed at 20 V, which corresponded to the dark state for respective samples. Again, this happened due to the reorientation of liquid crystal molecules perpendicular to the glass electrodes (i.e., liquid crystal molecules were aligned along the direction of the applied electric field). This phenomenon is called the Freedericksz transition, which is independent of sample thickness, and the corresponding voltage is called the switching threshold voltage (Vth). Threshold voltages of the respective samples were determined from the optical micrographs. The threshold voltage at 1 kHz was shown to be 1.80 V, 1.20 V, 1.62 V, 1.52 V, 1.39 V, 1.30 V, and 1.23 V for pure MBDA and its doped system with CSQDs.

3.2. Dielectric Response and Dielectric Anisotropy

3.2.1. Field-Induced Reorientation of Liquid Crystal in QD Doped Sample

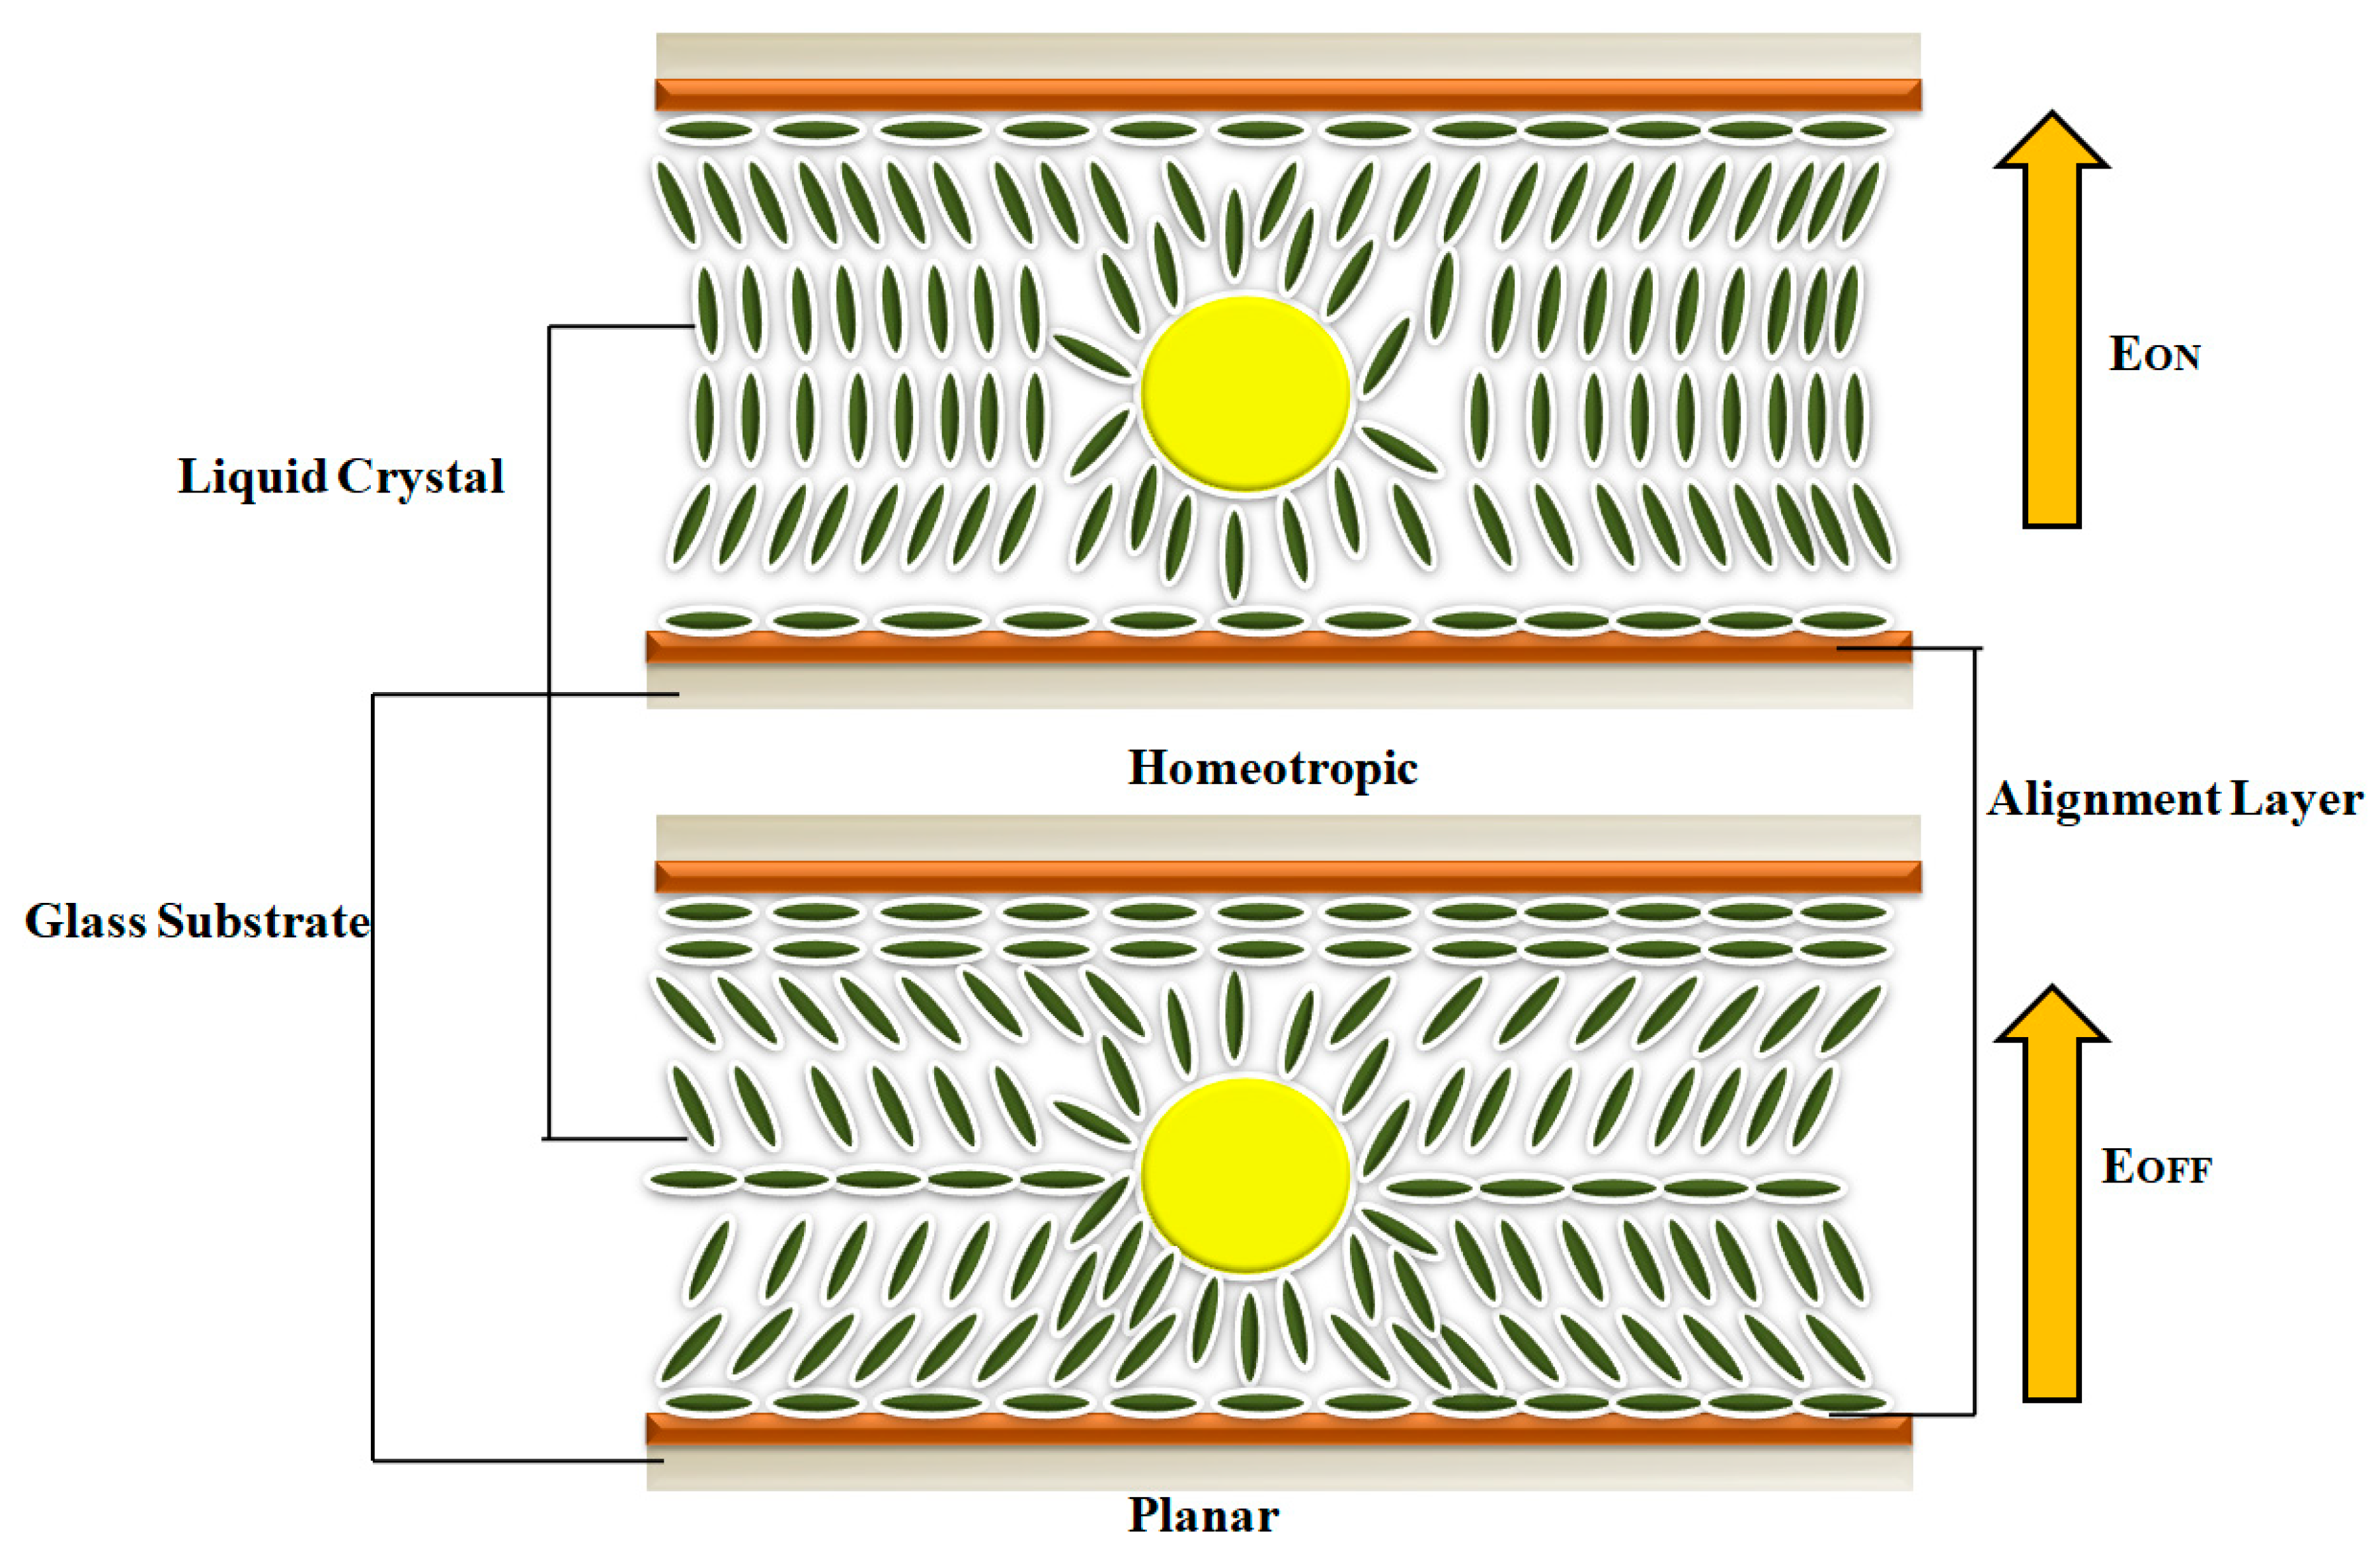
Basu and co-workers [10] proposed a different model of QD dispersion in nematic liquid crystal. According to this model, dots gather together, forming long chains around which liquid crystal molecules are homogeneously aligned. Such an alignment could not explain the decrease in the relaxation time when the field is switched on because the anchoring forces on the QD surface will slow down the molecular movement. A possible explanation for this behavior might be given considering a homeotropic alignment of the liquid crystal molecules on the QD surface [20]. Thus, if the applied field is high enough to exceed the Fréedericksz transition threshold, some of the molecules are already parallel to the field and only those placed on the horizontal sphere circumference are parallel to the cell plates, so the response time is shorter in the QD sample [20].When the field is switched off, all the molecules are distorted and their return to the original position is “helped” by the anchoring forces on the QD surface and a slight decrease in the relaxation time is observed. The schematic representation of the molecular orientation around QDs when the electric field is switched on and off has been shown in Figure 4.
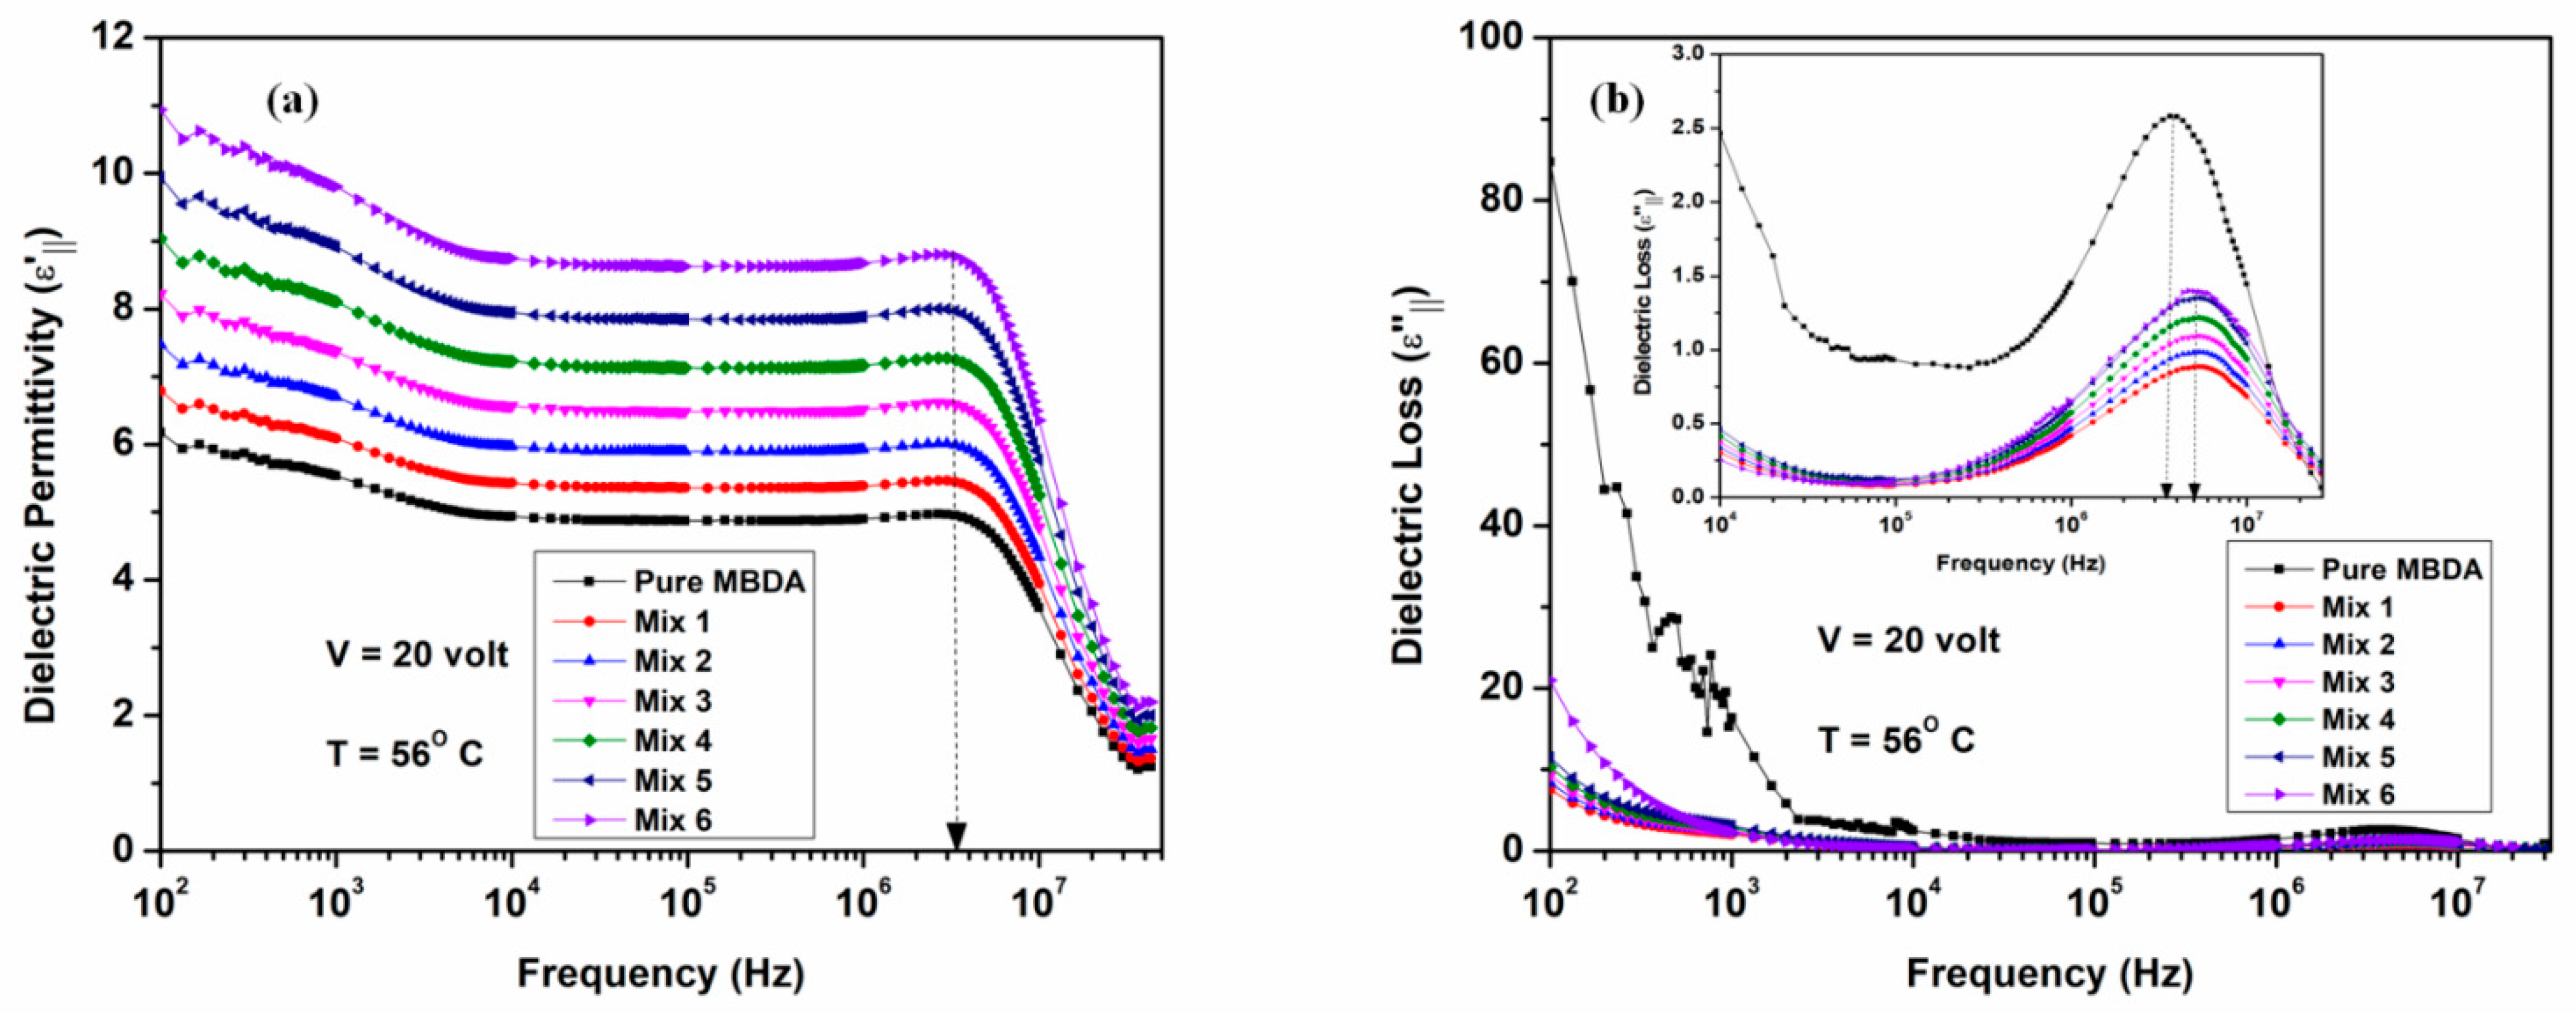
The reorientation of the liquid crystal molecules in QDs doped system takes place by applying an electric field of 1 kHz to the sandwiched cell. The liquid crystal cell goes from a planar to homeotropic orientation as the voltage exceeded the threshold value of the Freedericksz transition, as illustrated in Figure 4, Figure 5a and Figure 6a. This induces a large increase in permittivity for the liquid crystal–QD composite system (positive dielectric anisotropy) compared to the pure MBDA liquid crystal (negative dielectric anisotropy) as shown in Figure 6a. This provides evidence that QDs follow the field induced reorientation of the liquid crystal director. The opposite situation occurred for the negative dielectric anisotropy of the pure MBDA liquid crystal system. Pure MBDA liquid crystal went from a high permittivity state (without field) to a low permittivity state (with field)) as shown in Figure 5a and Figure 6a, provided in the next section of this paper. When an electric field was applied, the system transited from a homeotropic orientation to a planar orientation due to its negative dielectric anisotropy.
In an aligned nematic phase, the AC electric field produces the transverse molecular rotation (i.e., the molecular rotation about the short axis in a low frequency range) and longitudinal molecular rotation (i.e., about long axis at high frequencies) [13]. However, in the experimental window of the frequency, the relaxation mode about the long axis of the molecular rotation cannot be detected and the relaxation mode about its short axis is usually observed. In the existence of relaxation phenomenon, the dielectric constant can be explained as a complex quantity,
ε * ( ω ) = ε ( ω ) j ε ( ω )
Here, ε ( ω ) and ε ( ω ) represent the real and imaginary parts of the complex dielectric constant function ε * ( ω ) . On separating the real and imaginary parts of Equation (3) and adding the high and low frequency correction terms, we get [23],
ε = ε ( d c ) f n + ε ( ) + δ ε [ 1 + ( 2 π f τ ) ( 1 α ) sin ( α π / 2 ) ] 1 + ( 2 π f τ ) 2 ( 1 α ) + 2 ( 2 π f τ ) ( 1 α ) sin ( α π / 2 )
ε = σ ( d c ) ε 0 2 π f k + δ ε ( 2 π f τ ) ( 1 α ) cos ( α π / 2 ) 1 + ( 2 π f τ ) 2 ( 1 α G M ) + 2 ( 2 π f τ ) ( 1 α ) sin ( α π / 2 ) ) + A f m
where σ(dc) is the ionic conductance; ε0 is the free space permittivity; k is the fitting parameter; and ω is the angular frequency. The terms ε(dc)/fn and σ(dc)/ε02πfk are added in the above equation for a low frequency effect due to the electrode polarization, capacitance, and ionic conductance. The Afm term is added in the equation for a high frequency effect due to the ITO resistance and lead inductance. By the least square fitting of the above equation into the experimental data, we removed the low and high frequency errors.

3.2.2. Dielectric Response at Planar Geometry

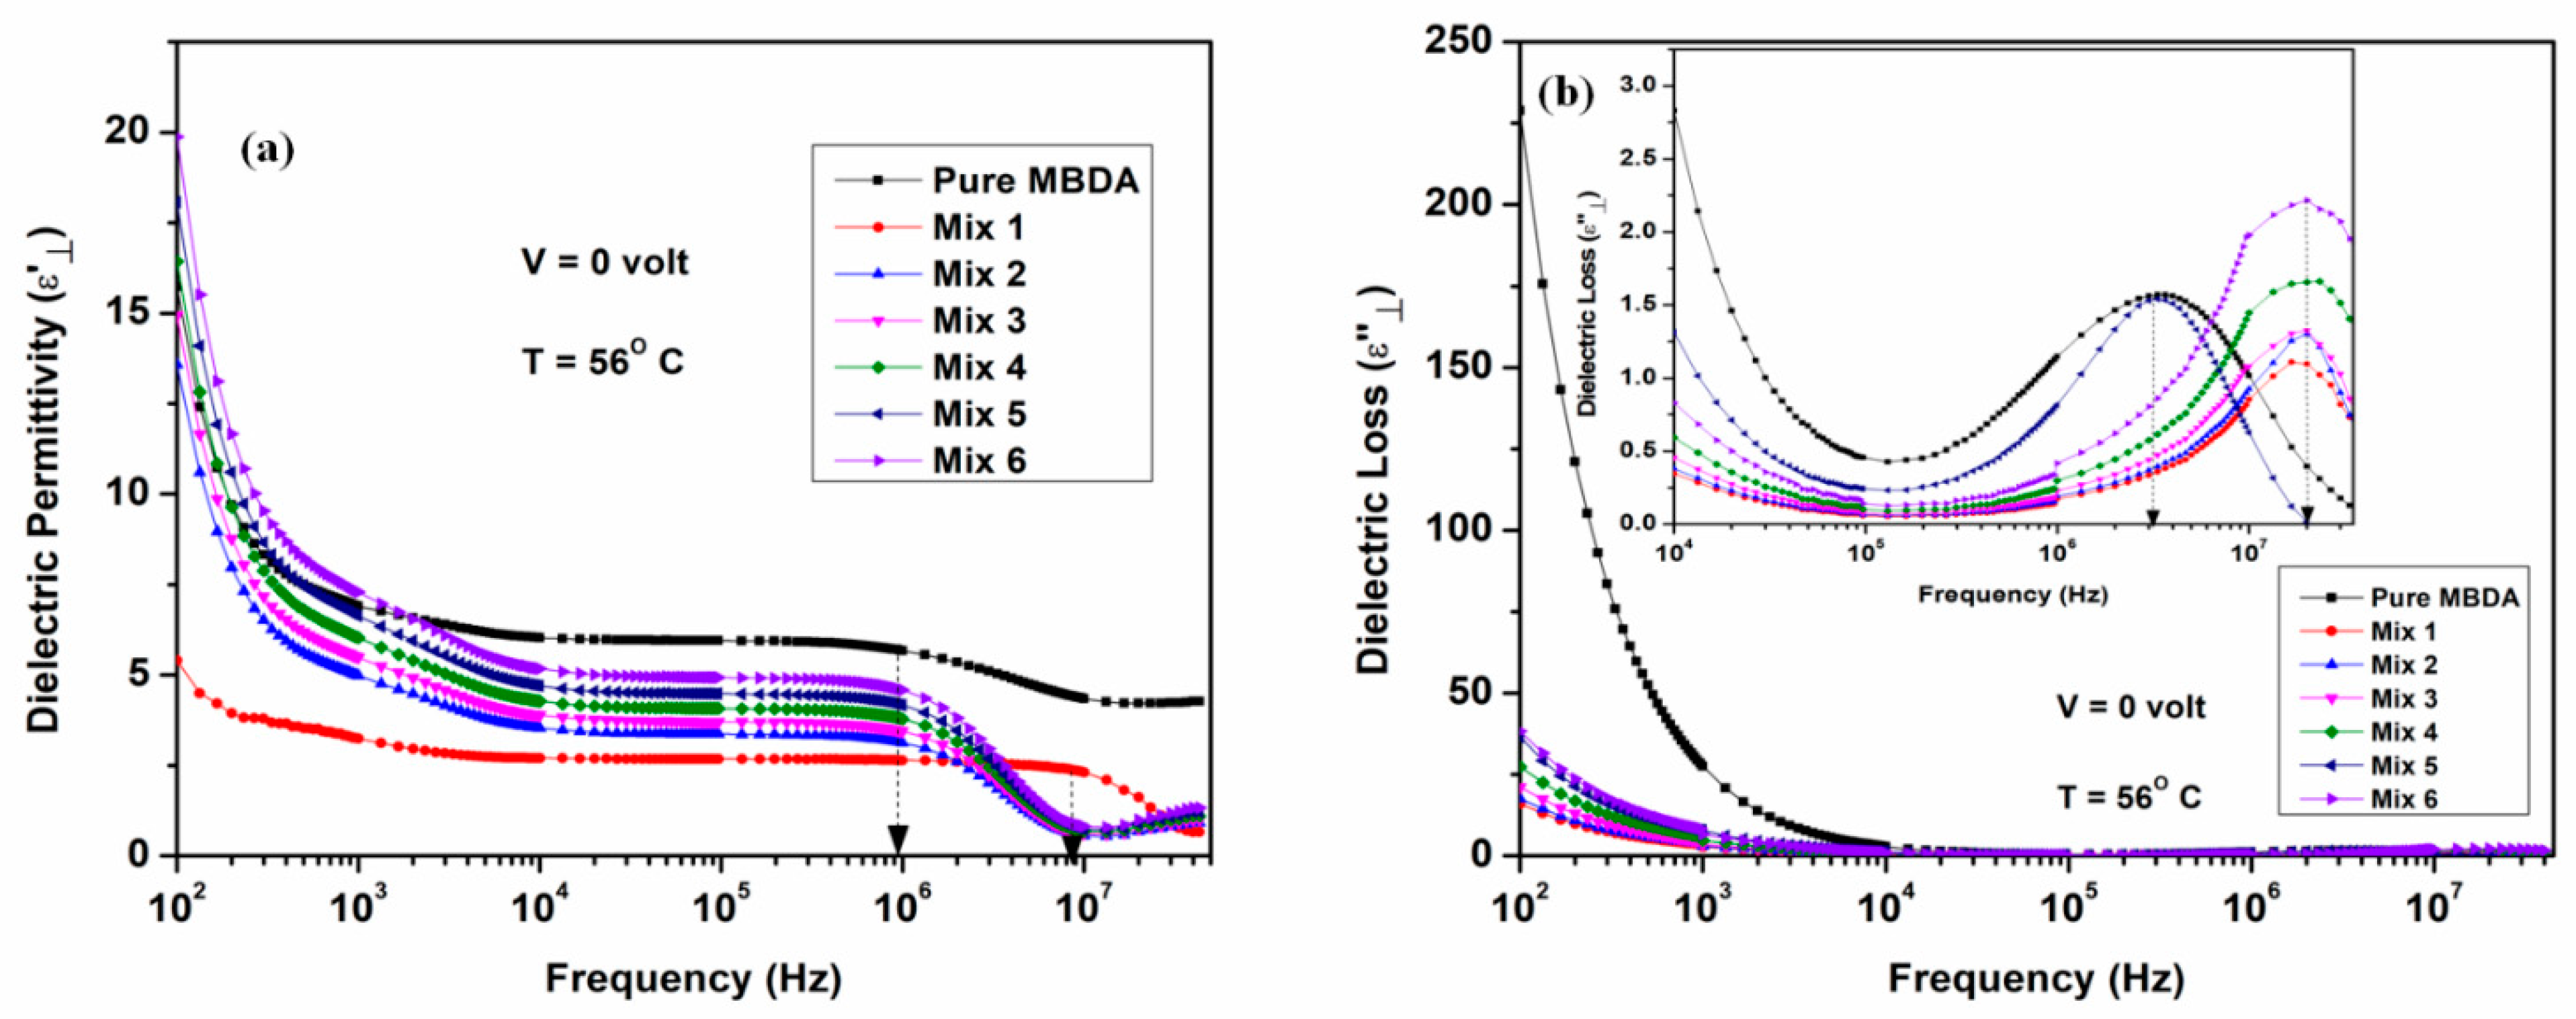
The variations of the perpendicular components of dielectric permittivity ( ε ) and dielectric loss ( ε ) of pure MBDA and CSQD doped system (Mix 1 to Mix 6) with frequency at a temperature of 56 °C for the planar orientation are shown in Figure 5a,b.
It can be seen from Figure 5a,b that for the planar orientation, both the perpendicular component of dielectric permittivity and dielectric loss depended strongly on the concentration of CSQDs in host nematic MBDA. Decrement in the magnitude of ε was observed with the increase in the concentration of CSQDs. In the frequency range of 1 kHz to 900 kHz, the ε remained almost constant for pure MBDA whereas for Mix 1 to Mix 6, ε remained constant for the frequency range of 1 kHz to 9 MHz. However, at higher frequencies, a rapid decrease in its values was observed. This can be explained on the basis of dipolar interaction [13,16] between the CSQDs and nematic MBDA molecules. It is well known that in the absence of an electric field, the dipole moments of CSQDs and nematic molecules do not align parallel to each other. The dielectric properties depend on the anchoring energy, orientation, shape, and size of the CSQD molecules. The dielectric relaxation spectra in the pure and CSQD doped system correspond to the rotation about the short molecular axes. The relaxation frequency mainly depends on the anchoring energy and orientational order parameter. It can be observed from Figure 5b that the dielectric loss was higher in the low frequency region (<10 MHz) for both the pure MBDA and CSQD doped system, and with increasing frequency the values decreased, remaining constant in the frequency regime of 10 kHz to 100 kHz and then started increasing with the maxima at relaxation frequencies. The low-frequency regime revealed the induced polarization due to the Maxwell–Wagner space charge polarization effect by the electrode and interface polarization, and above 10 MHz was dominated by the ITO sheet resistance effect [23]. The maxima of the dielectric loss spectrum in the frequency range greater than 100 kHz showed the dielectric relaxation polarization of the short axis in the nematic molecules. The relaxation phenomenon was attributed to the interaction of CSQDs and nematic MBDA molecules and it can be due to the contribution of the orientations of the nematic molecules. The relaxation frequency of pure MBDA was observed at 900 kHz and for the doped systems (Mix 1 to Mix 6) at 9 MHz. The relaxation frequency shifted toward the higher side with an increase in the concentration of CSQDs in pure MBDA. It can be stated that the relaxation process of pure and CSQD doped system (Mix 1 to Mix 6) was dominated by molecules located at the surface and in bulk regions, respectively [13]. The relaxation frequency was lower in the surface layer because the surface viscosity was greater than the bulk viscosity in the pure nematic.

3.2.3. Dielectric Response at Homeotropic Geometry

The variations of dielectric permittivity ε and dielectric loss ( ε ) with frequency for homeotropic orientation at 56 °C is shown in Figure 6a,b.
It was observed that ε increased with the concentration of CSQDs in nematic MBDA in contrast to the planar orientation discussed earlier. However, the trend remained the same in geometries, where ε remained almost constant from 1 MHz to 3.5 MHz and then decreased rapidly. The dielectric relaxation frequency of pure MBDA and CSQD doped system (Mix 1 to Mix 6) was found at 3.5 MHz. In the presence of an electric field when CSQDs are doped with nematic MBDA, the dipole moments of nematic molecules align with the dipole moments of the CSQD molecules because of the generation of the local electric field. This might be the reason for the increase in the value of ε for the doped systems (Mix 1 to Mix 6). Hence, in the CSQD doped system, there is the formation of numerous domains in the bulk region. There exists three kinds of interactions: CSQDs–CSQDs, CSQDs–nematic, and nematic–nematic in the doped systems [16]. The decrease in relaxation frequency with bias voltage was attributed to the weak anchoring strength in the homeotropic orientation, which occurred due to the reorientations of the nematic molecules. Notably, CSQD molecules share their intrinsic properties with the host MBDA due to the alignment with MBDA molecules. The fluctuations in the orientational order parameter increased the rotational viscosity, which may be responsible for the increase in the relaxation frequency without bias voltage. Although the dipole moment of the MBDA molecules and CSQDs aligned along the direction of the electric field, at the surface, the nematic molecules were not aligned in the same direction due to anchoring energy. Furthermore, at a low concentration of CSQDs (Mix 1), interaction between MBDA molecules played a considerable role but at higher concentration of CSQDs, the CSQD–CSQD interactions govern the role so the magnitude of ε increases with the concentration of CSQDs in nematic MBDA.

3.2.4. Dielectric Anisotropy and Mean Dielectric Constant

The non-uniform distribution of charges in the mesogenic molecules induces the electric dipole moment in liquid crystals, which makes an angle with the long axis of the mesogens. The overall dipole moment is then resolved into two dielectric components: one along the long axis of the mesogen ε and another perpendicular to it (i.e., ε ) [23]. The anisotropic polarizability and the geometrical shape of the liquid crystal molecules increases the vander Waals energy, and thus the axes with the largest polarizability will be aligned parallel to each other [13]. The difference in the dielectric components ( ε   and ε ) yields the dielectric anisotropy (Δε).
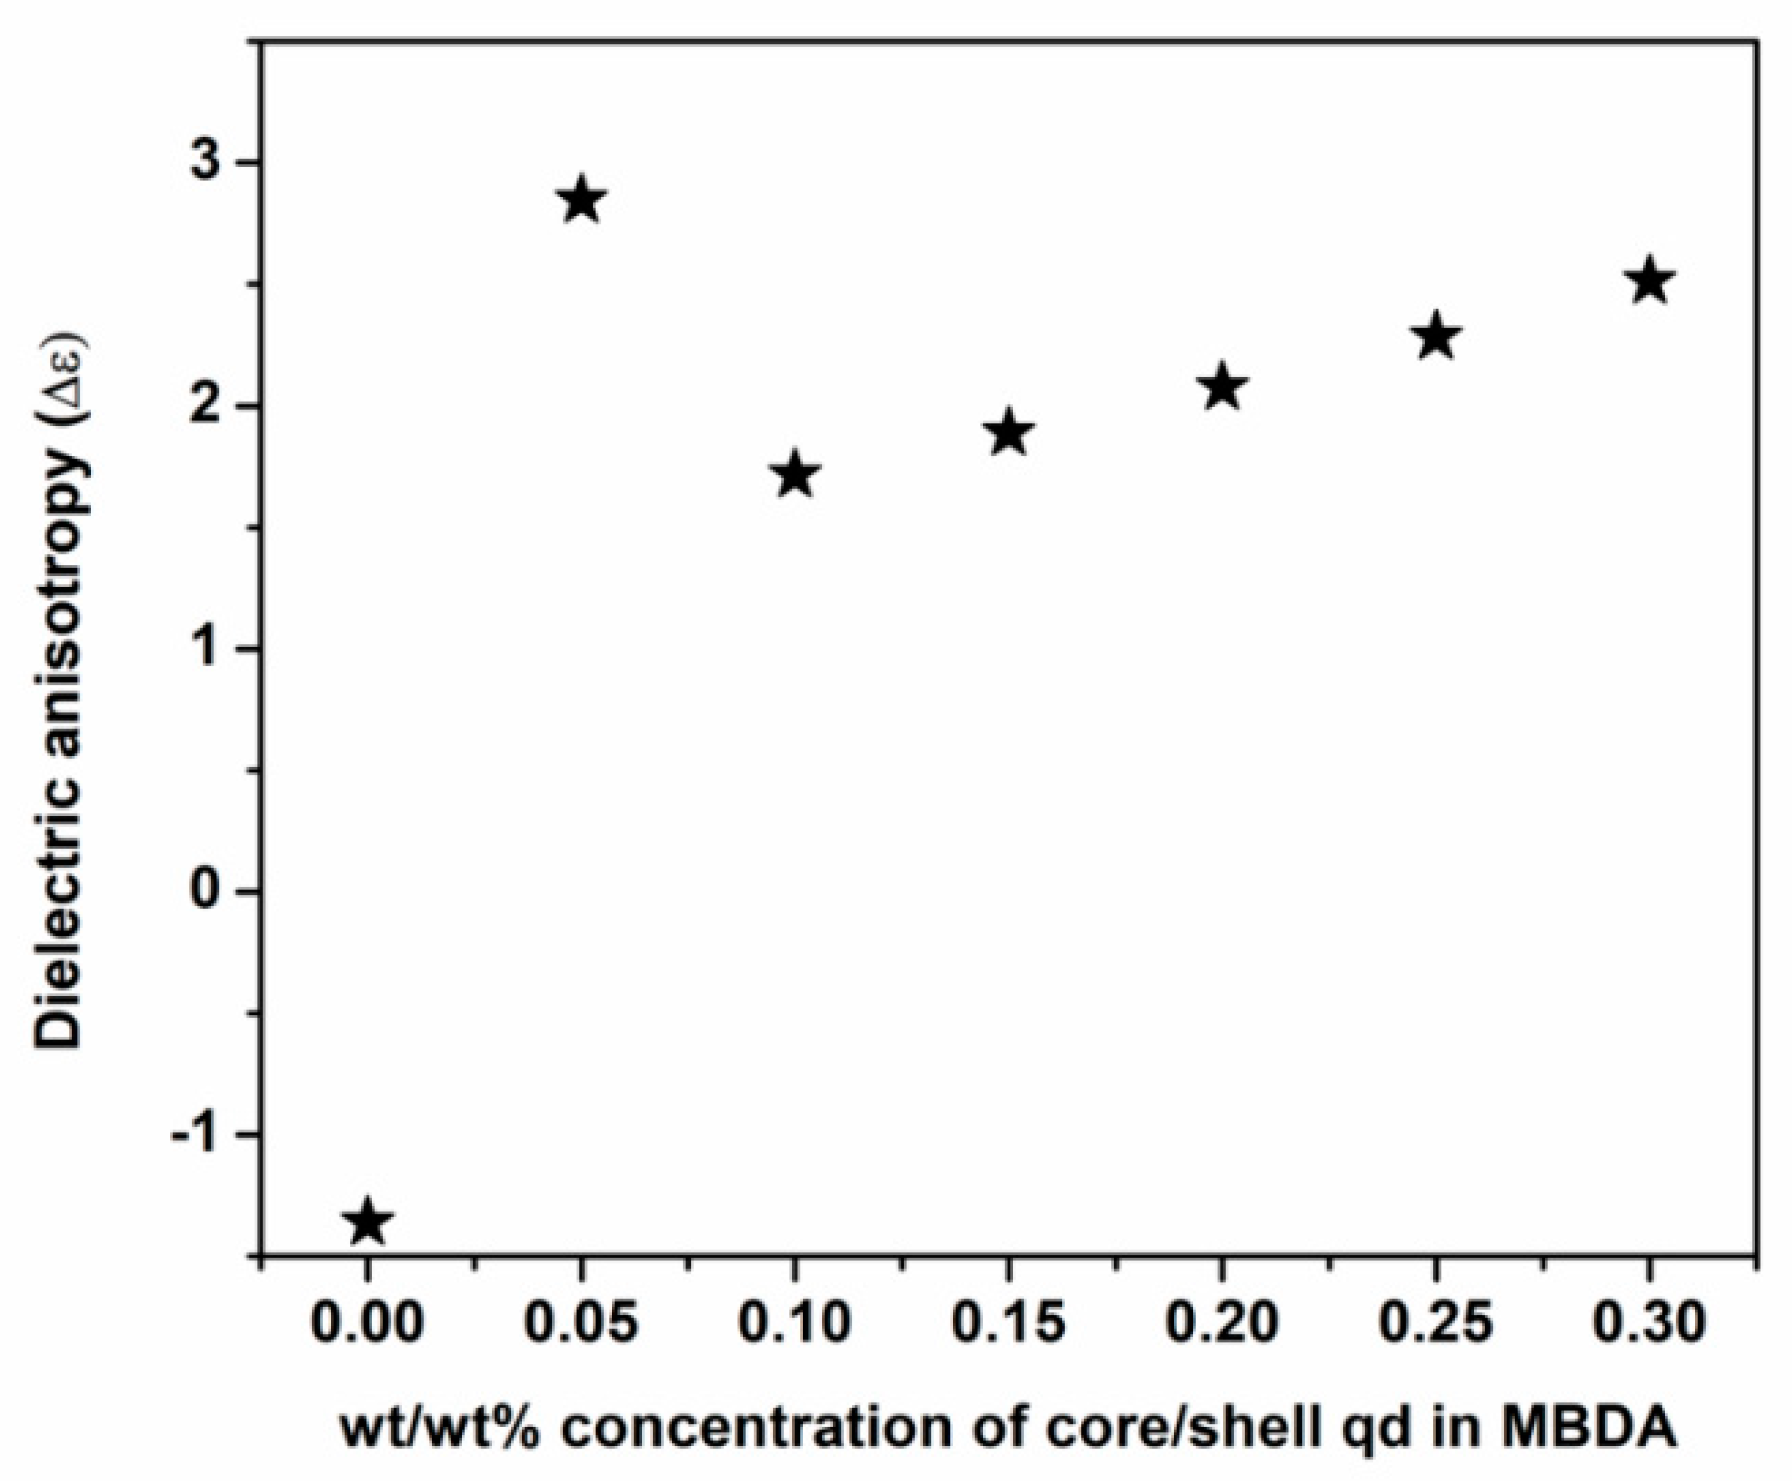
The sign of Δε can be either positive or negative according to whichever dielectric component is greater. The director reorientation in the presence of the electric field is generally associated with the value of Δε. In nematic liquid crystals, the dielectric response is determined by the molecular rotation about its short axis or long axis [16]. The measured dielectric permittivities of pure nematic MBDA and its mixture with CSQDs with the two orientations and their corresponding Δεε = ε   ε ) was found to be −1.36, 2.85, 1.72, 1.89, 2.08, 2.28, and 2.51 for pure MBDA and Mix 1 to Mix 6, at a temperature of 56 °C (Figure 7).
The increment in the magnitude of Δε was observed for the doped system compared to the pure MBDA system. The increment in Δε was attributed to the existence of strong dipolar interaction between the MBDA molecules and CSQDs and the reorientation of the MBDA molecules. The dielectric phenomenon as well as ions present in the pure nematic MBDA system contributed effectively in changing the value of Δε. The non-linear behavior of Mix 1 was found. The explanation for the observed results can be sought in the framework of Maier–Meier theory. According to Maier and Meier’s theory, the longitudinal (for homeotropic) and transverse (for homogenous) components of dielectric permittivity ε and ε are given by [23],
ε = 1 + NHF ε O { α ¯ + 2 3   Δ α S + g 1   μ 2 F 3 K b T   [ 1 ( 1 c o s 2 β ) S }
ε = 1 + NHF ε O { α ¯ + 1 3   Δ α S + g 1     μ 2 F 3 K b T   [ 1 + 1 2 ( 1 3 c o s 2 β ) S }
Δ ε = ε ε = NHF ε O [ Δ α   μ 2 F 2 K b T ( 1 3 c o s 2 β ) ] S
In the above equation, “ g 1 ” and “ g 1 ” signify the correlation factors for the homeotropic and homogenous geometrical state of LCs molecules; “F” is the feedback factor; “μ” is the resultant dipole moment; “Δα” is the anisotropic polarizability; “N” is the number density; “S” is the order parameter; “β” is the angle between the long molecular axis and dipole moment of LCs molecules; and h = 3 ε ( 0 ) ( 2 ε ( 0 ) + 1 ) is the cavity field factor. From these equations, it can be clearly seen that the dielectric anisotropy is dependent on “N”, “S”, “μ”, and “β”. Normally, it is expected that “N” decreases with the inclusion of QDs, while “S” is dependent on the shape and type of QDs used, so it may decrease or increase depending on it.
Both these dielectric components are temperature dependent. However, there is another parameter, average dielectric permittivity ε ¯ , which is known to be temperature independent [13]. The average dielectric permittivity ( ε ¯ ) of pure MBDA and its mixture with CSQDs was calculated by using the following equation [13]:
ε ¯ = 1 3   ( ε + 2 ε )
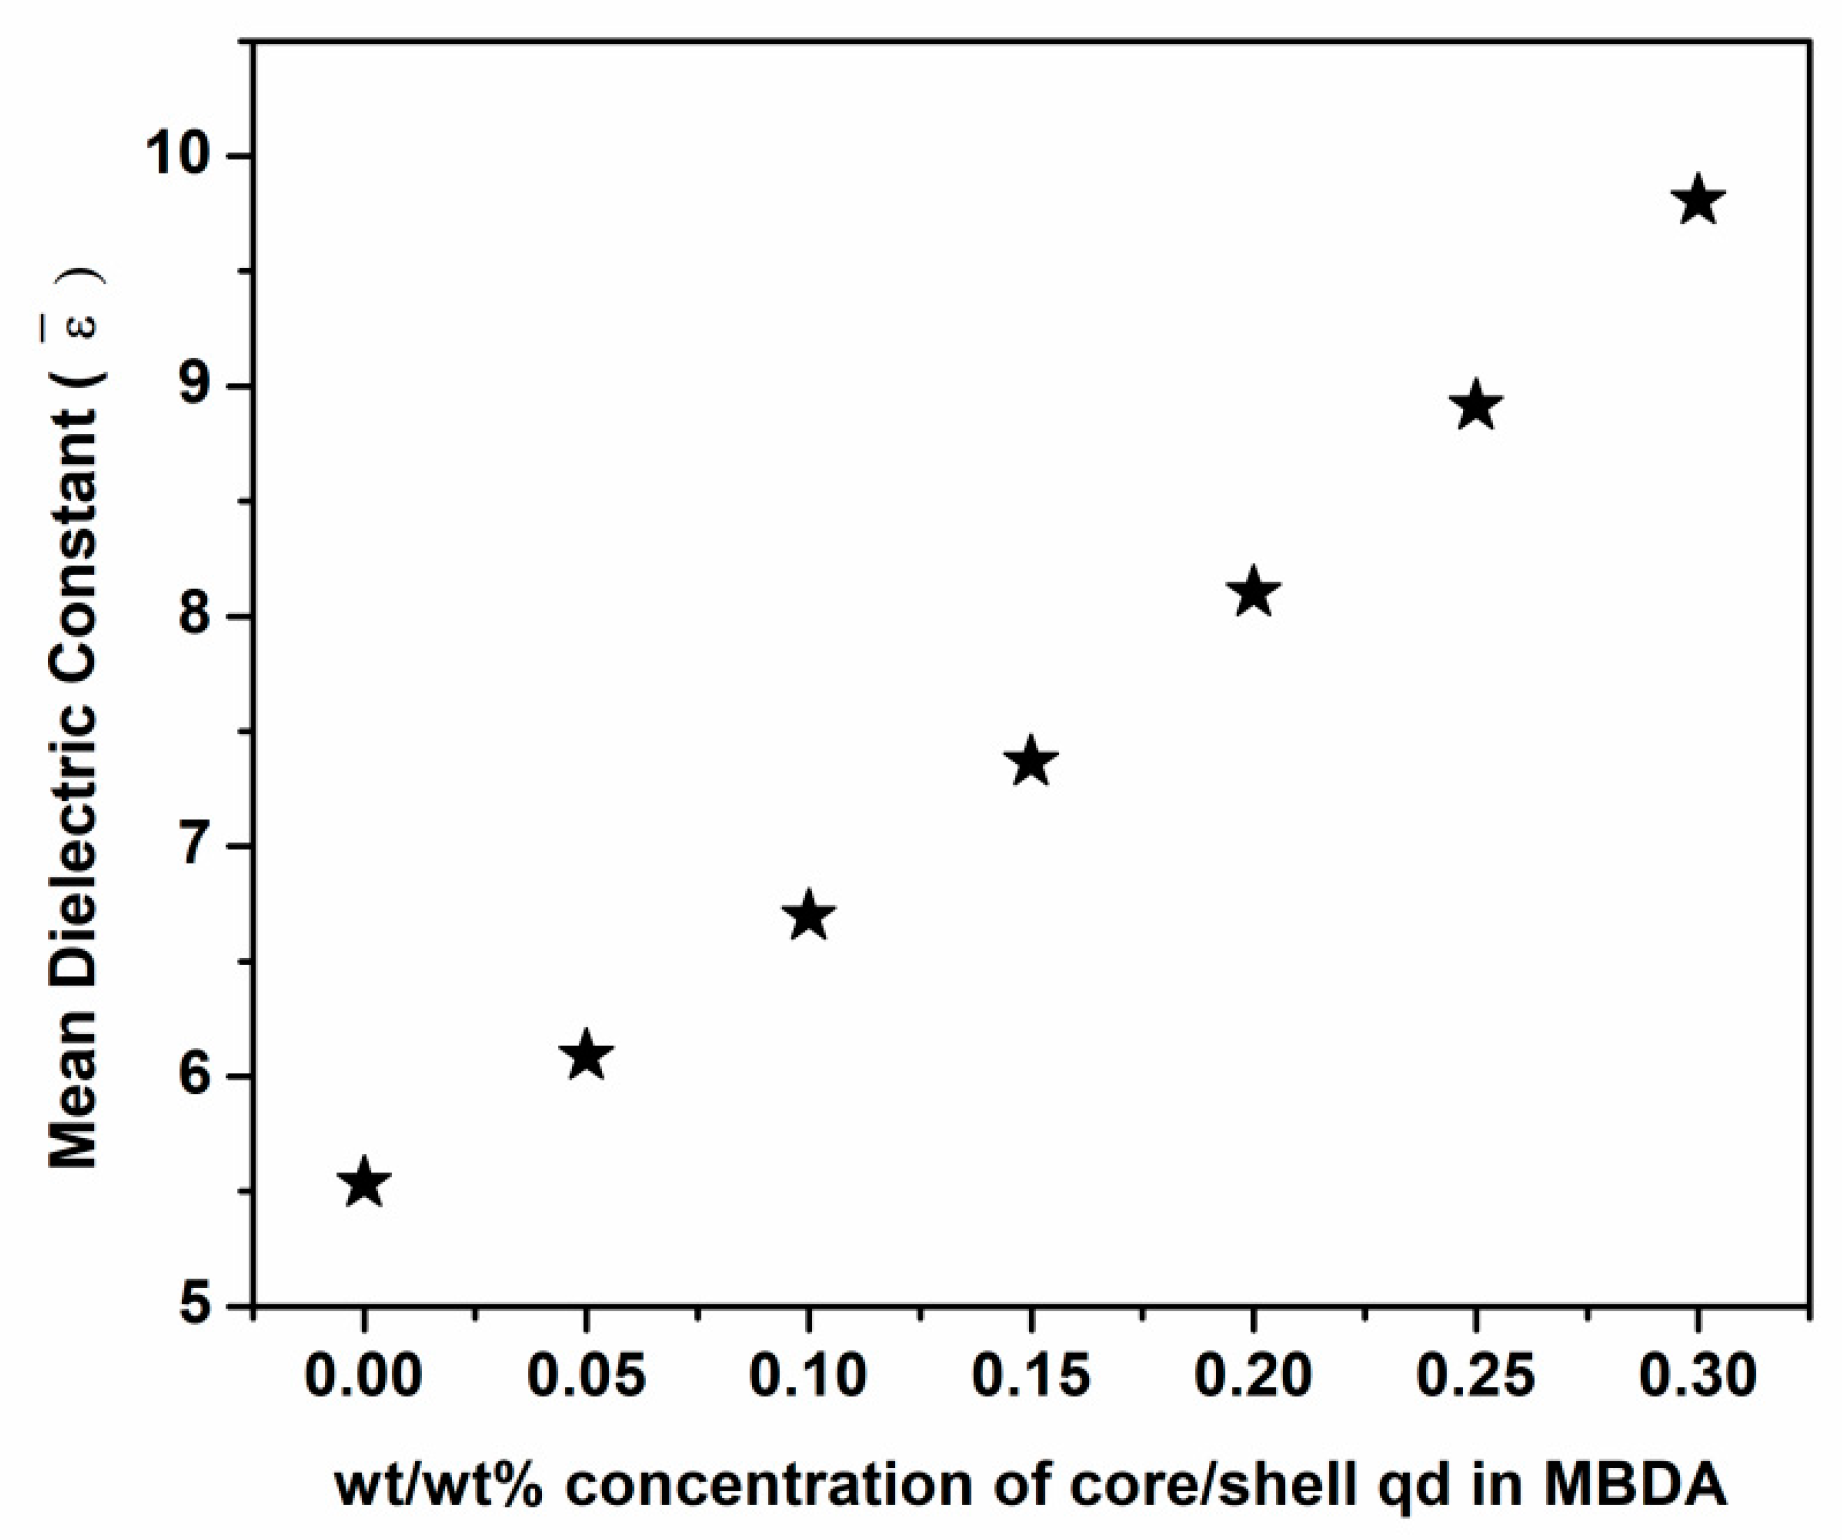
The variation of ε ¯ at a certain temperature (56 °C) for the pure MBDA and its doped system with CSQDs is shown in Figure 8.
It was observed that the average dielectric permittivity ε ¯ of pure MBDA increased with the addition of CSQDs. The systematic and consistent improvement in Δε and ε ¯ was noticed for the doped systems (Figure 7 and Figure 8). This clearly illustrates that the doping of CSQDs in pure nematic MBDA increases the orientational order of the nematic molecules. This increment has been related to the polarization coupling between pure MBDA and CSQD molecules in the presence of the electric field. The CSQD dipoles become aligned in the electric field direction and because of the polarization effect, the nematic molecules are also aligned with the CSQD dipoles. This results in the improvement in the orientational order parameter of the nematic molecules and thus increases the dielectric permittivity ε .

3.3. Electro-Optical Parameters

Nematic liquid crystals and their composites are widely used in various electro-optical devices. One of the main drawbacks of such devices is that they have a long switching off time. It refers to the time required by the system to get back to its equilibrium state after turning off the field. When the field is taken away, the relaxation of the liquid crystal molecule is only driven by elastic torque. The elastic torque depends on the viscosity of the liquid crystal matrix, and it is a slow process, which makes the off time very long. Research is ongoing to cut down the switching off time. For example, the dual frequency nematic liquid crystals showed a positive dielectric anisotropy at a lower frequency and a negative dielectric anisotropy at a high frequency. The limitation of this system is that the crossover frequency was found to be much larger for the negative dielectric anisotropy systems compared to the positive one. Another concern is that at high frequencies, power consumption is very high, which shifts the cross over frequency. Thus, it is desirable to operate the device in a moderate frequency range (for example, below 50 kHz) and to use those nematic liquid crystals as the switching material, which has a low crossover frequency (i.e., 1 kHz). From the molecular point of view, positive liquid crystals consist of large and long molecules with a longitudinal dipole moment, whereas negative liquid crystals consist of small molecules with transverse dipole moment.
In the present work, it was demonstrated that the addition of the dopant in pure MBDA liquid crystal can switch the dielectric anisotropy from negative to positive. This is an alternative and effective way for dual frequency driven nematic liquid crystal systems in which the switching of dielectric anisotropy was dependent on crossover frequency (frequency below crossover exhibits positive Δε and above crossover, it exhibited negative Δε), however, in the present work, a concentration driven switching in the liquid crystal–QD doped system at a 1 kHz frequency was reported. At this frequency, the ionic impurities are suppressed and power consumption is also low. The pure MBDA liquid crystal system was initially in the homeotropic orientation (with no field). For an applied electric field (above the Freedericksz threshold), the molecules switch from the homeotropic to planar state. On the other hand, CSQD doped composite systems (without field) were initially in the planar state because the doped system had more molecules with a large contribution to the longitudinal dipole moment than the transverse one, as shown in Figure 5a and Figure 6a. With the applied electric field, the system experienced a torque of ΔεE2, which oriented the liquid crystal molecules along the field direction. As the value of the parallel component of permittivity is high for liquid crystal–QD doped systems, the system reached a high permittivity state by loosely connected dopant networks. For pure MBDA liquid crystal, the system was in a negative dielectric state and the liquid crystal molecules were oriented parallel to the electrodes. In this case, the system showed a low value of parallel component of permittivity, as shown in Figure 6a. Hence, a faster switching is achieved by the addition of the dopant to the pure liquid crystal system.
Temperature dependent on time, off time, total electro–optic response time, and rotational viscosity at 1 kHz frequency, 20 volt bias are shown in Figure 9a–d.
It was observed that these electro-optical parameters decrease with an increase in temperature due to the increase in the kinetic energy of the system with a rise in temperature. Figure 9a–d shows that on time, off time, total response time, and rotational viscosity followed a similar trend, with the fastest response time observed for Mix 1. The increase in the concentration of CSQDs in MBDA (Mix 2 to Mix 6) resulted in a decrease in the response time in comparison to pure MBDA (Figure 9a–c). This has been attributed to the reduced rotational viscosity observed for these mixtures with increasing concentration, as shown in Figure 9d.
Both on and off times (Figure 9a,b) and total electro-optic response time τtotal (Figure 9c) decreased with an increase in the concentration of CSQDs with the fastest response observed for Mix 1. It is expected that the reason for this behavior is associated with the increase in Δε and the suppression of the screening effect. The accumulation of ionic charges on the substrate surfaces creates an induced electric field, which reduces the effective field exerted on the liquid crystal layers. Therefore, the response time of pure MBDA liquid crystal required for the display increased due to the screening effect [12,16]. In CSQD doped MBDA samples, the CSQDs can trap ionic impurities, which results in fewer ions adsorbed on the substrate surfaces, thus abating the screening effect. The 0.05 wt% (Mix 1) of CSQDs was found to be the optimized dopant concentration in a nematic medium from an application point of view. As discussed earlier, there are three kinds of molecular interaction governing the behavior of doped samples. Out of these interactions, Mix 1 (i.e., mixture with low concentration of CSQDs) possessed the dominating role of nematic–CSQDs interaction, thus had a faster response time. On time is a purely electric field driven process and is given by the following relation [24]:
τ O N = γ d 2 ε o Δ ε   ( V 2 V t h 2 )
Here, the symbols have the usual meaning: τon is on time; V is the applied voltage; V t h is the threshold voltage; γ is the rotational viscosity; and d is the thickness of the sample cell. Fall time or off time τoff of the director depends on the rotational viscosity and anchoring energy (K), given as:
τ o f f = γ d 2 K · π 2
τ t o t a l = τ o n + τ o f f
The rotational viscosity (Figure 9d) represents the internal friction among nematic molecules during their rotation motion, which is an important characteristic that affects the field-induced switching behavior of the nematics [24]. It mainly depends on the anchoring energy and off time. The combined influence of optical, magnetic, and electrical properties in multifunctional CSQDs produces the significant change in pure MBDA nematic liquid crystal. Therefore, doping of multifunctional CSQDs can improve the electrical conductivity and hence decrease the rotational viscosity of pure nematic MBDA. On the other hand, the formation of a self-assembled chain of CSQDs along the mesogenic director in the nematic liquid crystal cell and their agglomeration in the nematic phase provides a new path to facilitate the charge transportation in the nematic cell. This leads to decreased rotational viscosity in the nematic medium. A noteworthy point that should be of concern is the existence of ionic impurities in the nematic medium that can limit the charge transportation and therefore increase the rotational viscosity of the nematic medium. The incorporation of CSQDs in the nematic medium results in the adsorption of ionic impurities by the CSQDs, which causes a reduction in the ionic density and the resistance of the nematic medium. Consequently, the rotational viscosity of a CSQD doped MBDA system is reduced with a faster response observed for the doped system. In the presence of applied bias, induced dipole moments of the CSQDs can proficiently trap the ionic impurities in the nematic host, leading to a decrease in the rotational viscosity. On the other hand, the CSQDs themselves act as external additives in the nematic host, which can increase the rotational viscosity when the concentration of CSQDs is too low (below 0.05%). The reason associated with this behavior is that the too low concentration of CSQDs cannot efficiently trap the ionic impurities present in the nematic medium, therefore the ionic impact dominates over its reduction.
In the present work, the birefringence was calculated from the given relation [24]:
Δ φ = ( m + 1 ) π 2 sin 1 I I min I max I min   m =   1 ,   3 ,   5 ,   7
Δ φ = m π + 2 sin 1 I I min I max I min   m = 0 ,   2 ,   4
Here, m is the maximum number of peaks observed in intensity versus voltage graph; I is the voltage dependent intensity values; Imax and Imin are the maximum and minimum intensities; and λ is the wavelength and phase retardation (ΔΦ). During the measurement of optical transmission, the sample cells were adjusted between crossed polarizers at a 45° angle with the optic axis of incident light. The voltage dependent intensity values were measured at 56 °C by applying the sine wave of frequency 1 kHz, as shown in Figure 10. The liquid crystal birefringence at wavelength “λ” can be obtained by measuring phase retardation from the following equation.
Δ n = [ λ 2 × π × d ] × Δ ϕ
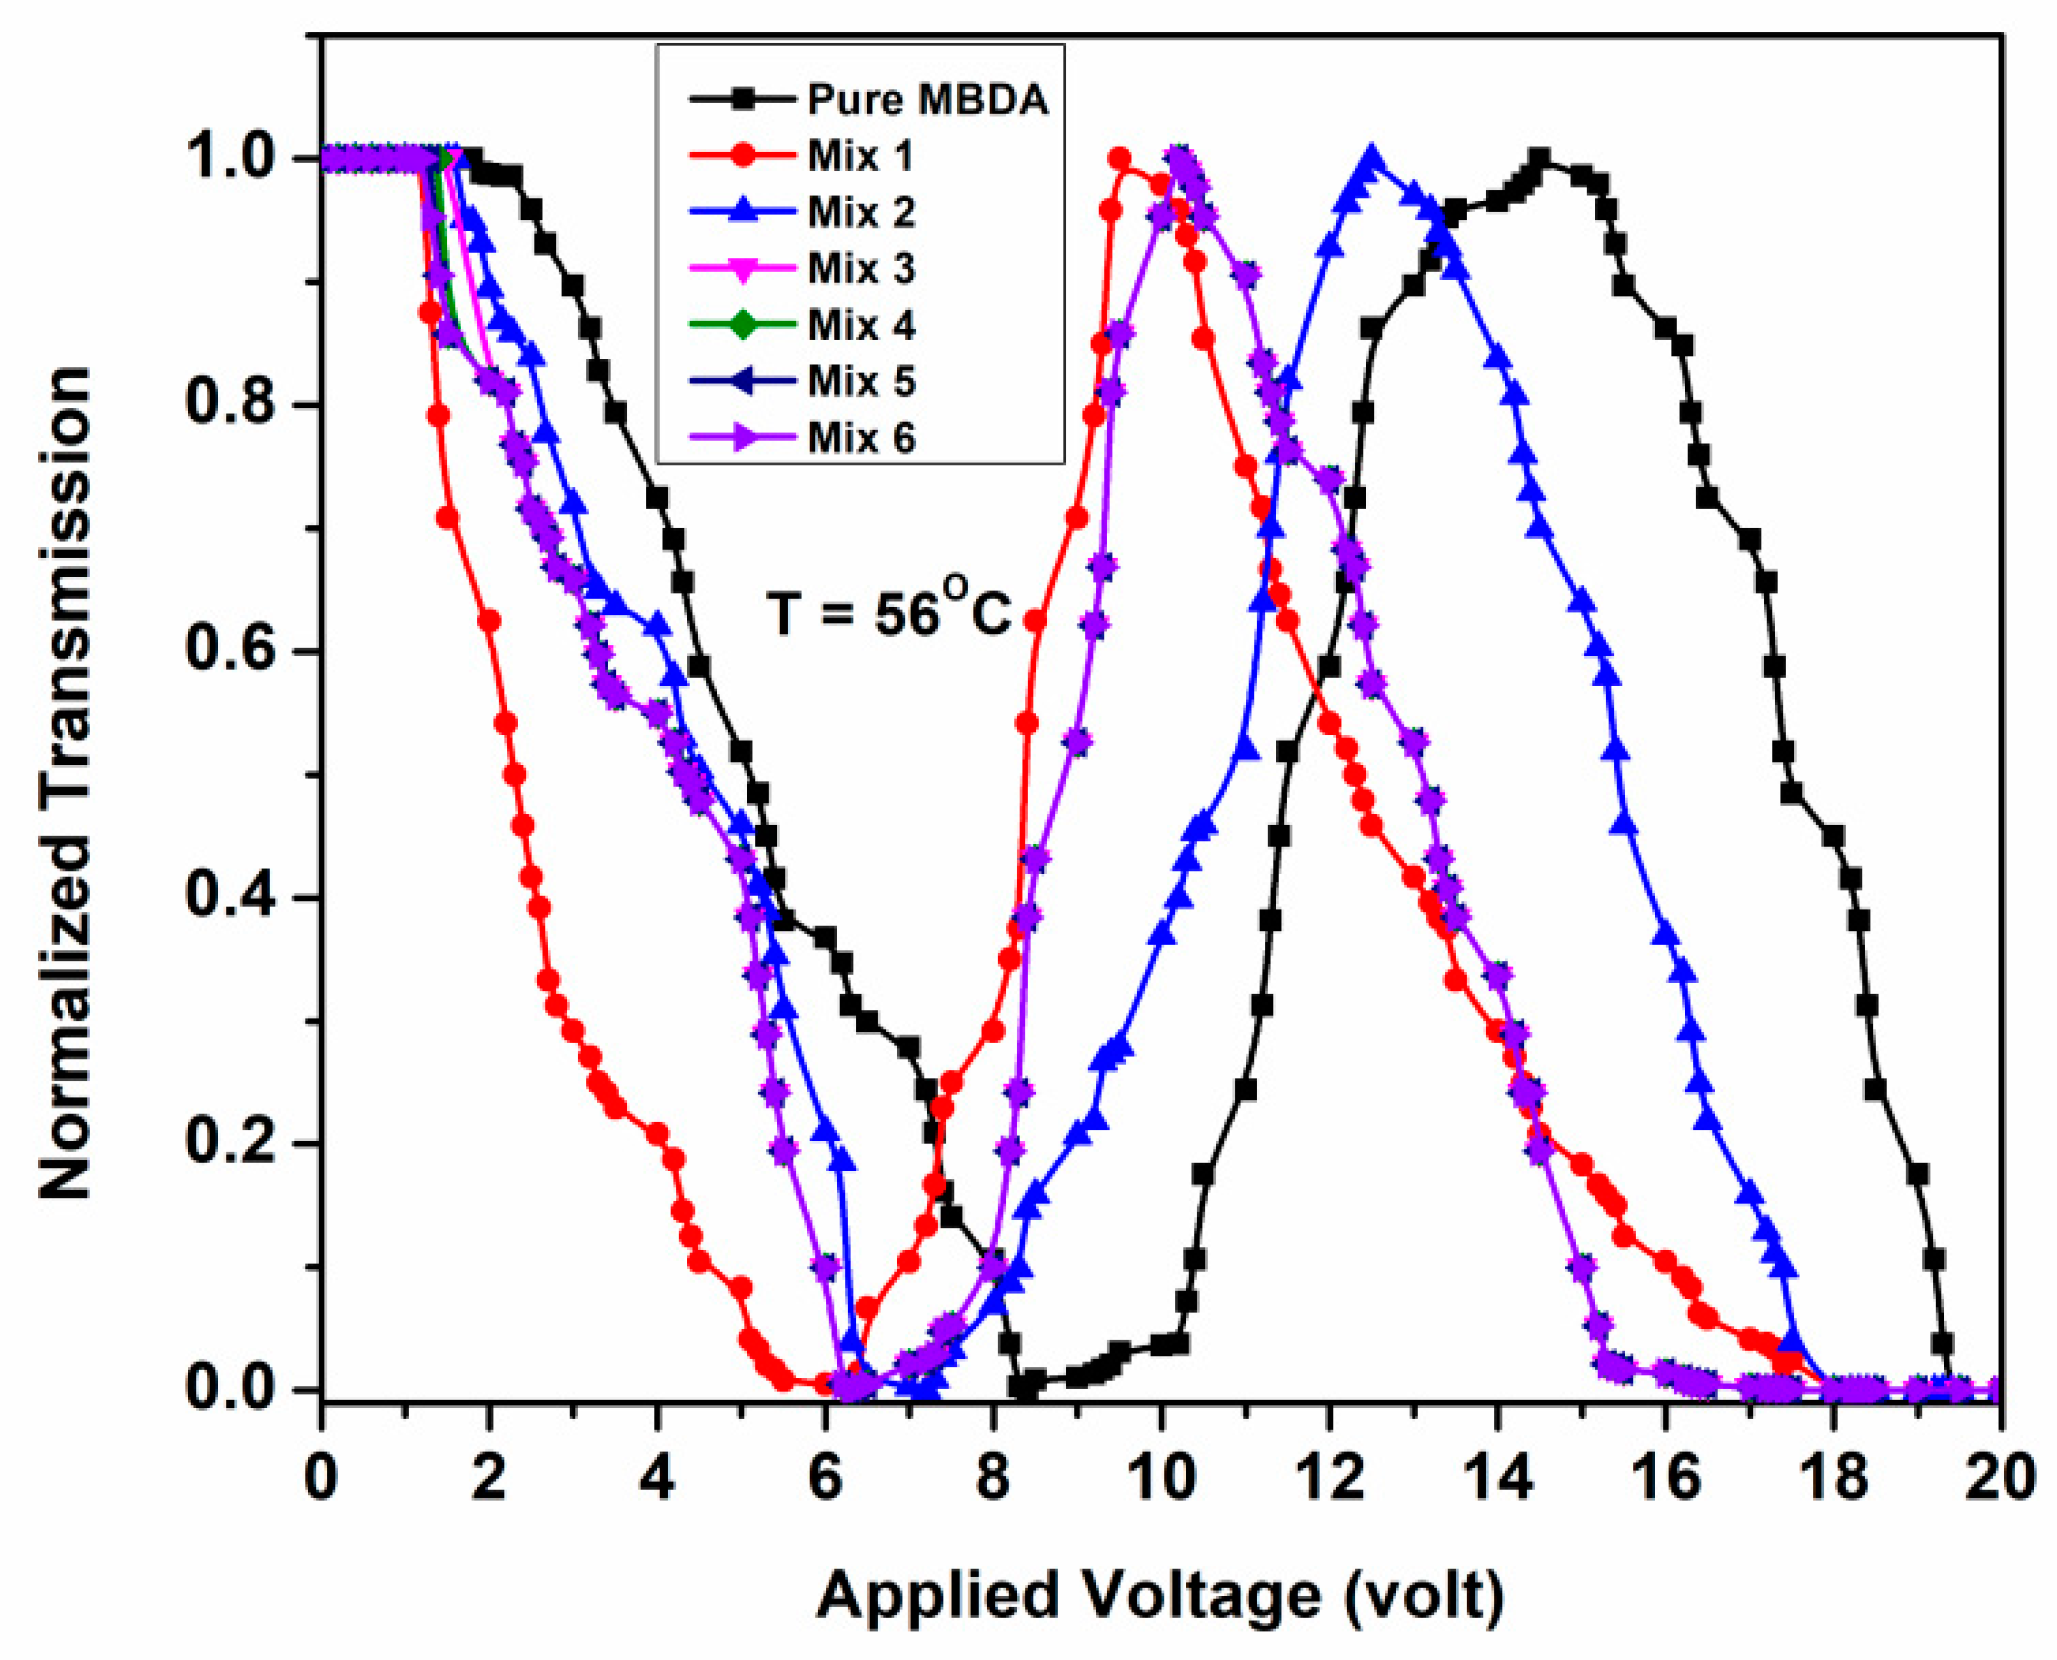
The transmittance at different voltages at fixed temperature was measured by a digital oscilloscope connected to a photo detector. Voltage–Transmission (V–T) plot of the pure MBDA and its mixture with CSQDs in the nematic phase at 56 °C is shown in Figure 10.
The curve clearly shows the oscillatory nature with maxima in the V–T plot approximately equal to Δn.d/λ. This can be confirmed by substituting the corresponding values of birefringence “Δn”, thickness “d”, and wavelength “λ”. In addition to this, it has also been noticed that the output intensity remained constant in a low voltage range up to 0–1.80 V, 0–1.20 V, 0–1.62 V, 0–1.52 V, 0–1.39 V, 0–1.30 V, and 0–1.23 V for pure MBDA, Mix 1 to Mix 6, respectively, as depicted in the V–T graph in Figure 10. Thereafter, a remarkable decrease in transmitted intensity was observed beyond this low voltage range. The threshold voltages as obtained from the V–T plot were 1.80 V, 1.20 V, 1.62 V, 1.52 V, 1.39 V, 1.30 V, and 1.23 V, respectively. The change in threshold voltage for the corresponding mixtures is indicative of the change in the retardation and birefringence of pure MBDA at high voltage. Now, as the voltage increases, the transmission begins to vary and exhibits maximum and minimum peaks that are related to an odd or an even integer of Equations (8) and (9). Initially, in low voltage range less than 1 V, the liquid crystal molecules are parallel to substrates and exhibit maximum transmittance. However, beyond 1 V, the molecular orientation began to change from the parallel to perpendicular state and finally displayed a very low transmittance. V–T curve for the mixtures shifted to a lower voltage side, which implies a lower operating voltage for the mixtures compared to the pure MBDA.
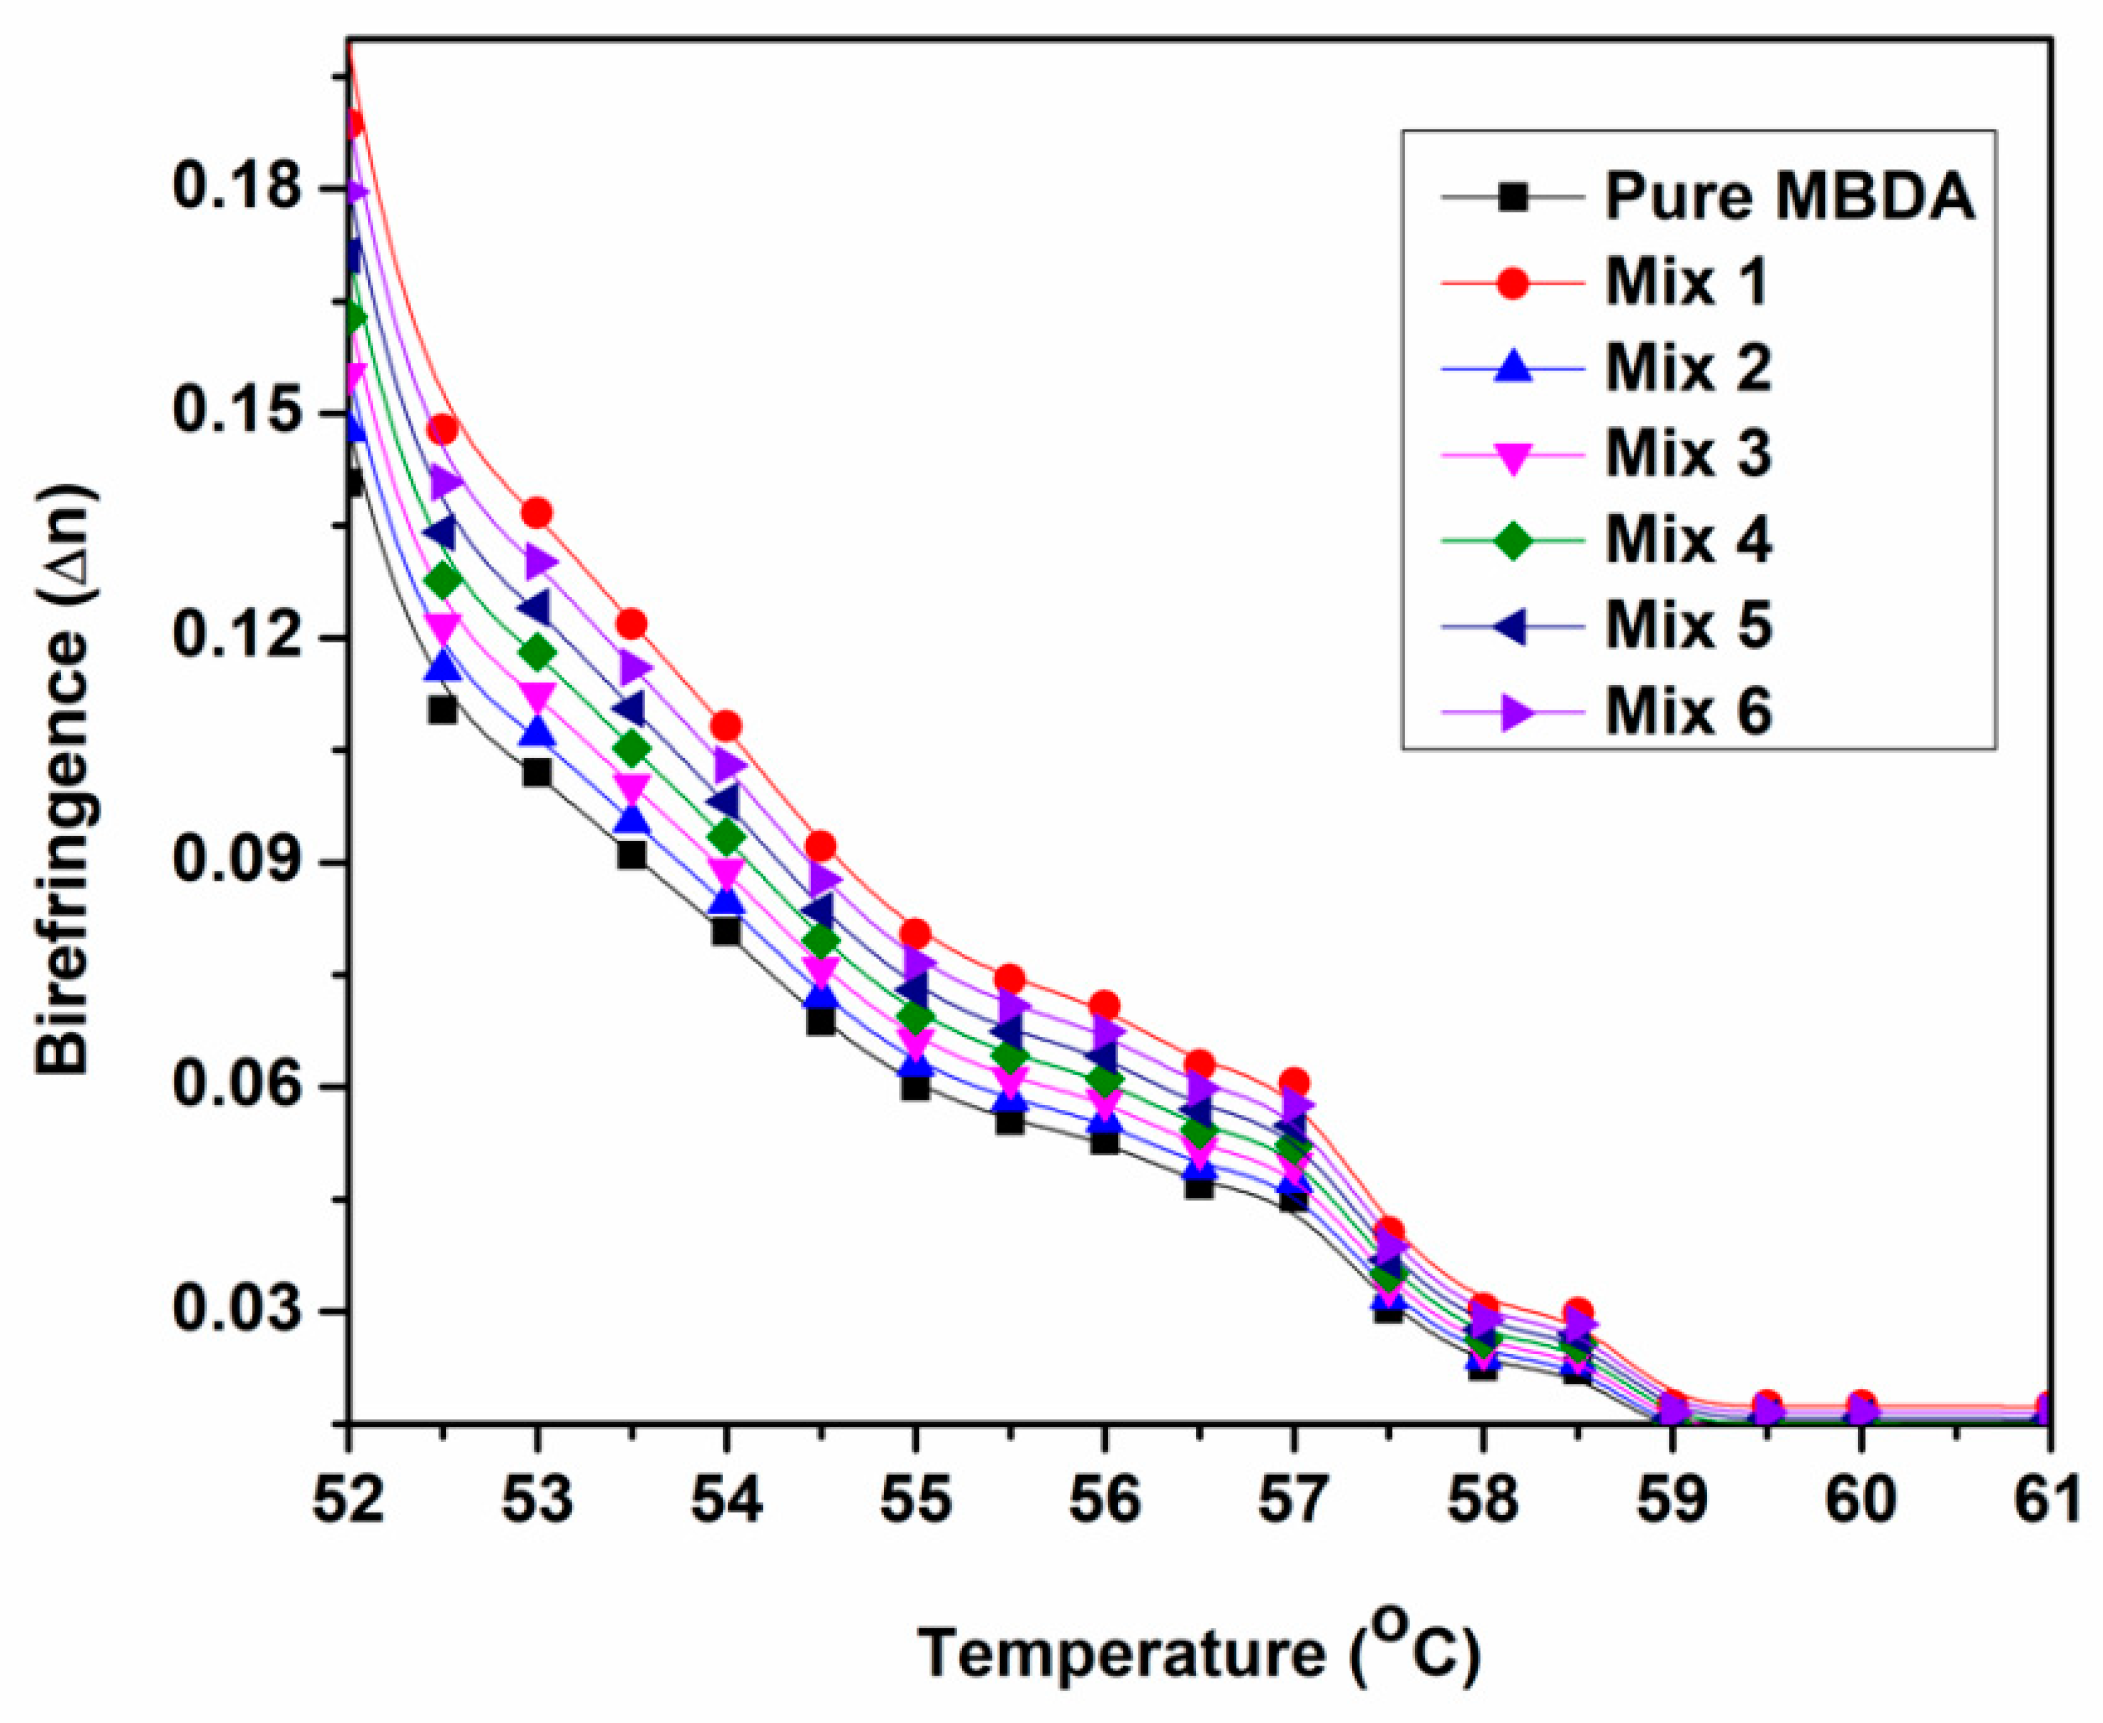
Temperature dependent birefringence for pure MBDA and its doped system with CSQDs (Mix 1 to Mix 6) at 20 volt, 1 kHz frequency input signal is shown in Figure 11.
It has been observed from Figure 11 that the birefringence increased with an increase in concentration of CSQDs in MBDA and Mix 1 exhibited the maximum birefringence. The improved molecular alignment and orientational order were responsible for the maximum birefringence observed in Mix 1, which is evident from the texture and dielectric studies discussed earlier. The increase in Δε with an increase in concentration of CSQDs improved the molecular ordering in the doped systems, which consequently produced the phase difference between extraordinary and ordinary light rays. Thus, the birefringence of the pure and doped system is given as:
Δn = neno
Here, ne and no are the refractive indices of extraordinary and ordinary rays, respectively. The schematic illustration of the optical model of birefringence has been depicted by Gupta et al. [11].

4. Conclusions

In this work, we investigated the effects of luminescent Cd1−xZnxS/ZnS core/shell QDs on the dielectric and electro-optical properties of nematic MBDA liquid crystal. The analysis of dielectric spectra in the presence of bias voltage indicated that doping a nematic host with CSQDs significantly increases the dielectric permittivity of the nematic liquid crystal, whereas without bias voltage, the dielectric permittivity decreased with the concentration of CSQDs in MBDA. The presence of CSQDs affected the molecular ordering as well as influenced the dielectric parameters significantly. These changes can be attributed to the change in the overall dipole moment of the pure and doped systems. The frequency dependent dielectric loss spectra indicate the shift in relaxation frequency with and without bias, which is explained on the basis of effective interaction between the nematic and CSQD molecules. The ionic impurity decreased with the addition of CSQDs. These effects are attributed to the ionic harvest effect of the CSQDs. The effect of CSQDs on the dielectric and electro-optical properties such as dielectric anisotropy, rotational viscosity, field-on and field-off response time was also studied. The results showed that the dielectric anisotropy increased with an increase in the CSQD concentration and was found to be the maximum for Mix 1 due to the formation of 1D arrays of CSQDs along the nematic director and the increased order parameter in the bulk nematic liquid crystal. Furthermore, the rotational viscosity was strictly dependent on the anchoring energy and field-off time and it decreased with the addition of CSQDs in MBDA. The enhanced birefringence of the doped system was attributed to its improved alignment. This has been attributed to an increase in dielectric anisotropy and the suppression of the screening effect. The dispersion of nano-dopant or CSQDs can increase birefringence and hence the index. Therefore, this work becomes important for LC grating and TIR waveguide display society as well.

Author Contributions

A.R.: Conceptualization, Methodology, Validation, Data curation, Resources, Writing—original draft, Writing—review & editing. F.P.: Conceptualization, Methodology, Validation, Data curation, Writing—original draft, review & editing. R.M.: Conceptualization, Validation, Methodology, Resources, Writing—review & editing. S.S.: Conceptualization, Validation, Methodology, Resources, Writing—review & editing. All authors have read and agreed to the published version of the manuscript.

Funding

This research was funded by University grant commission UGC (F-25-1/2014-15(BSR)/ 7-177/2007/BSR) New Delhi for the UGC-BSR Fellowship and UGC for the grant of a MID Career Award dated 22 March 2018 (No.F.19-224/2018 (BSR). The APC charges were funded by MDPI.

Data Availability Statement

The study did not report any data.

Acknowledgments

Ayushi Rastogi is thankful to UGC (F-25-1/2014-15(BSR)/7-177/2007/BSR) New Delhi for the UGC-BSR Fellowship. Author Rajiv Manohar acknowledges UGC for the grant of a MID Career Award dated 22 March 2018 (No.F.19-224/2018 (BSR)). The authors are thankful to the Center of Excellence at APJ Abdul Kalam Center for Innovation, University of Lucknow and Poonam Tandon, Department of Physics, University of Lucknow, Lucknow for providing the Gaussian software for the optimized molecular structure. We also acknowledge Shailja Mahamuni, Department of Physics, University of Pune for providing the Cd1−xZnxS/ZnS core/shell QDs.

Conflicts of Interest

All authors declare no conflict of interest.

References

  1. Chen, Y.; Peng, F.; Yamaguchi, T.; Song, X.; Wu, S.-T. High Performance Negative Dielectric Anisotropy Liquid Crystals for Display Applications. Crystals 2013, 3, 483–503. [Google Scholar]
  2. Kirsch, P.; Heckmeier, M.; Tarumi, K. Design and synthesis of nematic liquid crystals with negative dielectric anisotropy. Liq. Cryst. 1999, 26, 449–452. [Google Scholar] [CrossRef]
  3. Kirsch, P.; Reiffenrath, V.; Bremer, M. Nematic liquid crystals with negative dielectric anisotropy: Molecular design and synthesis. Synlett 1999, 1999, 389–396. [Google Scholar] [CrossRef]
  4. Hird, M.; Goodby, J.W.; Toyne, K.J. Nematic materials with negative dielectric anisotropy for display applications. Proc. SPIE 2000, 3955, 15–23. [Google Scholar]
  5. Ge, Z.; Zhu, X.; Wu, T.X.; Wu, S.T. High transmittance in-plane switching liquid crystal displays. J. Disp. Technol. 2006, 2, 114–120. [Google Scholar] [CrossRef]
  6. Chen, Y.; Luo, Z.; Peng, F.; Wu, S.T. Fringe-field switching with a negative dielectric anisotropy liquid crystal. J. Disp. Technol. 2013, 9, 74–77. [Google Scholar] [CrossRef] [Green Version]
  7. Kahn, F.J. Electric-field-induced orientational deformation of nematic liquid-crystals: Tunable birefringence. Appl. Phys. Lett. 1972, 20, 199–201. [Google Scholar] [CrossRef]
  8. Takeda, A.; Kataoka, S.; Sasaki, T.; Chida, H.; Tsuda, H.; Ohmuro, K.; Sasabayashi, T.; Koike, Y.; Okamoto, K. A Super-High Image Quality Multi-Domain Vertical Alignment LCD by New Rubbing-Less Technology; SID Symposium Digest of Technical Papers; Blackwell Publishing Ltd.: Oxford, UK, 1998; Volume 29, pp. 1077–1080. [Google Scholar]
  9. Yun, H.J.; Jo, M.H.; Jang, I.W.; Lee, S.H.; Ahn, S.H.; Hur, H.J. Achieving high light efficiency and fast response time in fringe field switching mode using a liquid crystal with negative dielectric anisotropy. Liq. Cryst. 2012, 39, 1141–1148. [Google Scholar] [CrossRef]
  10. Basu, R.; Iannacchione, G.S. Evidence for directed self-assembly of quantum dots in a nematic liquid crystal. Phys. Rev. E 2009, 80, 010701. [Google Scholar] [CrossRef] [PubMed] [Green Version]
  11. Gupta, S.K.; Singh, D.P.; Manohar, R.; Kumar, S. Tuning phase retardation behaviour of nematic liquid crystal using quantum dots. Curr. Appl. Phys. 2016, 16, 79. [Google Scholar] [CrossRef]
  12. Seidalilir, Z.; Soheyli, E.; Sabaeian, M.; Sahraei, R. Enhanced electrochemical and electro-optical properties of nematic liquid crystal doped with Ni:ZnCdS/ZnS core/shell quantum dots. J. Molliq. 2020, 320, 114373. [Google Scholar]
  13. Misra, A.K.; Tripathi, P.K.; Pandey, K.K.; Singh, B.P.; Manohar, R. Dielectric properties and activation energies of Cu:ZnO dispersed nematic mesogenN-(4-methoxybenzylidene)-4-butylaniline liquid crystal. J. Dispers. Sci. Technol. 2020, 41, 1283–1290. [Google Scholar] [CrossRef]
  14. Singh, S. Impact of Dispersion of Nanoscale Particles on the Properties of Nematic Liquid Crystals. Crystals 2019, 9, 475. [Google Scholar] [CrossRef] [Green Version]
  15. Rastogi, A.; Manohar, R. Effect of graphene oxide dispersion in nematic mesogen and their characterization results. Appl. Phy. A 2019, 125, 192. [Google Scholar] [CrossRef]
  16. Rastogi, A.; Pathak, G.; Srivastava, A.; Herman, J.; Manohar, R. Cd1−XZnXS/ZnS core/shell quantum dots in nematic liquid crystals to improve material parameter for better performance of liquid crystal based devices. J. Molliq. 2018, 255, 93–101. [Google Scholar]
  17. Pandey, S.; Vimal, T.; Singh, D.P.; Gupta, S.K.; Tripathi, P.; Phadnis, C.; Mahamuni, S.; Srivastava, A.; Manohar, R. Cd1-xZnxS/ZnS core/shell quantum dot ferroelectric liquid crystal composite system: Analysis of faster optical response and lower operating voltage. Liq. Cryst. 2014, 41, 1811–1820. [Google Scholar] [CrossRef]
  18. Singh, D.P.; Pandey, S.; Gupta, S.K.; Manohar, R.; Daoudi, A.; Sahraoui, A.H.; Phadnis, C.; Mahamuni, S. Quenching of photoluminescence and enhanced contrast of ferroelectric liquid crystal dispersed with Cd1−XZnXS/ZnS nanocrystals. J. Lumin. 2016, 173, 250. [Google Scholar] [CrossRef]
  19. Tripathi, P.K.; Joshi, B.; Singh, S. Pristine and quantum dots dispersed nematic liquid crystal. Impact of dispersion and applied voltage on dielectric and electro-optical properties. Opt. Mater. 2017, 69, 61–66. [Google Scholar] [CrossRef]
  20. Petrescu, E.; Cirtoaje, C.; Danila, O. Dynamic behavior of nematic liquid crystal mixtures with quantum dots in electric fields. Beilstein J. Nanotechnol. 2018, 9, 399–406. [Google Scholar] [CrossRef] [Green Version]
  21. Bae, W.K.; Nam, M.K.; Char, K.; Lee, S. Gram-scale one-pot synthesis of highly luminescent blue emitting Cd1−xZnxS/ZnS nanocrystals. Chem. Mater. 2008, 20, 5307–5313. [Google Scholar] [CrossRef]
  22. Bera, D.; Qian, L.; Kuan Tseng, T.; Holloway, P.H. Quantum dots and their multimodal applications: A review. Materials 2010, 3, 2260–2345. [Google Scholar] [CrossRef] [Green Version]
  23. Rastogi, A.; Pandey, F.P.; Parmar, A.S.; Singh, S.; Hegde, G.; Manohar, R. Effect of carbonaceous oil palm leaf quantum dot dispersion in nematic liquid crystal on zeta potential, optical texture and dielectric properties. J. Nanostruct. Chem. 2021. [Google Scholar] [CrossRef]
  24. Rastogi, A.; Hegde, G.; Manohar, T.; Manohar, R. Effect of oil palm leaf–based carbon quantum dot on nematic liquid crystal and its electro–optical effects. Liq. Cryst. 2020, 48, 12. [Google Scholar] [CrossRef]
Figure 1. Optimized chemical structure of p-methoxybenzylidene p-decylaniline (MBDA).
Crystals 11 00605 g001
Figure 2. Polarizing optical micrographs for pure nematic MBDA and its mixture with core/shell quantum dots (Mix 1 to Mix 6) at a temperature of 56 °C.
Crystals 11 00605 g002
Figure 3. Polarizing optical micrographs for pure nematic MBDA and its mixture with core/shell quantum dots (Mix 1 to Mix 6) at a temperature of 56 °C with applied voltage of 0 V, 5 V, 10 V, and 15 Vat a scale of 100 µm.
Crystals 11 00605 g003
Figure 4. Schematic representation of electric field reorientation of liquid crystal molecules in QDs doped sample.
Crystals 11 00605 g004
Figure 5. (a) Variation of dielectric permittivity versus frequency at 0 volt applied bias and 56 °C temperature for pure nematic MBDA and its mixture with core/shell quantum dots (Mix 1 to Mix 6); (b) Variation of dielectric loss versus frequency at 0 volt applied bias and 56 °C temperature for pure nematic MBDA and its mixture with core/shell quantum dots (Mix 1 to Mix 6).
Crystals 11 00605 g005
Figure 6. (a) Variation of dielectric permittivity versus frequency at 20 volt applied bias and 56 °C temperature for pure nematic MBDA and its mixture with core/shell quantum dots (Mix 1 to Mix 6); (b) Variation of dielectric loss versus frequency at 20 volt applied bias and 56 °C temperature for pure nematic MBDA and its mixture with core/shell quantum dots (Mix 1 to Mix 6).
Crystals 11 00605 g006
Figure 7. Dielectric anisotropy of pure nematic MBDA and its mixture with core/shell quantum dots (Mix 1 to Mix 6) at a 1 kHz frequency.
Crystals 11 00605 g007
Figure 8. Mean dielectric constant of pure nematic MBDA and its mixture with core/shell quantum dots (Mix 1 to Mix 6) at a 1 kHz frequency.
Crystals 11 00605 g008
Figure 9. (a) Temperature dependent on time for pure nematic MBDA and its mixtures with core/shell quantum dots (Mix 1 to Mix 6) at 20 volt applied bias, 1 kHz frequency input signal; (b) Temperature dependent off time for pure nematic MBDA and its mixtures with core/shell quantum dots (Mix 1 to Mix 6) at 20 volt applied bias, 1 kHz frequency input signal; (c) Temperature dependent total electro-optic response time for pure nematic MBDA and its mixtures with core/shell quantum dots (Mix 1 to Mix 6) at 20 volt applied bias, 1 kHz frequency input signal; (d) Temperature dependent rotational viscosity for pure nematic MBDA and its mixtures with core/shell quantum dots (Mix 1 to Mix 6) at 20 volt applied bias, 1 kHz frequency input signal.
Crystals 11 00605 g009
Figure 10. Variation of transmission with voltage (V–T plot) for the pure nematic MBDA and its mixture with core/shell quantum dots (Mix 1 to Mix 6).
Crystals 11 00605 g010
Figure 11. Variation of birefringence with temperature for pure nematic MBDA and its mixture with core/shell quantum dots (Mix 1 to Mix 6).
Crystals 11 00605 g011
Publisher’s Note: MDPI stays neutral with regard to jurisdictional claims in published maps and institutional affiliations.