Article

Controlling Protein Crystallization by Free Energy Guided Design of Interactions at Crystal Contacts

1
Institute of Biochemical Engineering, Technical University of Munich, Boltzmannstraße 15, 85748 Garching, Germany
2
Institute of Structural Biology, Helmholtz Zentrum München, Ingolstädter Landstraße 1, 85764 Neuherberg, Germany
3
Institute of Pharmaceutical Biotechnology, Ulm University, James Franck Ring N27, 89081 Ulm, Germany
4
Physics Department—T38, Technical University of Munich, James-Franck-Straße 1, 85748 Garching, Germany
*
Authors to whom correspondence should be addressed.
Crystals 2021, 11(6), 588; https://doi.org/10.3390/cryst11060588
Submission received: 14 April 2021 / Revised: 11 May 2021 / Accepted: 19 May 2021 / Published: 24 May 2021
(This article belongs to the Special Issue Bulk Protein Crystallization)

Abstract

:
Protein crystallization can function as an effective method for protein purification or formulation. Such an application requires a comprehensive understanding of the intermolecular protein–protein interactions that drive and stabilize protein crystal formation to ensure a reproducible process. Using alcohol dehydrogenase from Lactobacillus brevis (LbADH) as a model system, we probed in our combined experimental and computational study the effect of residue substitutions at the protein crystal contacts on the crystallizability and the contact stability. Increased or decreased contact stability was calculated using molecular dynamics (MD) free energy simulations and showed excellent qualitative correlation with experimentally determined increased or decreased crystallizability. The MD simulations allowed us to trace back the changes to their physical origins at the atomic level. Engineered charge–charge interactions as well as engineered hydrophobic effects could be characterized and were found to improve crystallizability. For example, the simulations revealed a redesigning of a water mediated electrostatic interaction (“wet contact”) into a water depleted hydrophobic effect (“dry contact”) and the optimization of a weak hydrogen bonding contact towards a strong one. These findings explained the experimentally found improved crystallizability. Our study emphasizes that it is difficult to derive simple rules for engineering crystallizability but that free energy simulations could be a very useful tool for understanding the contribution of crystal contacts for stability and furthermore could help guide protein engineering strategies to enhance crystallization for technical purposes.

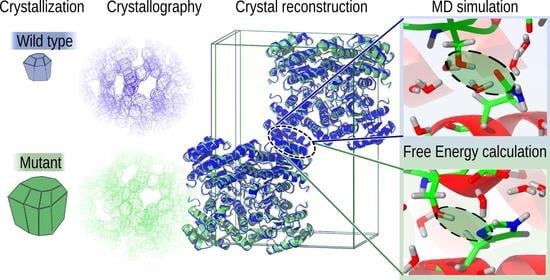
Graphical Abstract

1. Introduction

It is often thought that proteins are trained by evolution not to aggregate or crystallize as it may interfere with their functions [1]: crystallization in living cells leads to disorders or diseases such as eye cataract [2,3], homozygous hemoglobin C disease, causing a form of anaemia [4], or the so-called “Charcot-Lyden crystals”, leading to bronchial asthma [5,6]. However, evolution also led to families of proteins which derive their functions from a crystallized state: Bacillus thuringiensis produces pore-forming crystal (Cry) proteins that are used as insecticides [7]. Moreover, protein crystallization may be put to use: protein crystallization is an inevitable step in structure determination by diffraction methods. Long before the first X-ray crystallography structure of a protein was solved by Nobel Prize winning scientists Max Perutz and John Kendrew in the 1950s [8,9], crystallization has been used for purification purposes. Osborne [10] extended the work of Ritthausen [11,12] to prepare pure specimens of globulins by crystallization. Nowadays, technical protein crystallization is focused on as an attractive, effective purification method compared to conventional, costly chromatographic methods [13]. Furthermore, protein crystals are well suited as a delivery tool of biopharmaceuticals [14].
In a supersaturated environment, the crystallization process evolves in two steps: nucleation and crystal growth. Based on Gibb’s early formulation of the relation between work and stability of a nucleus of a new phase [15], Volmer and Weber [16], and Becker and Döring [17] formulated a thermodynamic concept of nucleation, which is now called classical nucleation theory (CNT). Due to Brownian motion crystal building blocks constantly attach and detach from each other. The main assumption in CNT is that small clusters exhibit the same properties as the bulk material. Based on numerical calculations, ten Wolde and Frenkel suggested an alternative two step nucleation path [18]: crystal building blocks cluster in a dense meta-stable unordered liquid before a crystalline nucleus is built inside that cluster. The transformation from the unordered cluster into the crystalline nucleus follows the same principles as described for the classical pathway: orderly attachment of crystal building blocks at the crystal binding sites. Crystal growth by two-dimensional nucleation and by spiral dislocations has been identified as the main growth mechanisms in protein crystallization [19,20,21,22,23] and was developed mainly by Burton, Cabrera, and Frank around 1950 [24]. The growth originates from steps at crystal surfaces, which are produced by two-dimensional nucleation or by spiral dislocations. The addition of building blocks is from a physical point of view similar to the nucleation process of CNT [25] and often modeled according to CNT [26]. Both processes, nucleation and crystal growth, depend on the productive binding of building blocks, i.e., on the same stabilizing interactions as later found in a fully grown crystal.
Conventionally, crystallization of proteins is improved or enabled by manipulating the proteins’ environment, i.e., crystallization conditions, in a large crystallization screen [27]. A different approach is to manipulate the protein itself by protein engineering. A currently prominent protein engineering strategy to enable crystallization for crystallographic purposes can be found in the surface entropy reduction (SER) strategy. Following SER, large flexible charged residues (lysines, glutamines and glutamic acids) at the protein’s surface are replaced by small uncharged alanines to reduce a protein’s “entropy shield” and generate hydrophobic patches at the proteins surface [28,29,30,31,32]. Research so far has been focused on crystallographic purposes where the goal is to enable or improve the crystallization behavior for generating a well diffracting crystal. For technical purposes, it is important to increase or decrease a protein’s crystallizability to control crystallization yield and kinetics, while the quality of the crystal is initially secondary [13]. Hence, the strategies may not be directly transferable.
One reason for competing theories and ambiguous strategies for controlling protein crystallization is that the exact interactions at the atomic level are not visible during experiments. One possibility to investigate interactions and calculate thermodynamic quantities is via all atom molecular dynamics (MD) simulations. MD simulations usually explore a timescale from ns to µs in typical simulation boxes of a few nm edge length. However, crystallization takes place on a longer time scale and crystal sizes can exceed several hundred nm to µm in one dimension (or even mm [33]). Attachment frequencies of building blocks on a surface during growth have been measured to be 0.005 s 1 per attachment site [34]. Though some heroic examples for MD simulation in millisecond timescale exist [35] and the use of GPU acceleration allows significant performance gain [36,37,38], simulations beyond seconds and in the µm range are rare and also often not necessary; in MD simulations the large scale of a crystal can be effectively modeled by periodic boundary conditions (PBCs) or the system can be modeled at a reduced size without loss of information. Furthermore, MD simulations and MD acceleration methods enable calculating the free energy differences of the end states of the process instead of simulating a lengthy non-equilibrium crystallization process.
Here, we calculate the free energy difference of crystallizing wild type vs. mutant proteins in free energy perturbation simulations via alchemical transformation. This free energy difference defines which crystallization process (wild type or mutant) is more likely to happen and which crystal is energetically more stable. The advantage of alchemical free energy simulations is that they inherently correctly sample the Boltzmann distribution of microstates. As we use all atom MD simulations, we inherently include entropic and enthalpic effects for both solvent and protein. Historically, one of the first applications of MD simulations to protein crystals was atomic fluctuations modeling (R factor refinement) [39]. Since then, protein crystal MD simulations have been used for force field evaluations [40], a conformational study of protein crystals [41], or conformational differences of proteins in crystal and solution [42]. However, no MD simulation work on studying and quantifying the protein crystallization process itself exists.
Our example protein alcohol dehydrogenase from Lactobacillus brevis (LbADH) is an R-specific, nicotinamide adenine dinucleotide phosphate [NADP(H)]-dependent enzyme and is known for its high stability at elevated temperatures, high stereoselectivity, tolerance to organic solvents and broad substrate range, making it industrially relevant [43,44,45]. LbADH biologically assembles itself as homotetramer with a monomer of 26.6 kDa molecular weight. Two biological units, i.e., crystal building blocks, build up a crystallographic unit cell (UC). All published X-ray crystallography structures of LbADH and variants thereof diffracted either in P 2 1 22 1 with two monomers in the asymmetric unit or in space group I222 with one monomer in the asymmetric unit. Both combinations result in the same crystal packing [33]. Figure 1a,b shows the crystal packing and all targeted crystal contacts for the example of wild type LbADH (PDB-ID 6h07), which diffracts in space group P 2 1 22 1 . Crystal contacts at the “corners” of the tetramer, which we termed “corner contacts”, are structurally not equivalent in the space group P 2 1 22 1 as the two tetramers in the UC are rotated with respect to each other around the b-axis but coincide in the space group I222. The crystal contact in the b direction of the crystallographic UC between the “edges” of the tetramer is termed “edge contact” and the crystal contact in a-direction is termed “side contact”.
Protein engineering is a powerful tool to enhance a protein’s crystallizability and utilize it for technical purposes, while the concrete interactions remain unclear [46,47]. In this study, our goal is to investigate both enhanced and reduced crystallizability with MD free energy calculations and identify the controlling interactions. Therefore, we designed and screened LbADH mutants with reduced crystallizability for the negative control (K45A, H39A, D54A and Q207D) in addition to known enhanced crystallizing LbADH mutants (T102E, D54F, Q126H, Q126K, K32A). We aim to track back the experimentally observed altered crystallization behavior to their physical origin and to contribute to a deeper understanding of the crystallization process by unraveling interactions dictating the crystallization behavior.

2. Experimental and Computational Details

2.1. Protein Mutagenesis, Production, Purification and Analysis

Mutagenesis, production and purification were performed as described in Nowotny et al. [46]. Site directed mutagenesis was conducted based on His 6-tagged wild type LbADH encoded on DNA plasmid pet28a(+) as described in Hermann et al. [33]. Standard QuikChange (QC)-PCR protocol was applied for primer design of mutant Q207D, D54A, K45A and according to Zheng et al. [48]. The primers are listed in the Supplementary Information in Table S1. Primers for T102E, D54F, Q126H, Q126K, and K32A were previously published [46,47]. After DpnI digestion, Escherichia coli DH5 α transformation, and plasmid DNA extraction, plasmid DNA sequencing verified correct DNA mutations. Recombinant production with E. coli BL21 (DE3) of all LbADH variants, dialysis, and purification via immobilized metal affinity chromatography for experiments on the µL-scale were conducted as described in Nowotny et al. [46]. Enzymatic activity assays were performed for non-crystallizable mutants (K45A, D54A, H39A) and compared to the maximum enzymatic rate of wild type LbADH as described previously [47] (for details see Supporting Information Section S2).

2.2. Crystallization

Crystallization was performed in µL batch experiments as described in Nowotny et al. [46] and Grob et al. [47]. The protein solution consisted of 10 or 20 g L 1 LbADH, 20 mM 4-(2-hydroxyethyl)-1-piperazineethanesulfonic acid (HEPES) /NaOH pH 7.0 and 1 mM MgCl 2 . The precipitation buffer was composed of 1 mM Tris/HCl pH 7.0, 50 mM MgCl 2 and 150 or 200 g L 1 polyethylene glycol (PEG) 550 monomethyl ethers (MME). The crystals were grown at 20 °C in 96-well µL batch crystallization plates (MRC UnderOil Crystallization Plate, SWISSCI, Neuheim, Switzerland) where 5 µL of crystallization buffer was added to the same volume of protein solution resulting in standard conditions (5 g L 1 LbADH and 75 g L 1 PEG) and increased conditions (10 g L 1 LbADH and 100 g L 1 PEG). For each variant and each condition, ten droplets were prepared in the 96-well crystallization plates. The plates were sealed with transparent adhesive tape and mounted on a light microscope.

2.3. X-ray Data Collection and Structure Solution

For X-ray diffraction data collection, the crystals were cryo-protected with 25–30% (v/v) ethylene glycol, mounted on nylon fiber loops and flash-cooled to 100 K in liquid nitrogen. Diffraction data were collected at 100 K at Swiss Light Source—SLS on beamlines PXI X06SA and SLS PXIII X06DA. The diffraction data were reduced, indexed and integrated with XDS [49] and scaled with XSCALE [50]. Model building and refinement was performed in software suite CCP4 [51]. Our previously published wild type (WT) LbADH structure (PDB-ID 6h07) served as search model in molecular replacement with Phaser [52]. Refinement and manual model building was performed with REFMAC [53] and COOT [54], respectively. Atomic coordinates and structure factors have been deposited in the Protein Data Bank under accession codes 6y10 (Q126H), 6y0z (Q126K), 6y1c (D54F), 7a2b (Q207D). Diffraction data, structure solution and refinement statistics are given in Supplementary Information in Table S6.

2.4. System Construction for Atomistic Molecular Dynamics (MD) Simulations

Bound Crystal State: For LbADH protein variants for which a crystal structure existed (T102E, D54F, Q126H, Q126K, K32A, Q207D) crystal systems for both, wild type (WT) and mutant, were constructed, so that the mutation could be investigated in both crystal systems. For the variants, H39A, K45A, and D54A no diffraction data could be obtained. For these variants, the mutation was performed only in the WT crystal system. The crystal bound state is represented (a) by one crystallographic unit cell (UC) with periodic boundary conditions (PBC) (for mutation Q126H in both WT and mutant crystal packing geometries), (b) by the isolated crystal contact, i.e., reduced to the monomers of the engineered crystal contact (for all mutations). The composition of the UC with PBC set-up (bound version (a)) and the reduced set-up (bound version (b)) are reported in Supplementary Information in Table S5. The simulation box sizes for the UC set-up (bound version (a)) correspond to the respective UC box vectors (see also Table S6). For the reduced set-up (bound version (b)) the monomers of the isolated crystal contact were placed in a simulation box leaving at least 30 Å to the next periodic image. This resulted in box sizes ranging from 97.440 × 142.460 × 81.86 Å 3 (in cases where the crystal contact could be reduced to two monomers) to 114.01 × 125.49 × 100.88 Å 3 (in cases where the crystal contact was reduced to three monomers). The box dimensions for all set-ups are reported in Table S5. Unbound State: The solvated unbound state is represented (a) by one tetramer (for mutation Q126H and Q207D) and (b) by one or two monomers (depending on the position of the mutation) placed in a cubic box with PBC leaving at least 30 Å to the next periodic image (for all mutations). This results in a simulation box sizes of 88.00 × 98.00 × 9.300 Å for unbound version (a) and 93.88 × 114.60 × 76.44 Å 3 and 93.72 × 114.41 × 76.30 Å 3 for unbound version (b) in case of one or two monomers, respectively. The details for all unbound set-ups are reported in Supplementary Information in Table S5. Preparation and parametrization: GROMACS tool pdb2gmx was used to protonate the protein at pH 7.0 (resulting in a net charge of -5e for WT LbADH) and to parametrize the protein in CHARMM36 [55] with the refined parameters CHARMM36m [56]. All simulation boxes were solvated with TIP3P water model [57] and neutralized with 25.5 mM MgCl 2 .

2.5. MD System Equilibration

The MD simulations were carried out with the MD engine GROMACS v.2018.6 [58,59]. The simulation boxes described above were equilibrated and prepared according to the following protocol: EM, Annealing, NVT: First energy minimization (EM) via steepest descent with convergence criterion of 8500 steps or 100 kJ mol 1 nm 1 was performed, followed by 0.9 ns of annealing with a final temperature of 293 K and 1 ns of constant volume simulation (NVT). A leap-frog integrator (MD) with a time step of 1 fs was used and the temperature was controlled with velocity rescaling [60]. Position restraints on backbone atoms with a force constant of 1000 kJ mol 1 nm 2 were applied. The bond lengths of H atoms were constrained with Linear Constraint Solver [61]. The highest order in the expansion of the constraint coupling matrix of 12 was used. The electrostatic interactions were calculated with the Particle mesh Ewald (PME) method [62,63] using an PME order of 6 and a Fourier spacing of 0.12 nm. For the van der Waals interaction, a cut-off distance of 1.2 nm was used with a smooth potential switch starting from 1.0 nm. For the neighbor search, the verlet scheme [64] was used. Determining box sizes/solvent ratio: Short unconstrained isothermal-isobaric ensemble (NPT) test simulations (2 to 10 ns) with isotropic Berendsen barostat set to 1.01 bar and a coupling constant of τ = 1.0 were conducted to adjust the box size or number of solvent molecules. Equilibration run: The simulation boxes of the previously NVT equilibrated structures were adjusted according to the test simulations and re-equilibrated with a short NVT run. The time step was increased to 2 fs. The position restrains were decreased to C α atoms and a force constant of 750 kJ mol 1 nm 2 and the highest order in the expansion of the constraint coupling matrix was decreased to 4. This equilibration run was carried out until the backbone root mean square deviation (RMSD) was constant. This typically took 200 ns for a UC simulation (version (a) of the bound state), 75 ns for the isolated crystal contact (version (b) of the bound state), 50 ns for an unbound tetramer (version (a) of the unbound state), and 25 ns for an unbound monomer (version (b) of the unbound state). Starting structure extraction for free energy perturbation (FEP): In all set-ups, the last frame was extracted as a starting structure for the FEP simulation. Additionally, for variant Q126H, the equilibration run for the UC simulation (version (a) of the bound state) was elongated for another 35 ns so that three random starting structures (structures at time points: 200, 220, 235 ns) could be extracted from the trajectory, i.e., system phase space.

2.6. MD Free Energy Calculations

Alchemical set-up: In order to generate a hybrid protein structure and topology for FEP calculation from the equilibrated starting structures, we used the GROMACS compatible programm PMX [65,66]. For the UC bound state (version (a) of the bound state), 60 equally spaced alchemical transition windows were constructed. For the rest of the set-ups, 30 transition windows were employed. EM, Annealing, NVT, Equilibration run: For each of the windows EM, annealing, NVT and equilibration run were conducted as described above with a reduced annealing time of 0.3 ns and a equilibration run time of 5 ns. Soft core potentials were used for the Lennard Jones and Coulomb interactions with a soft core parameter alpha of 0.3, a power of 6 for the radial term, and a soft core sigma for particles of 0.25. Starting with the equilibration run, Hamiltonian replica exchange (HE), with an exchange attempt between neighboring alchemical transition windows every 1000 steps resulting in transition probabilities of 25 to 40%, was performed. Production run: A production run of 20 ns was performed with the same parameters as the equilibration run and the free energy difference of every window to its two neighboring window was calculated during the simulation every 100 steps, i.e., every 0.2 ps. Analysis: The free energy difference was estimated via the Bennett Acceptance ratio (BAR) [67] implemented in GROMACS and divided by the number of mutations in the respective set-up). Error estimate was calculated with GROMACS BAR (splitting the data into blocks and calculating the average variance). Charge change corrections: As the electrostatic interactions were treated with PME, a periodic lattice-sum method, the finite box with periodic boundary conditions introduces finite-size effects, which impacted the free energy calculation in cases where the mutation involves a charge change. We applied the counter ion approach, which corrects the dominant error: the net charge change [68]. The net charge was kept constant by charging or de-charging a divalent magnesium ion (Mg 2 + ) or a chloride ion (Cl ) during the alchemical transformation while keeping their Van der Waals parameters. For net charge changes of Δ q = 2 e (isolated crystal contact of D54F, K32A, Q207D) Mg 2 + and for changes of Δ q = e (isolated crystal contact of Q126H, Q126K, T102E, K45A, H39A) Cl was used as alchemical counter ion, respectively. Evidently, the charging free energies of alchemical counter ions was not included in the free energy calculations. Hydrogen bond and water shell analysis: The generated trajectories were analyzed with python scripts. For hydrogen bond determination, a distance smaller than 2.5 Å was used. Error estimate was performed by block averaging over five blocks. For water counts (hydration shell) at the edge contact, spheres were constructed between the interfacing interaction areas and a count was performed over all frames. Spheres with 3.3 Å radii around the mean positions of Cα atoms of oppositely lying D54s/F54s and T52s were used.

2.7. Method Consistency Evaluation and System Reduction Procedure

In order to evaluate robustness and consistency of the method and simulation system, simulations were set-up that should yield the same free energy change. The crystal bound state, fully periodically interacting with the UC set-up (bound version (a) described above) of mutant Q126H, was employed and three snapshots after equilibration were extracted (see Supporting Information Section S3 for more details). The consistency was verified with standard deviation calculations reported in Supplementary Table S2. In order to be able to use the described charge correction scheme, the simulation system needs to exhibit enough solvent volume for solvation of an alchemical counter ion (see Supporting Information Section S4 for more details). In the case of the bound crystal state, this requirement was not fulfilled for the bound version, (a) as described above (a fully and periodically interacting UC set-up), but was fulfilled in the bound version (b) (a reduced set-up where only the interacting monomers of the respective contact were placed in a simulation box). Therefore, we verified that we achieve consistent results in both versions of the bound crystal state for a mutation with no net charge change: Q126H (see Supplementary Table S2). Furthermore, the unbound state biologically consists of a solvated tetramer. In order to save computer power, we inspected if the unbound solvated state of Q126H as tetramer (unbound version (a) described above) can be reduced to two monomers (unbound version (b)) (see Supplementary Table S3).

3. Results

3.1. Experimentally Observed Crystallizability Order

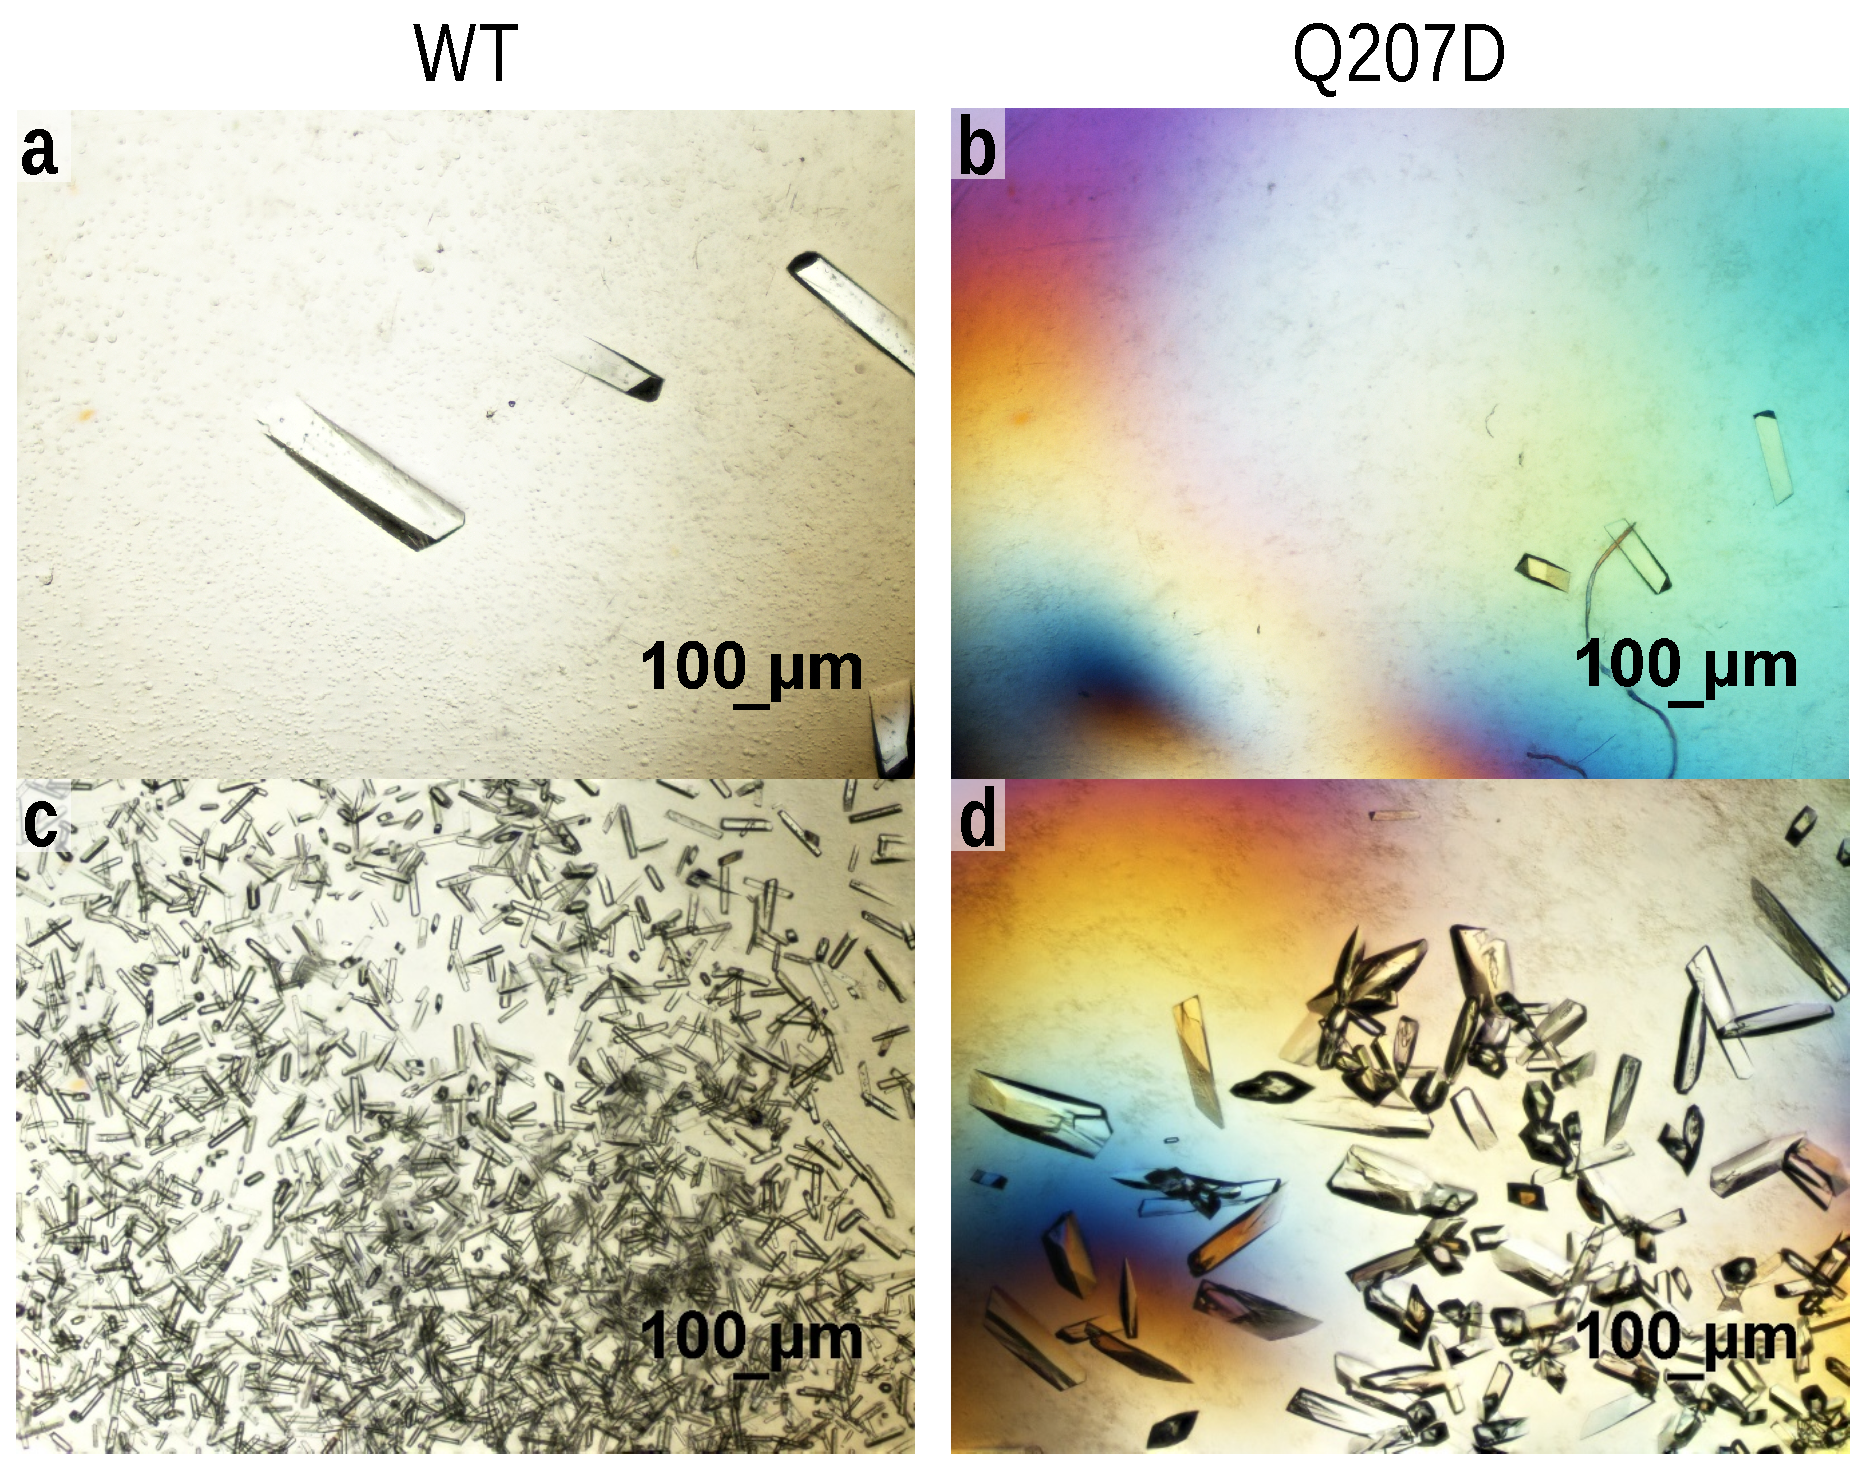
Following Grob et al., we defined the term “enhanced/reduced crystallizability” as “correlating observations of a higher/lower number of crystals (equivalent to a higher/lower nucleation rate), lower/longer induction time, lower/longer time span until crystallization equilibrium, and crystallization at reduced/increased concentrations of protein and crystallization agent” [47]. The PDB-IDs of all inspected LbADH variants discussed in the following are summarized in Supplementary Table S4. In µL batch crystallization experiments, wild type and mutant Q207D crystallized at the standard conditions (5 g L 1 LbADH and 75 g L 1 PEG at 20 °C) within 24 h while mutants H39A [46], K45A [46] and D54A did not crystallize. For mutant Q207D, further crystallization experiments at increased protein and PEG concentrations (10 g L 1 LbADH and 100 g L 1 PEG at 20 °C) were conducted. At both tested crystallization conditions, Q207D crystallized significantly slower and yielded a reduced amount of crystals compared to the wild type (see Figure 2; photographs at intermediate times can be found in the Supporting Information Figure S2). Therefore, we can deduce a crystallizability order for mutants with reduced crystallizability as (by decreasing order): wild type (WT) > Q207D > H39A, K45A, D54A where the latter three mutants did not crystallize under the tested conditions within 24 h. Based on our previous work, the order of mutants with increased crystallizabilty follows (by decreasing order) T102E ≈ D54F > Q126H > Q126K > K32A > WT [46,47].

3.2. Preservation of Crystal Packing and Crystal Building Blocks

The X-ray crystallography structures of the variants which were crystallizable (WT, D54F, T102E, Q126H, Q126K, K32A, Q207D) allowed us to reconstruct and analyze the crystallographic unit cells (UCs). Though space group and UC parameters differed (see Supplementary Table S4) all mutants showed same crystal packing. This means that the overall arrangement including the crystal contacts did not change. Hence, the mutations did not influence the overall arrangement but may have altered the interactions at crystal contacts. The structural alignment of the monomers on the C α atoms of wild type protein structure yielded root mean square deviations smaller than 0.19 Å in all cases implying a preservation of the secondary structure (see Supplementary Table S4). For the mutants that did not crystallize (H39A, K45A, and D54A), the preserved activity (see Supporting Information Section S2 and Figure S1) strongly indicated their correct tetrameric biological assembly and therefore, the preservation of potential crystal building blocks.

3.3. Theoretically Calculated Crystallizability Order

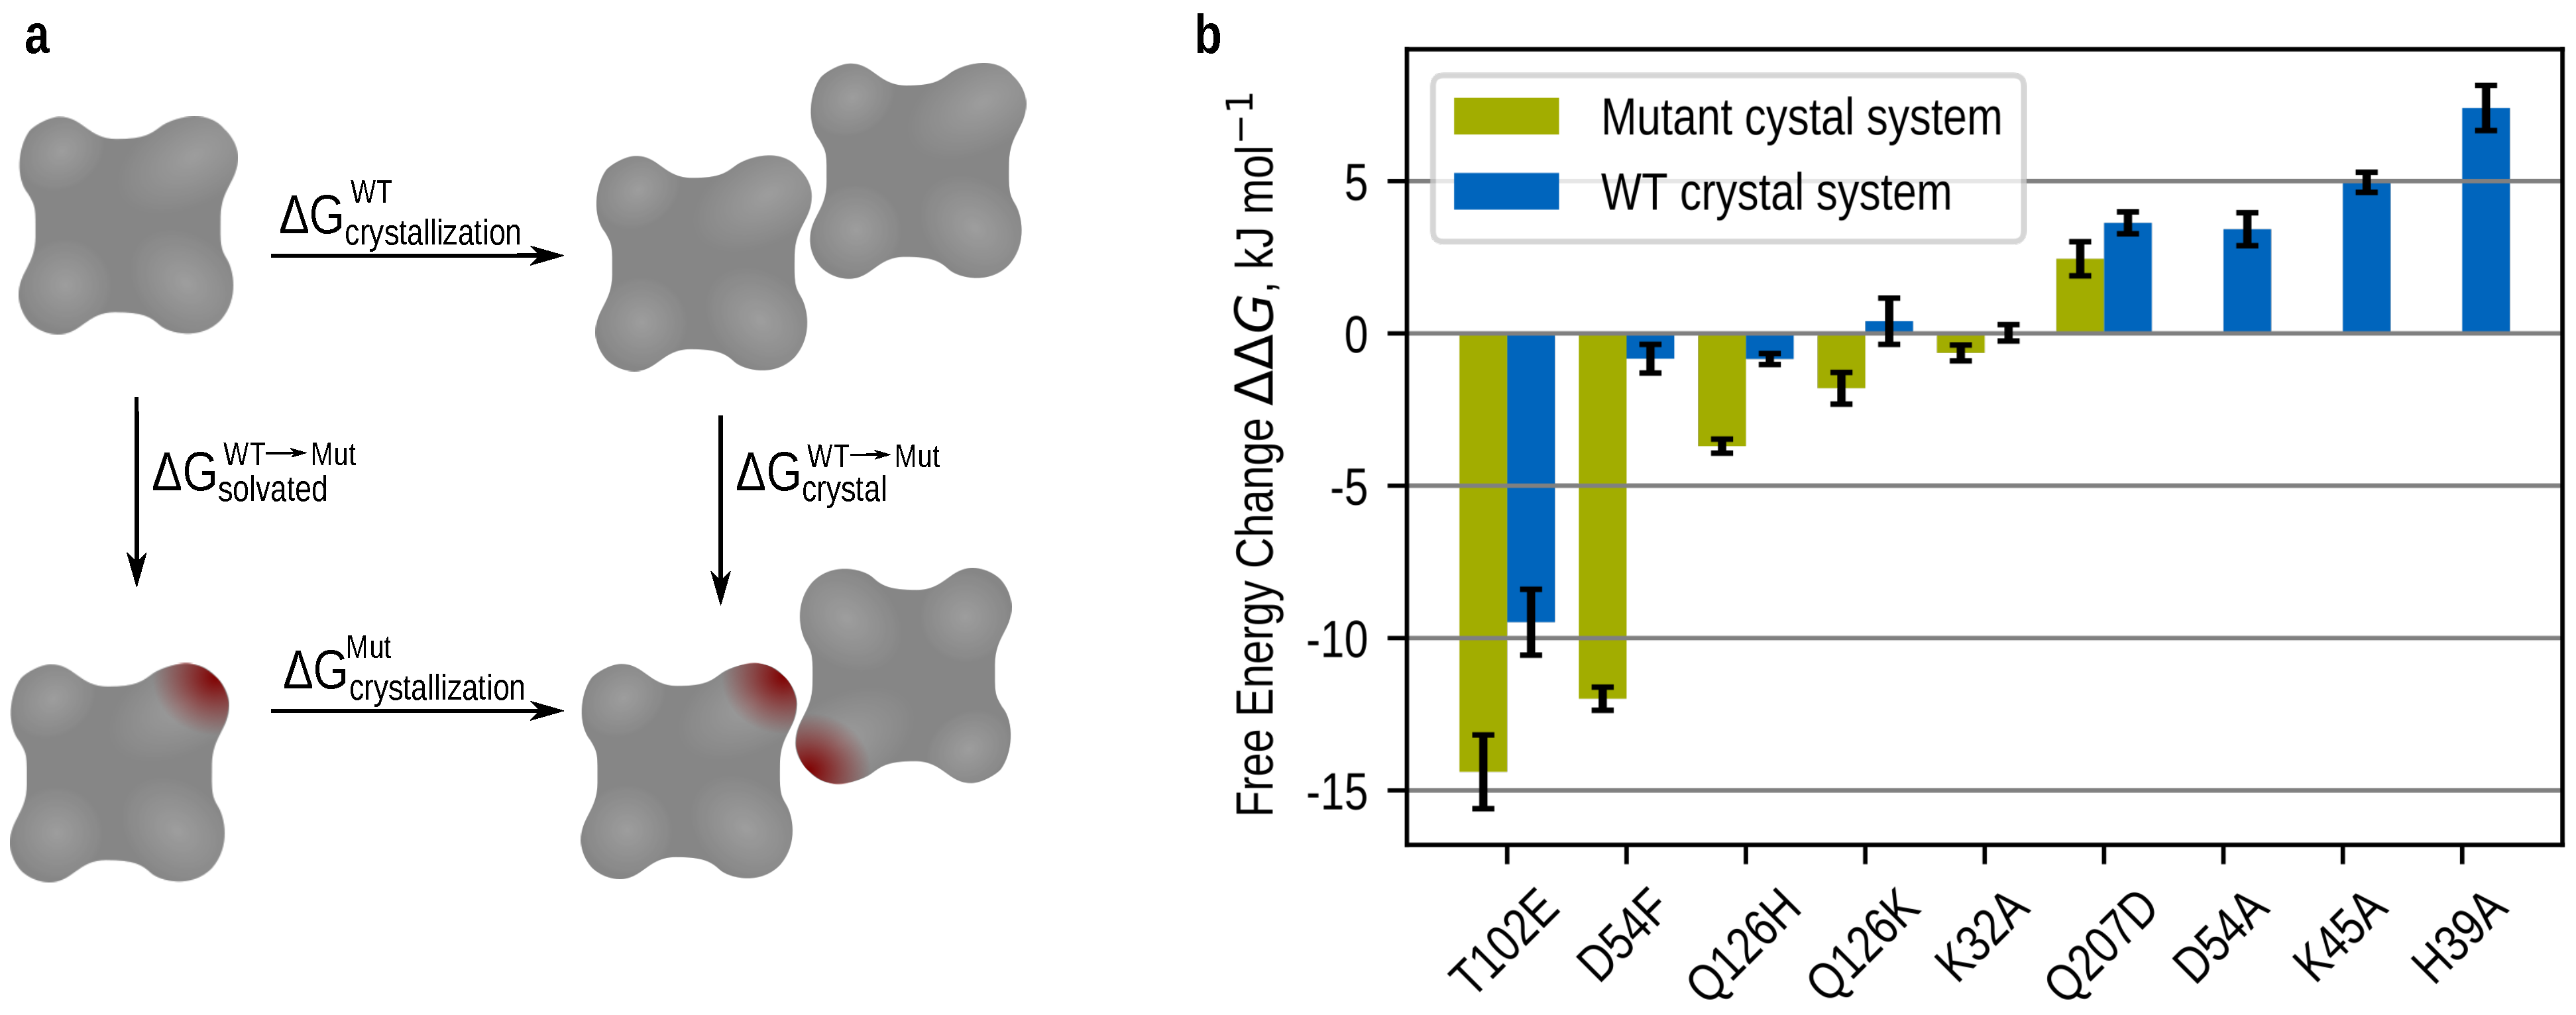
In order to theoretically study the influence of the mutation we calculated the free energy difference for wild type vs. mutant crystallization Δ Δ G via a thermodynamic cycle (see Figure 3a,b). Crystallizable (T102E, D54F, Q126H, Q126K, Q207D) and non-crystallizable (D54A, K45A, H39A) mutants were simulated in both crystal packing geometries and wild type crystal packing geometry, respectively (see Computational Details and Supplementary Tables S4–S6). Molecular dynamics (MD) free energy calculations in wild type crystal packing explore the influence of the mutation as if the mutant crystallizes in wild type crystal packing and vice versa. The mutation additionally induces a slight re-arrangement, i. e., coordinate transformation. The associated free energy shift represents the gap between the values for both crystal systems. The real free energy change including a coordinate transformation lies between those two values. Our theoretical calculations yielded negative free energy differences for all mutants with experimentally observed increased crystallizability in both crystal packings except for mutants Q126K and K32A in wild type crystal packing. No defined sign could be assigned within the calculated error for these two mutants in wild type crystal packing. For all mutants with decreased crystallizability we calculated a positive free energy change. In case of mutant Q207D, where we could calculate the free energy change in both crystal systems, both values were positive. As the real free energy values lie in between both values of mutant and wild type crystal packing calculations, it can be deduced that the free energy simulations reproduce the experimental order: T102E ≈ D54F > Q126H > Q126K > K32A > WT > Q207D > D54A, K45A, H39A.

3.4. Transforming a “Wet Contact” into a “Dry Contact”

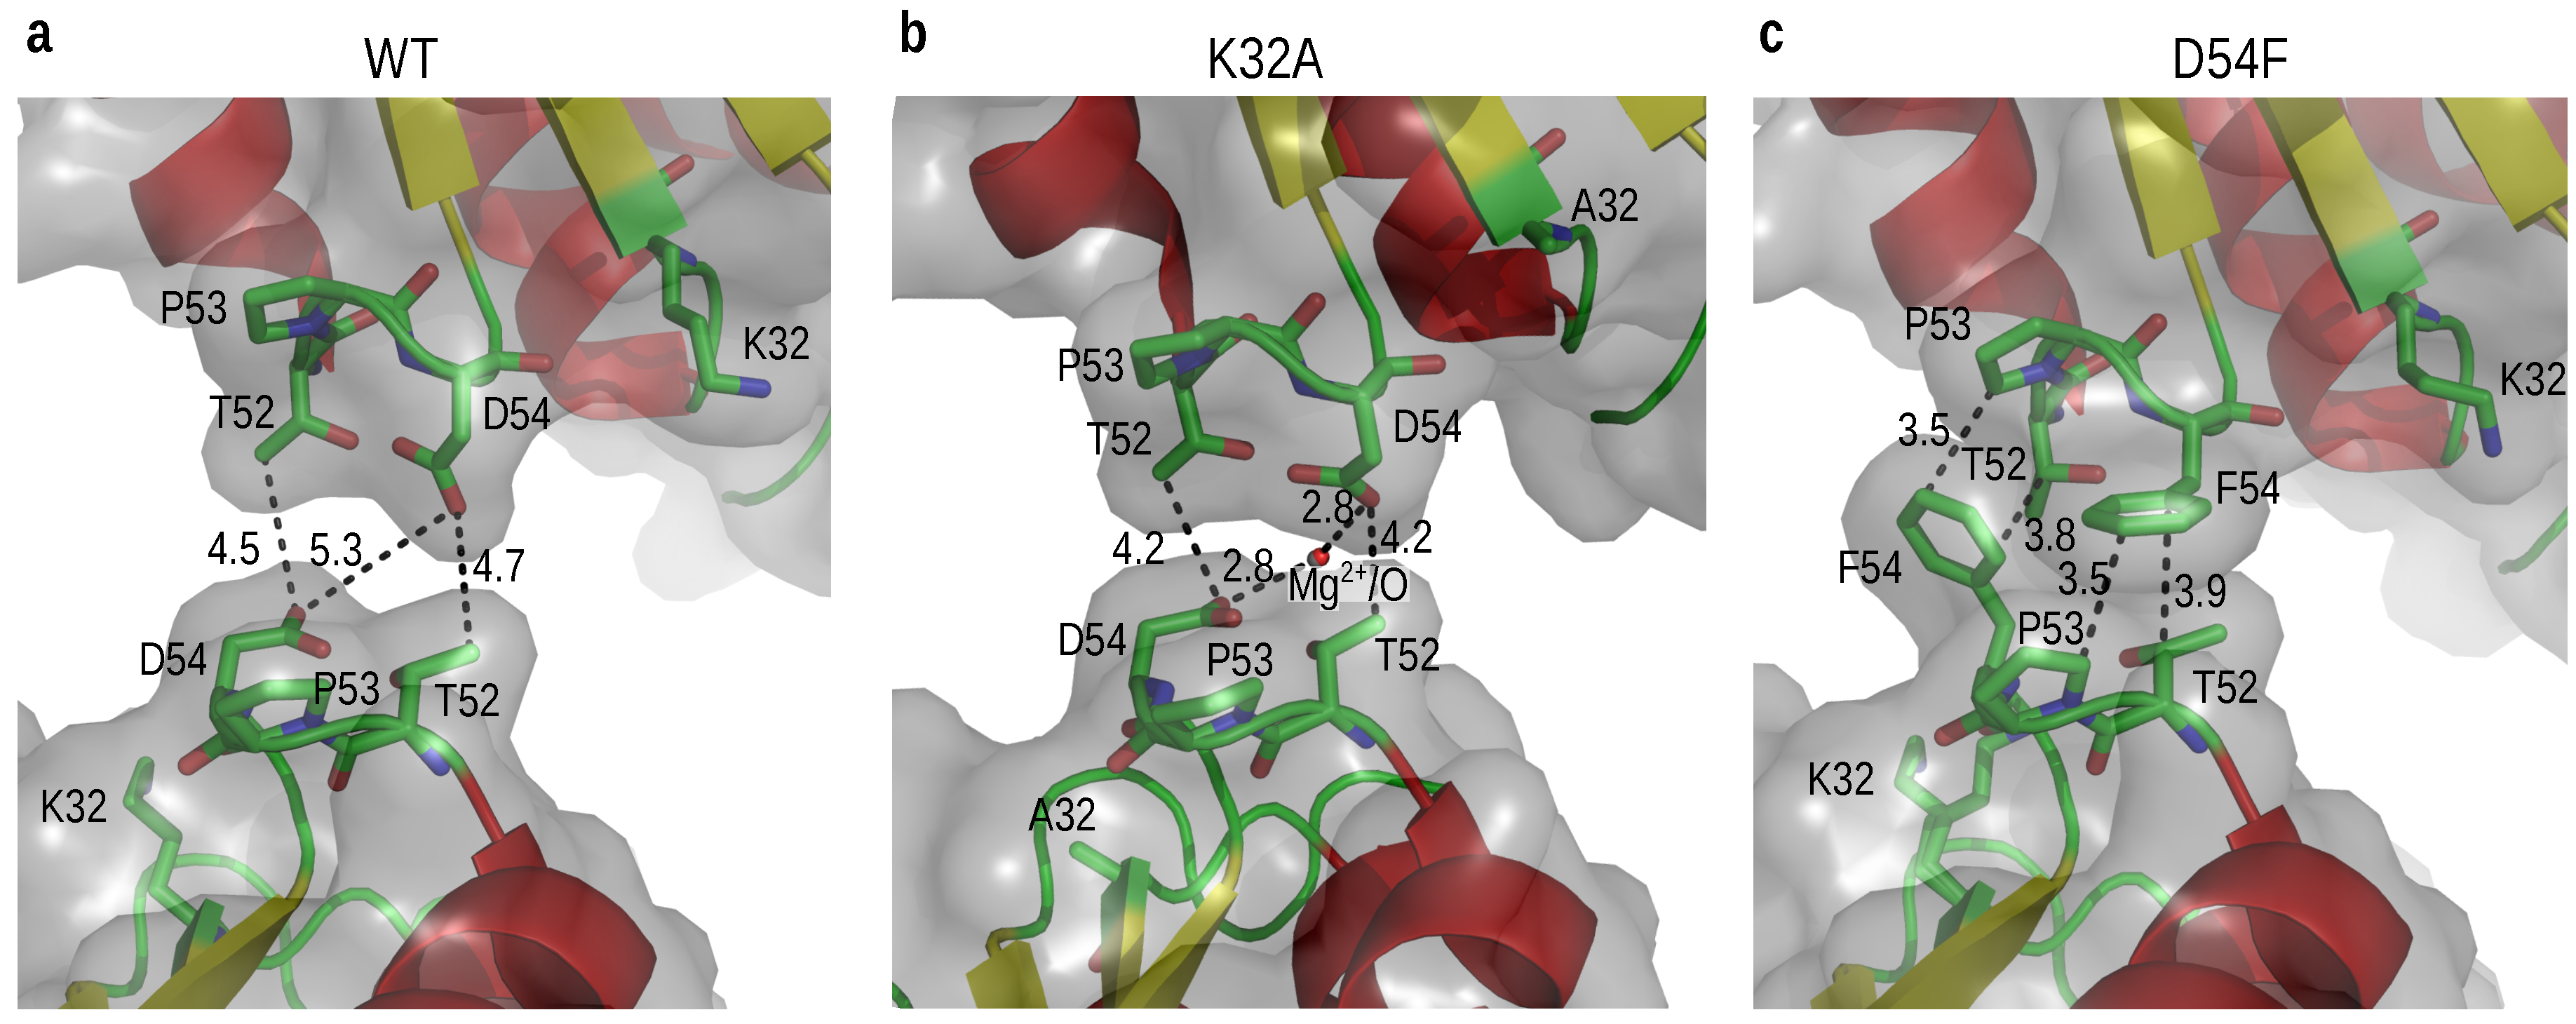
A particular interesting contact was found at amino acid position 54 at the edge contact (see Figure 4). In wild type LbADH, two symmetry related aspartic acids (D54) are facing each other with a nearest distance of the carboxylate groups oxygens of 5.3 Å (the other carboxylate group oxygen participates in hydrogen bonding with the hydroxyl group of threonine (T52)). MD simulations showed that the two negatively charged carboxylate groups interact with each other via dynamic water mediated hydrogen bonds. On average, 4.5 ± 2.2 water molecules were calculated at the wild type crystal contact mediating the attractive interaction of oppositely lying residues. This is considered as “wet contact”: charged side chains interact with each other via water molecules [69]. In order to verify this attractive interaction, we destroyed this wet interaction by creating the mutant D54A. With uncharged short alanine at position 54 (A54), we calculated a positive Δ Δ G value in accordance with no crystallization in the experiment. Mutant K32A also influences this contact position 54. In mutant K32A, we observed in the measured X-ray crystallography structure that to some extent (60%) an interaction is not only mediated by water but also by a divalent magnesium ion (Mg 2 + ) (see Figure 4b and Supplementary Figure S3b for an omit map). The distance between D54s in K32A is slightly smaller compared to wild type, and the negatively charged carboxylate groups are able to coordinate Mg 2 + . In addition to the attractive interaction mediated by Mg 2 + , 2.7 ± 1.5 water molecules were counted to enforce the wet contact. We calculated the free energy change with and without alchemically inserting an Mg 2 + ion at the binding position (excluding its solvation free energy) and weighted according the occupancy measured in the X-ray crystallography experiments. Presumably the positively charged, flexible nearby lysine at position 32 (K32) disturbed the crystal contact in the wild type LbADH and substitution of K32 by small alanine (A32) enabled Mg 2 + binding. The situation completely changed for mutant D54F (see Figure 4c). The introduced phenylalanines at position 54 (F54s) increased the crystal contact area. The opposing side chains were close together (3.5 Å to 3.9 Å) and did not leave any space for water molecules. Only 1.3 ± 1.1 water molecules were observed in MD simulations. The chemical composition at the newly formed interface (threonine (T52), proline (P53), and phenylalanine (F54)) consisted of non-polar bound atoms. We generated a hydrophobic crystal contact which is considered to be a “dry contact”: water molecules are not present within but only around the contact interface [69].

3.5. Optimizing a Hydrogen Bonding Interaction

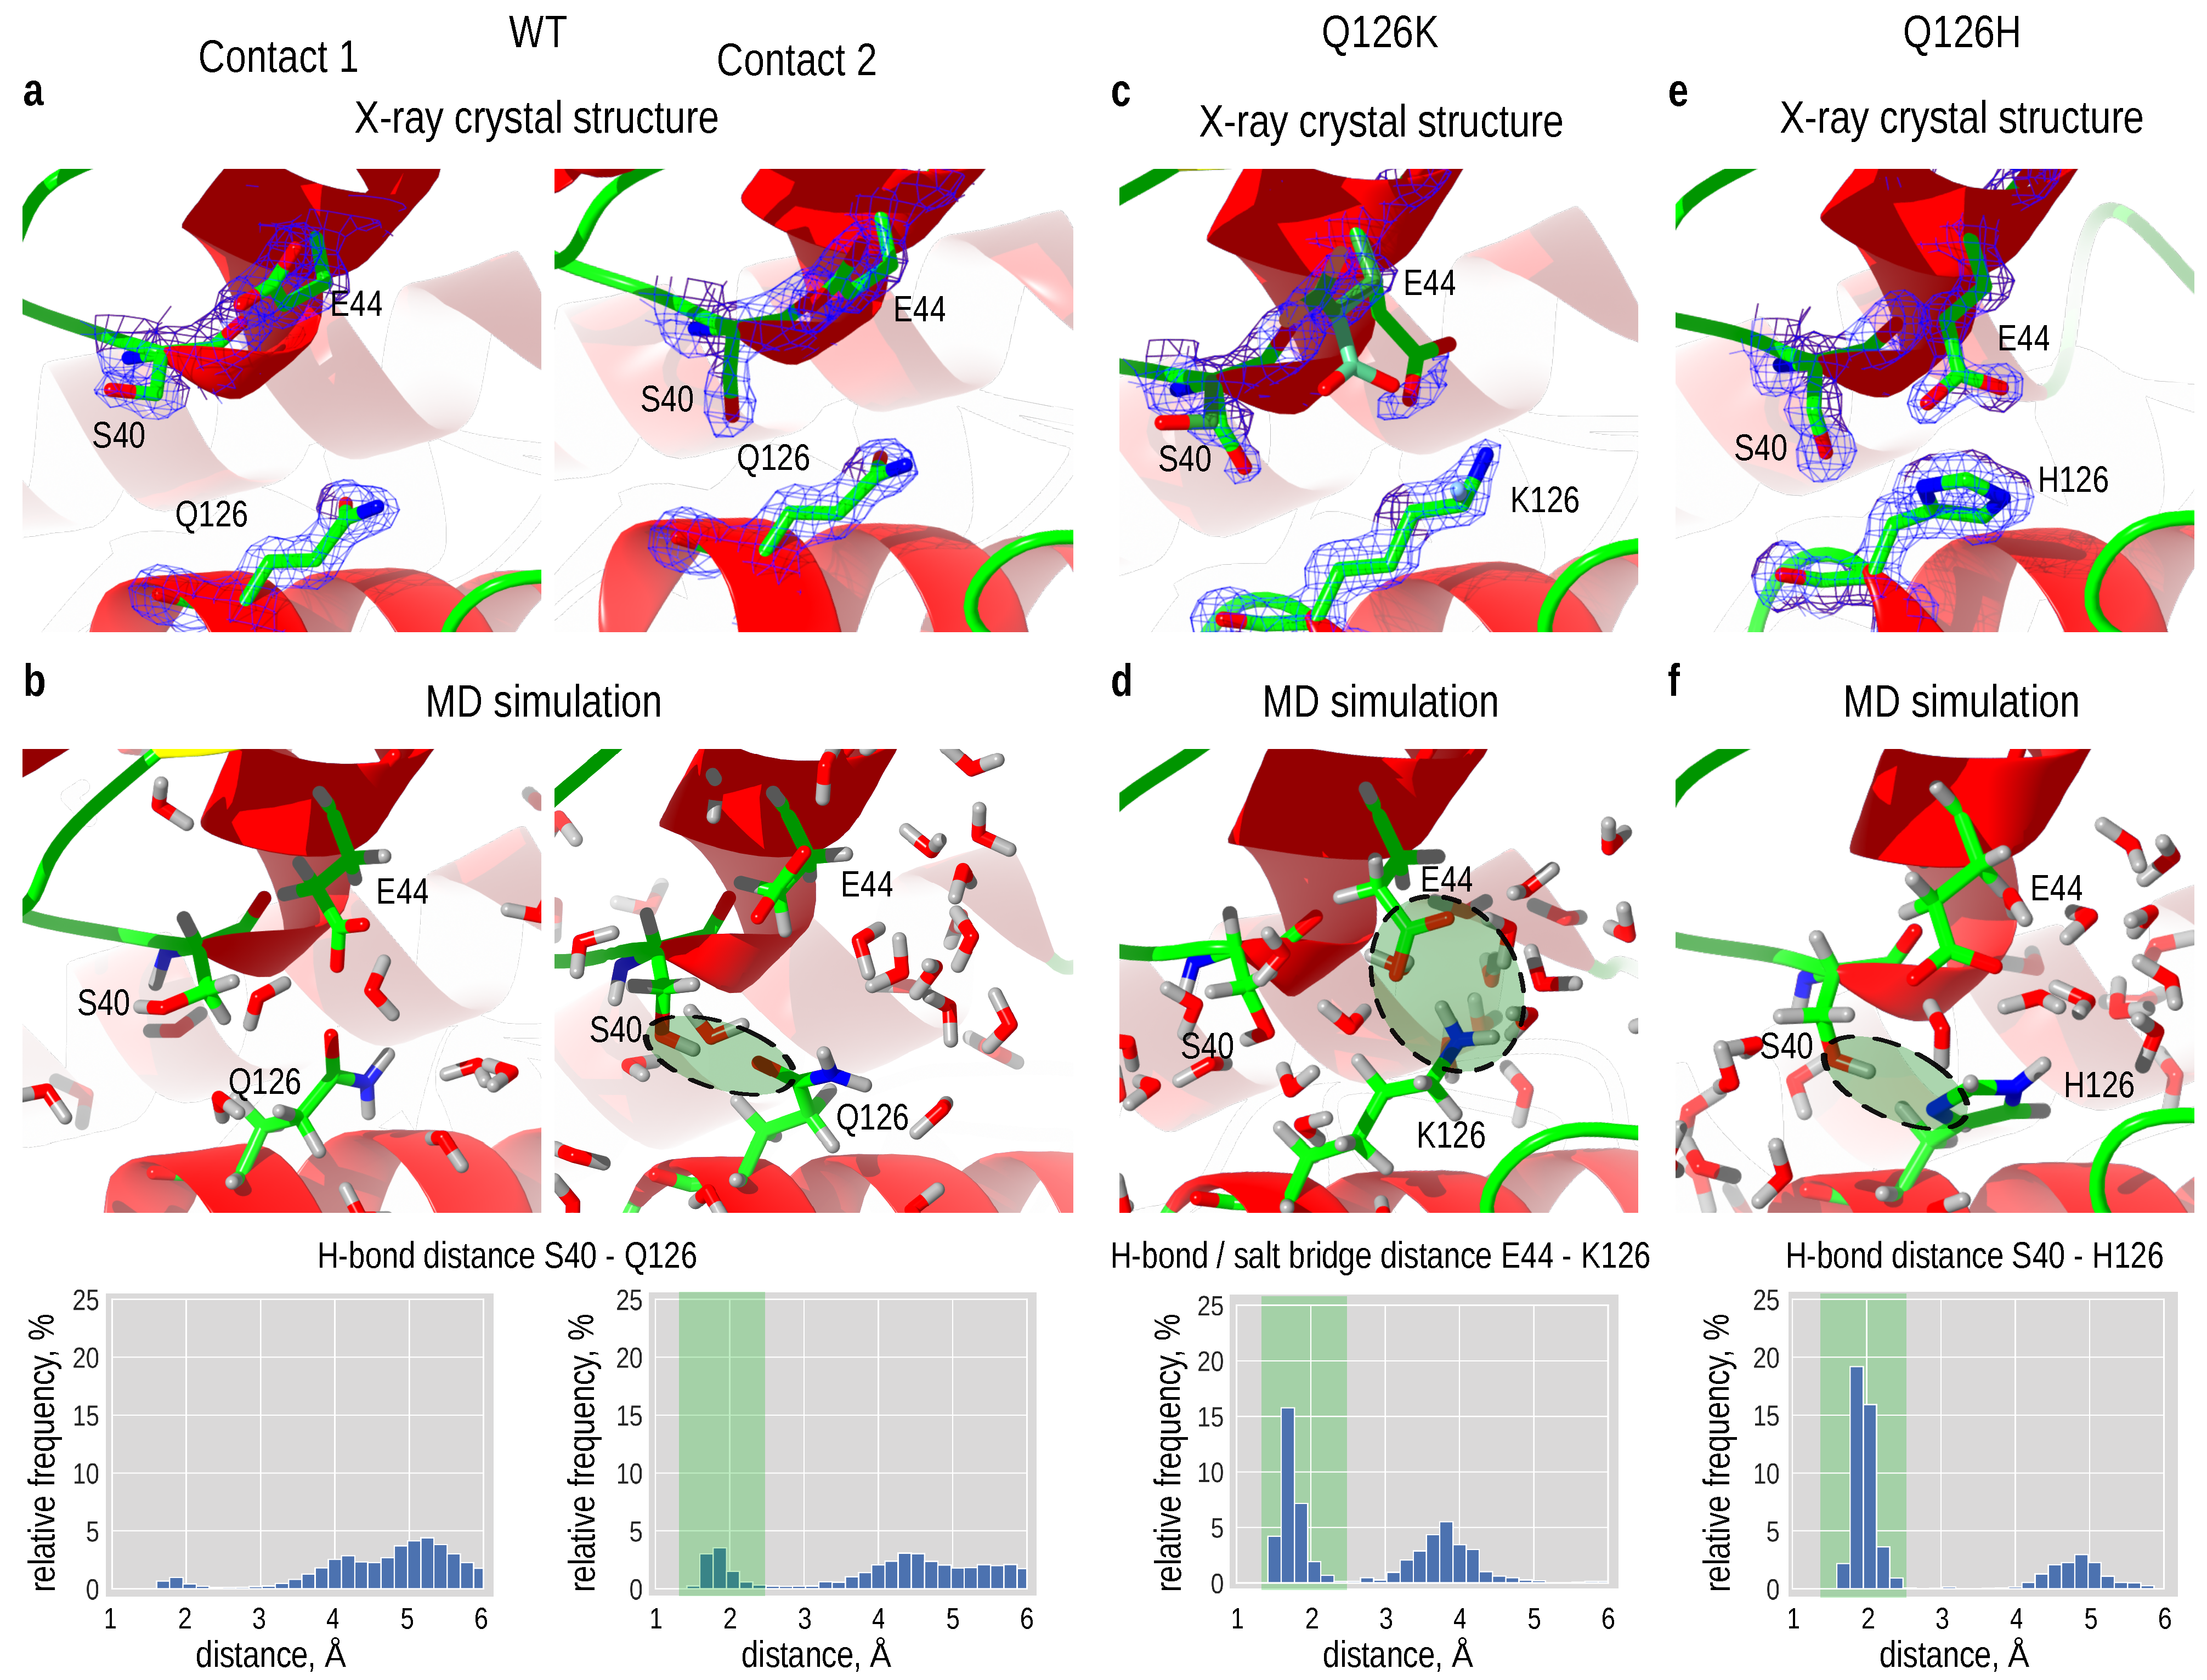
An example for hydrogen bond (H-bond) tuning at a crystal contact could be found at the corner contact at amino acid position 126. In MD simulations, we detected an H-bond between the hydroxy hydrogen of serine (S40) and the amide oxygen of glutamine (Q126). However, this bond was highly unstable. Assuming a maximum hydrogen bond distance of 2.5 Å, this conformation existed on average 8.8 ± 4.1 % of the time (Figure 5a,b). In mutant Q126K, which exhibited a slightly negative free energy change and experimentally slightly improved crystallization behavior, we detected an H-bond/salt bridge between ammonium group of lysine (K126) and carboxylate group of glutamate (E44) in 66.0 ± 7.7 % of the time (see Figure 5c,d). The situation is even better in mutant Q126H, which exhibited an even more negative free energy change value and a better experimental crystallization behavior: an H-bond between imidazole nitrogen of histidine (H126) and hydroxy hydrogen of S40 is present in 74.3 ± 7.3 % of the time (see Figure 5e,f). At this position, we could optimize the crystallization behavior by fine tuning hydrogen bonds.

3.6. Destroying Interactions

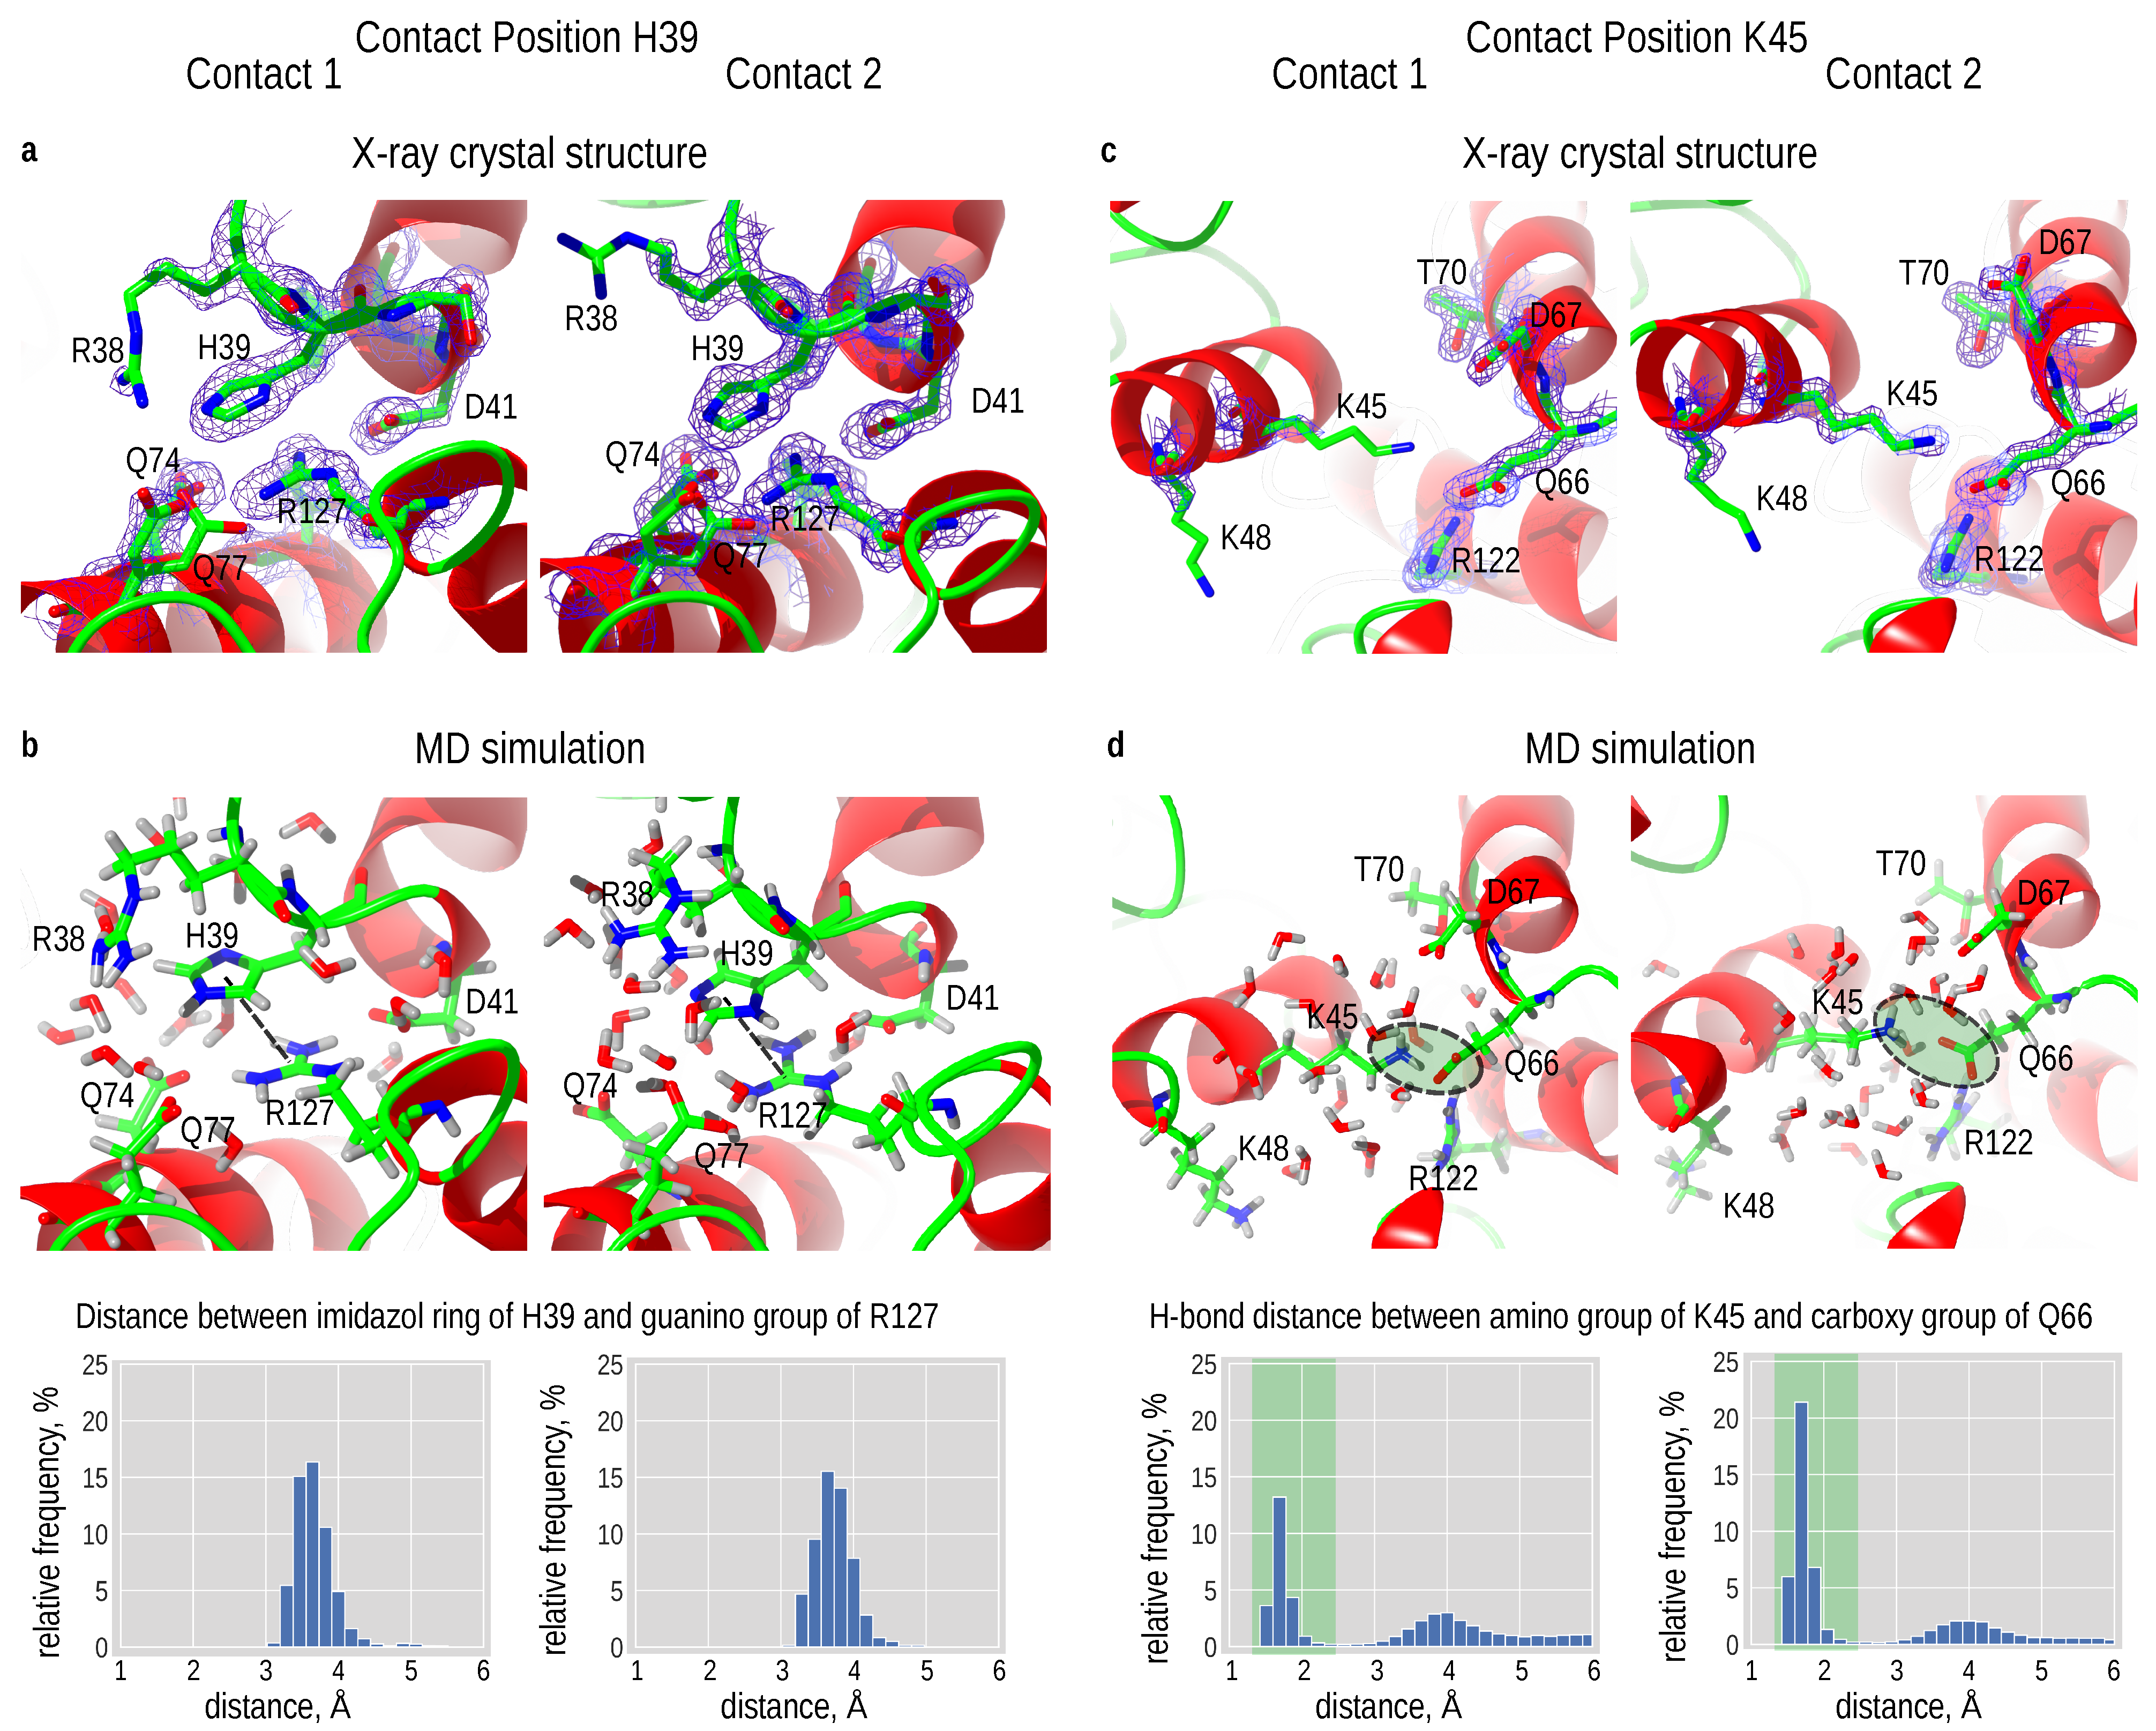
Both mutants, H39A and K45A, (targeting the corner contact) did not yield any crystals in our experiments and Δ Δ G calculations revealed a considerably positive value compared to wild type crystallization. H39 and K45 mediated attractive interactions in wild type LbADH: X-ray crystallography analysis and MD simulation revealed that histidine (H39) fills the space with nearby residues arginine (R38) and aspartic acid (D41) to the opposite side with glutamines (Q74 and Q77) and arginine (R127) with no place for water molecules in a “key/lock”-manner (see Figure 6a,b). The mean distance of 0.37 ± 0.03 Å between the imidazole ring of H39 and guanino group of R127 for both contacts indicated an attractive binding between those two groups [70]. X-ray crystallography analysis of wild type LbADH suggested an interaction of lysine K45 with opposite glutamine Q66. MD simulation revealed a moderate ( 39.5 ± 8.0 % of simulation time) and strong interaction ( 64.0 ± 8.5 % of the simulation time) in contact 1 and contact 2, respectively.
Mutant Q207D targeted the side contact. We calculated a positive free energy difference Δ Δ G which correlates with the experimentally observed reduced crystallizability. In wild type crystals, symmetry related glutamines (Q207) faced each other and were able to interact directly with each other. MD simulations showed that for 48.2 ± 8.8 % of the simulation time, oxygens and hydrogens of the amine groups are in hydrogen bond distance to each other (see Supporting Information Figure S4a,b). Mutating glutamine into aspartic acid destroys this interaction (see Supporting Information Figure S4c).

3.7. Introducing an Ionic Interaction

At the corner contact in wild type LbADH, unpolar short threonine (T102) is opposite to lysine (K48). The distance and chemical composition allowed no interaction. As stated, T102E has been identified as one of the best performers [47] and correlated with our free energy difference calculations. X-ray crystallography analysis and MD simulation of T102E revealed that the negatively charged carboxy group of glutamic acid E102 interacted with negatively charged carboxy group of lysine K48, which confirmed our previous suggestion [47]. This highly stable salt bridge occurred for 92.0 ± 5.1 % and 91.5 ± 7.3 % of the simulation time in contacts 1 and 2, respectively (see Supporting Information Figure S5).

4. Discussion

Our detailed X-ray crystallography structure analysis and atomistic MD simulations precisely revealed interactions at the crystal contact, leading to the calculated free energy difference characterizing the crystallization behavior of wild type alcohol dehydrogenase from Lactobacillus brevis (LbADH) and variants thereof. We determined an excellent qualitative correlation of our theoretically calculated free energy differences Δ Δ G and experimentally observed crystallization behavior. We were able to correlate Δ Δ G with crystallization behavior and to trace back and quantify the altered interactions. The free energy difference calculation relies on the end states of the crystal building blocks (solvated unbound and crystal bound states) and is independent of the pathway through the free energy landscape itself. Hence, in our case, the crystallization behavior of LbADH mutants is not dependent on the energy profile of the process itself but can be altered by changing the energy levels of the end states. Thermodynamically, we increased or decreased the stability of the crystals.
This can be viewed under the perspective of classical and two step nucleation and crystal growth. In classical nucleation theory (CNT), the crystal building blocks are attached to each other in the same orientation as found in a fully grown crystal, i.e., the building blocks bind to each other in the nucleation process via the same protein–protein interaction sites which are later seen as crystal contacts. The cluster formation is thermostatically determined by enthalpic gain due to the formation of new inter-molecular bonds, and an entropic loss due to formation of a cluster–liquid interface surface tension. At a critical cluster size, the free energy landscape reaches a local unstable maximum. Addition of one more building block will cause the nucleus to grow. In CNT, the nucleus formation is driven by oriented attachments of the building blocks. Enhancing or decreasing specific stabilizing interactions at the crystal contact may therefore facilitate or hamper growth of a critical nucleus. In the case of two step nucleation, crystal building blocks form a metastable dense cluster exhibiting an unordered structure before a crystalline ordered nucleus emerges within this cluster. Crystalline nucleus formation within this cluster relies—as for CNT—on oriented attachment. As this involves two processes (cluster formation and nucleus formation), two energy barriers can be rate defining. Studies have described the nucleation time being dependent on formation of the metastable phase [71], whereas newer publications found the formation of dense clusters has a much shorter time scale compared to nucleus formation in those clusters. Dense clusters were found to evolve instantaneously [72]. If crystallization took place in a two step nucleation process, our results suggest that the unordered metastable phase is not rate defining as we targeted and calculated interactions relevant to the second step. In crystal growth by two dimensional nucleation, nucleation of new step edges or nucleation islands on the crystal surface is followed by tangential growth and extension of step edges at the surface. At the latest, when the new surface layer is completed, i.e., the surface is flat, new step edges or islands have to be initiated by two-dimensional surface nucleation. At a high supersaturation level or with a small crystal size, two-dimensional growth islands originate randomly all over a crystal surface. With increasing crystal size and decreasing supersaturation level, two-dimensional surface nucleation becomes restricted to facet edges and, finally, to facet corners [19,23]. In spiral growth mode, which is energetically favored at low supersaturations, the step edges evolve from screw dislocations [24]. These dislocations serve as growth hillocks. Due to the spiral nature, these growth hillocks never disappear. Independent of the exact growth mechanism, a critical important step in both growth methods is the directed incorporation of crystal building blocks into the growing crystal in crystal symmetry order. Crystal building blocks that are not orderly bound would slow down the growth or would lead to an amorphous phase.
An interesting fact was found by Grob et al. [47], where the scalability and transferability was shown: enhanced crystallizing LbADH variants exhibited the same “crystallizabiltiy order” independent of crystallization with purified protein in static µL experiments or non-purified protein in stirred 5 mL crystallizers. This can be explained with the results from this study—not the attachment process itself, which is clearly different in both crystallization experiments, but the end states dictate the overall crystallization ability. In theory, specific interactions play a decisive role in both nucleation and crystal growth methods. Our results suggest that these processes are governed by direct interactions improving or decreasing crystal stability.
Our results may also impact protein engineering strategies. Surface entropy reduction (SER) was developed to facilitate crystallization for crystallographic purposes and relies on the substitution of large flexible charged amino acids by small alanines [31]. Large flexible charged residues (lysines, glutamines and glutamic acids) are replaced by small uncharged alanines to reduce a protein’s “entropy shield” and generate hydrophobic patches at the proteins surface [28,29,30,31,32]. Incorporating and ordering large flexible side chains at crystal contacts require more entropic effort compared to small side chains. Furthermore, the entropic gain due to release of ordered water molecules during crystallization is improved. Water molecules are more easily ordered at surfaces patches with small side chains, while flexible side chains prevent ordering. This is also viewed empirically, as aspartic acid, glutamic acid, and lysine are the most depleted amino acids in biological protein–protein interfaces [73,74]. In general, it was found that large hydrophobic and uncharged polar residues are abundant, whereas charged residues are depleted at biological interfaces [73,75,76,77,78]. In a study with homodimers, heterodimers and multimers, Bordner et al. found the ten most abundant amino acids to be phenylalanine, cysteine, leucine, methionine, isoleucine, tyrosine, tryptophan, valine, and histidine [73]. In our study, we could not identify a preference of dry (hydrophobic) or wet (electrostatic) crystal contacts. In fact, the two identified best performers D54F and T102E rely on hydrophobic and electrostatic interactions, respectively. Mutating lysine into alanine in mutant K45A actually destroys a crystal contact and produces non-crystallizable protein. Introducing lysine at position 126 in mutant Q126K enhances the crystallization compared to the wild type LbADH. SER has proven to successfully produce crystallizable variants of non-crystallizable wild type proteins for crystallographic purposes [30]. However, our results suggest that in cases where a crystallizable protein is engineered—in particular for technical crystallization purposes—specific interactions should be modified.

5. Conclusions

Molecular dynamics (MD) free energy simulations enabled an in silico determination of a protein’s contact stability, which correlated with the protein’s experimentally determined crystallizability. The identified physical origins of the observed crystallizbility suggest that there are no simple, universal rules for an accurate control of the crystallization behavior, in particular for proteins that already crystallize. However, the success of the protein engineering can be evaluated in silico by free energy change calculations. Especially in the case of technical protein crystallization, the effort of the MD calculations is justified by circumventing costly, conventional chromatographic purification methods. Further improved high-throughput calculation methods may lead to model based engineering that generally reduces elaborate experimental work in crystallization screens.

Supplementary Materials

The following are available online at https://www.mdpi.com/article/10.3390/cryst11060588/s1, Supporting Information S1–S10: Supporting Information for Controlling Protein Crystallization by Free Energy Guided Design of Interactions at Crystal Contacts.

Author Contributions

P.G. conducted protein mutagenesis, production and crystallization. R.J. and D.N. provided the crystallography platform and performed X-ray diffraction experiments. D.B. and J.H. reduced diffraction data and refined X-ray crystallography structures. J.H. conducted MD simulations and calculations. M.Z., D.B. and J.H. analyzed the data. J.H. wrote the manuscript. D.W.-B. and D.H. supervised the project. All authors have read and agreed to the published version of the manuscript.

Funding

This research was funded by the German Research Foundation (DFG): research project WE2715/14-1 within the framework of priority program SPP 1934. Support of J.H., D.B. and P.G. by the TUM Graduate School is gratefully acknowledged.

Data Availability Statement

All X-ray crystal structure data in this study have been deposited and are available in the Protein Data Bank under the accession codes 6h07, 6hlf, 6y1c, 6y10, 6y0z, 6y0s, 7a2b. All other data generated or analyzed during this study are included in this article and the Supplementary Information or are available from the corresponding author upon reasonable request.

Acknowledgments

The authors thank Maria Reif (Chair of Biophysics (T38)-Biomolecular Dynamics, Technical University Munich, Garching, Germany) for valuable comments on the manuscript. The experimental support of Brigitte Walla (Institute of Biochemical Engineering, Technical University Munich, Garching, Germany) is gratefully acknowledged. The authors thank the X-ray Crystallography Platform at Helmholtz Zentrum München. Computer resources for this project were provided by the Gauss Centre for Supercomputing/Leibnitz Supercomputing Centre, Garching, Germany, under grant pr62ci.

Conflicts of Interest

The authors declare no conflict of interest.

Graphical Preparation

All figures were prepared with CCP4mg [79] and Inkscape version 1.0.

References

  1. Doye, J.P.; Louis, A.A.; Vendruscolo, M. Inhibition of protein crystallization by evolutionary negative design. Phys. Biol. 2004, 1, P9–P13. [Google Scholar] [CrossRef] [Green Version]
  2. Siezen, R.J.; Fisch, M.R.; Slingsby, C.; Benedek, G.B. Opacification of gamma-crystallin solutions from calf lens in relation to cold cataract formation. Proc. Natl. Acad. Sci. USA 1985, 82, 1701–1705. [Google Scholar] [CrossRef] [PubMed] [Green Version]
  3. Pande, A.; Pande, J.; Asherie, N.; Lomakin, A.; Ogun, O.; King, J.; Benedek, G.B. Crystal cataracts: Human genetic cataract caused by protein crystallization. Proc. Natl. Acad. Sci. USA 2001, 98, 6116–6120. [Google Scholar] [CrossRef] [PubMed] [Green Version]
  4. Lessin, L.S.; Jensen, W.N.; Ponder, E. Molecular mechanism of hemolytic anemia in homozygous hemoglobin C disease: Electron microscopic study by the freeze-etching technique. J. Exp. Med. 1969, 130, 443–466. [Google Scholar] [CrossRef] [PubMed] [Green Version]
  5. Charcot, J.M.; Robin, C. Observation of leukocytosis. TCRMem. Soc. Biol. 1853, 4, 450–454. [Google Scholar]
  6. von Leyden, E.V. Zur Kenntnis des Asthma bronchiale. Arch. Pathol. Anat. Physiol. Klin. Med. Berl. 1872, 54, 324–344; 346–352. [Google Scholar] [CrossRef] [Green Version]
  7. Schnepf, E.; Crickmore, N.; Van Rie, J.; Lereclus, D.; Baum, J.; Feitelson, J.; Zeigler, D.; Dean, D. Bacillus thuringiensis and its pesticidal crystal proteins. Microbiol. Mol. Biol. Rev. 1998, 62, 775–806. [Google Scholar] [CrossRef] [Green Version]
  8. Perutz, M.F.; Rossmann, M.G.; Cullis, A.F.; Muirhead, H.; Will, G.; North, A. Structure of hæmoglobin: A three-dimensional Fourier synthesis at 5.5-Å. resolution, obtained by X-ray analysis. Nature 1960, 185, 416–422. [Google Scholar] [CrossRef]
  9. Kendrew, J.C.; Bodo, G.; Dintzis, H.M.; Parrish, R.; Wyckoff, H.; Phillips, D.C. A three-dimensional model of the myoglobin molecule obtained by X-ray analysis. Nature 1958, 181, 662–666. [Google Scholar] [CrossRef]
  10. Osborne, T.B. Crystallized vegetable proteids. Am. J. Physiol. 1892, 14, 662–689. [Google Scholar]
  11. Ritthausen, H.; Kellner, O. Über die Eiweisskörper verschiedener Oelsamen. Z. Anal. Chem. 1882, 21, 461–462. [Google Scholar] [CrossRef] [Green Version]
  12. Ritthausen, H. Krystallinische Eiweisskörper aus verschiedenen Oelsamen. J. Prakt. Chem. 1881, 23, 481–486. [Google Scholar] [CrossRef]
  13. Hekmat, D. Large-scale crystallization of proteins for purification and formulation. Bioprocess Biosyst. Eng. 2015, 38, 1209–1231. [Google Scholar] [CrossRef] [PubMed]
  14. Basu, S.K.; Govardhan, C.P.; Jung, C.W.; Margolin, A.L. Protein crystals for the delivery of biopharmaceuticals. Expert Opin. Biol. Ther. 2004, 4, 301–317. [Google Scholar] [CrossRef] [PubMed]
  15. Gibbs, J.W. On the Equilibrium of Heterogeneous Systems, Part II. Trans. Conn. Acad. Sci. 1878, 3, 343–524. [Google Scholar]
  16. Volmer, M.; Weber, A. Nucleus Formation in Supersaturated Systems. Z. Phys. Chem. 1926, 119, 277–301. [Google Scholar]
  17. Becker, R.; Döring, W. Kinetische behandlung der keimbildung in übersättigten dämpfen. Ann. Phys. 1935, 416, 719–752. [Google Scholar] [CrossRef]
  18. ten Wolde, P.R.; Frenkel, D. Enhancement of protein crystal nucleation by critical density fluctuations. Science 1997, 277, 1975–1978. [Google Scholar] [CrossRef] [PubMed] [Green Version]
  19. Malkin, A.; Kuznetsov, Y.G.; Land, T.; DeYoreo, J.; McPherson, A. Mechanisms of growth for protein and virus crystals. Nat. Struct. Biol. 1995, 2, 956–959. [Google Scholar] [CrossRef]
  20. McPherson, A.; Malkin, A.; Kuznetsov, Y.G.; Plomp, M. Atomic force microscopy applications in macromolecular crystallography. Acta Crystallogr. Sect. D Biol. Crystallogr. 2001, 57, 1053–1060. [Google Scholar] [CrossRef] [Green Version]
  21. McPherson, A.; Kuznetsov, Y.G.; Malkin, A.; Plomp, M. Macromolecular crystal growth as revealed by atomic force microscopy. J. Struct. Biol. 2003, 142, 32–46. [Google Scholar] [CrossRef] [Green Version]
  22. Vekilov, P.G.; Chernov, A.A. The physics of protein crystallization. In Solid State Physics; Elsevier: Amsterdam, The Netherlands, 2003; Volume 57, pp. 1–147. [Google Scholar]
  23. Vekilov, P.; Rosenberger, F. Dependence of lysozyme growth kinetics on step sources and impurities. J. Cryst. Growth 1996, 158, 540–551. [Google Scholar] [CrossRef]
  24. Burton, W.K.; Cabrera, N.; Frank, F. The growth of crystals and the equilibrium structure of their surfaces. Philos. Trans. R. Soc. London. Ser. A Math. Phys. Sci. 1951, 243, 299–358. [Google Scholar]
  25. Durbin, S.; Feher, G. Crystal growth studies of lysozyme as a model for protein crystallization. J. Cryst. Growth 1986, 76, 583–592. [Google Scholar] [CrossRef]
  26. Schmit, J.D.; Dill, K. Growth rates of protein crystals. J. Am. Chem. Soc. 2012, 134, 3934–3937. [Google Scholar] [CrossRef] [PubMed] [Green Version]
  27. Luft, J.R.; Snell, E.H.; DeTitta, G.T. Lessons from high-throughput protein crystallization screening: 10 years of practical experience. Expert Opin. Drug Discov. 2011, 6, 465–480. [Google Scholar] [CrossRef]
  28. Goldschmidt, L.; Cooper, D.R.; Derewenda, Z.S.; Eisenberg, D. Toward rational protein crystallization: A Web server for the design of crystallizable protein variants. Protein Sci. 2007, 16, 1569–1576. [Google Scholar] [CrossRef] [Green Version]
  29. Derewenda, Z.S. Rational protein crystallization by mutational surface engineering. Structure 2004, 12, 529–535. [Google Scholar] [CrossRef] [Green Version]
  30. Derewenda, Z.S. Application of protein engineering to enhance crystallizability and improve crystal properties. Acta Crystallogr. Sect. D Biol. Crystallogr. 2010, 66, 604–615. [Google Scholar] [CrossRef] [Green Version]
  31. Cooper, D.R.; Boczek, T.; Grelewska, K.; Pinkowska, M.; Sikorska, M.; Zawadzki, M.; Derewenda, Z. Protein crystallization by surface entropy reduction: Optimization of the SER strategy. Acta Crystallogr. Sect. D Biol. Crystallogr. 2007, 63, 636–645. [Google Scholar] [CrossRef]
  32. Derewenda, Z.S.; Vekilov, P.G. Entropy and surface engineering in protein crystallization. Acta Crystallogr. Sect. D Biol. Crystallogr. 2006, 62, 116–124. [Google Scholar] [CrossRef]
  33. Hermann, J.; Nowotny, P.; Schrader, T.E.; Biggel, P.; Hekmat, D.; Weuster-Botz, D. Neutron and X-ray crystal structures of Lactobacillus brevis alcohol dehydrogenase reveal new insights into hydrogen-bonding pathways. Acta Crystallogr. Sect. F Struct. Biol. Commun. 2018, 74, 754–764. [Google Scholar] [CrossRef] [PubMed]
  34. Yau, S.T.; Vekilov, P.G. Quasi-planar nucleus structure in apoferritin crystallization. Nature 2000, 406, 494–497. [Google Scholar] [CrossRef] [PubMed]
  35. Shaw, D.E.; Maragakis, P.; Lindorff-Larsen, K.; Piana, S.; Dror, R.O.; Eastwood, M.P.; Bank, J.A.; Jumper, J.M.; Salmon, J.K.; Shan, Y.; et al. Atomic-level characterization of the structural dynamics of proteins. Science 2010, 330, 341–346. [Google Scholar] [CrossRef] [PubMed] [Green Version]
  36. Kutzner, C.; Páll, S.; Fechner, M.; Esztermann, A.; de Groot, B.L.; Grubmüller, H. More bang for your buck: Improved use of GPU nodes for GROMACS 2018. J. Comput. Chem. 2019, 40, 2418–2431. [Google Scholar] [CrossRef] [Green Version]
  37. Goetz, A.W.; Williamson, M.J.; Xu, D.; Poole, D.; Le Grand, S.; Walker, R.C. Routine microsecond molecular dynamics simulations with AMBER on GPUs. 1. Generalized born. J. Chem. Theory Comput. 2012, 8, 1542–1555. [Google Scholar] [CrossRef] [PubMed]
  38. Salomon-Ferrer, R.; Gooetz, A.W.; Poole, D.; Le Grand, S.; Walker, R.C. Routine microsecond molecular dynamics simulations with AMBER on GPUs. 2. Explicit solvent particle mesh Ewald. J. Chem. Theory Comput. 2013, 9, 3878–3888. [Google Scholar] [CrossRef] [PubMed]
  39. Brünger, A.T.; Kuriyan, J.; Karplus, M. Crystallographic R factor refinement by molecular dynamics. Science 1987, 235, 458–460. [Google Scholar] [CrossRef]
  40. Cerutti, D.S.; Freddolino, P.L.; Duke, R.E., Jr.; Case, D.A. Simulations of a protein crystal with a high resolution X-ray structure: Evaluation of force fields and water models. J. Phys. Chem. B 2010, 114, 12811–12824. [Google Scholar] [CrossRef] [Green Version]
  41. Janowski, P.A.; Liu, C.; Deckman, J.; Case, D.A. Molecular dynamics simulation of triclinic lysozyme in a crystal lattice. Protein Sci. 2016, 25, 87–102. [Google Scholar] [CrossRef] [Green Version]
  42. Stocker, U.; Spiegel, K.; van Gunsteren, W. On the similarity of properties in solution or in the crystalline state: A molecular dynamics study of hen lysozyme. J. Biomol. NMR 2000, 18, 1–12. [Google Scholar] [CrossRef] [PubMed]
  43. Hummel, W. New alcohol dehydrogenases for the synthesis of chiral compounds. In New Enzymes for Organic Synthesis; Springer: Cham, Switzerland, 1997; pp. 145–184. [Google Scholar]
  44. Niefind, K.; Müller, J.; Riebel, B.; Hummel, W.; Schomburg, D. The crystal structure of R-specific alcohol dehydrogenase from Lactobacillus brevis suggests the structural basis of its metal dependency. J. Mol. Biol. 2003, 327, 317–328. [Google Scholar] [CrossRef]
  45. Schlieben, N.H.; Niefind, K.; Müller, J.; Riebel, B.; Hummel, W.; Schomburg, D. Atomic resolution structures of R-specific alcohol dehydrogenase from Lactobacillus brevis provide the structural bases of its substrate and cosubstrate specificity. J. Mol. Biol. 2005, 349, 801–813. [Google Scholar] [CrossRef]
  46. Nowotny, P.; Hermann, J.; Li, J.; Krautenbacher, A.; Kloepfer, K.; Hekmat, D.; Weuster-Botz, D. Rational Crystal Contact Engineering of Lactobacillus brevis Alcohol Dehydrogenase To Promote Technical Protein Crystallization. Cryst. Growth Des. 2019, 19, 2380–2387. [Google Scholar] [CrossRef]
  47. Grob, P.; Huber, M.; Walla, B.; Hermann, J.; Janowski, R.; Niessing, D.; Hekmat, D.; Weuster-Botz, D. Crystal Contact Engineering Enables Efficient Capture and Purification of an Oxidoreductase by Technical Crystallization. Biotechnol. J. 2020, 15, 2000010. [Google Scholar] [CrossRef]
  48. Zheng, L.; Baumann, U.; Reymond, J.L. An efficient one-step site-directed and site-saturation mutagenesis protocol. Nucleic Acids Res. 2004, 32, e115. [Google Scholar] [CrossRef] [PubMed] [Green Version]
  49. Kabsch, W. Xds. Acta Crystallogr. Sect. D Biol. Crystallogr. 2010, 66, 125–132. [Google Scholar] [CrossRef] [Green Version]
  50. Evans, P. Scaling and assessment of data quality. Acta Crystallogr. Sect. D Biol. Crystallogr. 2006, 62, 72–82. [Google Scholar] [CrossRef]
  51. Collaborative, C.P. The CCP4 suite: Programs for protein crystallography. Acta Crystallographica. Sect. D Biol. Crystallogr. 1994, 50, 760. [Google Scholar]
  52. McCoy, A.J.; Grosse-Kunstleve, R.W.; Adams, P.D.; Winn, M.D.; Storoni, L.C.; Read, R.J. Phaser crystallographic software. J. Appl. Crystallogr. 2007, 40, 658–674. [Google Scholar] [CrossRef] [Green Version]
  53. Murshudov, G.N.; Vagin, A.A.; Dodson, E.J. Refinement of macromolecular structures by the maximum-likelihood method. Acta Crystallogr. Sect. D Biol. Crystallogr. 1997, 53, 240–255. [Google Scholar] [CrossRef] [PubMed]
  54. Emsley, P.; Lohkamp, B.; Scott, W.G.; Cowtan, K. Features and development of Coot. Acta Crystallogr. Sect. D Biol. Crystallogr. 2010, 66, 486–501. [Google Scholar] [CrossRef] [PubMed] [Green Version]
  55. Vanommeslaeghe, K.; Hatcher, E.; Acharya, C.; Kundu, S.; Zhong, S.; Shim, J.; Darian, E.; Guvench, O.; Lopes, P.; Vorobyov, I. CHARMM general force field: A force field for drug-like molecules compatible with the CHARMM all-atom additive biological force fields. J. Comput. Chem. 2010, 31, 671–690. [Google Scholar] [CrossRef] [PubMed] [Green Version]
  56. Huang, J.; Rauscher, S.; Nawrocki, G.; Ran, T.; Feig, M.; de Groot, B.L.; Grubmüller, H.; MacKerell, A. CHARMM36m: An improved force field for folded and intrinsically disordered proteins. Nat. Methods 2017, 14, 71–73. [Google Scholar] [CrossRef] [PubMed] [Green Version]
  57. Jorgensen, W.L.; Chandrasekhar, J.; Madura, J.D.; Impey, R.W.; Klein, M.L. Comparison of simple potential functions for simulating liquid water. J. Chem. Phys. 1983, 79, 926–935. [Google Scholar] [CrossRef]
  58. Berendsen, H.J.; van der Spoel, D.; van Drunen, R. GROMACS: A message-passing parallel molecular dynamics implementation. Comput. Phys. Commun. 1995, 91, 43–56. [Google Scholar] [CrossRef]
  59. Abraham, M.J.; Murtola, T.; Schulz, R.; Páll, S.; Smith, J.C.; Hess, B.; Lindahl, E. GROMACS: High performance molecular simulations through multi-level parallelism from laptops to supercomputers. SoftwareX 2015, 1, 19–25. [Google Scholar] [CrossRef] [Green Version]
  60. Bussi, G.; Donadio, D.; Parrinello, M. Canonical sampling through velocity rescaling. J. Chem. Phys. 2007, 126, 014101. [Google Scholar] [CrossRef] [Green Version]
  61. Hess, B.; Bekker, H.; Berendsen, H.J.; Fraaije, J.G. LINCS: A linear constraint solver for molecular simulations. J. Comput. Chem. 1997, 18, 1463–1472. [Google Scholar] [CrossRef]
  62. Essmann, U.; Perera, L.; Berkowitz, M.L.; Darden, T.; Lee, H.; Pedersen, L.G. A smooth particle mesh Ewald method. J. Chem. Phys. 1995, 103, 8577–8593. [Google Scholar] [CrossRef] [Green Version]
  63. Darden, T.; York, D.; Pedersen, L. Particle mesh Ewald: An N log (N) method for Ewald sums in large systems. J. Chem. Phys. 1993, 98, 10089–10092. [Google Scholar] [CrossRef] [Green Version]
  64. Páll, S.; Hess, B. A flexible algorithm for calculating pair interactions on SIMD architectures. Comput. Phys. Commun. 2013, 184, 2641–2650. [Google Scholar] [CrossRef] [Green Version]
  65. Gapsys, V.; Michielssens, S.; Seeliger, D.; de Groot, B.L. pmx: Automated protein structure and topology generation for alchemical perturbations. J. Comput. Chem. 2015, 36, 348–354. [Google Scholar] [CrossRef] [Green Version]
  66. Gapsys, V.; de Groot, B.L. pmx Webserver: A User Friendly Interface for Alchemistry. J. Chem. Inf. Model. 2017, 57, 109–114. [Google Scholar] [CrossRef] [Green Version]
  67. Bennett, C.H. Efficient estimation of free energy differences from Monte Carlo data. J. Comput. Phys. 1976, 22, 245–268. [Google Scholar] [CrossRef]
  68. Chen, W.; Deng, Y.; Russell, E.; Wu, Y.; Abel, R.; Wang, L. Accurate calculation of relative binding free energies between ligands with different net charges. J. Chem. Theory Comput. 2018, 14, 6346–6358. [Google Scholar] [CrossRef]
  69. Janin, J. Wet and dry interfaces: The role of solvent in protein–protein and protein–DNA recognition. Structure 1999, 7, R277–R279. [Google Scholar] [CrossRef] [Green Version]
  70. Heyda, J.; Mason, P.E.; Jungwirth, P. Attractive interactions between side chains of histidine-histidine and histidine-arginine-based cationic dipeptides in water. J. Phys. Chem. B 2010, 114, 8744–8749. [Google Scholar] [CrossRef]
  71. Kashchiev, D.; Vekilov, P.G.; Kolomeisky, A.B. Kinetics of two-step nucleation of crystals. J. Chem. Phys. 2005, 122, 244706. [Google Scholar] [CrossRef]
  72. Vekilov, P.G. The two-step mechanism of nucleation of crystals in solution. Nanoscale 2010, 2, 2346–2357. [Google Scholar] [CrossRef]
  73. Bordner, A.J.; Abagyan, R. Statistical analysis and prediction of protein–protein interfaces. Proteins Struct. Funct. Bioinform. 2005, 60, 353–366. [Google Scholar] [CrossRef]
  74. Conte, L.L.; Chothia, C.; Janin, J. The atomic structure of protein-protein recognition sites. J. Mol. Biol. 1999, 285, 2177–2198. [Google Scholar] [CrossRef] [PubMed] [Green Version]
  75. Chakrabarti, P.; Janin, J. Dissecting protein–protein recognition sites. Proteins: Struct. Funct. Bioinform. 2002, 47, 334–343. [Google Scholar] [CrossRef]
  76. Bahadur, R.P.; Chakrabarti, P.; Rodier, F.; Janin, J. A dissection of specific and non-specific protein–protein interfaces. J. Mol. Biol. 2004, 336, 943–955. [Google Scholar] [CrossRef] [PubMed]
  77. Jones, S.; Thornton, J.M. Principles of protein-protein interactions. Proc. Natl. Acad. Sci. USA 1996, 93, 13–20. [Google Scholar] [CrossRef] [PubMed] [Green Version]
  78. Ofran, Y.; Rost, B. Analysing six types of protein–protein interfaces. J. Mol. Biol. 2003, 325, 377–387. [Google Scholar] [CrossRef]
  79. McNicholas, S.; Potterton, E.; Wilson, K.; Noble, M. Presenting your structures: The CCP4mg molecular-graphics software. Acta Crystallogr. Sect. D Biol. Crystallogr. 2011, 67, 386–394. [Google Scholar] [CrossRef] [PubMed] [Green Version]
Figure 1. Crystal packing and crystallographic unit cell (UC) of LbADH. UC is drawn in black. The two tetramers building the UC are opaque; adjacent UCs are semi-transparent. (a) The view in the b-c-plane shows the “edge contact” and the “corner contacts”. In space group P 2 1 22 1 “corner contact 1” and “corner contact 2” structurally slightly differ as the two tetramers are rotated with respect to each other around the b-axis (e.g., 5 in wild type LbADH). In space group I222, the two tetramers are translationally invariant and therefore the “corner contacts” coincide (see Supplementary Table S4 for an overview of LbADH variant space groups). (b) The view in the a-c-plane shows the third crystal contact: the “side contact” between two tetramers.
Crystals 11 00588 g001
Figure 2. Crystallization experiments of LbADH wild type (WT) and Q207D. (a,b) crystallization under standard condition (5 g L 1 LbADH and 75 g L 1 PEG 550 MME at 20 °C) and (c,d) at increased protein and PEG concentrations (10 g L 1 LbADH and 100 g L 1 PEG 550 MME at 20 °C). Q207D (b,d) showed reduced crystallizability compared to wild type (a,c). Microphotographs were taken after 24 h and are representative of the ten crystallization droplets for each variant and each condition.
Crystals 11 00588 g002
Figure 3. Free energy difference calculation. (a) Thermodynamic cycle for crystallization of wild type and mutant protein. A negative free energy difference between mutant (Mut) Δ G crystallization Mut and wild type (WT) Δ G crystallization WT crystallization ( Δ Δ G = Δ G crystallization Mut Δ G crystallization WT ) denotes a thermodynamic favor of mutant over wild type crystallization. As both values are not accessible by simulation, we calculate the numerically equivalent free energy difference as Δ Δ G = Δ G crystal WT Mut Δ G solvated WT Mut . Both individual values are accessible in free energy simulations in which the solvated unbound wild type is alchemically transformed into solvated mutant protein ( Δ G solvated WT Mut ) and the crystal bound wild type into crystal bound mutant protein ( Δ G crystal WT Mut ) (see Supporting Information Section S5 for more details). (b) Free energy change Δ Δ G for wild type vs. mutant crystallization. Green and blue bars indicate calculation in mutant and wild type crystal packing, respectively.
Crystals 11 00588 g003
Figure 4. X-ray crystal structure of the edge contact for wild type, K32A, and D54F. The protein surface is displayed as transparent. (a) In wild type crystals, the polar side chains leave enough space to enable water mediated interactions across the crystal contact interfaces (wet contact). (b) In K32A crystals, the crystal contacts are in closer proximity, allowing additional coordination of an Mg 2 + ion. (c) In D54F crystals, nonpolar chains are in direct contact with no space for water molecules (dry contact). All distances are given in Å.
Crystals 11 00588 g004
Figure 5. X-ray crystallography structure and MD simulation analysis of the corner contact around amino acid position 126 for wild type LbADH, Q126K, and Q126H crystals. (a) X-ray crystallography structure of corner crystal contacts 1 and 2 in wild type crystals with measured electron density map shown in blue for displayed residues. (b) MD simulation and analysis of bonding distance between hydroxy hydrogen of serine (S40) and amide oxygen of glutamine (Q126). In contact 1, almost no hydrogen bond (H-bond) interactions ( 0.77 ± 0.43 % of the simulation time) could be found. In contact 2, for 16.80 ± 8.11 % of the simulation time an H-bond existed. H-bond distance (<2.5 Å) is dyed green. (c) X-ray crystal structure of Q126K. Different side chain conformations are displayed in different shades. (d) MD simulation revealed an H-bond/salt bridge between positively charged ammonium group of lysine (K126) and negatively charged carboxylate group of glutamate (E44) in 66.0 ± 7.7 % of the time. (e) X-ray crystal structure of Q126H. (f) The most stable H-bond could be found in Q126H between imidazole nitrogen of histidine (H126) and hydroxy hydrogen of serin (S40), which was present for 74.3 ± 7.3 % of the time. Note: As Q126K and Q126H diffract in space group I222, “contact 1” and “contact 2” coincide. Electron density maps are calculated with structure factor amplitude difference 2 F o F c and contoured at 1.0 σ .
Crystals 11 00588 g005
Figure 6. X-ray crystallography structure and MD simulation analysis of corner contact 1 and 2 around H39 and K45 for wild type crystals. (a) X-ray crystallography structure of crystal contact around H39. Relevant nearby residues are displayed with measured electron density shown in blue. (b) Snapshot from MD simulation trajectory including nearby water molecules and analysis of the center of geometry (COG) distances between imidazole ring of H39 and guanino group of R127. The average binding distance is 0.37 ± 0.03 Å in both cases. (c) X-ray crystallography structure of crystal contact around K45. Relevant residues are displayed with measured electron density shown in blue. (d) Snapshot from MD simulation trajectory including nearby water molecules and analysis of the minimum distance between the positive amino group of K45 and negative carboxy group of Q66 (circled in green). Distance values in H-bond distance (<2.5 Å) (dyed in green) occurred for 39.5 ± 8.0 % (contact 1) and 64.0 ± 8.5 % (contact 2) of the time. Electron density maps are calculated with structure factor amplitude difference 2 F o F c and contoured at 1.0 σ .
Crystals 11 00588 g006
Publisher’s Note: MDPI stays neutral with regard to jurisdictional claims in published maps and institutional affiliations.