
Phase Relations of Earth’s Core-Forming Materials

Abstract
1. Introduction
2. Theoretical Background
2.1. Equation of State
2.2. Thermodynamics
3. Phase Relations
3.1. Major Components
3.1.1. Fe
- The fcc-hcp Transition Boundary
- The Stable Structure in the Inner Core
- The Melting Point at the ICB Pressure, 330 GPa
- An Integrated Thermodynamic Model
- Liquid Properties under Core Conditions
3.1.2. Fe-Ni
- The fcc-hcp Transition Boundary
- The Stable Structure in the Inner Core
- The Melting Point at the ICB
3.2. Binary Systems with Light Elements
3.2.1. Fe-O
- Solid FeO
- Melting of FeO
- The Fe-FeO System
- The Liquid Properties
3.2.2. Fe-Si
- The T-X Relations
- The fcc-hcp Transition
- The Stable Structure in the Inner Core
- The Mixing Properties of Solutions
- The Melting Point at the ICB
- Liquid Properties
3.2.3. Fe-S
- The T-X Relations
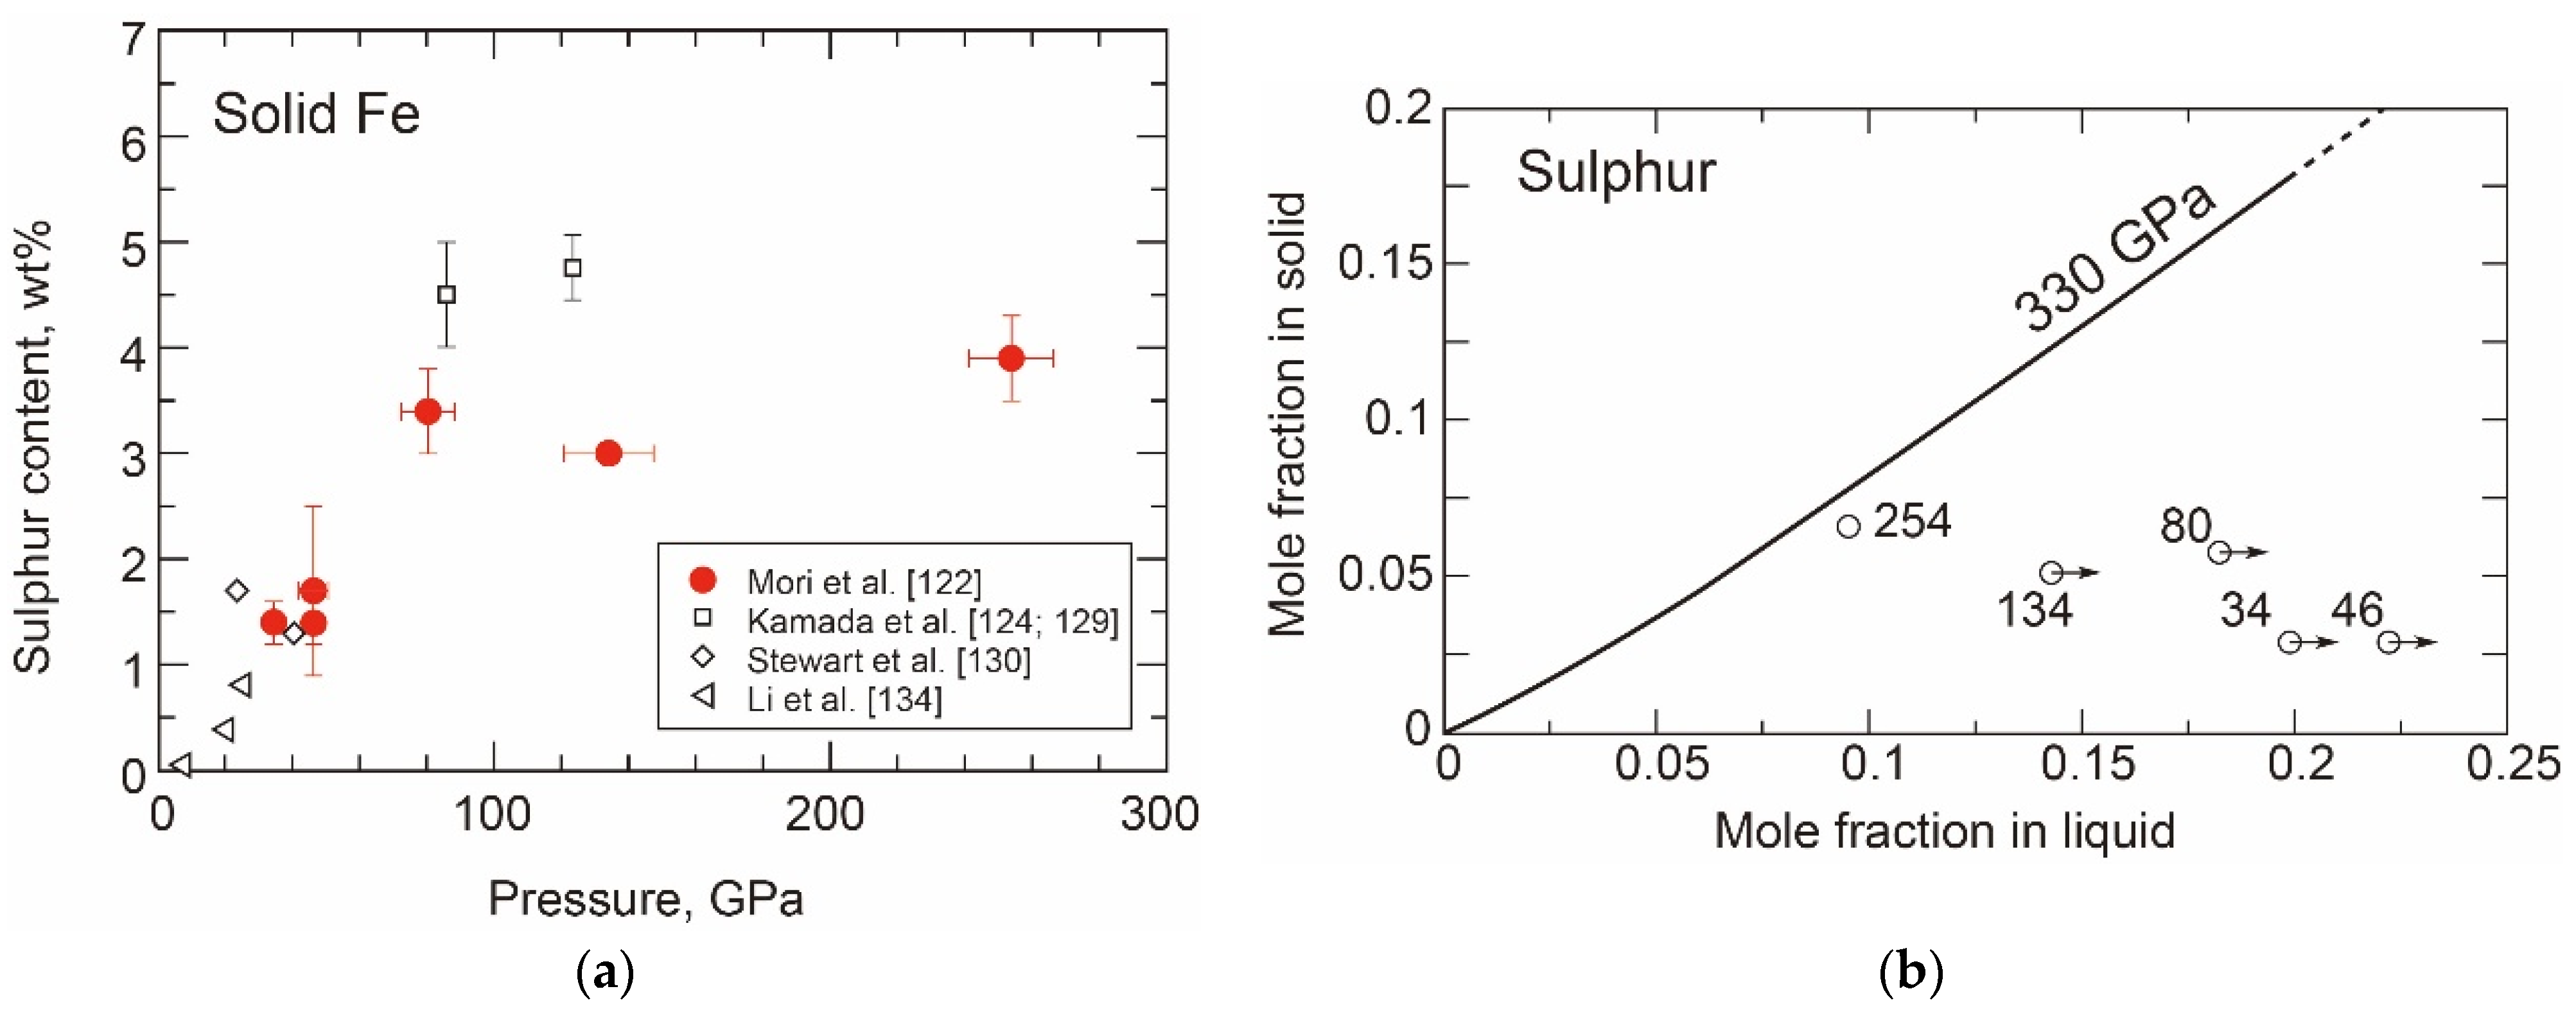
- Sulphur in the hcp Phase
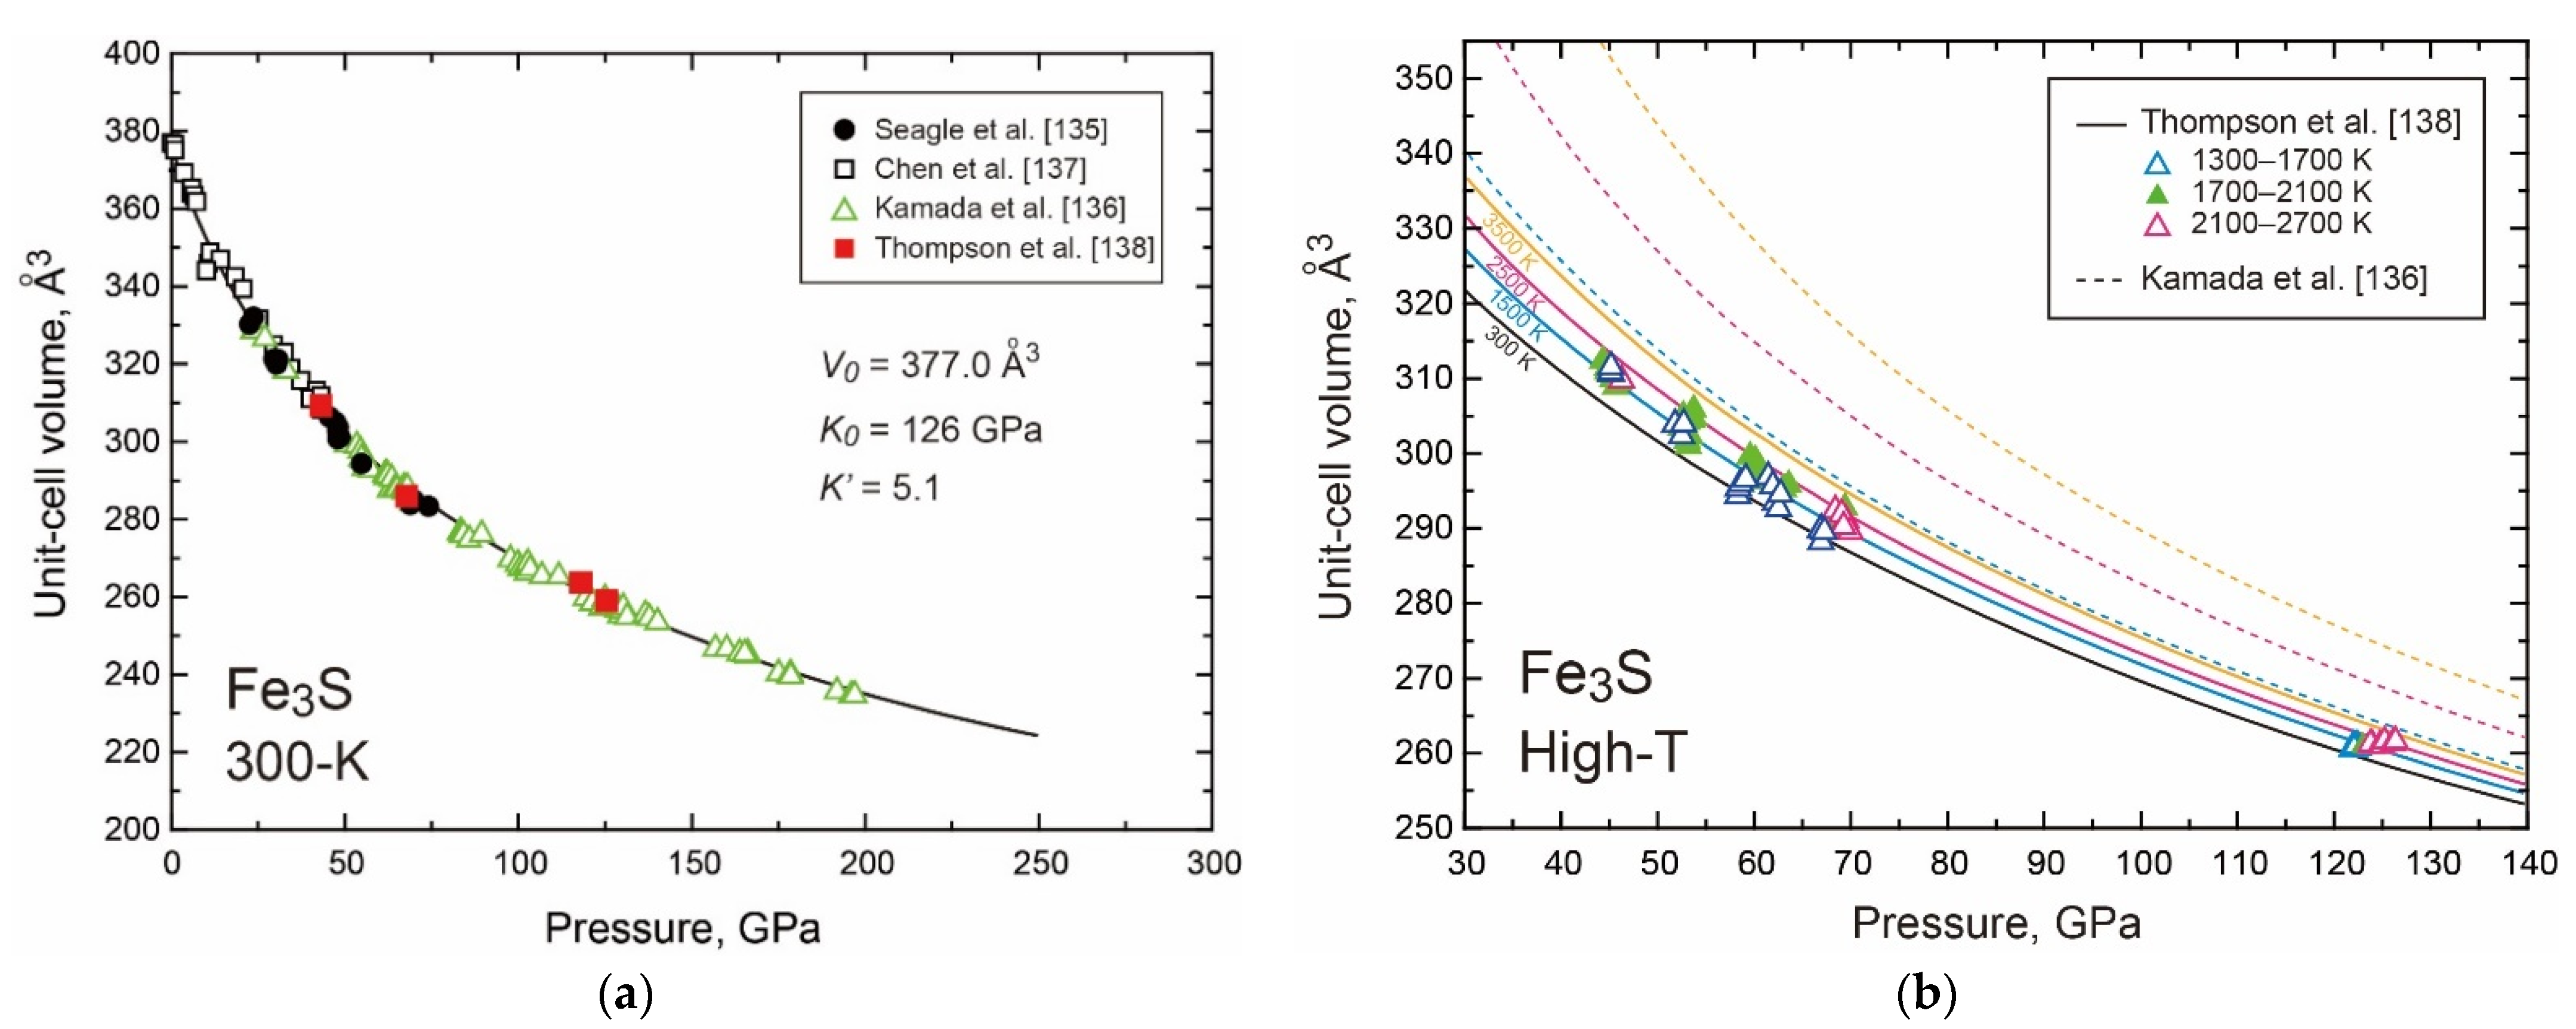
- The Properties of Fe3S
- Decomposition of Fe3S at Core Pressures
- Thermodynamic Model of the System
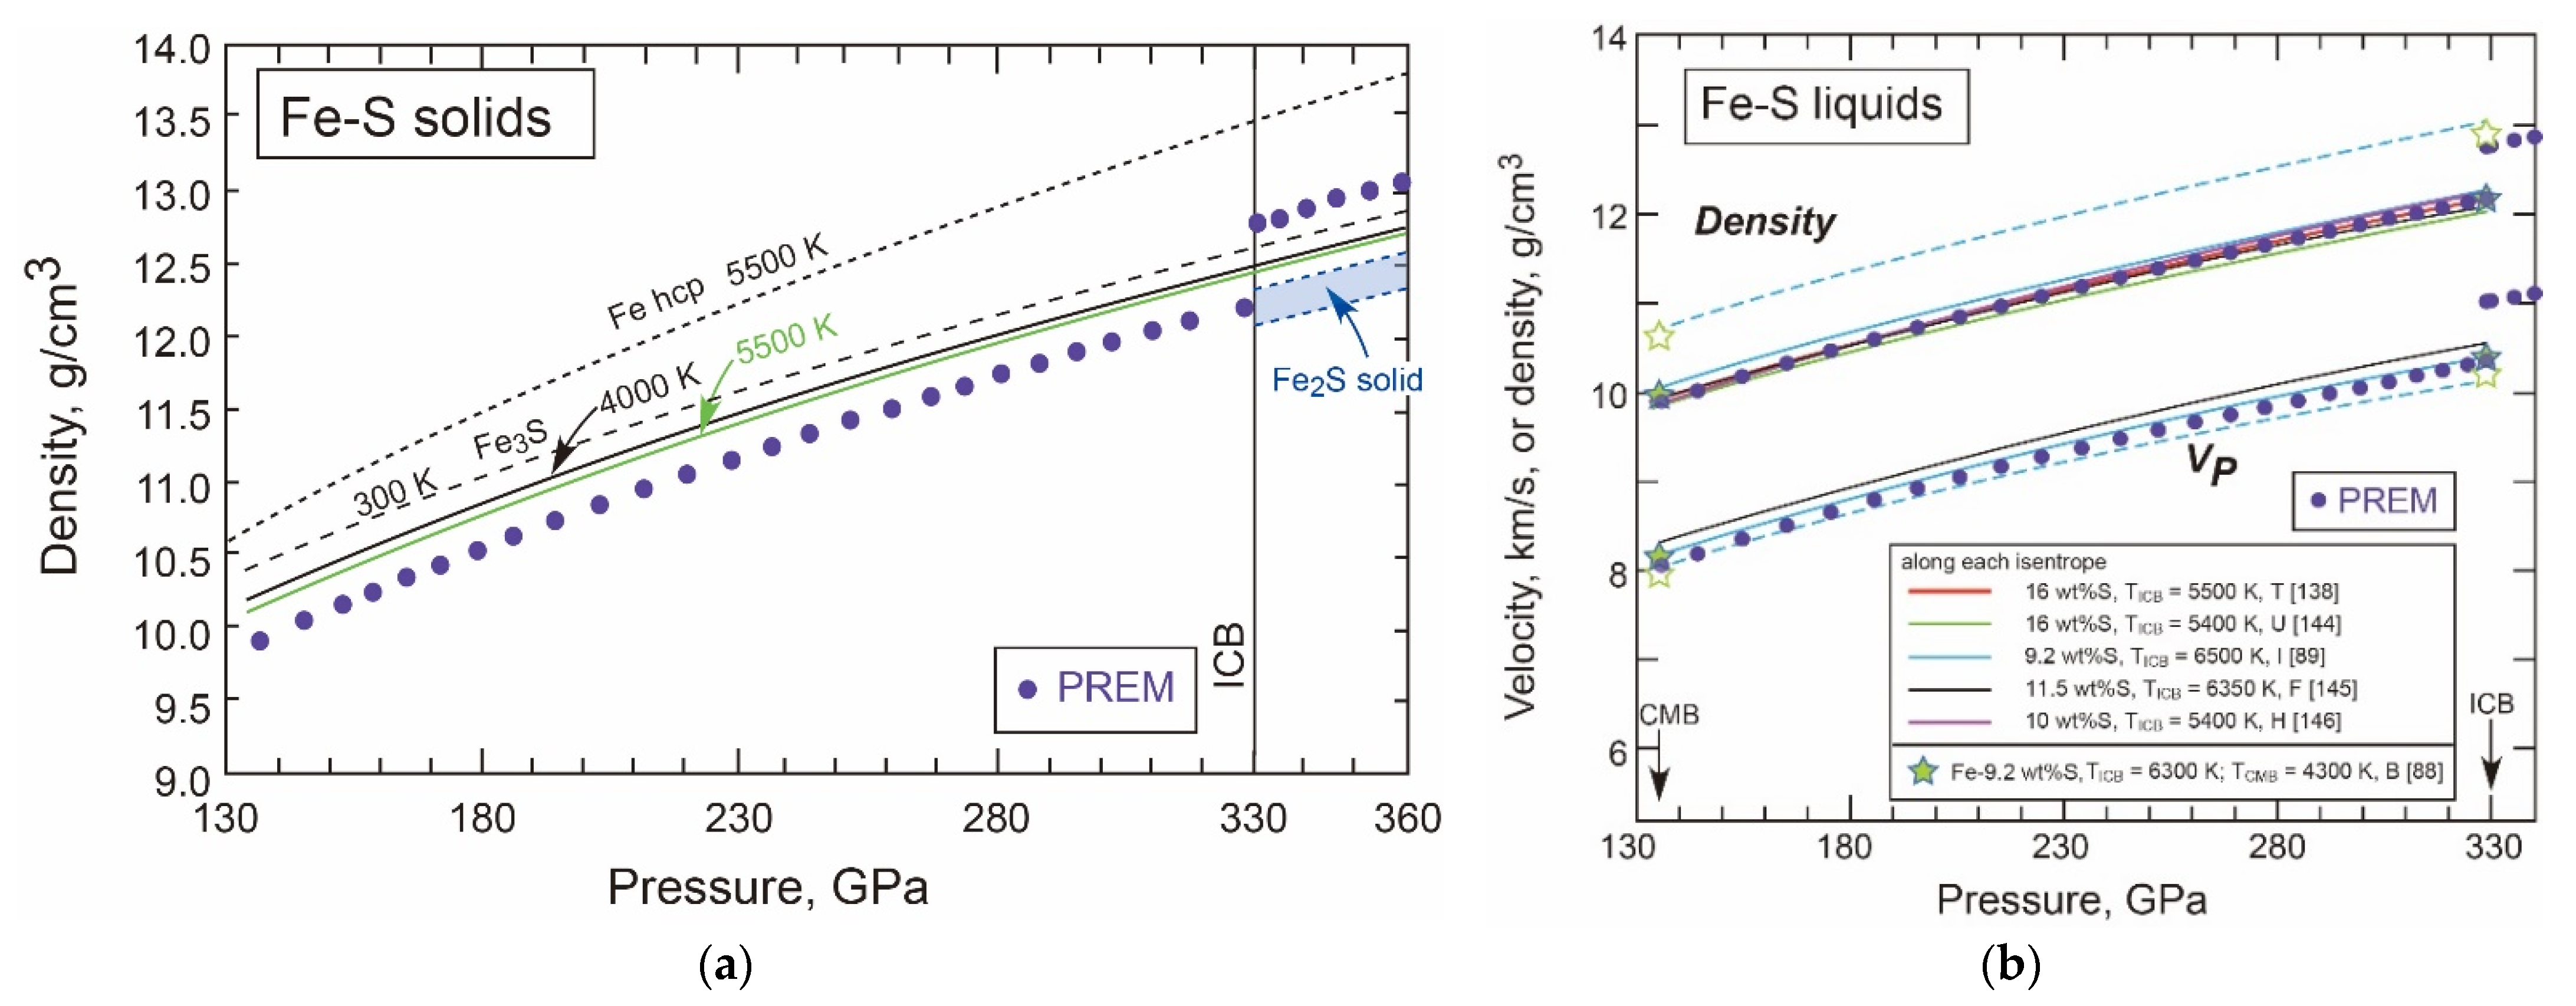
- Density of Fe-S Liquids and Solids in the Core
3.2.4. Fe-C
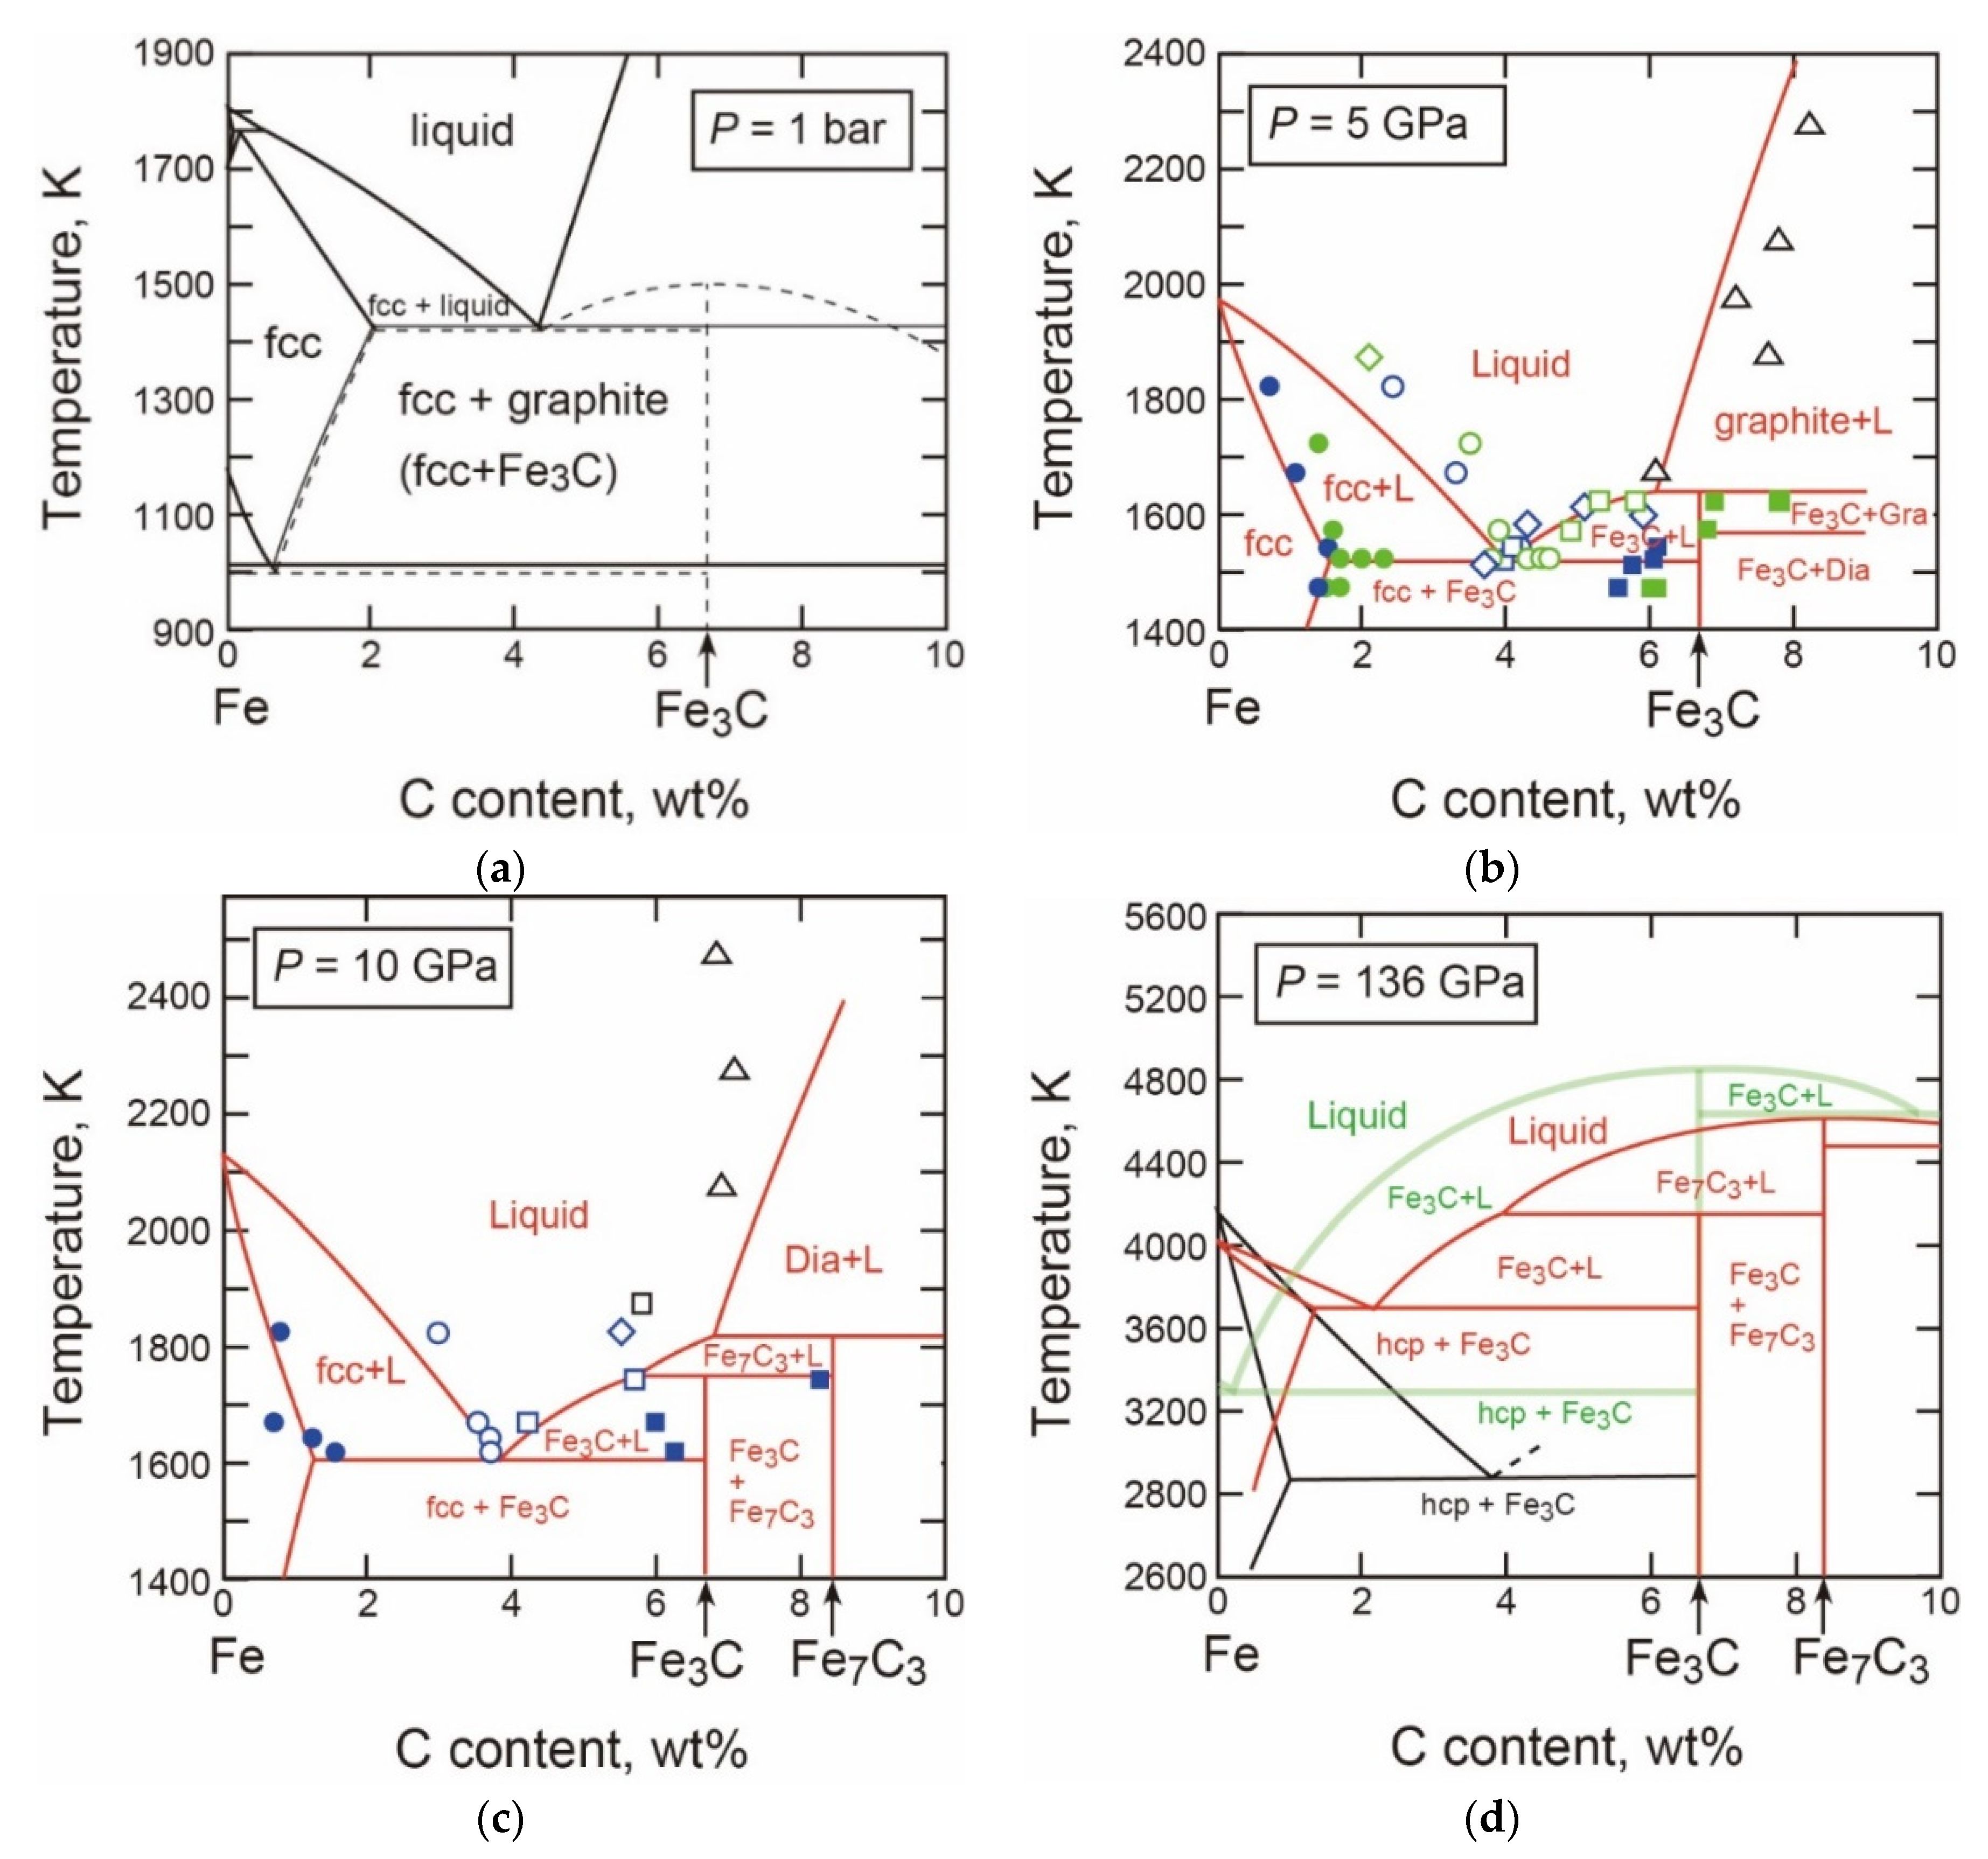
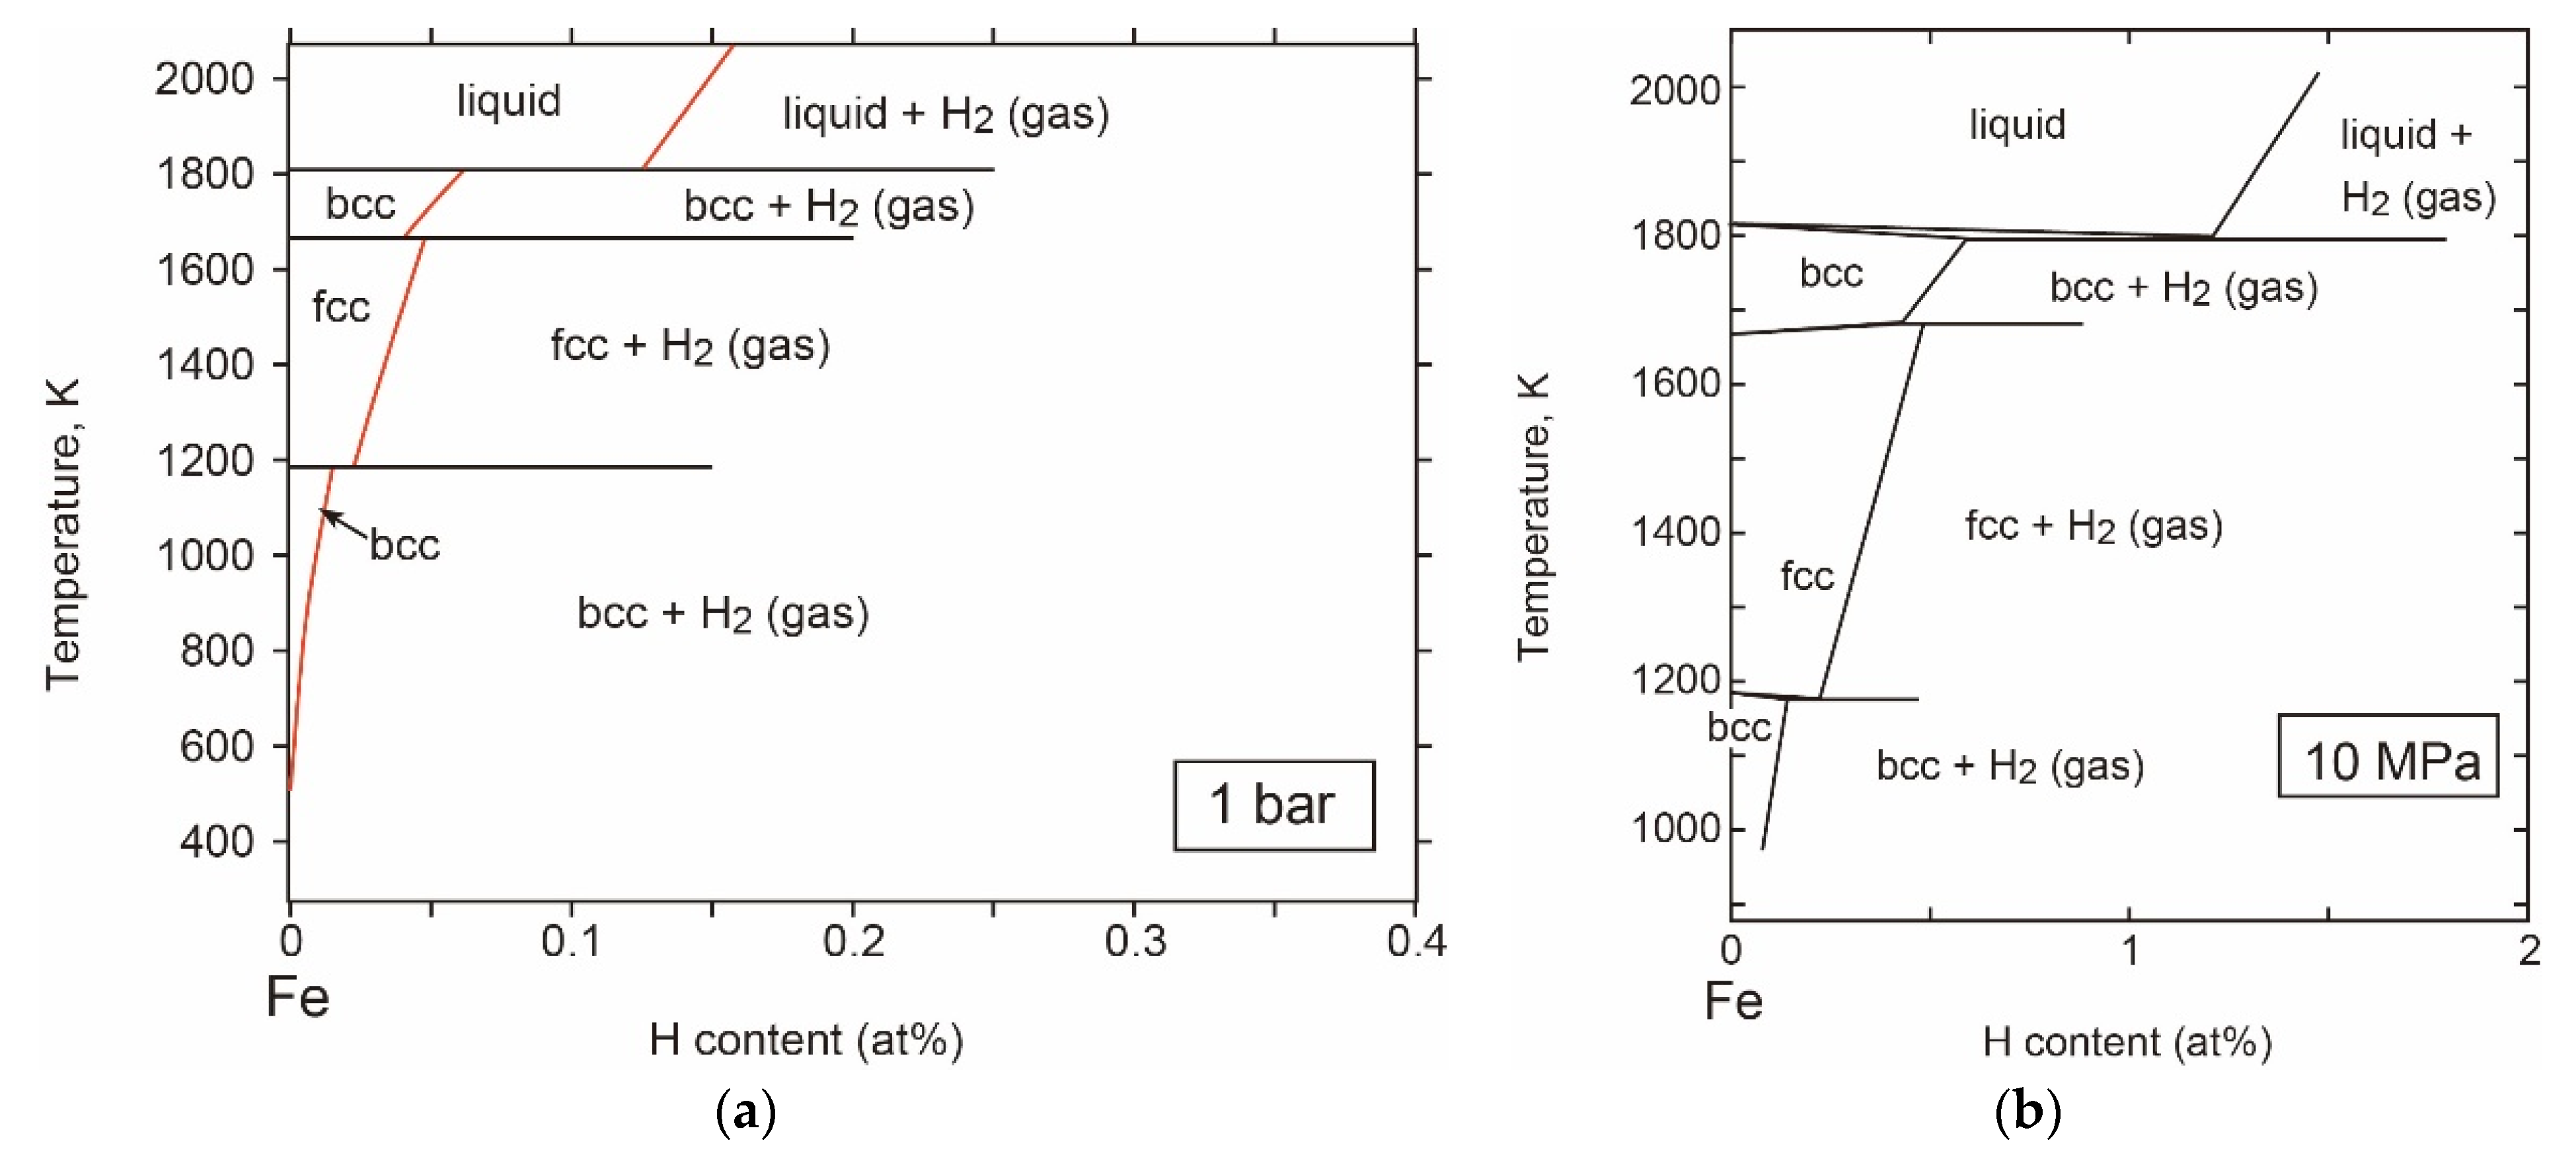
- The T-X Relations
- Carbon in the hcp Phase
- The Properties and Decomposition of Fe3C at Core Pressures
- Thermodynamic Model of the System
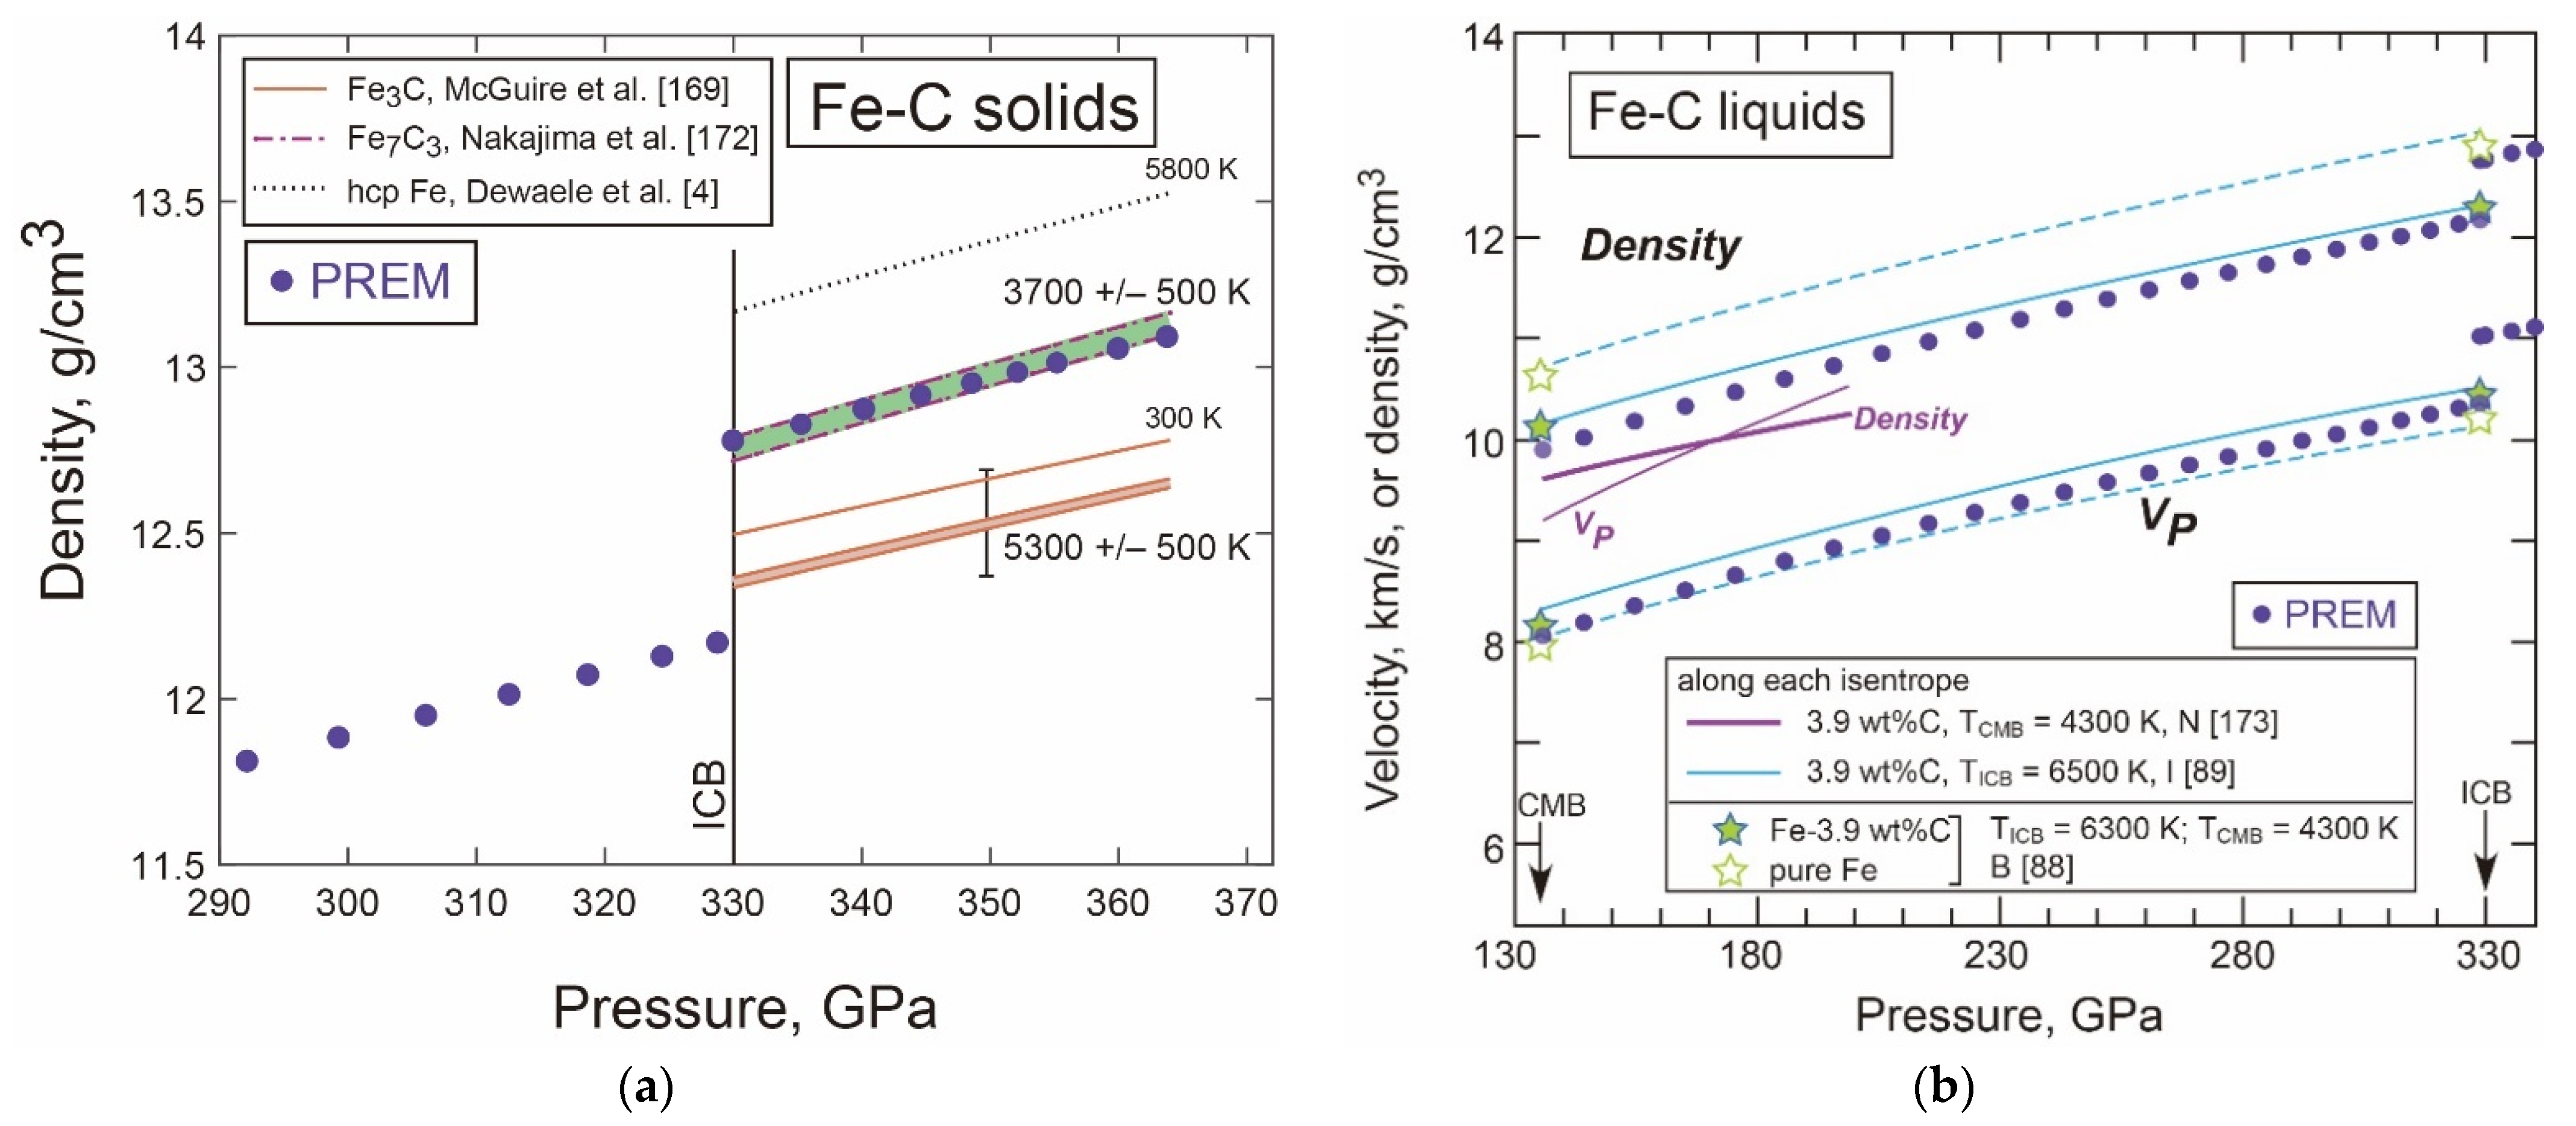
- Density and Velocity of Fe-C Liquid and Solid in the Core
3.2.5. Fe-H
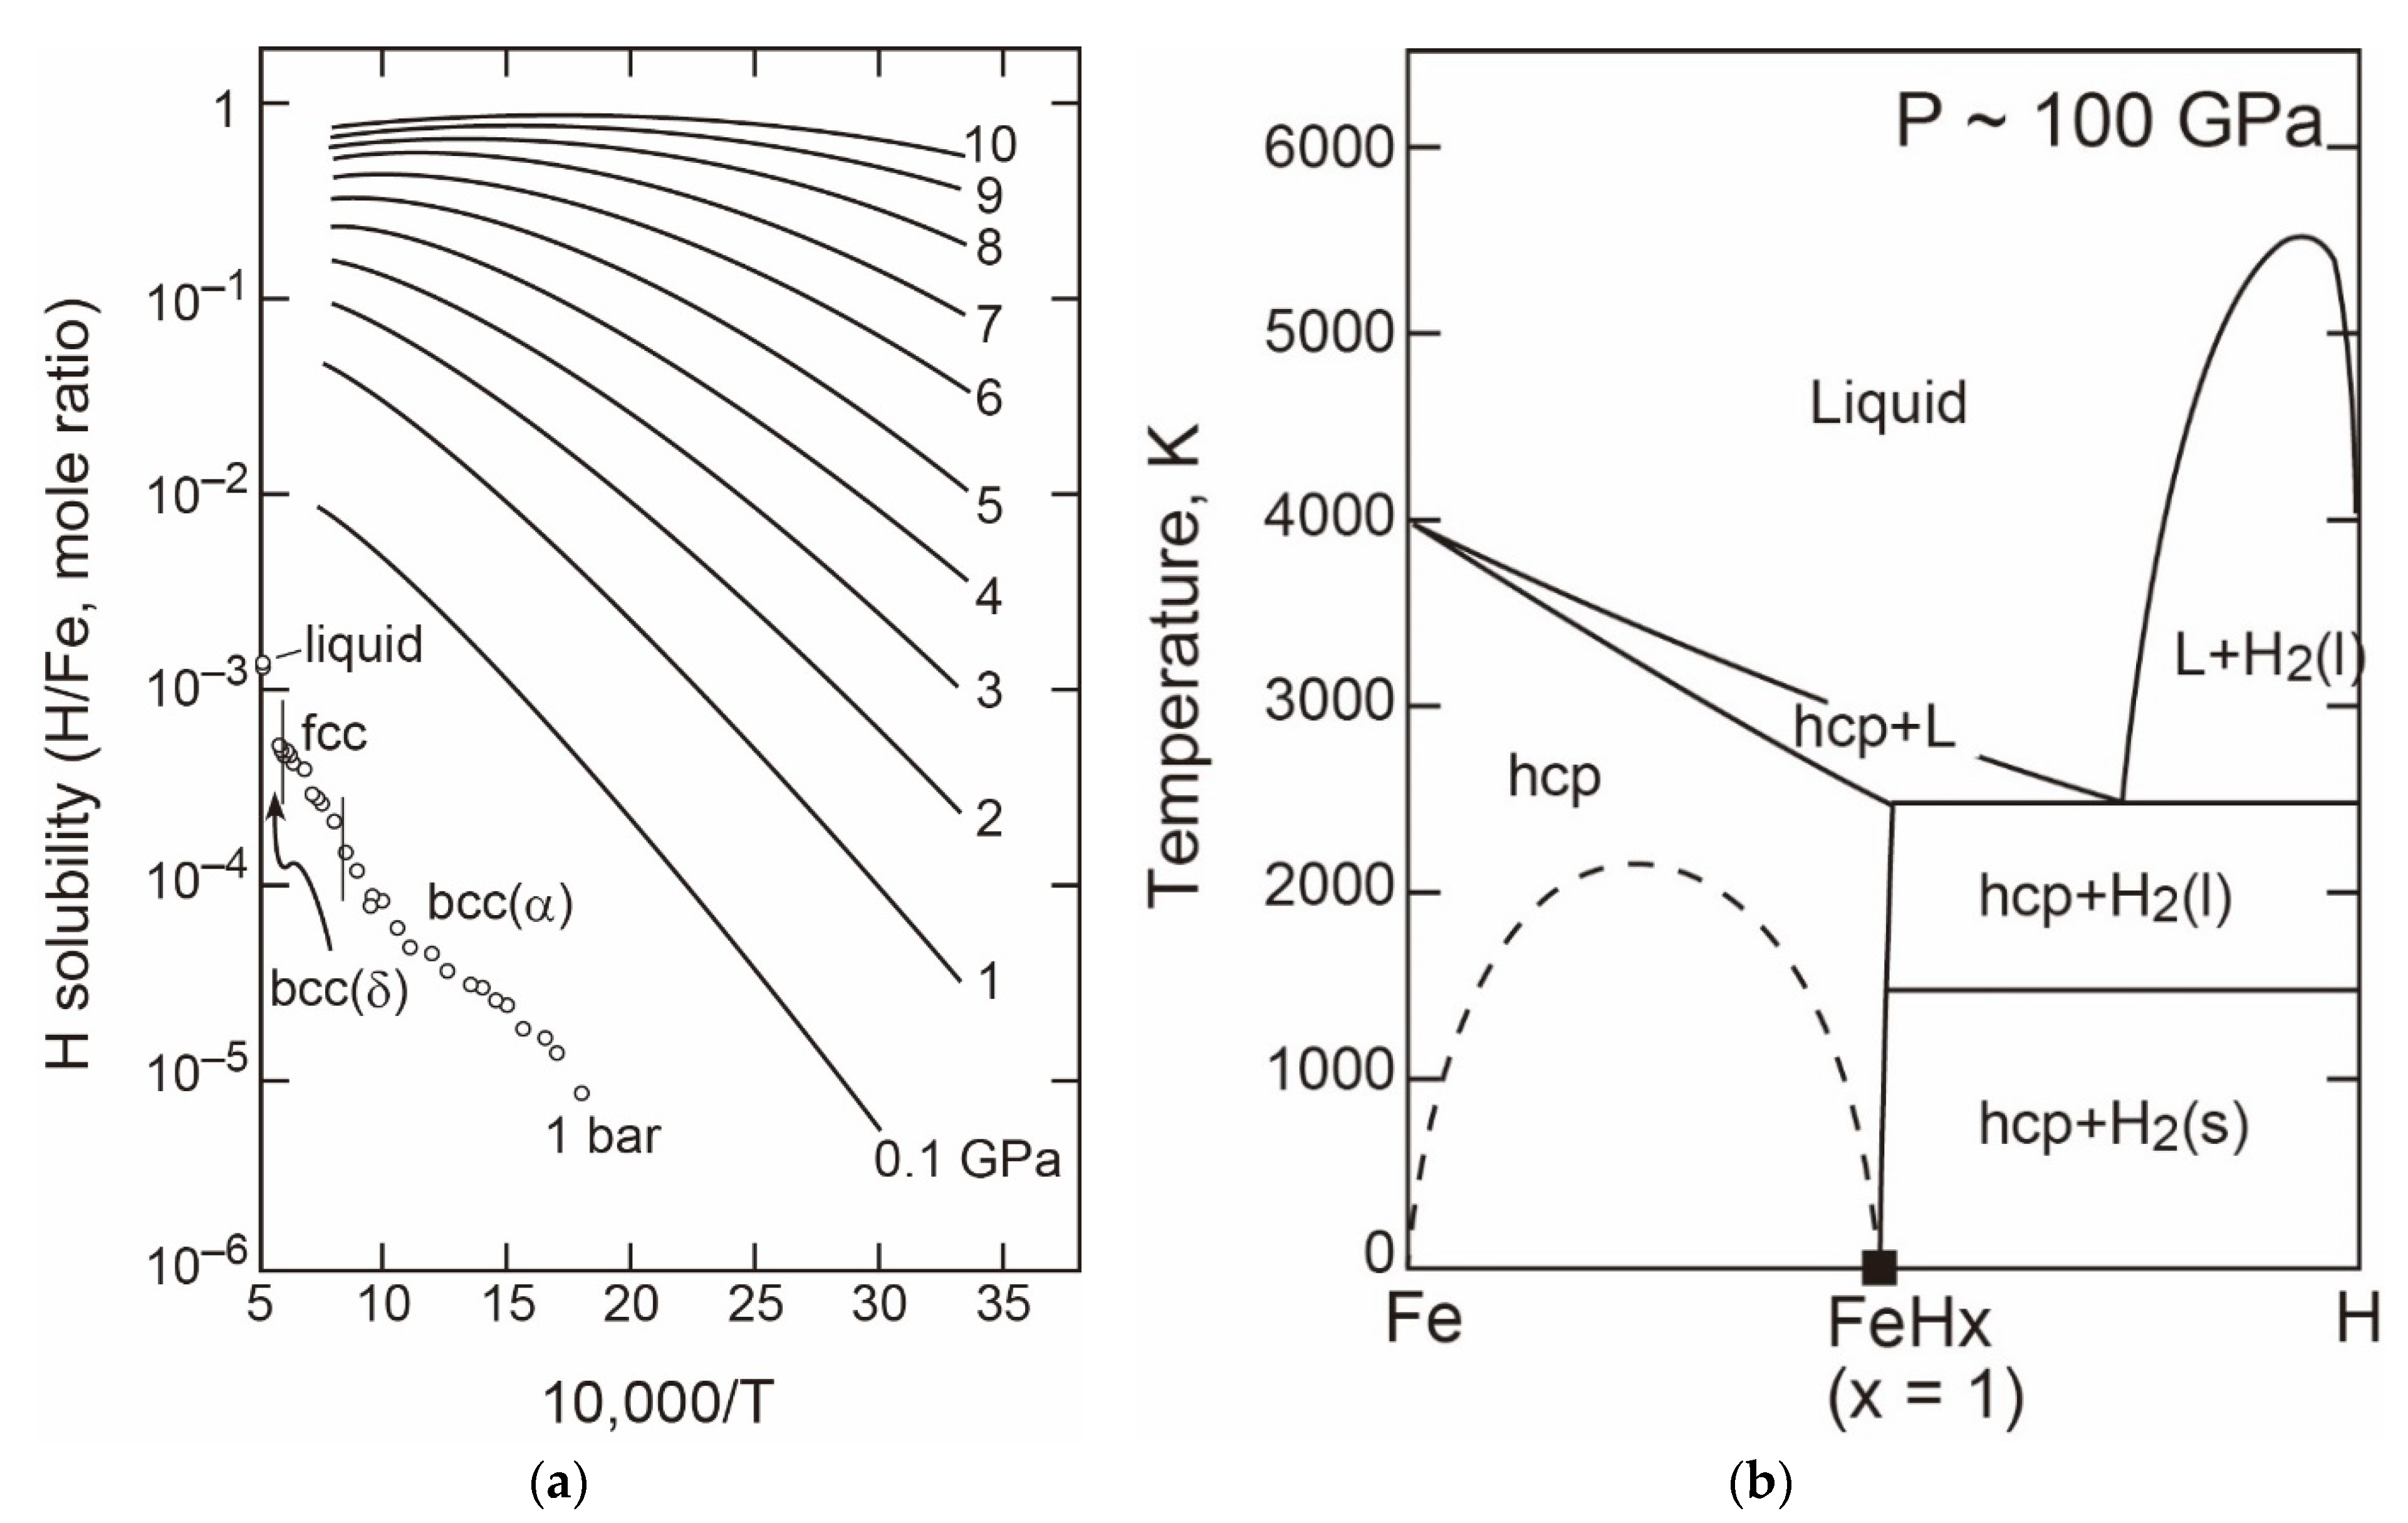
- The T-X Relations
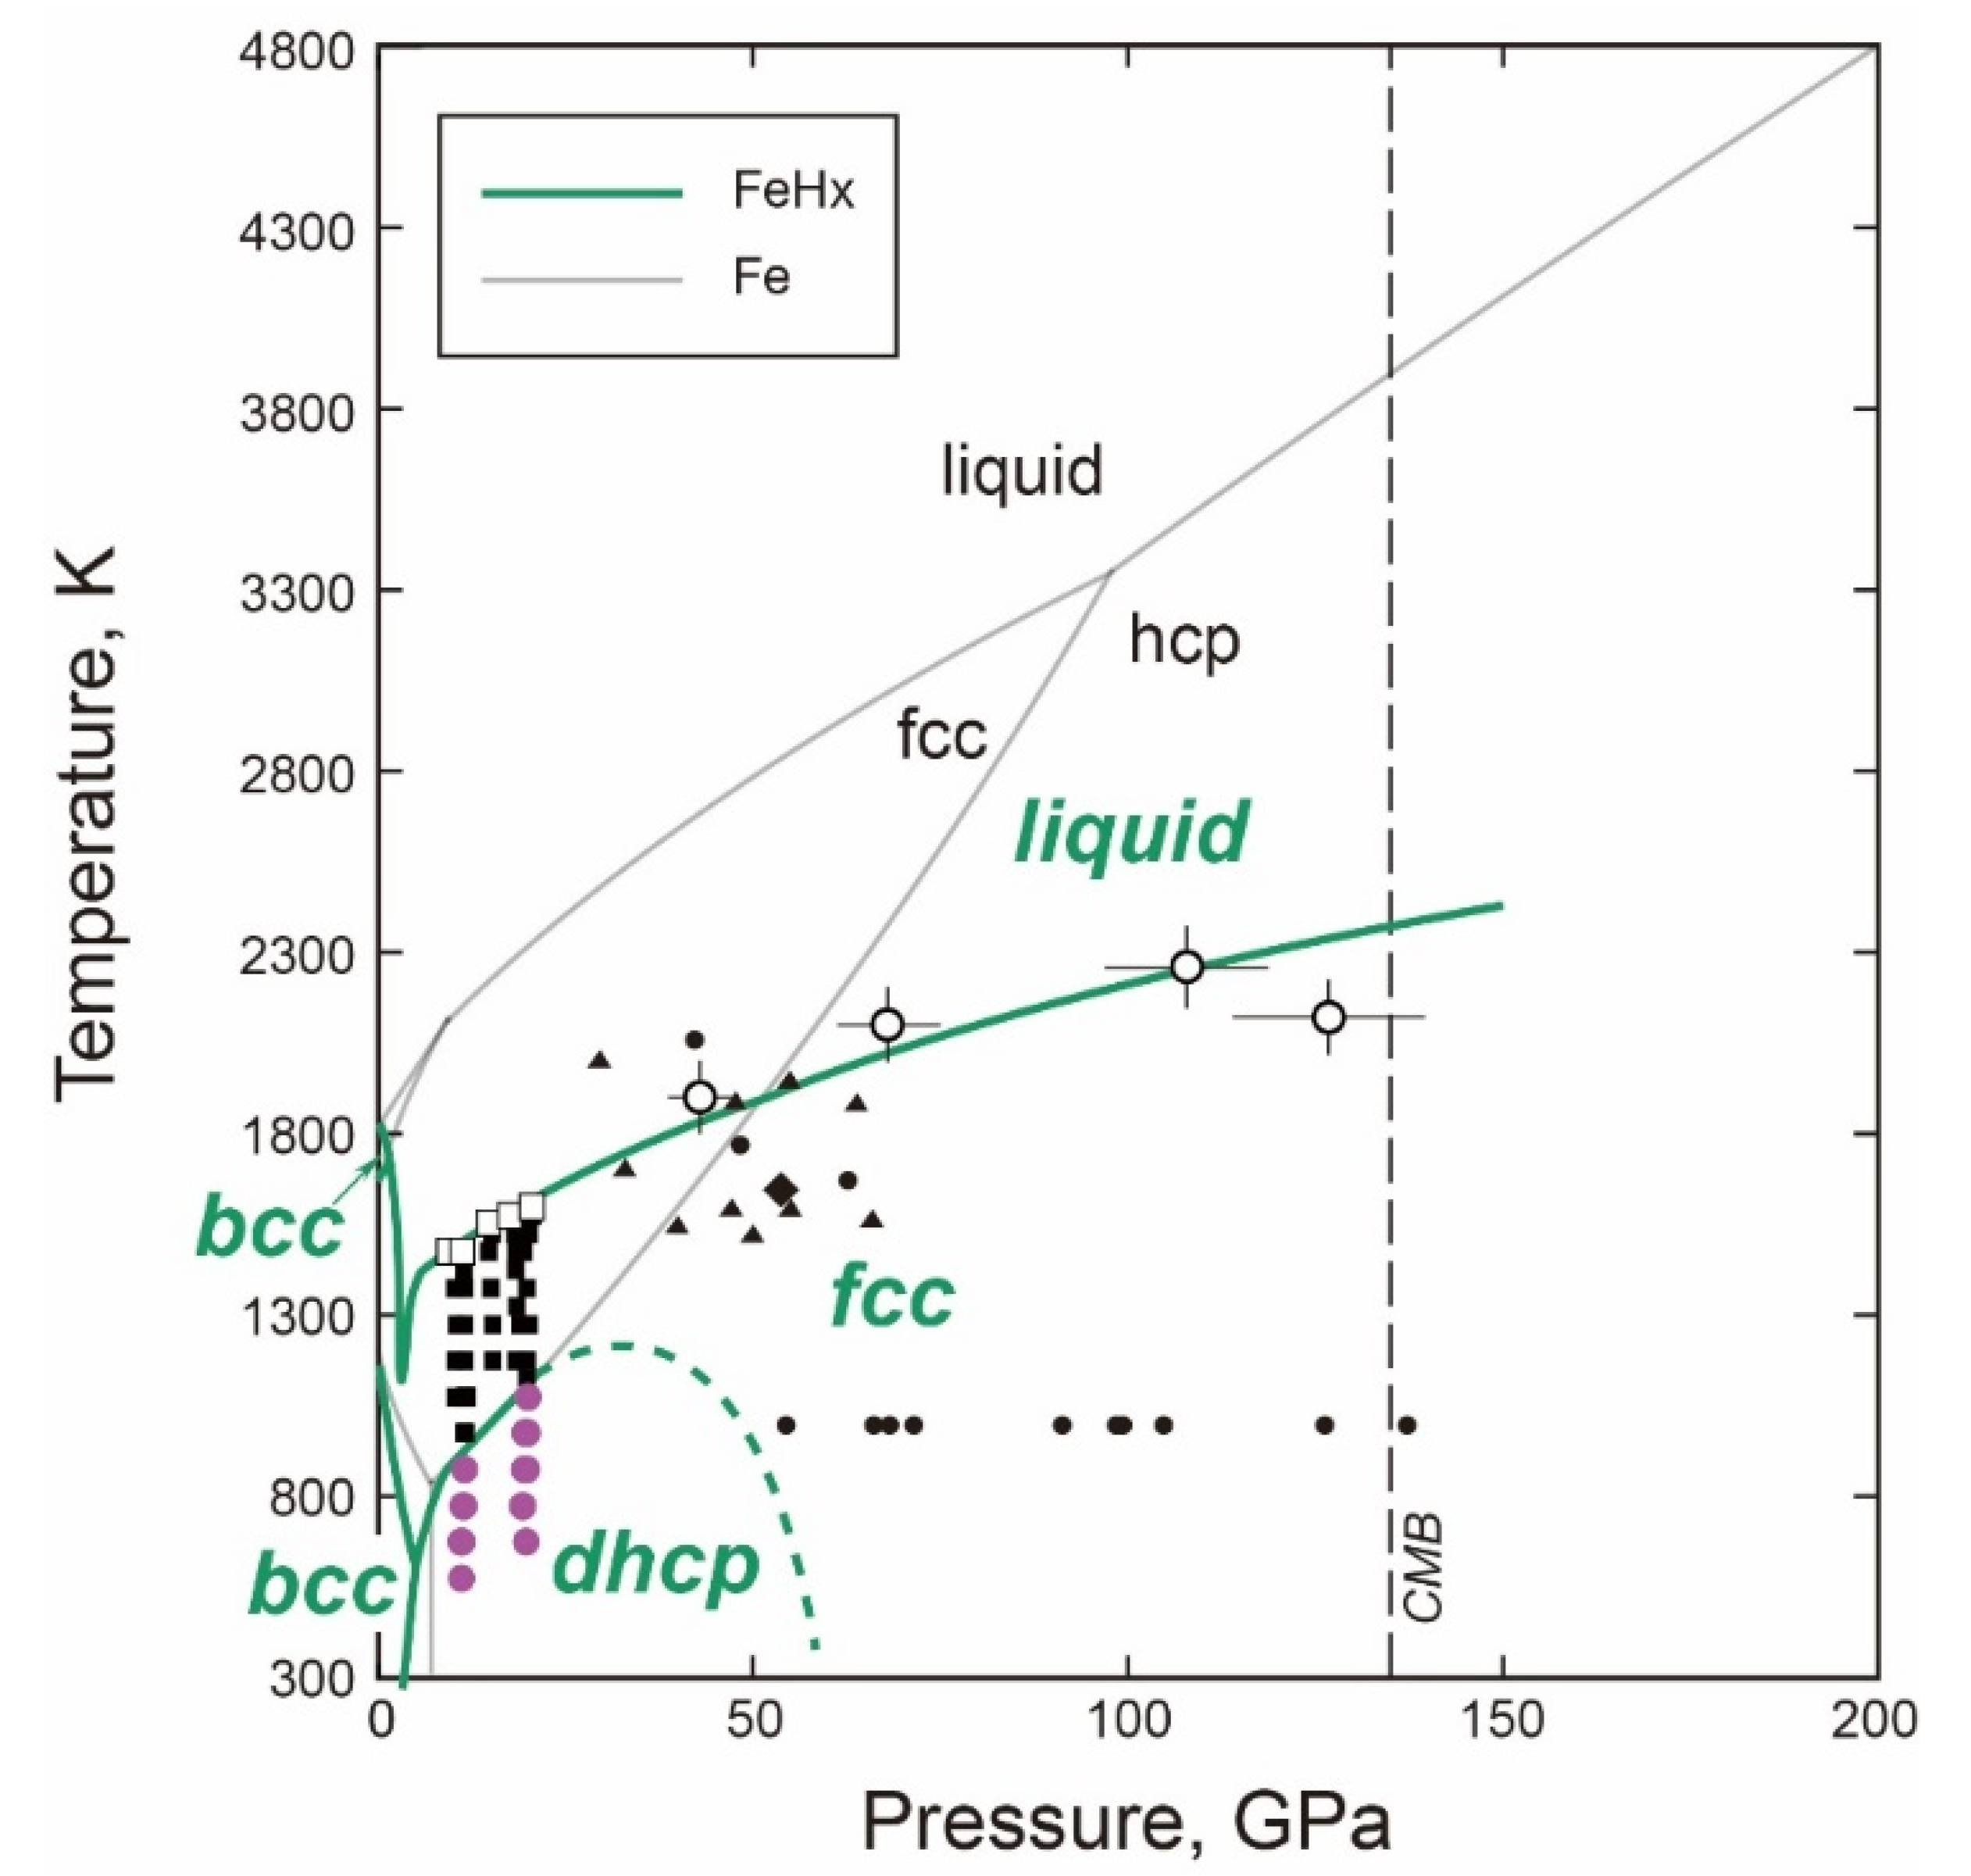
- P-T Relations
- Density and Velocity of Fe-H Liquid and Solid in the Core
3.3. Ternary Systems with Light Elements
3.3.1. Fe-Ni-Si
- The fcc-hcp Transitions
- The Melting Temperatures
3.3.2. Fe-Si-O
- Phase Relations and Mixing Properties for Liquids
4. Conclusions
Funding
Acknowledgments
Conflicts of Interest
References
- Bancroft, D.; Peterson, E.L.; Minshall, S. Polymorphism of iron at high pressure. J. Appl. Phys. 1956, 27, 291–298. [Google Scholar] [CrossRef]
- Anderson, O.L. Equations of State of Solids for Geophysics and Ceramic Science; Oxford University Press: New York, NY, USA, 1995; p. 405. [Google Scholar]
- Jackson, I.; Rigden, S.M. Analysis of P-V-T data: Constraints on the thermoelastic properties of high-pressure minerals. Phys. Earth Planet. Inter. 1996, 96, 85–112. [Google Scholar] [CrossRef]
- Dewaele, A.; Loubeyre, P.; Occelli, F.; Mezouar, M.; Dorogokupets, P.I.; Torrent, M. Quasihydrostatic equation of state of iron above 2 Mbar. Phys. Rev. Lett. 2006, 97, 215504. [Google Scholar] [CrossRef] [PubMed]
- Alfè, D.; Price, G.D.; Gillan, M.J. Thermodynamics of hexagonal-close-packed iron under Earth’s core conditions. Phys. Rev. B 2001, 64, 045123. [Google Scholar] [CrossRef]
- Anderson, O.L.; Oda, H.; Isaak, D.G. A model for the computation of thermal expansivity at high compression and high temperatures: MgO as an example. Geophys. Res. Lett. 1992, 19, 1987–1990. [Google Scholar] [CrossRef]
- Callen, H.B. Thermodynamics; John Wiley & Sons Inc.: Hoboken, NJ, USA, 1960; p. 376. [Google Scholar]
- Dinsdale, A.T. SGTE data for pure elements. Calphad 1991, 15, 317–425. [Google Scholar] [CrossRef]
- Komabayashi, T. Thermodynamics of melting relations in the system Fe-FeO at high pressure: Implications for oxygen in the Earth’s core. J. Geophys. Res. 2014, 119. [Google Scholar] [CrossRef]
- Komabayashi, T. Thermodynamics of the system Fe-Si-O under high pressure and temperature and its implications for Earth’s core. Phys. Chem. Miner. 2020, 47. [Google Scholar] [CrossRef]
- Uchida, T.; Wang, Y.; Rivers, M.L.; Sutton, S.R. Stability field and thermal equation of state of e-iron determined by synchrotron X-ray diffraction in a multianvil apparatus. J. Geophys. Res. 2001, 106, 21709–21810. [Google Scholar] [CrossRef]
- Shen, G.; Mao, H.-K.; Hemley, R.J.; Duffy, T.S.; Rivers, M.L. Melting and crystal structure of iron at high pressures and temperatures. Geophys. Res. Lett. 1998, 25, 373–376. [Google Scholar] [CrossRef]
- Boehler, R. Temperatures in the Earth’s core from melting-point measurements of iron at high static pressures. Nature 1993, 363, 534–536. [Google Scholar] [CrossRef]
- Komabayashi, T.; Fei, Y.; Meng, Y.; Prakapenka, V. In-situ X-ray diffraction measurements of the γ-ε transition boundary of iron in an internally-heated diamond anvil cell. Earth Planet. Sci. Lett. 2009, 282, 252–257. [Google Scholar] [CrossRef]
- Anzellini, S.; Dewaele, A.; Mezouar, M.; Loubeyre, P.; Morard, G. Melting of iron at Earth’s inner core boundary based on fast X-ray diffraction. Science 2013, 340, 464–466. [Google Scholar] [CrossRef] [PubMed]
- Mao, H.K.; Bell, P.M.; Hadidiacos, C. Experimental phase relations of iron to 360 kbar, 1400 °C, determined in an internally heated diamond-anvil apparatus. In High-Pressure Research in Mineral Physics; Manghnani, M.H., Syono, Y., Eds.; American Geophysical Union: Washington, DC, USA, 1987; pp. 135–138. [Google Scholar]
- Funamori, N.; Yagi, T.; Uchida, T. High-pressure and high-temperature in situ x-ray diffraction study of iron to above 30 GPa using MA8-type apparatus. Geophys. Res. Lett. 1996, 23, 953–956. [Google Scholar] [CrossRef]
- Kubo, A.; Ito, E.; Katsura, T.; Shinmei, T.; Yamada, H.; Nishikawa, O.; Song, M.; Funakoshi, K. In situ X-ray observation of iron using Kawai-type apparatus equipped with sintered diamond: Absence of β phase up to 44 GPa and 2100 K. Geophys. Res. Lett. 2003, 30. [Google Scholar] [CrossRef]
- Morelli, A.; Dziewonski, A.M.; Woodhouse, J.H. Anisotropy of the inner core inferred from PKIKP travel times. Geophys. Res. Lett. 1986, 13, 1545–1548. [Google Scholar] [CrossRef]
- Woodhouse, J.H.; Giardini, D.; Li, X.-D. Evidence for inner core anisotropy from free oscillations. Geophys. Res. Lett. 1986, 13, 1549–1552. [Google Scholar] [CrossRef]
- Creager, K.C. Anisotropy of the inner core from differential travel times of the phases PKP and PKIKP. Nat. Cell Biol. 1992, 356, 309–314. [Google Scholar] [CrossRef]
- Song, X.; Helmberger, D.V. Anisotropy of Earth’s inner core. Geophys. Res. Lett. 1993, 20, 2591–2594. [Google Scholar] [CrossRef]
- Tateno, S.; Hirose, K.; Ohishi, Y.; Tatsumi, Y. The structure of iron in Earth’s inner core. Science 2010, 330, 359–361. [Google Scholar] [CrossRef]
- Stixrude, L. Structure of Iron to 1 Gbar and 40 000 K. Phys. Rev. Lett. 2012, 108, 055505. [Google Scholar] [CrossRef]
- Sinmyo, R.; Hirose, K.; Ohishi, Y. Melting curve of iron to 290 GPa determined in a resistance-heated diamond-anvil cell. Earth Planet. Sci. Lett. 2019, 510, 45–52. [Google Scholar] [CrossRef]
- Kuwayama, Y.; Hirose, K.; Sata, N.; Ohishi, Y. Phase relations of iron and iron-nickel alloys up to 300 GPa: Implications for composition and structure of the Earth’s inner core. Earth Planet. Sci. Lett. 2008, 273, 379–385. [Google Scholar] [CrossRef]
- Brown, M.J.; McQueen, R.G. Phase transitions, Grueneisen parameter, and elasticity for shocked iron between 77 GPa and 400 GPa. J. Geophys. Res. 1986, 91, 7485–7494. [Google Scholar] [CrossRef]
- Boehler, R. The phase diagram of iron to 430 kbar. Geophys. Res. Lett. 1986, 13, 1153–1156. [Google Scholar] [CrossRef]
- Belonoshko, A.B.; Ahuja, R.; Johansson, B. Stability of the body-centred-cubic phase of iron in the Earth’s inner core. Nature 2003, 424, 1032–1034. [Google Scholar] [CrossRef] [PubMed]
- Mikhaylushkin, A.S.; Simak, S.I.; Dubrovinsky, L.; Dubrovinskaia, N.; Johansson, B.; Abrikosov, I.A. Pure Iron Compressed and Heated to Extreme Conditions. Phys. Rev. Lett. 2007, 99, 165505. [Google Scholar] [CrossRef] [PubMed]
- Luo, W.; Johansson, B.; Eriksson, O.; Arapan, S.; Souvatzis, P.; Katsnelson, M.I.; Ahuja, R. Dynamical stability of body center cubic iron at the Earth’s core conditions. Proc. Natl. Acad. Sci. USA 2010, 107, 9962–9964. [Google Scholar] [CrossRef] [PubMed]
- Belonoshko, A.B.; Lukinov, T.; Fu, J.; Zhao, J.; Davis, S.; Simak, S.I. Stabilization of body-centred cubic iron under inner-core conditions. Nat. Geosci. 2017, 10, 312–316. [Google Scholar] [CrossRef]
- Nguyen, J.H.; Holmes, N.C. Melting of iron at the physical conditions of the Earth’s core. Nature 2004, 427, 339–342. [Google Scholar] [CrossRef]
- Yoo, C.S.; Holmes, N.C.; Ross, M.; Webb, D.J.; Pike, C. Shock temperatures and melting of iron at Earth core conditions. Phys. Rev. Lett. 1993, 70, 3931–3934. [Google Scholar] [CrossRef] [PubMed]
- Turneaure, S.J.; Sharma, S.M.; Gupta, Y.M. Crystal Structure and Melting of Fe Shock Compressed to 273 GPa: In Situ X-ray Diffraction. Phys. Rev. Lett. 2020, 125, 215702. [Google Scholar] [CrossRef] [PubMed]
- Alfè, D.; Gillan, M.J.; Price, G.D. The melting curve of iron at the pressures of the Earth’s core from ab initio calculations. Nature 1999, 401, 462–464. [Google Scholar] [CrossRef]
- Belonoshko, A.B.; Ahuja, R.; Johansson, B. Quasi–Ab InitioMolecular Dynamic Study of Fe Melting. Phys. Rev. Lett. 2000, 84, 3638–3641. [Google Scholar] [CrossRef] [PubMed]
- Alfè, D. Temperature of the inner-core boundary of the Earth: Melting of iron at high pressure from first-principles coexistence simulations. Phys. Rev. B 2009, 79, 060101. [Google Scholar] [CrossRef]
- Laio, A.; Bernard, S.; Chiarotti, G.L.; Scandolo, S.; Tosatti, E. Physics of iron at Earth’s core conditions. Science 2000, 287, 1027–1030. [Google Scholar] [CrossRef]
- Jackson, J.M.; Sturhahn, W.; Lerche, M.; Zhao, J.Y.; Toellner, T.S.; Alp, E.E.; Sinogeikin, S.V.; Bass, J.D.; Murphy, C.A.; Wicks, J.K. Melting of compressed iron by monitoring atomic dynamics. Earth Planet. Sci. Lett. 2013, 362, 143–150. [Google Scholar] [CrossRef]
- Morard, G.; Boccato, S.; Rosa, A.D.; Anzellini, S.; Miozzi, F.; Henry, L.; Garbarino, G.; Mezouar, M.; Harmand, M.; Guyot, F.; et al. Solving Controversies on the Iron Phase Diagram Under High Pressure. Geophys. Res. Lett. 2018, 45, 11074–11082. [Google Scholar] [CrossRef]
- Guillermet, A.F.; Gustafson, P. An assessment of the thermodynamic properties and the (p, T) phase diagram of iron. High Temp. High Press. 1985, 16, 591–610. [Google Scholar]
- Saxena, S.K.; Dubrovinsky, L.S. Thermodynamics of iron phases at high pressures and temperatures. In Properties of Earth and Planetary Materials; Manghnani, M.H., Yagi, T., Eds.; American Geophysical Union: Washington, DC, USA, 1998; pp. 271–279. [Google Scholar]
- Tsujino, N.; Nishihara, Y.; Nakajima, Y.; Takahashi, E.; Funakoshi, K.; Higo, Y. Equation of state of gamma-Fe: Reference density for planetary cores. Earth Planet. Sci. Lett. 2013, 375, 244–253. [Google Scholar] [CrossRef]
- Alfè, D.; Price, G.D.; Gillan, M.J. Iron under Earth’s core conditions: Liquid-state thermodynamics and high-pressure melting curve from ab initio calculations. Phys. Rev. B 2002, 65, 165118. [Google Scholar] [CrossRef]
- Tiwari, G.P. Modification of Richard’s rule and correlation between entropy of fusion and allotropic behaviour. Met. Sci. 1978, 12, 317–320. [Google Scholar] [CrossRef]
- Anderson, W.W.; Ahrens, T.J. An equation of state for liquid iron and implications for the Earth’s core. J. Geophys. Res. 1994, 99, 4273–4284. [Google Scholar] [CrossRef]
- Kuwayama, Y.; Morard, G.; Nakajima, Y.; Hirose, K.; Baron, A.Q.R.; Kawaguchi, S.I.; Tsuchiya, T.; Ishikawa, D.; Hirao, N.; Ohishi, Y. Equation of state of liquid iron under extreme conditions. Phys. Rev. Lett. 2020, 124, 165701. [Google Scholar] [CrossRef] [PubMed]
- Wagle, F.; Steinle-Neumann, G. Liquid iron equation of state to the terapascal regime from ab initio simulations. J. Geophys. Res. Solid Earth 2019, 124, 3350–3364. [Google Scholar] [CrossRef]
- Ichikawa, H.; Tsuchiya, T.; Tange, Y. The P-V-T equation of state and thermodynamic properties of liquid iron. J. Geophys. Res. Solid Earth 2014, 119, 240–252. [Google Scholar] [CrossRef]
- Dziewonski, A.M.; Anderson, D.L. Preliminary reference Earth model. Phys. Earth Planet. Inter. 1981, 25, 297–356. [Google Scholar] [CrossRef]
- Fei, Y.W.; Murphy, C.; Shibazaki, Y.; Shahar, A.; Huang, H.J. Thermal equation of state of hcp-iron: Constraint on the density deficit of Earth’s solid inner core. Geophys. Res. Lett. 2016, 43, 6837–6843. [Google Scholar] [CrossRef]
- Li, J.; Fei, Y. Experimental constraints on core composition. In Treatise on Geochemistry Update; Holland, H.D., Turekian, K.K., Eds.; Elsevier Ltd.: Amsterdam, The Netherlands, 2007; pp. 1–31. [Google Scholar]
- Lin, J.-F.; Heinz, D.L.; Campbell, A.J.; Devine, J.M.; Mao, W.L.; Shen, G. Iron-Nickel alloy in the Earth’s core. Geophys. Res. Lett. 2002, 29. [Google Scholar] [CrossRef]
- Mao, W.L.; Campbell, A.J.; Heinz, D.L.; Shen, G. Phase relations of Fe–Ni alloys at high pressure and temperature. Phys. Earth Planet. Inter. 2006, 155, 146–151. [Google Scholar] [CrossRef]
- Dubrovinsky, L.; Dubrovinskaia, N.; Narygina, O.; Kantor, I.; Kuznetzov, A.; Prakapenka, V.B.; Vitos, L.; Johansson, B.; Mikhaylushkin, A.S.; Simak, S.I.; et al. Body-centered cubic iron-nickel alloy in Earth’s core. Science 2007, 316, 1880–1883. [Google Scholar] [CrossRef] [PubMed]
- Komabayashi, T.; Hirose, K.; Ohishi, Y. In situ X-ray diffraction measurements of the fcc–hcp phase transition boundary of an Fe–Ni alloy in an internally heated diamond anvil cell. Phys. Chem. Miner. 2012, 39, 329–338. [Google Scholar] [CrossRef]
- Sakai, T.; Ohtani, E.; Hirao, N.; Ohishi, Y. Stability field of the hcp-structure for Fe, Fe-Ni, and Fe-Ni-Si alloys up to 3 Mbar. Geophys. Res. Lett. 2011, 38, 09302. [Google Scholar] [CrossRef]
- Tateno, S.; Hirose, K.; Komabayashi, T.; Ozawa, H.; Ohishi, Y. The structure of Fe-Ni alloy in Earth’s inner core. Geophys. Res. Lett. 2012, 39. [Google Scholar] [CrossRef]
- Zhang, D.Z.; Jackson, J.M.; Zhao, J.Y.; Sturhahn, W.; Alp, E.E.; Hu, M.Y.; Toellner, T.S.; Murphy, C.A.; Prakapenka, V.B. Temperature of Earth’s core constrained from melting of Fe and Fe0.9Ni0.1 at high pressures. Earth Planet. Sci. Lett. 2016, 447, 72–83. [Google Scholar] [CrossRef]
- Torchio, R.; Boccato, S.; Miozzi, F.; Rosa, A.D.; Ishimatsu, N.; Kantor, I.; Sevelin-Radiguet, N.; Briggs, R.; Meneghini, C.; Irifune, T.; et al. Melting Curve and Phase Relations of Fe-Ni Alloys: Implications for the Earth’s Core Composition. Geophys. Res. Lett. 2020, 47. [Google Scholar] [CrossRef]
- Zou, G.; Mao, H.K.; Bell, P.M.; Virgo, D. High pressure experiments on the iron oxide wüstite (Fe1−xO). Carnegie Inst. Wash. Yearb. 1980, 79, 374–376. [Google Scholar]
- Jeanloz, R.; Ahrens, T.J. Equations of state of FeO and CaO. Geophys. J. R. Astron. Soc. 1980, 62, 505–528. [Google Scholar] [CrossRef]
- Knittle, E.; Jeanloz, R. High-Pressure metallization of FeO and implications for the Earth core. Geophys. Res. Lett. 1986, 13, 1541–1544. [Google Scholar] [CrossRef]
- Knittle, E.; Jeanloz, R.; Mitchell, A.C.; Nellis, W.J. Metallization of Fe0.94O at elevated pressures and temperatures observed by shock-wave electrical resistivity measurements. Solid State Commun. 1986, 59, 513–515. [Google Scholar] [CrossRef]
- Fei, Y.W.; Mao, H.K. In-situ determination of the NiAs phase of FeO at high-pressure and Temperature. Science 1994, 266, 1678–1680. [Google Scholar] [CrossRef] [PubMed]
- Kondo, T.; Ohtani, E.; Hirao, N.; Yagi, T.; Kikegawa, T. Phase transitions of (Mg,Fe)O at megabar pressures. Phys. Earth Planet. Inter. 2004, 143, 201–213. [Google Scholar] [CrossRef]
- Ozawa, H.; Hirose, K.; Tateno, S.; Sata, N.; Ohishi, Y. Phase transition boundary between B1 and B8 structures of FeO up to 210 GPa. Phys. Earth Planet. Inter. 2010, 179, 157–163. [Google Scholar] [CrossRef]
- Ozawa, H.; Takahashi, F.; Hirose, K.; Ohishi, Y.; Hirao, N. Phase transition of FeO and stratification in Earth’s outer core. Science 2011, 334, 792–794. [Google Scholar] [CrossRef] [PubMed]
- Ohta, K.; Cohen, R.E.; Hirose, K.; Haule, K.; Shimizu, K.; Ohishi, Y. Experimental and theoretical evidence for pressure-induced metallization in FeO with rocksalt-type structure. Phys. Rev. Lett. 2012, 108, 026403. [Google Scholar] [CrossRef] [PubMed]
- Ohta, K.; Hirose, K.; Shimizu, K.; Ohishi, Y. High-pressure experimental evidence for metal FeO with normal NiAs-type structure. Phys. Rev. B 2010, 82, 174120. [Google Scholar] [CrossRef]
- Fischer, R.A.; Campbell, A.J.; Lord, O.T.; Shofner, G.A.; Dera, P.; Prakapenka, V.B. Phase transition and metallization of FeO at high pressures and temperatures. Geophys. Res. Lett. 2011, 38, L24301. [Google Scholar] [CrossRef]
- Fischer, R.A.; Campbell, A.J.; Shofner, G.A.; Lord, O.T.; Dera, P.; Prakapenka, V.B. Equation of state and phase diagram of FeO. Earth Planet. Sci. Lett. 2011, 304, 496–502. [Google Scholar] [CrossRef]
- Fischer, R.A.; Campbell, A.J. High-pressure melting of wüstite. Am. Mineral. 2010, 95, 1473–1477. [Google Scholar] [CrossRef]
- Seagle, C.T.; Heinz, D.L.; Campbell, A.J.; Prakapenka, V.B.; Wanless, S.T. Melting and thermal expansion in the Fe-FeO system at high pressure. Earth Planet. Sci. Lett. 2008, 265, 655–665. [Google Scholar] [CrossRef]
- Lindsley, D.H. Pressure-temperature relations in the system FeO-SiO2. Year Book Carnegie Inst. Wash. 1966, 65, 226–230. [Google Scholar]
- Tsuno, K.; Ohtani, E.; Terasaki, H. Immiscible two-liquid regions in the Fe–O–S system at high pressure: Implications for planetary cores. Phys. Earth Planet. Inter. 2007, 160, 75–85. [Google Scholar] [CrossRef]
- Ohtani, E.; Ringwood, A.; Hibberson, W. Composition of the core, II. Effect of high pressure on solubility of FeO in molten iron. Earth Planet. Sci. Lett. 1984, 71, 94–103. [Google Scholar] [CrossRef]
- Wriedt, H. The Fe-O (iron-oxygen) system. J. Phase Equilibria Diffus. 1991, 12, 170–200. [Google Scholar] [CrossRef]
- Sundman, B. An assessment of the Fe-O system. J. Phase Equilibria Diffus. 1991, 12, 127–140. [Google Scholar] [CrossRef]
- Kowalski, M.; Spencer, P.J. Thermodynamic reevaluation of the Cr-O, Fe-O and Ni-O systems-remodeling of the liquid, bcc and fcc phases. Calphad 1995, 19, 229–243. [Google Scholar] [CrossRef]
- Frost, D.J.; Asahara, Y.; Rubie, D.C.; Miyajima, N.; Dubrovinsky, L.S.; Holzapfel, C.; Ohtani, E.; Miyahara, M.; Sakai, T. Partitioning of oxygen between the Earth’s mantle and core. J. Geophys. Res. Space Phys. 2010, 115. [Google Scholar] [CrossRef]
- Darken, L.S.; Gurry, R.W. The system iron-oxygen. II. Equilibrium and thermodynamics of liquid oxide and other phases. J. Am. Chem. Soc. 1946, 68, 798–816. [Google Scholar] [CrossRef]
- Ringwood, A.E.; Hibberson, W. The system Fe-FeO revisited. Phys. Chem. Miner. 1990, 17, 313–319. [Google Scholar] [CrossRef]
- Morard, G.; Andrault, D.; Antonangeli, D.; Nakajima, Y.; Auzende, A.L.; Boulard, E.; Cervera, S.; Clark, A.; Lord, O.T.; Siebert, J.; et al. Fe-FeO and Fe-Fe3C melting relations at Earth’s core-mantle boundary conditions: Implications for a volatile-rich or oxygen-rich core. Earth Planet. Sci. Lett. 2017, 473, 94–103. [Google Scholar] [CrossRef]
- Oka, K.; Hirose, K.; Tagawa, S.; Kidokoro, Y.; Nakajima, Y.; Kuwayama, Y.; Morard, G.; Coudurier, N.; Fiquet, G. Melting in the Fe-FeO system to 204 GPa: Implications for oxygen in Earth’s core. Am. Mineral. 2019, 104, 1603–1607. [Google Scholar] [CrossRef]
- Hattori, T.; Kinoshita, T.; Narushima, T.; Tsuji, K.; Katayama, Y. Pressure-induced structural change of liquid CdTe up to 23.5 GPa. Phys. Rev. B 2006, 73, 054203. [Google Scholar] [CrossRef]
- Badro, J.; Cote, A.S.; Brodholt, J.P. A seismologically consistent compositional model of Earth’s core. Proc. Natl. Acad. Sci. USA 2014, 111, 7542–7545. [Google Scholar] [CrossRef] [PubMed]
- Ichikawa, H.; Tsuchiya, T. Ab Initio Thermoelasticity of Liquid Iron-Nickel-Light Element Alloys. Minerals 2020, 10, 59. [Google Scholar] [CrossRef]
- Alfè, D.; Gillan, M.; Price, G. Composition and temperature of the Earth’s core constrained by combining ab initio calculations and seismic data. Earth Planet. Sci. Lett. 2002, 195, 91–98. [Google Scholar] [CrossRef]
- Dobson, D.P.; Crichton, W.A.; Bouvier, P.; Vočadlo, L.; Wood, I.G. The equation of state of CsCl-structured FeSi to 40 GPa: Implications for silicon in the Earth’s core. Geophys. Res. Lett. 2003, 30. [Google Scholar] [CrossRef]
- Lin, J.F.; Heinz, D.L.; Campbell, A.J.; Devine, J.M.; Shen, G.Y. Iron-silicon alloy in Earth’s core? Science 2002, 295, 313–315. [Google Scholar] [CrossRef] [PubMed]
- Lin, J.F.; Scott, H.P.; Fischer, R.A.; Chang, Y.Y.; Kantor, I.; Prakapenka, V.B. Phase relations of Fe-Si alloy in Earth’s core. Geophys. Res. Lett. 2009, 36. [Google Scholar] [CrossRef]
- Kuwayama, Y.; Hirose, K. Phase relations in the system Fe-FeSi at 21 GPa. Am. Mineral. 2004, 89, 273–276. [Google Scholar] [CrossRef]
- Fischer, R.A.; Campbell, A.J.; Reaman, D.M.; Miller, N.A.; Heinz, D.L.; Dera, P.; Prakapenka, V.B. Phase relations in the Fe-FeSi system at high pressures and temperatures. Earth Planet. Sci. Lett. 2013, 373, 54–64. [Google Scholar] [CrossRef]
- Fischer, R.A.; Campbell, A.J.; Caracas, R.; Reaman, D.M.; Heinz, D.L.; Dera, P.; Prakapenka, V.B. Equations of state in the Fe-FeSi system at high pressures and temperatures. J. Geophys. Res. Solid Earth 2014, 119, 2810–2827. [Google Scholar] [CrossRef]
- Tateno, S.; Kuwayama, Y.; Hirose, K.; Ohishi, Y. The structure of Fe-Si alloy in Earth’s inner core. Earth Planet. Sci. Lett. 2015, 418, 11–19. [Google Scholar] [CrossRef]
- Ozawa, H.; Hirose, K.; Yonemitsu, K.; Ohishi, Y. High-pressure melting experiments on Fe–Si alloys and implications for silicon as a light element in the core. Earth Planet. Sci. Lett. 2016, 456, 47–54. [Google Scholar] [CrossRef]
- Komabayashi, T.; Pesce, G.; Morard, G.; Antonangeli, D.; Sinmyo, R.; Mezouar, M. Phase transition boundary between fcc and hcp structures in Fe-Si alloy and its implications for terrestrial planetary cores. Am. Mineral. 2019, 104, 94–99. [Google Scholar] [CrossRef]
- Fischer, R.A.; Campbell, A.J.; Caracas, R.; Reaman, D.M.; Dera, P.; Prakapenka, V.B. Equation of state and phase diagram of Fe-16Si alloy as a candidate component of Earth’s core. Earth Planet. Sci. Lett. 2012, 357, 268–276. [Google Scholar] [CrossRef]
- Asanuma, H.; Ohtani, E.; Sakai, T.; Terasaki, H.; Kamada, S.; Hirao, N.; Sata, N.; Ohishi, Y. Phase relations of Fe-Si alloy up to core conditions: Implications for the Earth inner core. Geophys. Res. Lett. 2008, 35. [Google Scholar] [CrossRef]
- Kuwayama, Y.; Sawai, T.; Hirose, K.; Sata, N.; Ohishi, Y. Phase relations of iron–silicon alloys at high pressure and high temperature. Phys. Chem. Miner. 2009, 36, 511–518. [Google Scholar] [CrossRef]
- Vočadlo, L.; Alfè, D.; Gillan, M.J.; Wood, I.G.; Brodholt, J.P.; Price, G.D. Possible thermal and chemical stabilization of body-centred-cubic iron in the Earth’s core. Nature 2003, 424, 536–539. [Google Scholar] [CrossRef]
- Belonoshko, A.B.; Rosengren, A.; Burakovsky, L.; Preston, D.L.; Johansson, B. Melting of Fe and Fe0.9375Si0.0625 at Earth’s core pressures studied using ab initio molecular dynamics. Phys. Rev. B 2009, 79, 220102. [Google Scholar] [CrossRef]
- Andrault, D.; Bolfan-Casanova, N.; Ohtaka, O.; Fukui, H.; Arima, H.; Fialin, M.; Funakoshi, K. Melting diagrams of Fe-rich alloys determined from synchrotron in situ measurements in the 15–23 GPa pressure range. Phys. Earth Planet. Inter. 2009, 174, 181–191. [Google Scholar] [CrossRef]
- Morard, G.; Siebert, J.; Andrault, D.; Guignot, N.; Garbarino, G.; Guyot, F.; Antonangeli, D. The Earth’s core composition from high pressure density measurements of liquid iron alloys. Earth Planet. Sci. Lett. 2013, 373, 169–178. [Google Scholar] [CrossRef]
- Ohnuma, I.; Abe, S.; Shimenouchi, S.; Omori, T.; Kainuma, R.; Ishida, K. Experimental and thermodynamic studies of the Fe–Si binary system. ISIJ Int. 2012, 52, 540–548. [Google Scholar] [CrossRef]
- Huang, D.Y.; Badro, J.; Brodholt, J.; Li, Y.G. Ab Initio molecular dynamics investigation of molten Fe-Si-O in Earth’s core. Geophys. Res. Lett. 2019, 46, 6397–6405. [Google Scholar] [CrossRef]
- Asanuma, H.; Ohtani, E.; Sakai, T.; Terasaki, H.; Kamada, S.; Kondo, T.; Kikegawa, T. Melting of iron–silicon alloy up to the core–mantle boundary pressure: Implications to the thermal structure of the Earth’s core. Phys. Chem. Miner. 2009, 37, 353–359. [Google Scholar] [CrossRef]
- Morard, G.; Andrault, D.; Guignot, N.; Siebert, J.; Garbarino, G.; Antonangeli, D. Melting of Fe-Ni-Si and Fe-Ni-S alloys at megabar pressures: Implications for the core-mantle boundary temperature. Phys. Chem. Miner. 2011, 38, 767–776. [Google Scholar] [CrossRef]
- Lord, O.T.; Wann, E.T.H.; Hunt, S.A.; Walker, A.M.; Santangeli, J.; Walter, M.J.; Dobson, D.P.; Wood, I.G.; Vočadlo, L.; Morard, G.; et al. The NiSi melting curve to 70 GPa. Phys. Earth Planet. Inter. 2014, 233, 13–23. [Google Scholar] [CrossRef]
- Yamasaki, M.; Banno, S. Zoning pattern of extremely fractionated plagioclase crystallized from simple system. Bull. Volcanol. Soc. Jpn. 1972, 2, 18–25, (In Japanese with English abstract). [Google Scholar]
- Wade, J.; Wood, B.J. Core formation and the oxidation state of the Earth. Earth Planet. Sci. Lett. 2005, 236, 78–95. [Google Scholar] [CrossRef]
- Antonangeli, D.; Siebert, J.; Badro, J.; Farber, D.L.; Fiquet, G.; Morard, G.; Ryerson, F.J. Composition of the Earth’s inner core from high-pressure sound velocity measurements in Fe-Ni-Si alloys. Earth Planet. Sci. Lett. 2010, 295, 292–296. [Google Scholar] [CrossRef]
- Rubie, D.C.; Frost, D.J.; Mann, U.; Asahara, Y.; Nimmo, F.; Tsuno, K.; Kegler, P.; Holzheid, A.; Palme, H. Heterogeneous accretion, composition and core-mantle differentiation of the Earth. Earth Planet. Sci. Lett. 2011, 301, 31–42. [Google Scholar] [CrossRef]
- Badro, J.; Brodholt, J.P.; Piet, H.; Siebert, J.; Ryerson, F.J. Core formation and core composition from coupled geochemical and geophysical constraints. Proc. Natl. Acad. Sci. USA 2015, 112, 12310–12314. [Google Scholar] [CrossRef] [PubMed]
- Antonangeli, D.; Morard, G.; Paolasini, L.; Garbarino, G.; Murphy, C.A.; Edmund, E.; Decremps, F.; Fiquet, G.; Bosak, A.; Mezouar, M.; et al. Sound velocities and density measurements of solid hcp-Fe and hcp-Fe-Si (9 wt%) alloy at high pressure: Constraints on the Si abundance in the Earth’s inner core. Earth Planet. Sci. Lett. 2018, 482, 446–453. [Google Scholar] [CrossRef]
- Nakajima, Y.; Kawaguchi, S.I.; Hirose, K.; Tateno, S.; Kuwayama, Y.; Sinmyo, R.; Ozawa, H.; Tsutsui, S.; Uchiyama, H.; Baron, A.Q.R. Silicon-depleted present-day Earth’s outer core revealed by sound velocity measurements of liquid fe-si alloy. J. Geophys. Res. Solid Earth 2020, 125, e2020JB019399. [Google Scholar] [CrossRef]
- Hirose, K.; Labrosse, S.; Hernlund, J. Composition and state of the core. Annu. Rev. Earth Planet. Sci. 2013, 41, 657–691. [Google Scholar] [CrossRef]
- Campbell, A.J.; Seagle, C.T.; Heinz, D.L.; Shen, G.Y.; Prakapenka, V.B. Partial melting in the iron–sulfur system at high pressure: A synchrotron X-ray diffraction study. Phys. Earth Planet. Inter. 2007, 162, 119–128. [Google Scholar] [CrossRef]
- Ozawa, H.; Hirose, K.; Suzuki, T.; Ohishi, Y.; Hirao, N. Decomposition of Fe3S above 250 GPa. Geophys. Res. Lett. 2013, 40, 4845–4849. [Google Scholar] [CrossRef]
- Mori, Y.; Ozawa, H.; Hirose, K.; Sinmyo, R.; Tateno, S.; Morard, G.; Ohishi, Y. Melting experiments on Fe–Fe3S system to 254 GPa. Earth Planet. Sci. Lett. 2017, 464, 135–141. [Google Scholar] [CrossRef]
- Tateno, S.; Ozawa, H.; Hirose, K.; Suzuki, T.; I-Kawaguchi, S.; Hirao, N. Fe2S: The most Fe-rich iron sulfide at the Earth’s inner core pressures. Geophys. Res. Lett. 2019, 46, 11944–11949. [Google Scholar] [CrossRef]
- Kamada, S.; Ohtani, E.; Terasaki, H.; Sakai, T.; Miyahara, M.; Ohishi, Y.; Hirao, N. Melting relationships in the Fe–Fe3S system up to the outer core conditions. Earth Planet. Sci. Lett. 2012, 359–360, 26–33. [Google Scholar] [CrossRef]
- Pommier, A.; Laurenz, V.; Davies, C.J.; Frost, D.J. Melting phase relations in the Fe-S and Fe-S-O systems at core conditions in small terrestrial bodies. ICARUS 2018, 306, 150–162. [Google Scholar] [CrossRef]
- Waldner, P.; Pelton, A.D. Thermodynamic modeling of the Fe-S system. J. Phase Equilibria Diffus. 2005, 26, 23–38. [Google Scholar] [CrossRef]
- Chen, B.; Li, J.; Hauck, S.A. Non-ideal liquidus curve in the Fe-S system and Mercury’s snowing core. Geophys. Res. Lett. 2008, 35. [Google Scholar] [CrossRef]
- Fei, Y.W.; Li, J.; Bertka, C.M.; Prewitt, C.T. Structure type and bulk modulus of Fe3S, a new iron-sulfur compound. Am. Mineral. 2000, 85, 1830–1833. [Google Scholar] [CrossRef]
- Kamada, S.; Terasaki, H.; Ohtani, E.; Sakai, T.; Kikegawa, T.; Ohishi, Y.; Hirao, N.; Sata, N.; Kondo, T. Phase relationships of the Fe-FeS system in conditions up to the Earth’s outer core. Earth Planet. Sci. Lett. 2010, 294, 94–100. [Google Scholar] [CrossRef]
- Stewart, A.J.; Schmidt, M.W.; van Westrenen, W.; Liebske, C. Mars: A new core-crystallization regime. Science 2007, 316, 1323–1325. [Google Scholar] [CrossRef]
- Chudinovskikh, L.; Boehler, R. Eutectic melting in the system Fe-S to 44 GPa. Earth Planet. Sci. Lett. 2007, 257, 97–103. [Google Scholar] [CrossRef]
- Morard, G.; Andrault, D.; Guignot, N.; Sanloup, C.; Mezouar, M.; Petitgirard, S.; Fiquet, G. In situ determination of Fe–Fe3S phase diagram and liquid structural properties up to 65 GPa. Earth Planet. Sci. Lett. 2008, 272, 620–626. [Google Scholar] [CrossRef]
- Morard, G.; Andrault, D.; Antonangeli, D.; Bouchet, J. Properties of iron alloys under the Earth’s core conditions. Comptes Rendus Geosci. 2014, 346, 130–139. [Google Scholar] [CrossRef]
- Li, J.; Fei, Y.; Mao, H.K.; Hirose, K.; Shieh, S.R. Sulfur in the Earth’s inner core. Earth Planet. Sci. Lett. 2001, 193, 509–514. [Google Scholar] [CrossRef]
- Seagle, C.T.; Campbell, A.J.; Heinz, D.L.; Shen, G.; Prakapenka, V.B. Thermal equation of state of Fe3S and implications for sulfur in Earth’s core. J. Geophys. Res. Space Phys. 2006, 111. [Google Scholar] [CrossRef]
- Kamada, S.; Ohtani, E.; Terasaki, H.; Sakai, T.; Takahashi, S.; Hirao, N.; Ohishi, Y. Equation of state of Fe3S at room temperature up to 2-megabars. Phys. Earth Planet. Inter. 2014, 228, 106–113. [Google Scholar] [CrossRef]
- Chen, B.; Gao, L.L.; Funakoshi, K.; Li, J. Thermal expansion of iron-rich alloys and implications for the Earth’s core. Proc. Natl. Acad. Sci. USA 2007, 104, 9162–9167. [Google Scholar] [CrossRef] [PubMed]
- Thompson, S.; Komabayashi, T.; Breton, H.; Suehiro, S.; Glazyrin, K.; Pakhomova, A.; Ohishi, Y. Compression experiments to 126 GPa and 2500 K and thermal equation of state of Fe3S: Implications for sulphur in the Earth’s core. Earth Planet. Sci. Lett. 2020, 534, 116080. [Google Scholar] [CrossRef]
- Hillert, M.; Staffansson, L.I. An analysis of the phase equilibria in the Fe-FeS system. Metall. Mater. Trans. B 1975, 6, 37–41. [Google Scholar] [CrossRef]
- Sharma, R.C.; Chang, Y.A. Thermodynamics and phase relationships of transition metal-sulfur systems: Part III. Thermodynamic properties of the Fe-S liquid-phase and the calculation of the Fe-S phase diagram. Metall. Trans. B 1979, 10, 103–108. [Google Scholar] [CrossRef]
- Guillermet, A.F.; Hillert, M.; Jansson, B.; Sundman, B. An assessment of the Fe-S system using a 2-sublattice model for the liquid-phase. Metall. Trans. B 1981, 12, 745–754. [Google Scholar] [CrossRef]
- Chuang, Y.Y.; Hsieh, K.C.; Chang, Y.A. Thermodynamics and phase relationships of transition metal-sulfur systems: Part V. A reevaluation of the Fe-S System using an associated solution model for the liquid-phase. Metall. Trans. B 1985, 16, 277–285. [Google Scholar] [CrossRef]
- Saxena, S.; Eriksson, G. Thermodynamics of Fe-S at ultra-high pressure. Calphad 2015, 51, 202–205. [Google Scholar] [CrossRef]
- Umemoto, K.; Hirose, K.; Imada, S.; Nakajima, Y.; Komabayashi, T.; Tsutsui, S.; Baron, A.Q.R. Liquid iron-sulfur alloys at outer core conditions by first-principles calculations. Geophys. Res. Lett. 2014, 41, 6712–6717. [Google Scholar] [CrossRef]
- Fu, J.; Cao, L.Z.; Duan, X.M.; Belonoshko, A.B. Density and sound velocity of liquid Fe-S alloys at Earth’s outer core P-T conditions. Am. Mineral. 2020, 105, 1349–1354. [Google Scholar] [CrossRef]
- Huang, H.J.; Wu, S.J.; Hu, X.J.; Wang, Q.S.; Wang, X.; Fei, Y.W. Shock compression of Fe-FeS mixture up to 204 GPa. Geophys. Res. Lett. 2013, 40, 687–691. [Google Scholar] [CrossRef]
- Vočadlo, L.; Alfè, D.; Gillan, M.J.; Price, G.D. The properties of iron under core conditions from first principles calculations. Phys. Earth Planet. Inter. 2003, 140, 101–125. [Google Scholar] [CrossRef]
- Grigorovich, V.K. The polymorphism of iron and the electron structure of iron alloys. Izvt. Akad. Nauk. SSSR Met. JAN-FEB 1969, 1, 53–68. (In Russian) [Google Scholar]
- Shterenberg, L.E.; Slesarev, V.N.; Korsunskaya, I.A.; Kamenetskaya, D.S. The experimental study of the interaction between the melt, carbides and diamond in the iron-carbon system at high pressures. High Temp. High Press. 1975, 7, 517–522. [Google Scholar]
- Wood, B.J. Carbon in the core. Earth Planet. Sci. Lett. 1993, 117, 593–607. [Google Scholar] [CrossRef]
- Nakajima, Y.; Takahashi, E.; Suzuki, T.; Funakoshi, K. “Carbon in the core” revisited. Phys. Earth Planet. Inter. 2009, 174, 202–211. [Google Scholar] [CrossRef]
- Gustafson, P. A Thermodynamic Evaluation of the Fe-C System. Scand. J. Metall. 1985, 14, 259–267. [Google Scholar] [CrossRef]
- Chabot, N.L.; Campbell, A.J.; McDonough, W.F.; Draper, D.S.; Agee, C.B.; Humayun, M.; Watson, H.C.; Cottrell, E.; Saslow, S.A. The Fe-C system at 5 GPa and implications for Earth’s core. Geochim. Cosmochim. Acta 2008, 72, 4146–4158. [Google Scholar] [CrossRef]
- Fei, Y.W.; Brosh, E. Experimental study and thermodynamic calculations of phase relations in the Fe-C system at high pressure. Earth Planet. Sci. Lett. 2014, 408, 155–162. [Google Scholar] [CrossRef]
- Benz, M.G.; Elliott, J.F. The austenite solidus and revised iron-carbon diagram. Trans. Metall. Soc. AIME 1961, 221, 323–331. [Google Scholar]
- Mashino, I.; Miozzi, F.; Hirose, K.; Morard, G.; Sinmyo, R. Melting experiments on the Fe-C binary system up to 255 GPa: Constraints on the carbon content in the Earth’s core. Earth Planet. Sci. Lett. 2019, 515, 135–144. [Google Scholar] [CrossRef]
- Liu, J.; Lin, J.F.; Prakapenka, V.B.; Prescher, C.; Yoshino, T. Phase relations of Fe3C and Fe7C3 up to 185 GPa and 5200 K: Implication for the stability of iron carbide in the Earth’s core. Geophys. Res. Lett. 2016, 43, 12415–12422. [Google Scholar]
- Walker, D.; Dasgupta, R.; Li, J.; Buono, A. Nonstoichiometry and growth of some Fe carbides. Contrib. Mineral. Petrol. 2013, 166, 935–957. [Google Scholar] [CrossRef]
- Caracas, R. The influence of carbon on the seismic properties of solid iron. Geophys. Res. Lett. 2017, 44, 128–134. [Google Scholar] [CrossRef]
- Yang, J.; Fei, Y.W.; Hu, X.J.; Greenberg, E.; Prakapenka, V.B. Effect of carbon on the volume of solid iron at high pressure: Implications for carbon substitution in iron structures and carbon content in the Earth’s inner core. Minerals 2019, 9, 720. [Google Scholar] [CrossRef]
- Gao, L.L.; Chen, B.; Wang, J.Y.; Alp, E.E.; Zhao, J.Y.; Lerche, M.; Sturhahn, W.; Scott, H.P.; Huang, F.; Ding, Y.; et al. Pressure-induced magnetic transition and sound velocities of Fe3C: Implications for carbon in the Earth’s inner core. Geophys. Res. Lett. 2008, 35. [Google Scholar] [CrossRef]
- Gao, L.L.; Chen, B.; Zhao, J.Y.; Alp, E.E.; Sturhahn, W.; Li, J. Effect of temperature on sound velocities of compressed Fe3C, a candidate component of the Earth’s inner core. Earth Planet. Sci. Lett. 2011, 309, 213–220. [Google Scholar] [CrossRef]
- Chen, B.; Lai, X.J.; Li, J.; Liu, J.C.; Zhao, J.Y.; Bi, W.L.; Alp, E.E.; Hu, M.Y.; Xiao, Y.M. Experimental constraints on the sound velocities of cementite Fe3C to core pressures. Earth Planet. Sci. Lett. 2018, 494, 164–171. [Google Scholar] [CrossRef]
- Prescher, C.; Dubrovinsky, L.; Bykova, E.; Kupenko, I.; Glazyrin, K.; Kantor, A.; McCammon, C.; Mookherjee, M.; Nakajima, Y.; Miyajima, N.; et al. High Poisson’s ratio of Earth’s inner core explained by carbon alloying. Nat. Geosci. 2015, 8, 220–223. [Google Scholar] [CrossRef]
- Chen, B.; Li, Z.Y.; Zhang, D.Z.; Liu, J.C.; Hu, M.Y.; Zhao, J.Y.; Bi, W.L.; Alp, E.E.; Xiao, Y.M.; Chow, P.; et al. Hidden carbon in Earth’s inner core revealed by shear softening in dense Fe7C3. Proc. Natl. Acad. Sci. USA 2014, 111, 17755–17758. [Google Scholar] [CrossRef]
- Lord, O.T.; Walter, M.J.; Dasgupta, R.; Walker, D.; Clark, S.M. Melting in the Fe-C system to 70 GPa. Earth Planet. Sci. Lett. 2009, 284, 157–167. [Google Scholar] [CrossRef]
- Takahashi, S.; Ohtani, E.; Sakai, T.; Kamada, S.; Ozawa, S.; Sakamaki, T.; Miyahara, M.; Ito, Y.; Hirao, N.; Ohishi, Y. Phase and melting relations of Fe3C to 300 GPa and carbon in the core. In Carbon in Earth’s Interior; Manning, C.E., Lin, J.-F., Mao, W.L., Eds.; AGU: Washington, DC, USA, 2020. [Google Scholar]
- Mookherjee, M.; Nakajima, Y.; Steinle-Neumann, G.; Glazyrin, K.; Wu, X.A.; Dubrovinsky, L.; McCammon, C.; Chumakov, A. High-pressure behavior of iron carbide (Fe7C3) at inner core conditions. J. Geophys. Res. Solid Earth 2011, 116. [Google Scholar] [CrossRef]
- McGuire, C.; Komabayashi, T.; Thompson, S.; Bromiley, G.; Greenberg, E.; Prakapenka, V.B. P-V-T measurements of Fe3C to 117 GPa and 2100 K: Implications for stability of Fe3C phase at core conditions. Am. Mineral. 2021. [Google Scholar] [CrossRef]
- Chipman, J. Thermodynamics and phase diagram of Fe-C System. Metall. Trans. 1972, 3, 55–64. [Google Scholar] [CrossRef]
- Shubhank, K.; Kang, Y.B. Critical evaluation and thermodynamic optimization of Fe-Cu, Cu-C, Fe-C binary systems and Fe-Cu-C ternary system. Calphad 2014, 45, 127–137. [Google Scholar] [CrossRef]
- Nakajima, Y.; Takahashi, E.; Sata, N.; Nishihara, Y.; Hirose, K.; Funakoshi, K.; Ohishi, Y. Thermoelastic property and high-pressure stability of Fe7C3: Implication for iron-carbide in the Earth’s core. Am. Mineral. 2011, 96, 1158–1165. [Google Scholar] [CrossRef]
- Nakajima, Y.; Imada, S.; Hirose, K.; Komabayashi, T.; Ozawa, H.; Tateno, S.; Tsutsui, S.; Kuwayama, Y.; Baron, A.Q.R. Carbon-depleted outer core revealed by sound velocity measurements of liquid iron-carbon alloy. Nat. Commun. 2015, 6, 9942. [Google Scholar] [CrossRef]
- Fukai, Y.; Mori, K.; Shinomiya, H. The phase diagram and superabundant vacancy formation in Fe-H alloys under high hydrogen pressures. J. Alloys Compd. 2003, 348, 105–109. [Google Scholar] [CrossRef]
- Okuchi, T. Hydrogen partitioning into molten iron at high pressure: Implications for Earth’s core. Science 1997, 278, 1781–1784. [Google Scholar] [CrossRef]
- Zinkevich, M.; Mattern, N.; Handstein, A.; Gutfleisch, O. Thermodynamics of Fe-Sm, Fe-H, and H-Sm systems and its application to the hydrogen-disproportionation-desorption-recombination (HDDR) process for the system Fe17Sm2-H2. J. Alloys Compd. 2002, 339, 118–139. [Google Scholar] [CrossRef]
- Fukai, Y.; Suzuki, T. Iron-water reaction under high-pressure and its implication in the evolution of the Earth. J. Geophys. Res. Solid Earth Planets 1986, 91, 9222–9230. [Google Scholar] [CrossRef]
- Fukai, Y. Some properties of the Fe-H system at high pressures and temperatures, and their implications for the Earth’s core. In High-Pressure Research: Application to Earth and Planetary Sciences; Syono, Y., Manghnani, M.H., Eds.; AGU: Washington, DC, USA, 1992; pp. 373–385. [Google Scholar]
- Sakamaki, K.; Takahashi, E.; Nakajima, Y.; Nishihara, Y.; Funakoshi, K.; Suzuki, T.; Fukai, Y. Melting phase relation of FeHx up to 20 GPa: Implication for the temperature of the Earth’s core. Phys. Earth Planet. Inter. 2009, 174, 192–201. [Google Scholar] [CrossRef]
- Shibazaki, Y.; Ohtani, E.; Fukui, H.; Sakai, T.; Kamada, S.; Ishikawa, D.; Tsutsui, S.; Baron, A.Q.R.; Nishitani, N.; Hirao, N.; et al. Sound velocity measurements in dhcp-FeH up to 70 GPa with inelastic X-ray scattering: Implications for the composition of the Earth’s core. Earth Planet. Sci. Lett. 2012, 313, 79–85. [Google Scholar] [CrossRef]
- Pepin, C.M.; Dewaele, A.; Geneste, G.; Loubeyre, P.; Mezouar, M. New iron hydrides under high pressure. Phys. Rev. Lett. 2014, 113, 265504. [Google Scholar] [CrossRef] [PubMed]
- Hirose, K.; Tagawa, S.; Kuwayama, Y.; Sinmyo, R.; Morard, G.; Ohishi, Y.; Genda, H. Hydrogen limits carbon in liquid iron. Geophys. Res. Lett. 2019, 46, 5190–5197. [Google Scholar] [CrossRef]
- Narygina, O.; Dubrovinsky, L.S.; McCammon, C.A.; Kurnosov, A.; Kantor, I.Y.; Prakapenka, V.B.; Dubrovinskaia, N.A. X-ray diffraction and Mossbauer spectroscopy study of fcc iron hydride FeH at high pressures and implications for the composition of the Earth’s core. Earth Planet. Sci. Lett. 2011, 307, 409–414. [Google Scholar] [CrossRef]
- Thompson, E.C.; Davis, A.H.; Bi, W.; Zhao, J.; Alp, E.E.; Zhang, D.; Greenberg, E.; Prakapenka, V.B.; Campbell, A.J. High-pressure geophysical properties of fcc phase FeHx. Geochem. Geophys. Geosyst. 2018, 19, 305–314. [Google Scholar] [CrossRef]
- Kato, C.; Umemoto, K.; Ohta, K.; Tagawa, S.; Hirose, K.; Ohishi, Y. Stability of fcc phase FeH to 137 GPa. Am. Mineral. 2020, 105, 917–921. [Google Scholar] [CrossRef]
- Suzuki, T.; Akimoto, S.; Fukai, Y. The system iron enstatite water at high-pressures and Temperatures-formation of iron hydride and some geophysical implications. Phys. Earth Planet. Inter. 1984, 36, 135–144. [Google Scholar] [CrossRef]
- Caracas, R. The influence of hydrogen on the seismic properties of solid iron. Geophys. Res. Lett. 2015, 42, 3780–3785. [Google Scholar] [CrossRef]
- Fiquet, G.; Badro, J.; Guyot, F.; Requardt, H.; Krisch, M. Sound velocities in iron to 110 gigapascals. Science 2001, 291, 468–471. [Google Scholar] [CrossRef] [PubMed]
- Antonangeli, D.; Komabayashi, T.; Occelli, F.; Borissenko, E.; Walters, A.C.; Fiquet, G.; Fei, Y.W. Simultaneous sound velocity and density measurements of hcp iron up to 93 GPa and 1100 K: An experimental test of the Birch’s law at high temperature. Earth Planet. Sci. Lett. 2012, 331, 210–214. [Google Scholar] [CrossRef]
- Murphy, C.A.; Jackson, J.M.; Sturhahn, W. Experimental constraints on the thermodynamics and sound velocities of hcp-Fe to core pressures. J. Geophys. Res. Solid Earth 2013, 118, 1999–2016. [Google Scholar] [CrossRef]
- Umemoto, K.; Hirose, K. Liquid iron-hydrogen alloys at outer core conditions by first-principles calculations. Geophys. Res. Lett. 2015, 42, 7513–7520. [Google Scholar] [CrossRef]
- Komabayashi, T.; Pesce, G.; Sinmyo, R.; Kawazoe, T.; Breton, H.; Shimoyama, Y.; Glazyrin, K.; Konopkova, Z.; Mezouar, M. Phase relations in the system Fe-Ni-Si to 200 GPa and 3900 K and implications for Earth’s core. Earth Planet. Sci. Lett. 2019, 512, 83–88. [Google Scholar] [CrossRef]
- Zhang, Y.J.; Sekine, T.; Lin, J.F.; He, H.L.; Liu, F.S.; Zhang, M.J.; Sato, T.; Zhu, W.J.; Yu, Y. Shock compression and melting of an Fe-Ni-Si alloy: Implications for the temperature profile of the Earth’s core and the heat flux across the core-mantle boundary. J. Geophys. Res. Solid Earth 2018, 123, 1314–1327. [Google Scholar] [CrossRef]
- Hirose, K.; Morard, G.; Sinmyo, R.; Umemoto, K.; Hernlund, J.; Helffrich, G.; Labrosse, S. Crystallization of silicon dioxide and compositional evolution of the Earth’s core. Nature 2017, 543, 99–102. [Google Scholar] [CrossRef] [PubMed]
- Arveson, S.M.; Deng, J.; Karki, B.B.; Lee, K.K.M. Evidence for Fe-Si-O liquid immiscibility at deep Earth pressures. Proc. Natl. Acad. Sci. USA 2019, 116, 10238–10243. [Google Scholar] [CrossRef] [PubMed]


Publisher’s Note: MDPI stays neutral with regard to jurisdictional claims in published maps and institutional affiliations. |
© 2021 by the author. Licensee MDPI, Basel, Switzerland. This article is an open access article distributed under the terms and conditions of the Creative Commons Attribution (CC BY) license (https://creativecommons.org/licenses/by/4.0/).
Share and Cite
Komabayashi, T. Phase Relations of Earth’s Core-Forming Materials. Crystals 2021, 11, 581. https://doi.org/10.3390/cryst11060581
Komabayashi T. Phase Relations of Earth’s Core-Forming Materials. Crystals. 2021; 11(6):581. https://doi.org/10.3390/cryst11060581
Chicago/Turabian StyleKomabayashi, Tetsuya. 2021. "Phase Relations of Earth’s Core-Forming Materials" Crystals 11, no. 6: 581. https://doi.org/10.3390/cryst11060581
APA StyleKomabayashi, T. (2021). Phase Relations of Earth’s Core-Forming Materials. Crystals, 11(6), 581. https://doi.org/10.3390/cryst11060581