Article

Electron Polarons in Lithium Niobate: Charge Localization, Lattice Deformation, and Optical Response

Department Physik, Universität Paderborn, 33095 Paderborn, Germany
*
Author to whom correspondence should be addressed.
Crystals 2021, 11(5), 542; https://doi.org/10.3390/cryst11050542
Submission received: 30 March 2021 / Revised: 26 April 2021 / Accepted: 2 May 2021 / Published: 13 May 2021
(This article belongs to the Special Issue New Trends in Lithium Niobate: From Bulk to Nanocrystals)

Abstract

:
Lithium niobate (LiNbO 3 ), a material frequently used in optical applications, hosts different kinds of polarons that significantly affect many of its physical properties. In this study, a variety of electron polarons, namely free, bound, and bipolarons, are analyzed using first-principles calculations. We perform a full structural optimization based on density-functional theory for selected intrinsic defects with special attention to the role of symmetry-breaking distortions that lower the total energy. The cations hosting the various polarons relax to a different degree, with a larger relaxation corresponding to a larger gap between the defect level and the conduction-band edge. The projected density of states reveals that the polaron states are formerly empty Nb 4 d states lowered into the band gap. Optical absorption spectra are derived within the independent-particle approximation, corrected by the G W approximation that yields a wider band gap and by including excitonic effects within the Bethe–Salpeter equation. Comparing the calculated spectra with the density of states, we find that the defect peak observed in the optical absorption stems from transitions between the defect level and a continuum of empty Nb 4 d states. Signatures of polarons are further analyzed in the reflectivity and other experimentally measurable optical coefficients.

Graphical Abstract

1. Introduction

Lithium niobate (LiNbO 3 , LN) is a transparent ferroelectric solid that is extensively used in optical technologies due to its advantageous combination of functional properties and commercial availability. In particular, its large piezoelectric, electro-optical, acousto-optical, and nonlinear optical coefficients make it an ideal material for a wide range of optical devices, such as optical modulators [1], waveguides [2], optical sensors [3], holographic storage [4], and integrated photonics [5]. By doping with other elements or by manipulating the sample geometry or crystal structure, for example by periodic poling of the ferroelectric domains, the properties of LN can be tailored for specific purposes [6]. To achieve optimal results, it is important to understand how structural details at the atomic scale influence the observable electronic and optical properties of the material.
The nominal composition of LiNbO 3 involves an equal number of lithium and niobium atoms, and although it is possible to produce high-quality stoichiometric LN samples by various methods [7], these are not viable for large-scale fabrication. Instead, the Czochralski technique that is typically used to grow LN single crystals for commercial applications from a congruent melt leads to a Li:Nb ratio of about 48.5:51.5 [8]. Even without external doping, this relative surplus of Nb in congruent LN crystals implies a high concentration of intrinsic defects, whose nature has long been a matter of debate, as different conceivable defect models are compatible with the observed nonstoichiometric composition [9]. Nowadays, it is widely accepted that Nb Li antisite defects, where extra niobium atoms are inserted on regular lithium sites, play a central role in explaining this imbalance. As the two atomic species have different charge states, the resulting excess charge must be compensated by other defect types, such as cationic vacancies, however. In the prevalent Li-vacancy model, originally proposed by Lerner et al. [10], each Nb Li antisite defect is compensated by four Li vacancies, denoted as V Li . However, interstitial Nb V atoms placed at empty cationic sites in the crystal lattice could also contribute to the surplus of niobium [11]. As we showed recently, these models may be partially reconciled, because a Nb V –V Li defect pair consisting of an interstitial niobium atom and a lithium vacancy can be regarded as a metastable variant of the Nb Li antisite defect, where the antisite niobium atom overcomes a modest energy barrier and migrates to a neighboring empty cationic site [12].
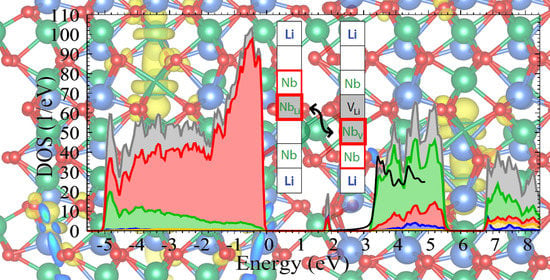
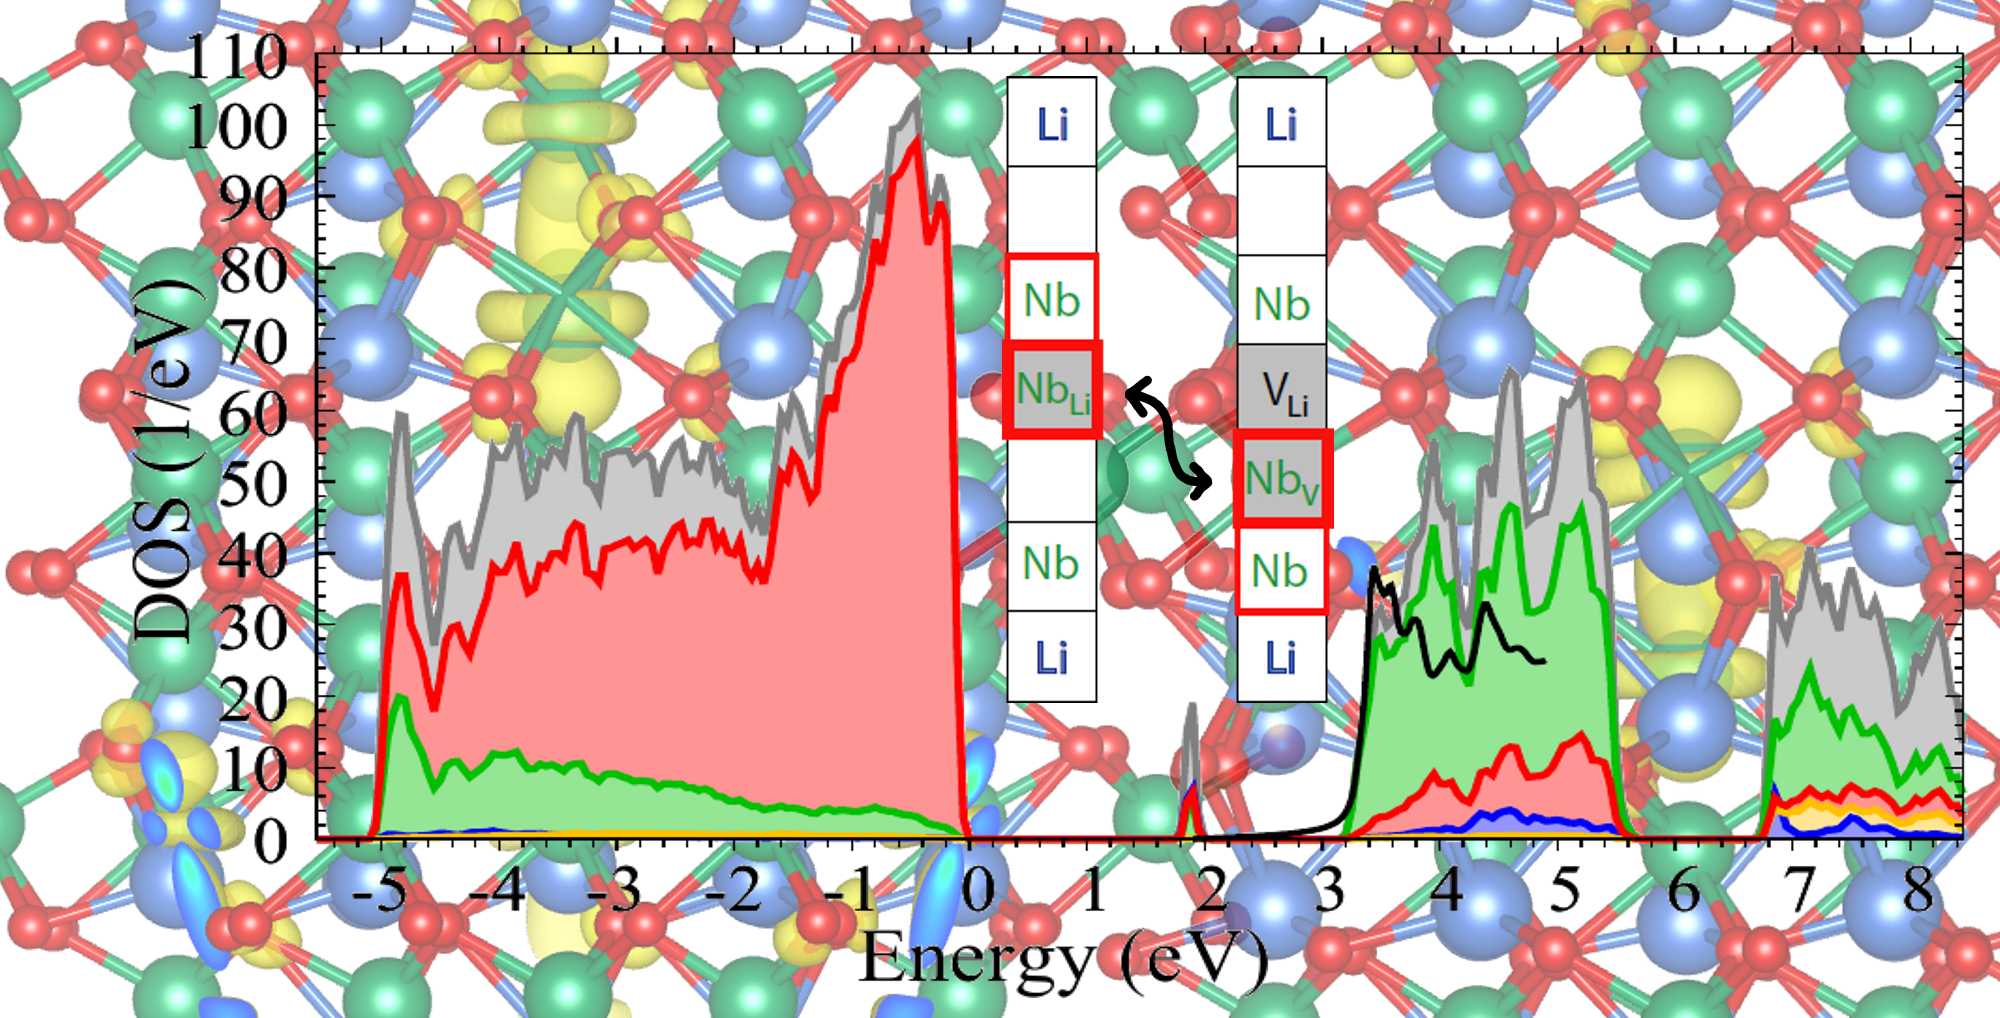
An important consequence of the high defect concentration in LN is the ubiquitous occurrence of different types of polarons [13]. These arise when mobile electrons or holes interact with the ionic lattice to create a local distortion, leading to an attractive effective potential. If the resulting potential well is sufficiently deep, then the charge carrier is trapped and immobilized. The quasiparticle consisting of the self-trapped electron or hole together with the surrounding spatially localized lattice distortion is called polaron or, more specifically, small polaron if the coupling is so strong that the charge carriers are essentially confined to a single lattice site. In LN, three polaron-related optical absorption bands are experimentally observed at 0.9 eV [14], 1.6 eV [15], and 2.5 eV [16]. Based on circumstantial evidence, these are usually attributed to the free electron polaron trapped at a regular Nb lattice site (Nb Nb ), the bound polaron formed by a single localized electron at a Nb Li antisite defect, and the bipolaron formed by a pair of bound electrons, one at a Nb Li antisite defect and the other at the neighboring regular Nb Nb atom, respectively, [13]. In particular, the temperature dependence of the relative strengths of the absorption bands at 1.6 eV and 2.5 eV are consistent with the thermal [16] or optical [17] dissociation of bipolarons into single bound polarons, and the band at 0.9 eV could only be observed in reduced samples with a high dopant concentration of Mg ions, which inhibit the formation of Nb Li antisite defects, leaving free polarons as a natural explanation [14]. On the other hand, the assignment to particular defect types rests chiefly on the correlation with electron-paramagnetic-resonance (EPR) signals believed to originate from Nb Li antisite defects [13], but as the actual spatial distribution of the polaron cannot be imaged directly in experiments, the precise relation between the antisite defect and the localized charge accumulation ultimately remains open. In this situation, first-principles simulations of the defect structures and their EPR parameters [12] as well as their optical spectroscopic properties provide valuable further insight.
In an early theoretical study, Donnerberg et al. [18] employed a semiempirical shell model to investigate intrinsic defects in LN. Their results, as well as other subsequent atomistic simulations with improved interaction potentials [19], lent support to the Li-vacancy model and indicated the stability of small electron polarons and bipolarons, but neither the electronic energy levels nor the corresponding orbitals appear explicitly in this approach. Later, first-principles calculations based on density-functional theory yielded accurate quantitative values for the formation energies of several possible intrinsic defects and confirmed the Li-vacancy scenario as the dominant mechanism for the deviation from stoichiometry [20,21]. Furthermore, the localized wavefunctions of the bound polaron and the bipolaron at the Nb Li antisite defect are accessible in this framework [22]. As density-functional theory systematically underestimates the band gap of insulators like LN, the position of the defect levels inside the band gap cannot be obtained reliably in this way, however, precluding a quantitative comparison with the experimentally observed absorption bands. In a first step, the band-gap problem can be solved by including quasiparticle corrections within the G W approximation for the electronic self-energy [23,24], the zero-point renormalization due to lattice vibrations [25], and spin-orbit coupling, which altogether raise the band gap of LN by about 2 eV compared to standard density-functional theory [26]. Second, the optical absorption spectrum is strongly influenced by electron-hole attraction effects, which give rise to excitonic resonances. In principle, these can be treated within time-dependent density-functional theory. Numerical results reported by Friedrich et al. for intrinsic [27] and extrinsic [28] defects in LN were in good quantitative agreement with the experimental data, but the uncertainty due to empirical corrections, which are necessary to countervail limitations of standard approximations in time-dependent density-functional theory [29], still precluded a reliable discrimination between competing defect configurations involving antisite or interstitial niobium atoms. As an alternative, we adopt the Bethe–Salpeter equation (BSE), which requires no such empirical corrections, to determine the optical response in this work. Owing to the much higher computational expense, a full solution of the BSE was initially limited to stoichiometric LN [23,30], but we recently succeeded in extending this approach to congruent LN [12], which requires a larger supercell to accommodate the defect.
The aim of this paper is twofold. First, we present a detailed description of the geometric and electronic structure of electron polarons in LN, with special focus on the quasi-Jahn-Teller distortion that breaks the threefold rotational symmetry in the case of free and bound polarons. The resulting tilted configurations were only very recently revealed as the true ground states [12] and are hence not yet widely discussed in the literature, as previous theoretical studies [21,22] were based on simpler, axially symmetric structure models instead. Second, we analyze the contribution of polarons to the dielectric function, which is related to the optical absorption spectrum. Going beyond our previous work [12], we also investigate polaron signatures in other optical coefficients like the reflectivity or the electron-energy-loss function, which can be measured directly in experiments.
This paper is organized as follows. In Section 2, we present the different structure models for free polarons, bound polarons, and bipolarons, and we explain our computational methods. Subsequently, we discuss our results for the polaron-induced lattice deformation in Section 3.1, for the electronic structure in Section 3.2, and for the dielectric function and optical coefficients in Section 3.3. Finally, Section 4 summarizes our conclusions.

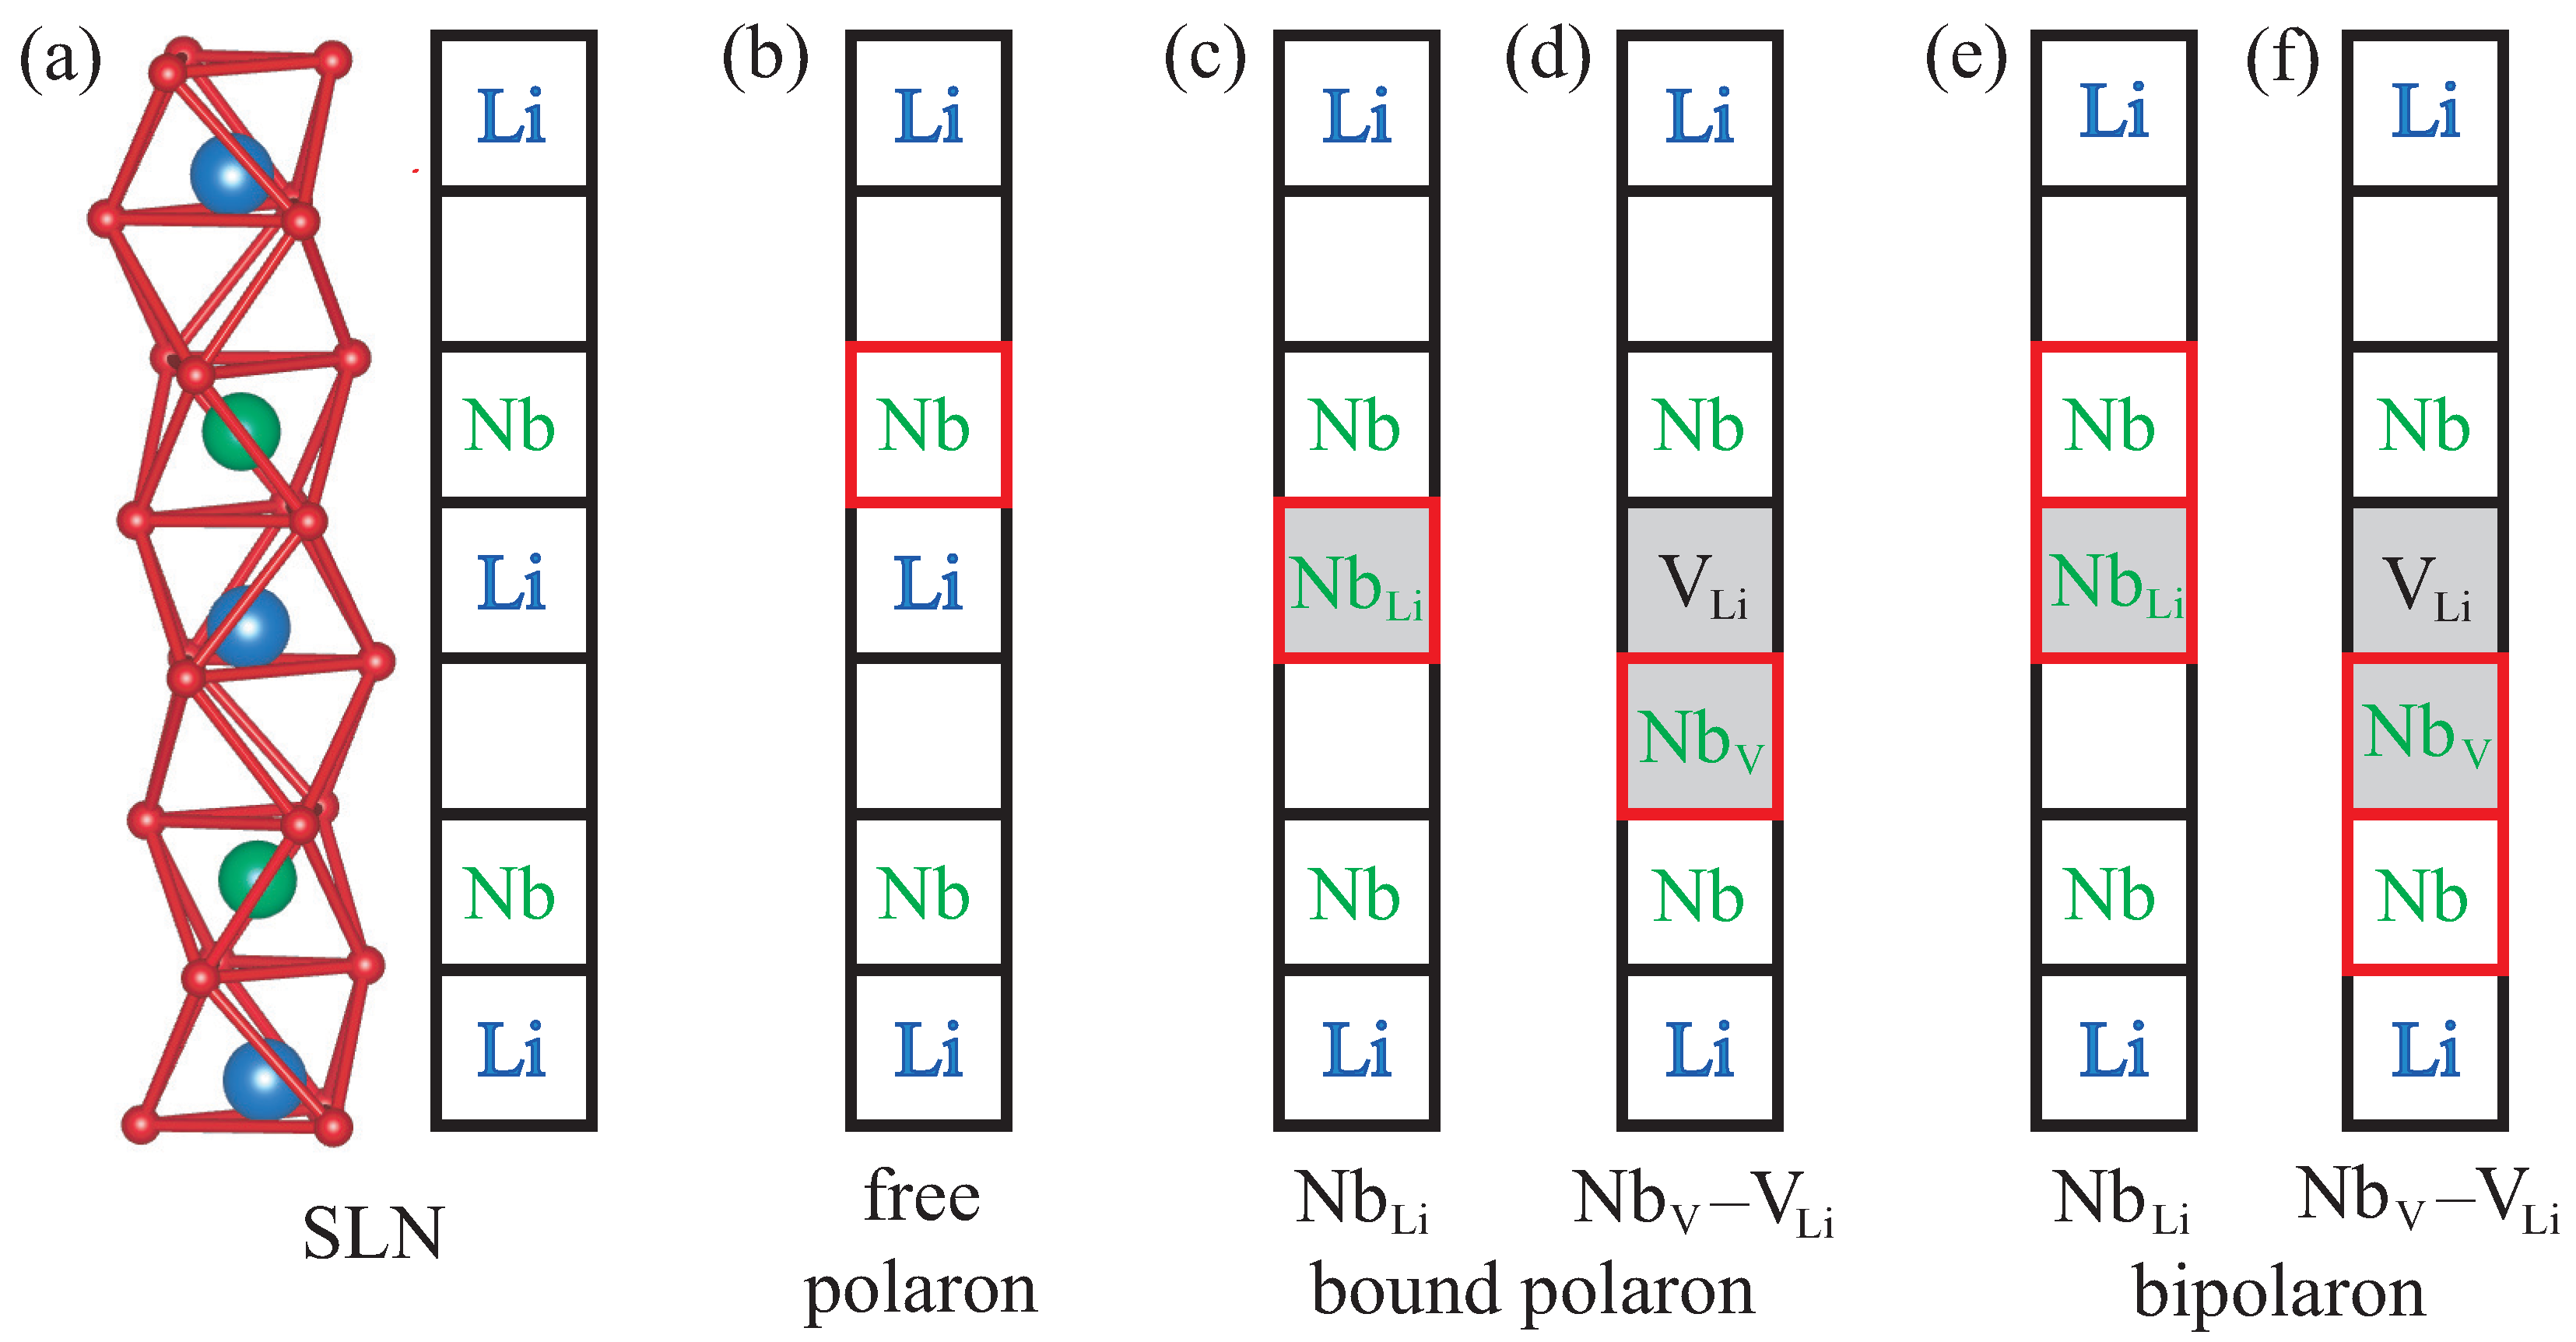
2. Models and Methods

Lithium niobate belongs to the trigonal crystal system with the space group R 3 c [
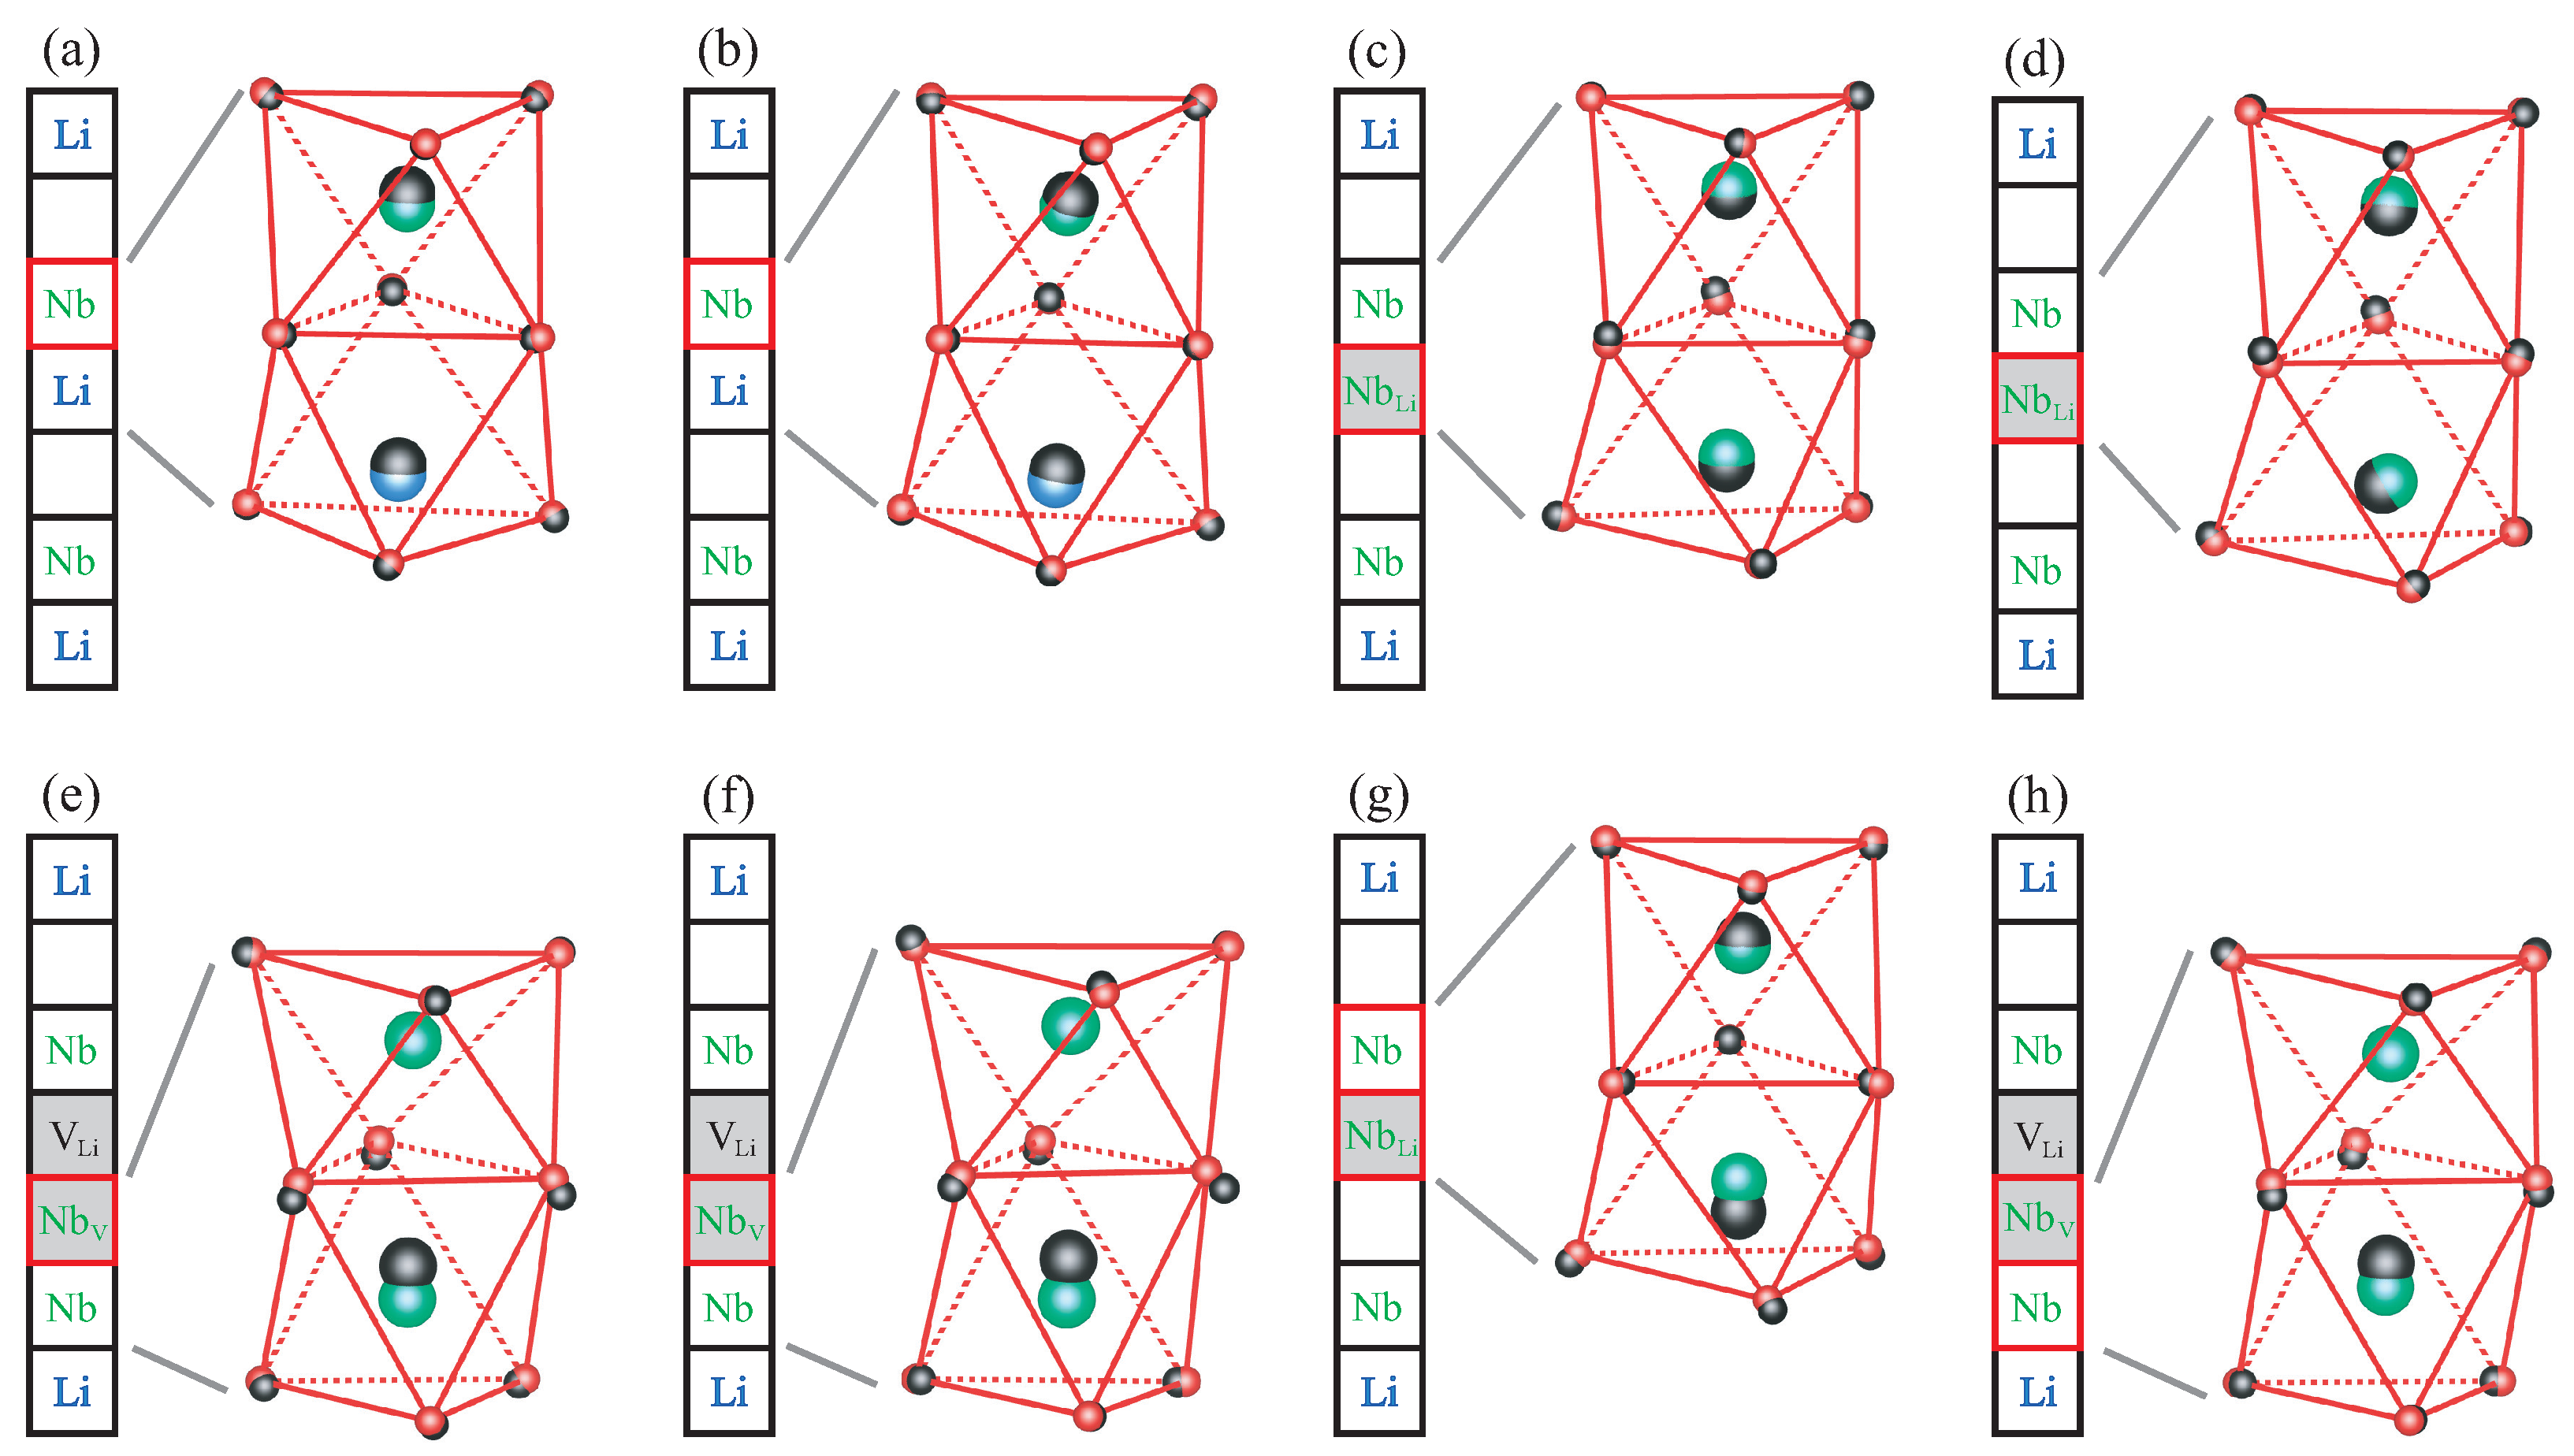
8]. Its crystal structure consists of octahedral cages formed by oxygen atoms. The cationic sites inside the oxygen cages can either be occupied by a lithium or niobium ion, or remain empty. For defect-free stoichiometric lithium niobate (SLN), the stacking order along the threefold symmetry axis is a periodic repetition of the sequence Li–Nb–vacancy as illustrated in Figure 1a. Due to the ferroelectric distortion, which breaks the inversion symmetry, the cations do not reside in the geometric center of the oxygen cages but are slightly displaced in the vertical direction. To highlight point defects in LN, which can be characterized by a modified occupancy of the cationic sites, we use a schematic representation where each square symbolizes a filled or empty oxygen octahedron.
In the absence of defects, an additional electron introduced into the material will localize at one of the regular Nb Nb atoms, as indicated by the red square in Figure 1b. Together with the resulting lattice relaxation, this gives rise to the free polaron. Congruent LN, on the other hand, features a high concentration of Nb Li antisite defects. In this scenario, an additional electron will localize at the defect site instead, creating a bound polaron as in Figure 1c. The Nb Li antisite atom can also migrate into the next empty oxygen octahedron, producing a Nb V –V Li defect pair. This configuration can likewise host a bound polaron, depicted in Figure 1d. If not one but two electrons are added to the system, then a bipolaron forms either at the antisite, Figure 1e, or the defect pair, Figure 1f. All defect structures illustrated in Figure 1 are considered in this work.
The primitive rhombohedral unit cell of stoichiometric LN contains two formula units of LiNbO 3 , amounting to 10 atoms. For the investigation of point defects, we choose a periodically repeated 2 × 2 × 2 supercell with 80 atoms, in which one defect is embedded. The same supercell geometry was used in [21,22]. An explicit comparison of different supercells containing between 80 and 270 atoms found that the formation energies of the defect types considered here remain stable for all supercell sizes, with merely slight numerical variations [20]. This is in agreement with our own test calculations for a larger 3 × 3 × 3 supercell containing 270 atoms, reported previously in [27], which also confirmed that the relaxed interatomic distances in the immediate vicinity of the defect are almost identical and that the resonances in the imaginary part of the dielectric function align nicely for both supercell sizes, except for a variation in intensity that reflects the different defect concentrations. The present choice is hence justified and serves to limit the computational cost associated with the solution of the BSE, but it will also be validated a posteriori in this work. Incidentally, we note that it is possible to avoid supercells altogether by using perturbation theory and describing the properties of polarons in leading order in terms of the electronic structure of the pristine stoichiometric crystal [31], which is advantageous for materials featuring large polarons, but as electron polarons in LN are known to be small [13], the nonperturbative supercell approach seems appropriate here.
All external and internal degrees of freedom are relaxed within density-functional theory (DFT) using the Quantum ESPRESSO [32] package. We use norm-conserving pseudopotentials and the PBEsol functional [33] to describe electronic exchange-correlation effects. Compared to other common parametrizations, the PBEsol functional yields more reliable lattice parameters for LN [25] and closely related materials [34,35,36]. The oxygen 2 s and 2 p orbitals as well as the lithium 2 s orbitals are treated explicitly as valence states. The pseudopotential of niobium is optimized for the Nb 5 + cation configuration, which emerges on regular lattice sites in LN, in order to increase the numerical stability and to allow for smaller cutoff radii; in this case, the 4 s , 4 p , 4 d , and 5 s orbitals are treated as valence states. This leads to 256 valence bands for the free-polaron system in stoichiometric LN and 260 valence bands for all models of bound polarons and bipolarons, where one Li + cation is substituted by a Nb 5 + ion. We select a kinetic-energy cutoff of 85 Ry for the plane-wave basis set and a shifted Monkhorst-Pack mesh with 2 × 2 × 2 k points for the Brillouin-zone integration during the self-consistency cycle, equivalent to 4 × 4 × 4 k points in the larger Brillouin zone corresponding to the primitive unit cell. The convergence thresholds for energies and forces during the relaxation are set to 10 4 Ry and 10 8 Ry/Bohr, respectively. For an accurate description of the Nb 4 d orbitals, we employ the DFT + U scheme [37]. The values for the Hubbard U parameter are determined self-consistently as 5.2 eV for the Nb Li antisite and Nb V interstitial atoms and 4.7 eV for regular Nb Nb atoms, including the one hosting the free polaron [12]. For free and bound polarons, which feature a single unpaired electron, we perform spin-polarized calculations; for bipolarons, this is not necessary, because they comprise two electrons with opposite spin orientations.
From the one-particle energies ϵ n k and the associated wavefunctions | n k , we obtain the projected density of states
DOS ( ω ) = n k n k | P | n k g ( ω ϵ n k ) ,
which provides important information about the electronic structure of the material. The summation over n includes 800 bands, sufficient to cover an energy interval up to 10 eV above the valence-band maximum, and the wavevector k runs over all points of a shifted 4 × 4 × 4 mesh. A Gaussian function g with a broadening of 0.05 eV is applied to compensate for the discrete k -point mesh. The operator P projects the one-particle wavefunctions onto orthogonalized atomic orbitals corresponding to the selected pseudopotentials; the total density of states (DOS) is obtained by setting P = 1 .
The frequency-dependent dielectric function, from which the absorption spectrum and other optical coefficients may be derived, is constructed at different levels of theory in this work. Within the independent-particle approximation (IPA), the tensor elements in the long-wavelength limit are
ε α α ( ω ) = 1 + 16 π Ω v , c k 1 ϵ c k ϵ v k | v k | p α + i [ V nl , r α ] | c k | 2 ( ϵ c k ϵ v k ) 2 ( ω + i γ ) 2 ,
where α denotes the spatial direction. We follow the usual convention where the threefold symmetry axis is identified with the z direction, while the x direction is perpendicular to the z direction and lies in the plane spanned by the threefold symmetry axis and one of the three equivalent basis vectors of the primitive rhombohedral unit cell. For the numerical evaluation of the dielectric function, we employ the Yambo package [38]. The first sum in Equation (2) runs over all combinations of valence (v) and conduction (c) bands, the second over the set of wavevectors inside the Brillouin zone. The transition dipole moments include the commutator [ V nl , r α ] with the nonlocal part of the pseudopotentials, Ω is the volume of the supercell, and the broadening γ again compensates for the finite k -point mesh.
For a better quantitative description, we replace the Kohn–Sham eigenvalues ϵ n k in a first step by the proper quasiparticle energies ϵ n k qp calculated within the G W approximation, which not only opens the band gap by about 2 eV, in agreement with experimental measurements, but also modifies the dispersion [26]. Within this independent-quasiparticle approximation (IQA), the transition energies between valence and conduction bands are larger than in the IPA, reflecting the widened band gap, but there is no interaction between the created electrons and holes. For the numerical evaluation of the exchange-correlation self-energy, we employ a plasmon-pole approximation for the dynamical screening function as implemented in the Yambo package.
In a second step, we then incorporate the electron-hole interaction by solving the BSE, again with the Yambo package. In this scheme, the macroscopic dielectric function is constructed as
ε α α ( ω ) = 1 lim q 0 8 π Ω | q | 2 v , c , k v , c , k v k q | e i q · r | c k c k | e i q · r | v k q λ A v c k λ A v c k λ * ω E λ + i γ ,
where q approaches zero in the direction α . The energies E λ of the interacting electron-hole pairs and the expansion coefficients A v c k λ of the resulting exciton states in the basis of one-particle wavefunctions are given by the eigenvalues and eigenvectors of the two-particle Hamiltonian
H v c k , v c k = ϵ c k qp ϵ v k qp δ v v δ c c δ k k + 2 V ¯ v c k , v c k W v c k , v c k .
The first, diagonal term, which equals the transition energies between quasiparticle states in the valence and conduction bands, corresponds to the IQA. The second, nondiagonal term, the kernel of the BSE, is composed of the electron-hole exchange part V ¯ and the electron-hole attraction W. The latter describes the formation of excitons, i.e., bound electron-hole pairs, which strongly influence the shape of the dielectric function.
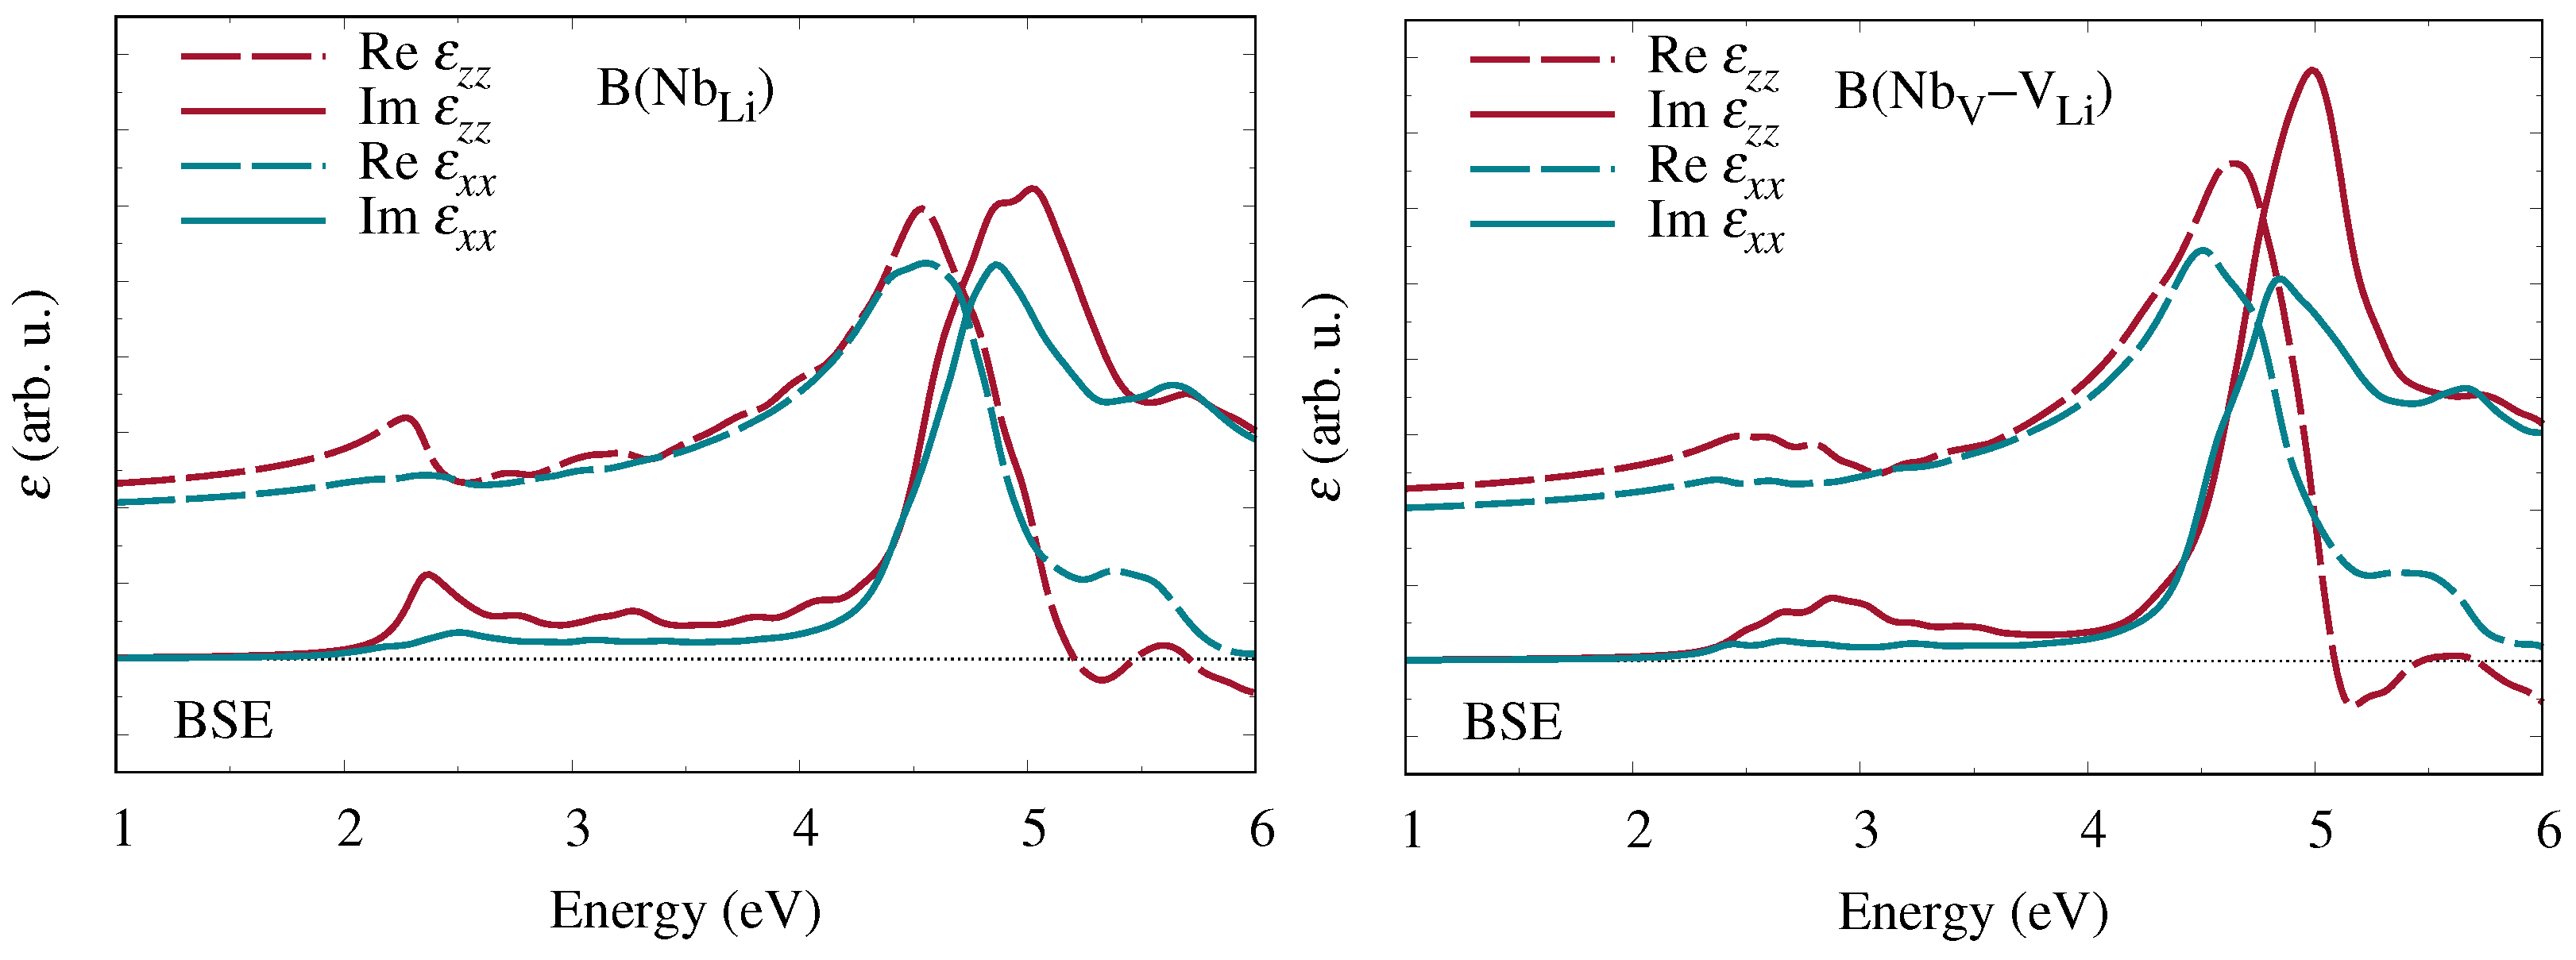
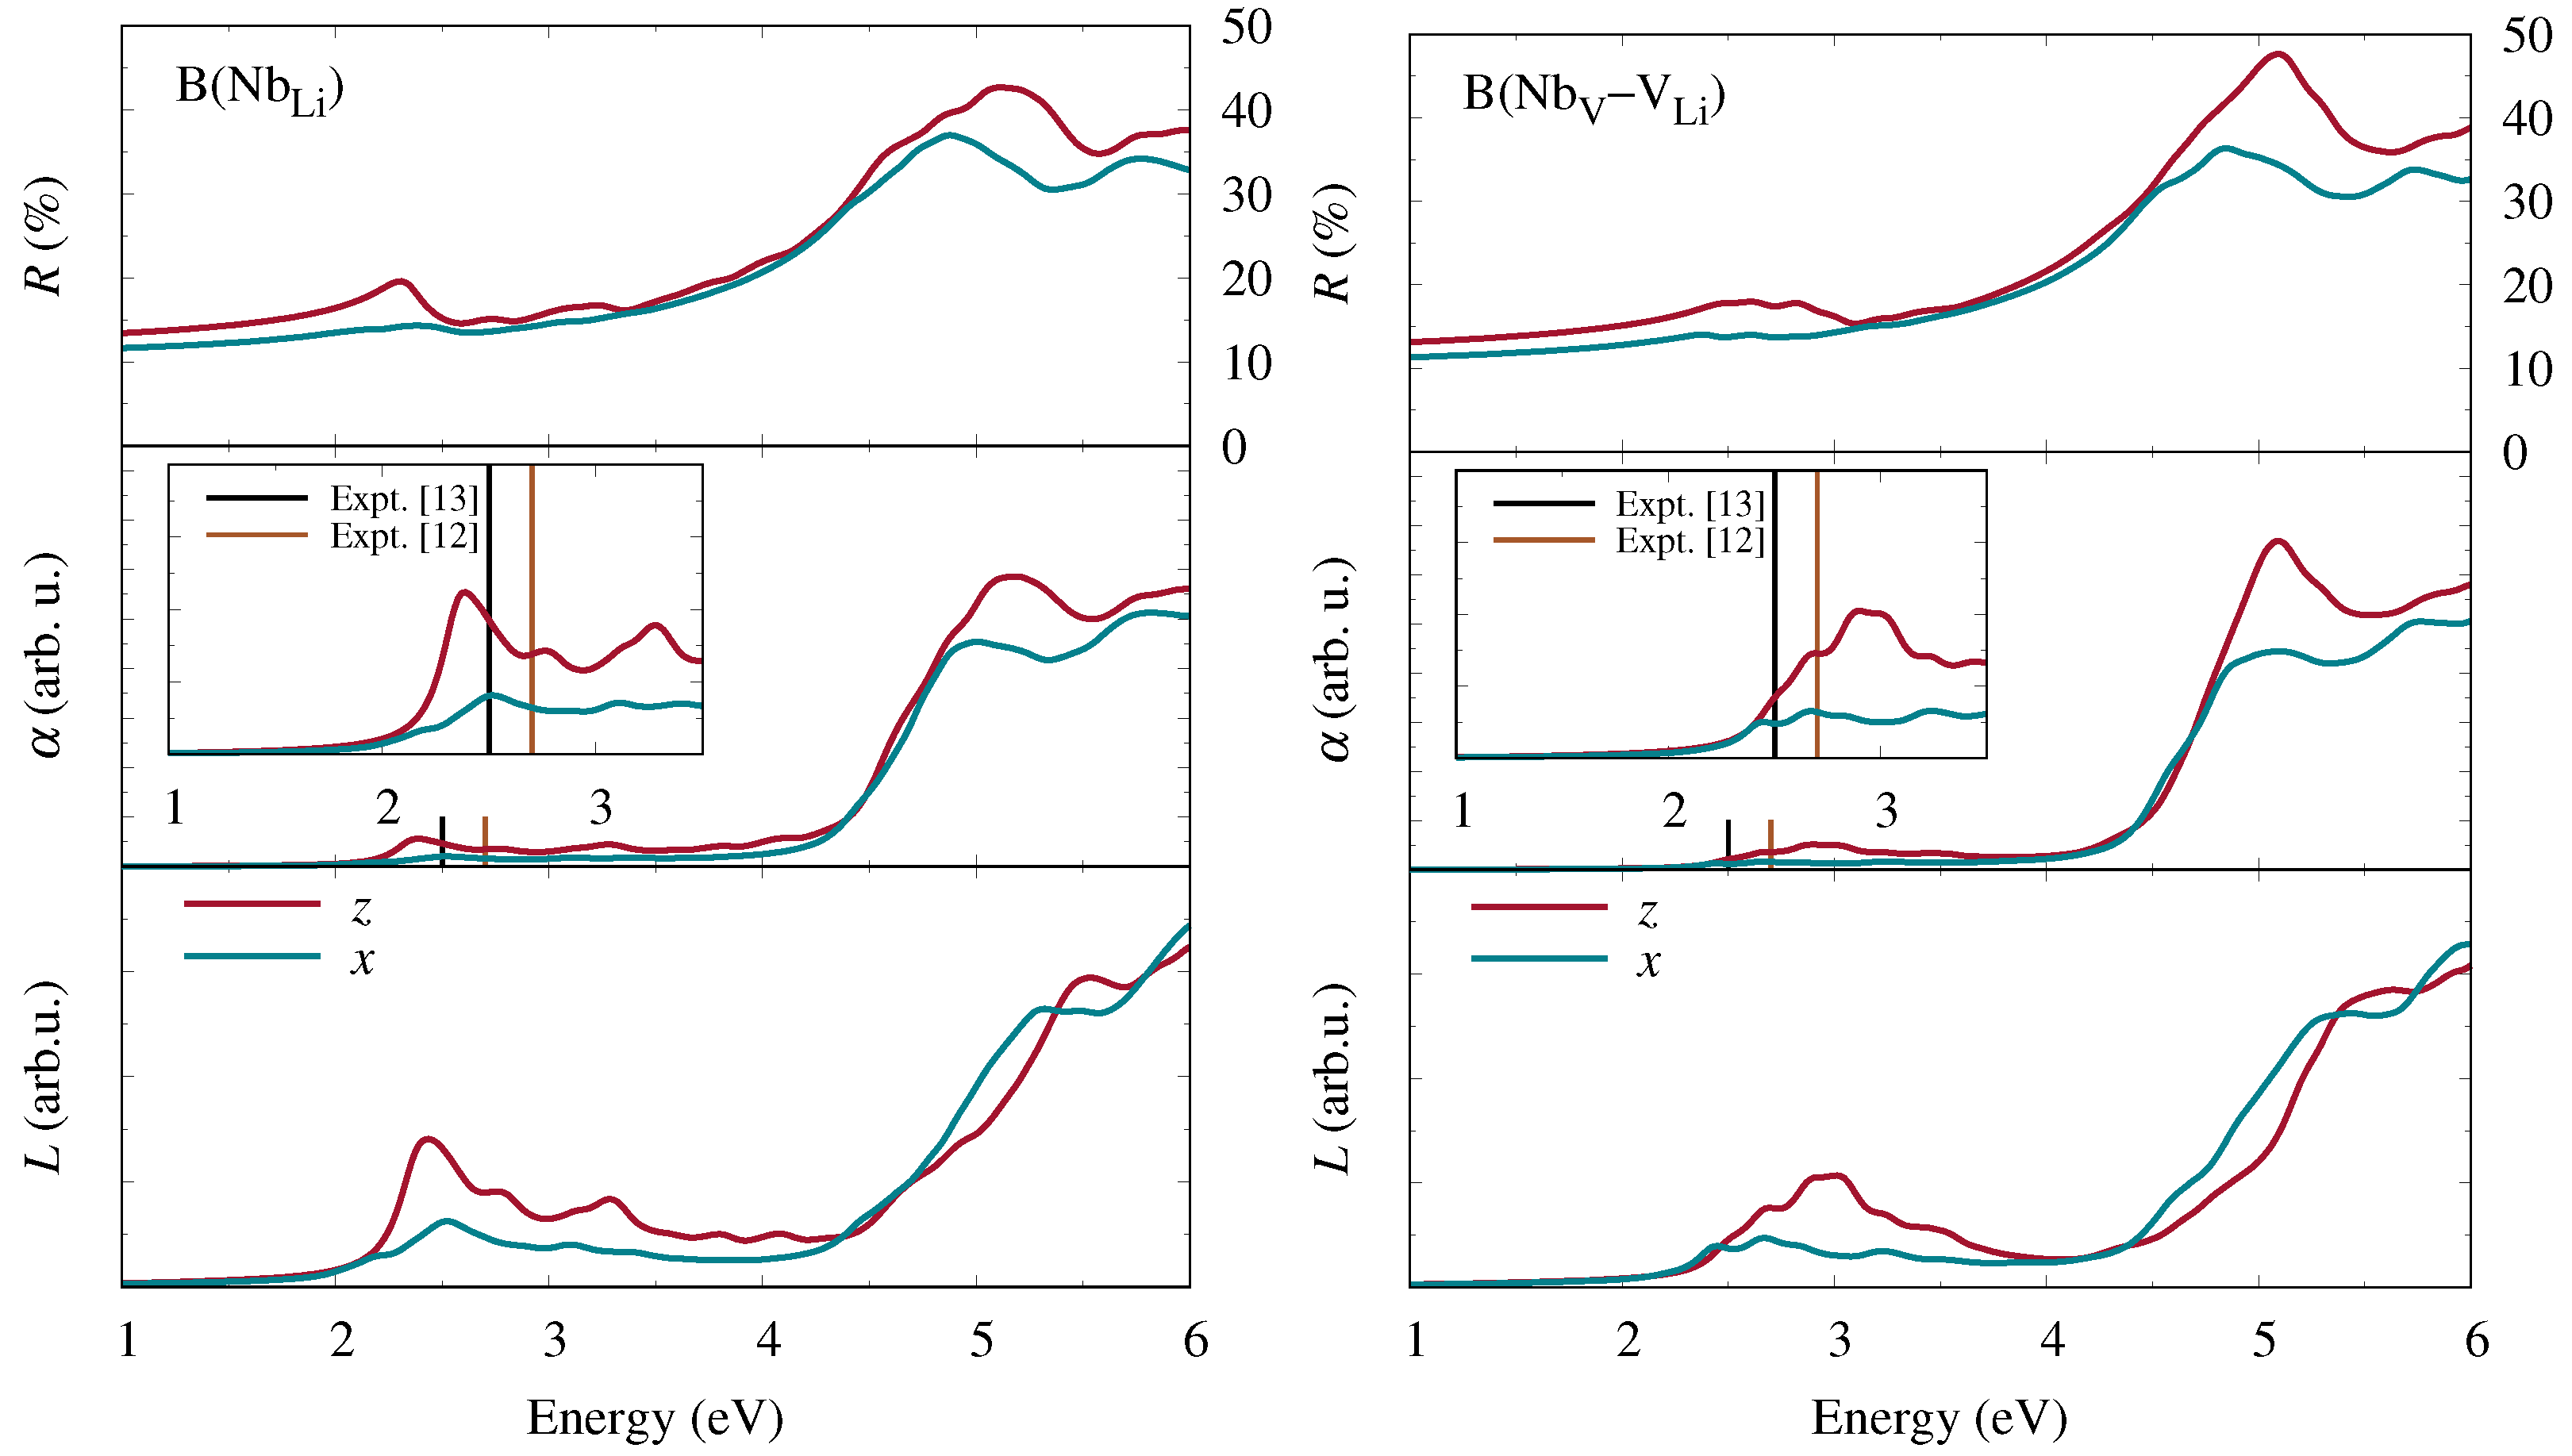
From the real and imaginary parts of the complex dielectric function, obtained by solving the BSE, various optical coefficients with a direct relation to experimental measurements may subsequently be derived. In particular, the refractive index n ( ω ) and the extinction coefficient κ ( ω ) are given by
n ( ω ) = | ε ( ω ) | + Re ε ( ω ) 2 and κ ( ω ) = | ε ( ω ) | Re ε ( ω ) 2 .
From these, we may obtain the reflectivity R ( ω ) and the absorption coefficient α ( ω ) according to
R ( ω ) = n ( ω ) 1 2 + κ ( ω ) 2 n ( ω ) + 1 2 + κ ( ω ) 2 and α ( ω ) = 2 ω κ ( ω ) c ,
where c denotes the speed of light. Finally, the electron-energy-loss function equals
L ( ω ) = Im 1 ε ( ω ) .

3. Results and Discussion

3.1. Structure Optimization

The crystal structure of LN is characterized by a threefold axis of rotational symmetry, which is still preserved even when the spatial inversion symmetry is broken in the ferroelectric phase. As polarons form at regular Nb Nb atoms or point defects located on this axis, it is natural to assume that the local lattice deformation associated with the polaron formation also preserves the threefold rotational symmetry. Indeed, earlier theoretical studies of polarons in LN incorporated this explicitly as a constraint on the atomic movements in order to simplify the structural optimization [22], and the assumed rotational symmetry was also used to analyze experimental measurements, such as data from electron paramagnetic resonance (EPR) [39]. Recently, it became clear that lower-energy configurations can be reached if the rotational symmetry is broken, however. As an example, the total energy of the optimized tilted geometry obtained from DFT for a bound polaron at the Nb Li antisite defect is 43 meV lower than for axial symmetry; the corresponding value for a bound polaron at the Nb V –V Li defect pair is 38 meV [12]. Further corroboration comes from the fact that EPR parameters calculated within DFT for the tilted configurations are in closer quantitative agreement with high-resolution experimental measurements reported in [40] than those predicted for axial symmetry [12]. From this perspective, the axially symmetric structures can be regarded as the average of three equivalent tilted configurations along the trigonal axes. At high temperatures, the system may then be described in terms of an effective axial symmetry resulting from rapid transitions between these equivalent degenerate configurations. For bipolarons at both defect types, in contrast, the system always relaxes to an axial symmetry, even without explicit constraints.
To explore the spatial extent of the polaronic lattice deformation in relation to the supercell size, we first analyze the displacements of the niobium and the oxygen atoms relative to their positions in stoichiometric LN as a function of the distance to the Nb Li or Nb V defect atom in Figure 2. Only results for the two bipolaron models are displayed, because these exhibit the largest distortion owing to the two localized electronic charges. Overall, the size of the atomic displacements decreases with growing distance and falls below a threshold of 0.05 Å within the displayed range. Earlier test calculations with a larger 3 × 3 × 3 supercell containing 270 atoms [27] yielded very similar shifts for these atoms. We note that some atoms near the boundary of the supercell are affected by finite-size effects and hence excluded from the graph. Furthermore, lithium atoms, which are not directly involved in the formation of the defects and do not contribute to the density of states near the band edges, as shown in the following section, are also omitted in order to avoid cluttering.
For bipolarons at the Nb Li antisite, shown in Figure 2a, the entire shell of niobium atoms around the defect (green labels “4”, “5”, and “8”) must be relaxed in order to treat all displacements above 0.05 Å accurately. The oxygen sublattice appears more rigid, in contrast, as only the cage enclosing the Nb Li antisite atom (red labels “1” and “2”) plus a few horizontal neighbors (red labels “6” and “7”) exhibit significant shifts. An even larger number of atoms must be considered for bipolarons at the Nb V –V Li defect pair in Figure 2b, including the Nb Nb atom above the V Li vacancy (green label “9”). The oxygen sublattice in particular shows shifts above 0.05 Å over a larger distance in this case, comprising several cages as well as a large number of oxygen atoms outside the central pillar.
These results demonstrate that the lattice deformation is not confined to the oxygen cages directly enclosing the defect niobium atoms but instead extends over several unit cells. Nevertheless, the atomic displacements in the immediate vicinity of the point defects, where the excess electrons are localized, are already accurately obtained with the 2 × 2 × 2 supercell, which was also used in previous studies [21,22]. Although it provides a tight fit, especially for the defect pair, it thus allows an accurate description of the electronic and optical properties if the polarons are sufficiently small. Furthermore, it enables us to apply sophisticated, numerically demanding many-body techniques, such as the BSE, that would be prohibitive for a larger supercell.
The relaxed crystal structures in the vicinity of the polaron sites for all defect models considered in this work are illustrated in Figure 3. In each case, the atomic positions after relaxation, indicated in color, are contrasted with those in the defect-free stoichiometric material, marked by black balls. The illustrations are to scale and indicate the direction and the magnitude of the atomic displacements. For the free polaron and the bound polaron at a Nb Li antisite defect and a Nb V –V Li defect pair, we show both the axially symmetric configuration, obtained by applying an appropriate constraint, and the corresponding lower-energy tilted configuration. For the bipolaron at both defect types, we only consider axially symmetric configurations, which materialize even without explicit constraints. While the oxygen atoms move by a similar amount in all models, there are noticeable differences regarding the niobium atoms: The free polaron and the bound polaron at a Nb Li antisite defect feature only small displacements, whereas the bound polaron at a Nb V –V Li defect pair as well as both bipolaron models exhibit much larger shifts.
For free polarons, the excess electron is trapped at the regular Nb Nb atom in the top part of the crystal segment illustrated in Figure 3a for the axially symmetric and in Figure 3b for the tilted configuration. Originally positioned near the upper face of its oxygen cage to enlarge the distance to the neighboring Li cation, the Nb Nb ion increases in size due to the electron capture and consequently moves closer to the center of the oxygen octahedron, in turn pushing the neighboring Li atom (bottom) further in the same direction. While both cations shift parallel to the vertical direction in the case of axial symmetry, a small sideways movement of the Nb Nb atom hosting the free polaron as well as the neighboring Li atom are clearly visible if the symmetry constraint is removed, leading to the tilted configuration. The oxygen cage on the other side of the Nb Nb atom is empty and exhibits only little distortion.
If a lithium atom is substituted by niobium, the capture of an excess electron results in a bound polaron at the Nb Li antisite defect, illustrated in Figure 3c for the axially symmetric and in Figure 3d for the tilted configuration. Similar to free polarons, the defect atom carrying the extra electronic charge (bottom) moves towards the center of its oxygen cage, while the neighboring cation, a regular Nb Nb atom (top), is repelled and moves in the same direction. In both configurations, the magnitude of the displacements is moderate, but the tilting is much more pronounced than for free polarons. However, it is essentially limited to the defect Nb Li atom and does not noticeably affect the neighboring cation, in contrast to free polarons. This is most likely due to the larger mass of niobium compared to lithium.
With a second trapped electron at the Nb Li antisite defect, the bound polaron turns into a bipolaron, Figure 3g. The displacement of the Nb Li antisite atom (bottom) is much larger in this case, and the neighboring regular Nb Nb atom (top) moves towards the defect instead of evading it. This indicates a bond similar to a hydrogen molecule, where the two niobium atoms attract each other due to a shared electron pair.
The second defect type examined in this work is the Nb V –V Li defect pair. Analogous to the Nb Li antisite defect, the capture of an excess electron leads to the formation of a bound polaron, which can be modeled either in an axially symmetric configuration, Figure 3e, or, without geometric constraints, in a fully optimized tilted configuration, Figure 3f. As the interstitial Nb V atom hosting the bound polaron (top) occupies a previously empty oxygen octahedron, the neighboring regular Nb Nb atom (bottom), originally located near the upper face of its oxygen cage, undergoes a large shift in the direction away from the defect towards the center of the cage. The tilting is weaker than for the Nb Li antisite defect, in accordance with the smaller energy difference between the axially symmetric and the tilted configuration.
For a bipolaron at the Nb V –V Li defect pair, displayed in Figure 3h, the interstitial Nb V atom (top) moves further towards the center of its oxygen octahedron than in the case of the single bound polaron, and although the neighboring regular Nb Nb atom (bottom) is still pushed in the same direction, the displacement is manifestly smaller. As a consequence, the distance between the two niobium atoms is smaller for bipolarons than for single polarons, which can again be attributed to the bonding effect arising from the shared electron pair.

3.2. Electronic Properties

Figure 4 shows a larger segment of the central pillars of the optimized lattice structures together with the charge densities of the polaron states for all configurations considered in this work. For single trapped electrons, our results confirm that most of the charge accumulation is indeed localized at one niobium atom, a regular Nb Nb atom in the case of free polarons and a Nb Li or Nb V defect atom in the case of bound polarons. For the systems with axial symmetry displayed in Figure 4a,c,e, the polaron orbital has a dumbbell shape oriented along the central axis, which reflects the rotational symmetry of the underlying lattice structure, but if the systems are relaxed to the lower-energy tilted configurations, then we find a less elongated clover-leaf shape as shown in Figure 4b,d,f instead. Not all the charge of the polaron is localized at the niobium atom, however: The oxygen atoms that form the octahedral cage around the niobium atom hosting the polaron also attract a significant portion of the charge. For the bound polaron at the Nb V –V Li defect pair with axial symmetry, there is additionally a significant hybridization with the orbitals of the neighboring regular Nb Nb atom, as seen in Figure 4e. This is facilitated by the fact that the axial symmetry enforces a parallel orientation of the orbitals of the two atoms. The symmetry-breaking tilt diminishes this effect and thereby effectuates a stronger localization at the Nb V atom, as illustrated in Figure 4f. Although the hybridization also serves to lower the total energy [22], the structural deformation has a larger influence, so that the tilted configuration is in fact more stable for single-electron bound polarons.
The charge density of the bipolaron at a Nb Li antisite defect in Figure 4g appears almost identical to the overlap of the charge densities of a free and a bound polaron, shown separately in Figure 4a,c. This interpretation is in accordance with earlier studies that also characterized the bipolaron as a building-block-like combination of the two single-polaron types [13]. Furthermore, it explains why the structure relaxes to axial symmetry in the case of bipolarons: Although the tilting slightly lowers the energy of single free and bound polarons, the resulting reorientation and shape deformation of the orbitals noted above prevents an effective hybridization. As the energy gain due to the hybridization outweighs the energy difference resulting from the atomic displacements, the system reverts back to an axially symmetric configuration.
Lastly, the Nb V –V Li defect pair may be regarded as a modification of the Nb Li antisite defect where the antisite Nb Li atom migrates into the neighboring empty oxygen octahedron [12]. Concomitantly, as evidenced in Figure 4, the uppermost displayed Li atom also shifts into the neighboring empty octahedron for all models involving the defect pair. The pair of the Nb V and Nb Nb atoms in the two adjacent oxygen cages that host the bipolaron ultimately bears a strong resemblance to the pair of neighboring Nb Li and Nb Nb atoms in the case of the antisite defect if turned upside down, which can clearly be seen by comparing Figure 4g,h. Due to the very similar local environment, it is not surprising that the charge densities of the bipolarons at the two defects are also almost identical. In particular, the hybridization, which has a twice as large effect on the bipolaron than on the one-electron bound polaron, again explains the relaxation to an axially symmetric configuration.
In Figure 5, we show the projected density of states for all defect configurations as obtained from DFT without quasiparticle corrections. The zero of the energy axis corresponds to the maximum of the bulk valence bands. Only the Nb 4 d , O 2 s , and O 2 p states are displayed, because all other states have negligible contributions in the energy region around the band gap. In agreement with earlier studies [22], we find that the top of the valence bands is dominated by O 2 p states with minor contributions of Nb 4 d , while the lowest conduction bands between 3 eV and 5.5 eV are predominantly composed of Nb 4 d states with an admixture of O 2 p . The next set of conduction bands above 6.5 eV also exhibits a contribution of O 2 s states. These features are identical for all configurations, because the valence and conduction bands are bulk properties and independent of the type or symmetry of embedded defects.
The polaron peak is located inside the bulk band gap between 1 eV and 3 eV. As expected, it is dominated by Nb Nb 4 d states for free polarons, by Nb Li 4 d states for bound polarons or bipolarons at the antisite defect, and by Nb V 4 d states for bound polarons or bipolarons at the Nb V –V Li defect pair. However, in all cases, there is a also substantial admixture of O 2 p states from the oxygen atoms surrounding the defect, which accounts for about one third of the density of states. The proportion of Nb Nb 4 d states from neighboring regular niobium atoms is negligible for all types of bound polarons, while for bipolarons, which extend over two cation sites, the contribution of Nb Nb 4 d states equals that of the Nb 4 d states associated with the antisite or interstitial niobium atom. All of these findings are consistent with the charge densities displayed in Figure 4. Our results thus put the common notion of electron polarons in LN as small polarons [13] into perspective: Although the polarons are clearly centered at one or, in the case of bipolarons, two niobium atoms, a significant portion amounting to about one third of the trapped charge is in fact distributed over the surrounding oxygen atoms. On the other hand, the fact that the charge density of the polaron is essentially confined to one oxygen octahedron, or two in the case of bipolarons, justifies a posteriori our use of a 2 × 2 × 2 supercell, which is large enough to reliably isolate each polaron from its periodic images.
As free and bound polarons involve a single trapped excess electron, the system is spin polarized, and the defect level splits. Therefore, the peak inside the band gap stems entirely from the majority spin channel, while another unoccupied defect level with the same composition appears at a higher energy in the minority spin channel, visible at around 6 eV in the density of states. In contrast, bipolarons feature a pair of electrons with opposite spin. As a consequence, the spectral weight of the defect level inside the band gap is doubled, and there is no unoccupied level at higher energy.
A comparison between the axially symmetric and tilted configurations for free and bound polarons reveals that the deformation of the lattice structure has no visible effect on the composition of the polaron peak in the density of states, indicating that no rehybridization takes place. However, the symmetry-breaking distortion lowers the energy of the polaron state by about 0.2 eV, as can clearly be seen in the insets in Figure 5. This energy gain is the driving mechanism for the transition from an axially symmetric to a tilted ground-state configuration for polarons with unpaired electrons in LN.
To relate the observed absorption bands to specific polaron types in congruent LN, we further compare the density of states with the imaginary part of the dielectric function (2) in Figure 5. For the numerical evaluation, we use the same shifted 4 × 4 × 4 k -point mesh as for the density of states. The summation includes all valence bands, the defect level inside the band gap, and 267 conduction bands. The broadening is set to 0.001 eV at a photon energy of 0 eV and increases linearly to 0.15 eV at an energy of 5 eV.
Within the IPA, the resonances in the optical spectrum correspond directly to transitions between occupied and unoccupied one-particle states. For congruent LN, the lowest-energy transitions are expected to occur between occupied defect levels inside the band gap and the conduction-band edge. As each of our simulations features only one polaron type and hence a single defect level that acts as an initial state, the low-energy region of Im ε z z ( ω ) is akin to the density of final states in the conduction band, modified by the transition dipole moments. In order to align the curves, we shift the IPA spectrum on the energy axis in Figure 5 so that the defect level, whose dispersion is negligible for the 2 × 2 × 2 supercell used here [27], is taken as the origin. Besides, the spectra are cut at 3 eV, so that transitions at higher photon energies from bulk valence to conduction bands across the band gap are left out. Indeed, for all polaron types, the onset of the absorption, where the imaginary part of the dielectric function assumes nonzero values, coincides precisely with the energy separation between the defect level and the conduction bands in the density of states.

3.3. Optical Properties

The congruency between the density of states and the absorption spectrum in the IPA in Figure 5 affirms that the low-energy absorption peaks arise from transitions between the occupied polaron state inside the band gap and the continuum of Nb 4 d states at the bottom of the conduction bands, but the IPA ignores quasiparticle corrections to the band structure as well as electron-hole attraction effects, which are both essential for a quantitative comparison with experimental data. In order to successively incorporate these effects, we determine the dielectric function at the three levels of theory described in Section 2, namely the IPA, the IQA, and the BSE. We concentrate on bipolarons in this part, which constitute the ground state of excess electrons in congruent LN and dominate at room temperature, where only a small number of bipolarons are thermally dissociated into free or bound polarons [16]. For the IPA and IQA, we include all 260 valence bands, the defect level, and 939 conduction bands. For the BSE, we reduce these numbers to 65 valence bands, the defect level, and 89 conduction bands to counter the high computational cost associated with the large supercell; we confirmed that these settings are sufficient to describe the optical response accurately up to photon energies around 6 eV. In all calculations, we employ the same shifted 2 × 2 × 2 k -point set as for the structure optimization to sample the Brillouin zone, and a constant broadening of 0.1 eV is applied in the entire energy range to smoothen the dielectric function.
In Figure 6, we display the imaginary (top panels) and real (bottom panels) parts of the dielectric function ε z z ( ω ) for bipolarons localized either at the Nb Li antisite defect (left) or at the Nb V –V Li defect pair (right) for the different approximations. The IPA results are the same as in Figure 5g,h but are here displayed with no shift on the energy axis and calculated with a different k -point mesh for consistency with the other schemes. Equivalent results for Im ε x x ( ω ) in relation to Nb V –V Li can be found in [12]. The resonances at low photon energies, where the dielectric function of stoichiometric LN has no structure [30], arise from the defect-related optical transitions and are characteristic of the specific polaron type. In contrast, bulk transitions dominate at energies larger than the band gap, for example above 3 eV in the case of the IPA. The most pronounced defect-related peak, indicated by the arrow, appears at a lower energy for bipolarons at the Nb Li antisite defect than at the Nb V –V Li defect pair. If quasiparticle corrections from the G W approximation are included, then the band gap increases significantly. Consequently, the dielectric function in the IQA (blue lines) is blueshifted by about 2 eV with respect to the IPA, whereas the shape of the spectrum remains essentially unchanged. In contrast, including electron-hole attraction effects within the BSE (red lines) entails a significant redistribution of spectral weight that enhances the oscillator strengths near the absorption thresholds due to the formation of excitons. In addition, there is a redshift that positions the final spectrum roughly halfway between the IPA and IQA curves. Because of the small number of bands, the BSE results are not fully converged above 6 eV and hence depicted by dashed lines in this region.
In Figure 7, we compare the ε z z ( ω ) (red) and ε x x ( ω ) (blue) components of the imaginary (solid lines) and real (dashed lines) parts of the dielectric function obtained from the BSE. Our results show that there are clear differences in the calculated optical spectra for the two bipolaron types, especially with respect to the lineshape of the defect peak. In particular, the defect peak is much less pronounced for x-polarized light, which will make an experimental detection more difficult. This strong directional dependence relates to the anisotropy of the bipolaron orbitals displayed in Figure 4g,h, which are oriented along the threefold symmetry axis that corresponds to the z direction. We also note that the positions of the maxima of the defect peaks differ for ε z z ( ω ) and ε x x ( ω ) . Although the underlying resonance energies E λ of the electron-hole pairs in Equation (3) are in fact identical, direction-dependent variations in the oscillator strengths give rise to an apparent shift. Therefore, care must be taken when the calculated spectra are compared with experimental data or analyzed to deduce absorption bands.
From the complex dielectric function calculated within the BSE, we can finally derive other optical coefficients that are typically measured in experimental spectroscopies, such as the reflectivity R ( ω ) , the absorption (attenuation) coefficient α ( ω ) , and the electron-energy-loss function L ( ω ) . Our results for the z (red) and x (blue) components are shown in Figure 8. The left panels again refer to bipolarons at the antisite defect, the right panels to bipolarons at the defect pair. As for the dielectric function itself, the polaron signatures are much more pronounced in the z components but are clearly present in all optical coefficients. The calculated absorption coefficients are further compared to the experimental value of 2.5 eV that is frequently cited in the literature, for example in [13], as well as a recent measurement by our co-workers [12] that yielded 2.7 eV. Both values were obtained from the peak position in the absorption spectrum of congruent LN, measured in the z direction. Although the two experimental values deviate slightly, indicating variations due to sample preparation and/or measurement technique, both lie between the calculated defect-related absorption maxima for the Nb Li antisite defect and the Nb V –V Li defect pair. This may indicate that at least some of the antisite niobium atoms indeed migrate to neighboring oxygen octahedra, creating interstitial-vacancy pairs that modify the lineshape and apparent position of the bipolaron absorption band.

4. Conclusions

Using first-principles calculations based on density-functional theory, we performed a detailed analysis of electron polarons in LN, taking free polarons, bound polarons, and bipolarons into account. In contrast to earlier studies [21,22], we not only considered electron polarons bound to Nb Li antisite atoms but also to another defect compatible with the Li-vacancy model, namely the Nb V –V Li defect pair, which arises when an antisite niobium atom migrates to a neighboring empty oxygen octahedron. Furthermore, we did not restrict ourselves to axially symmetric structure models but performed a full unconstrained relaxation, which leads to lower-energy tilted configurations where the threefold rotational symmetry is broken. Our results show that the distortion lowers the energy of the occupied defect level inside the band gap and thereby stabilizes the tilted configurations for free and bound polarons, which feature a single unpaired electron. On the other hand, it reduces the hybridization between the orbitals of neighboring niobium atoms along the threefold symmetry axis, which is essential for the formation of bipolarons. Therefore, bipolarons at both defect types relax to an axially symmetric geometry instead. An examination of the charge densities and the projected densities of states reveals that for all configurations, about one third of the trapped electronic charge is not actually localized at the niobium atoms hosting the polaron but distributed over the oxygen atoms that form the octahedral cage enclosing the defect site, well within the limits of the supercell used in this work. The lattice distortion associated with the polaron formation extends farther, especially for bipolarons at Nb
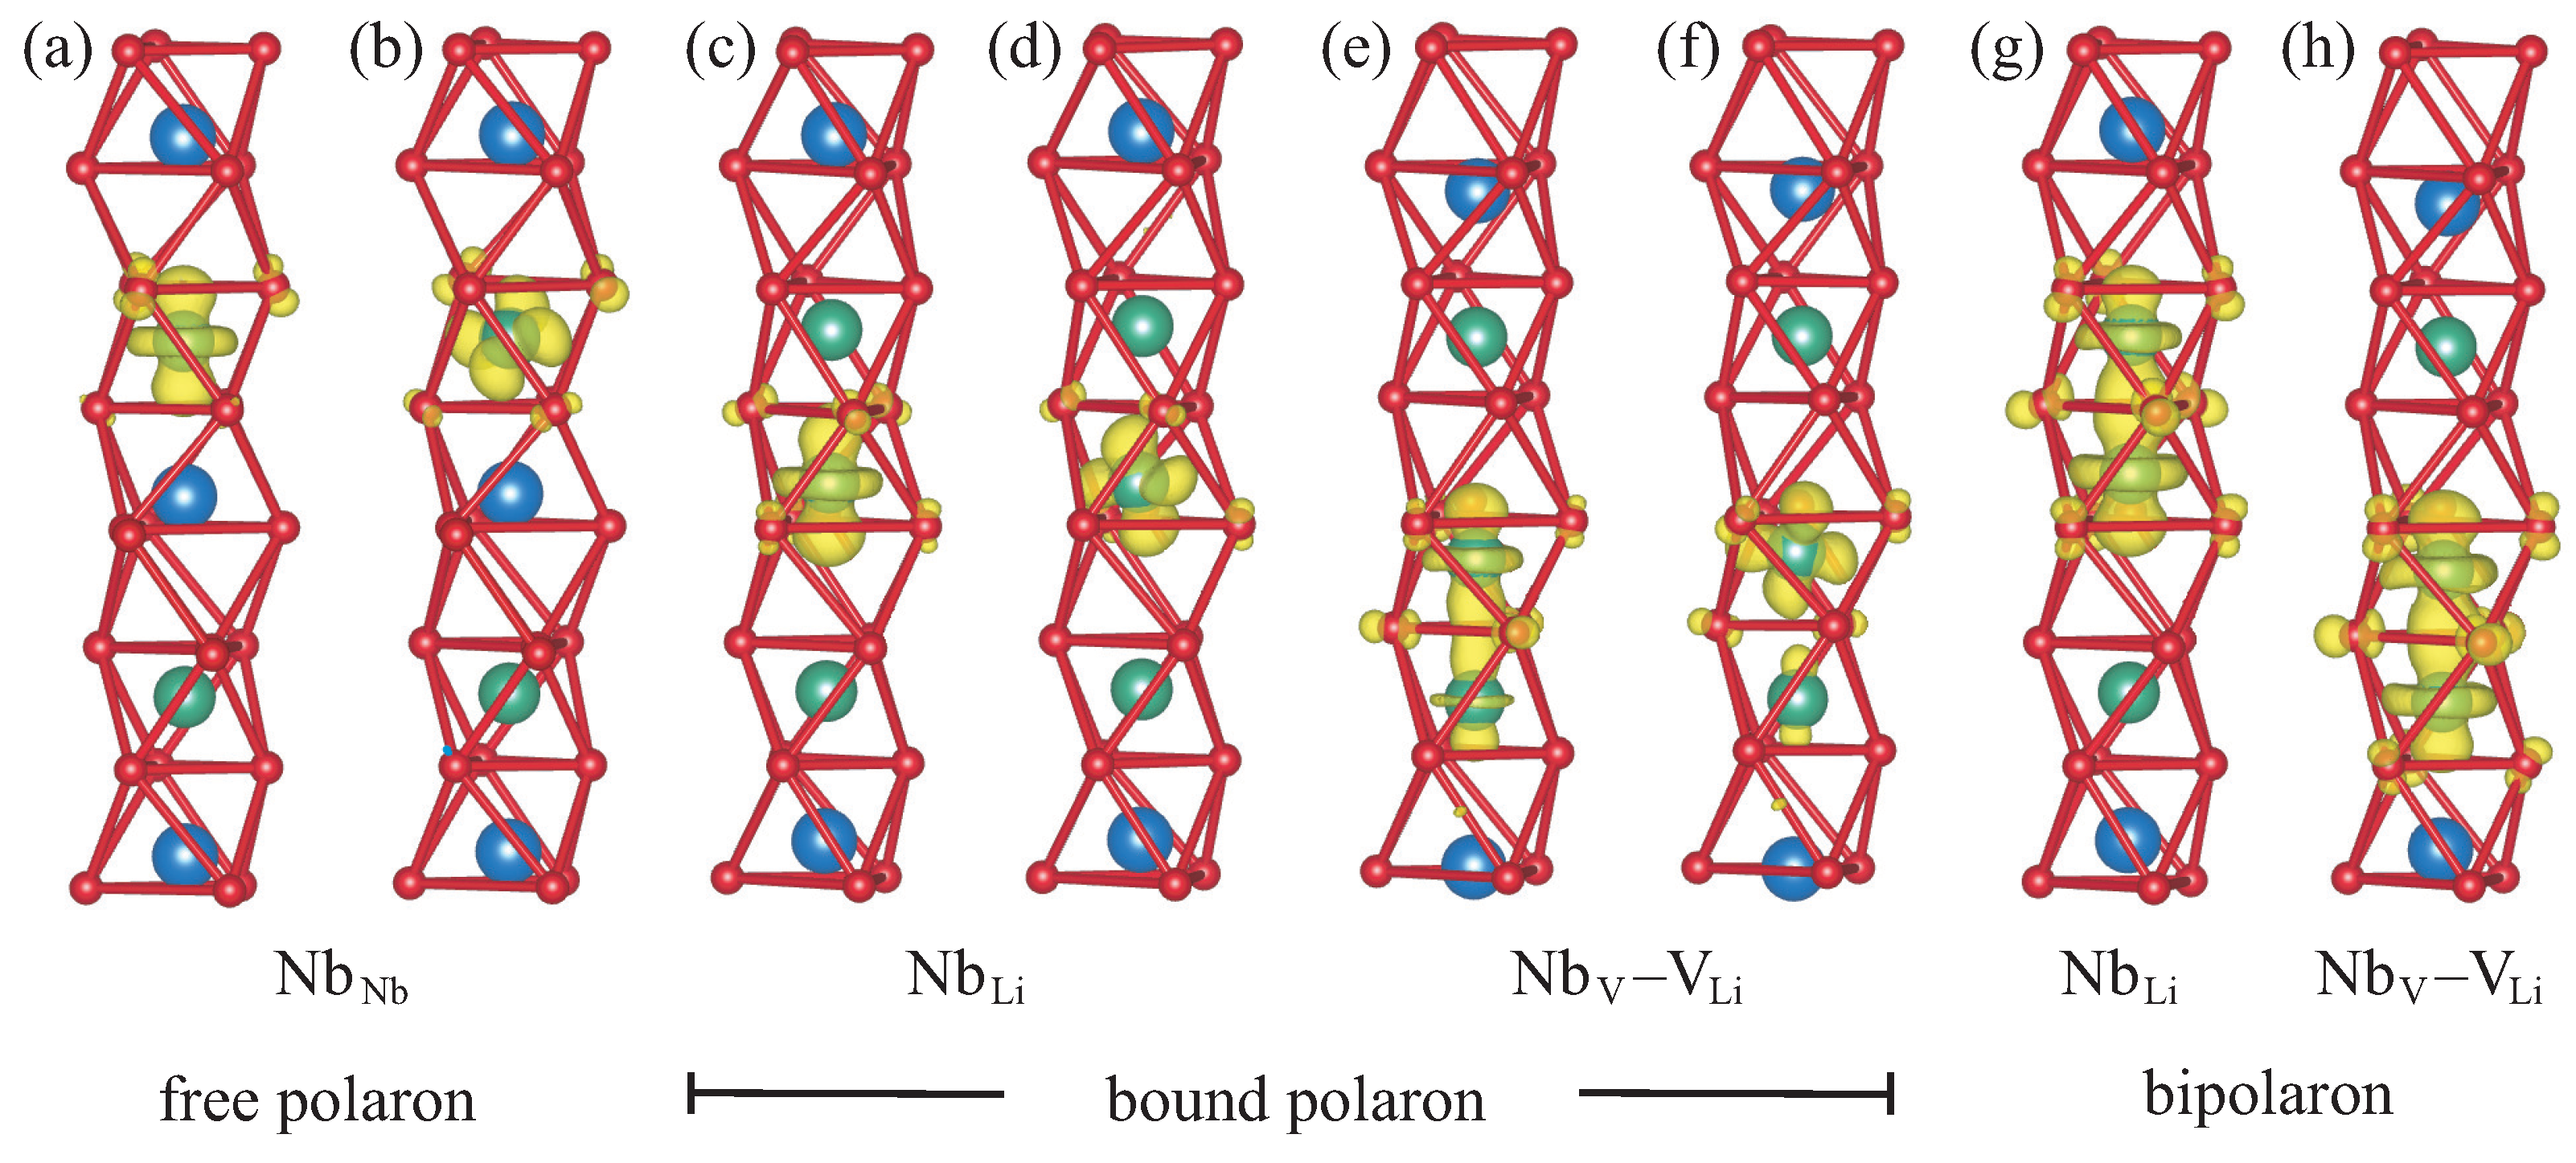
 V –V Li 
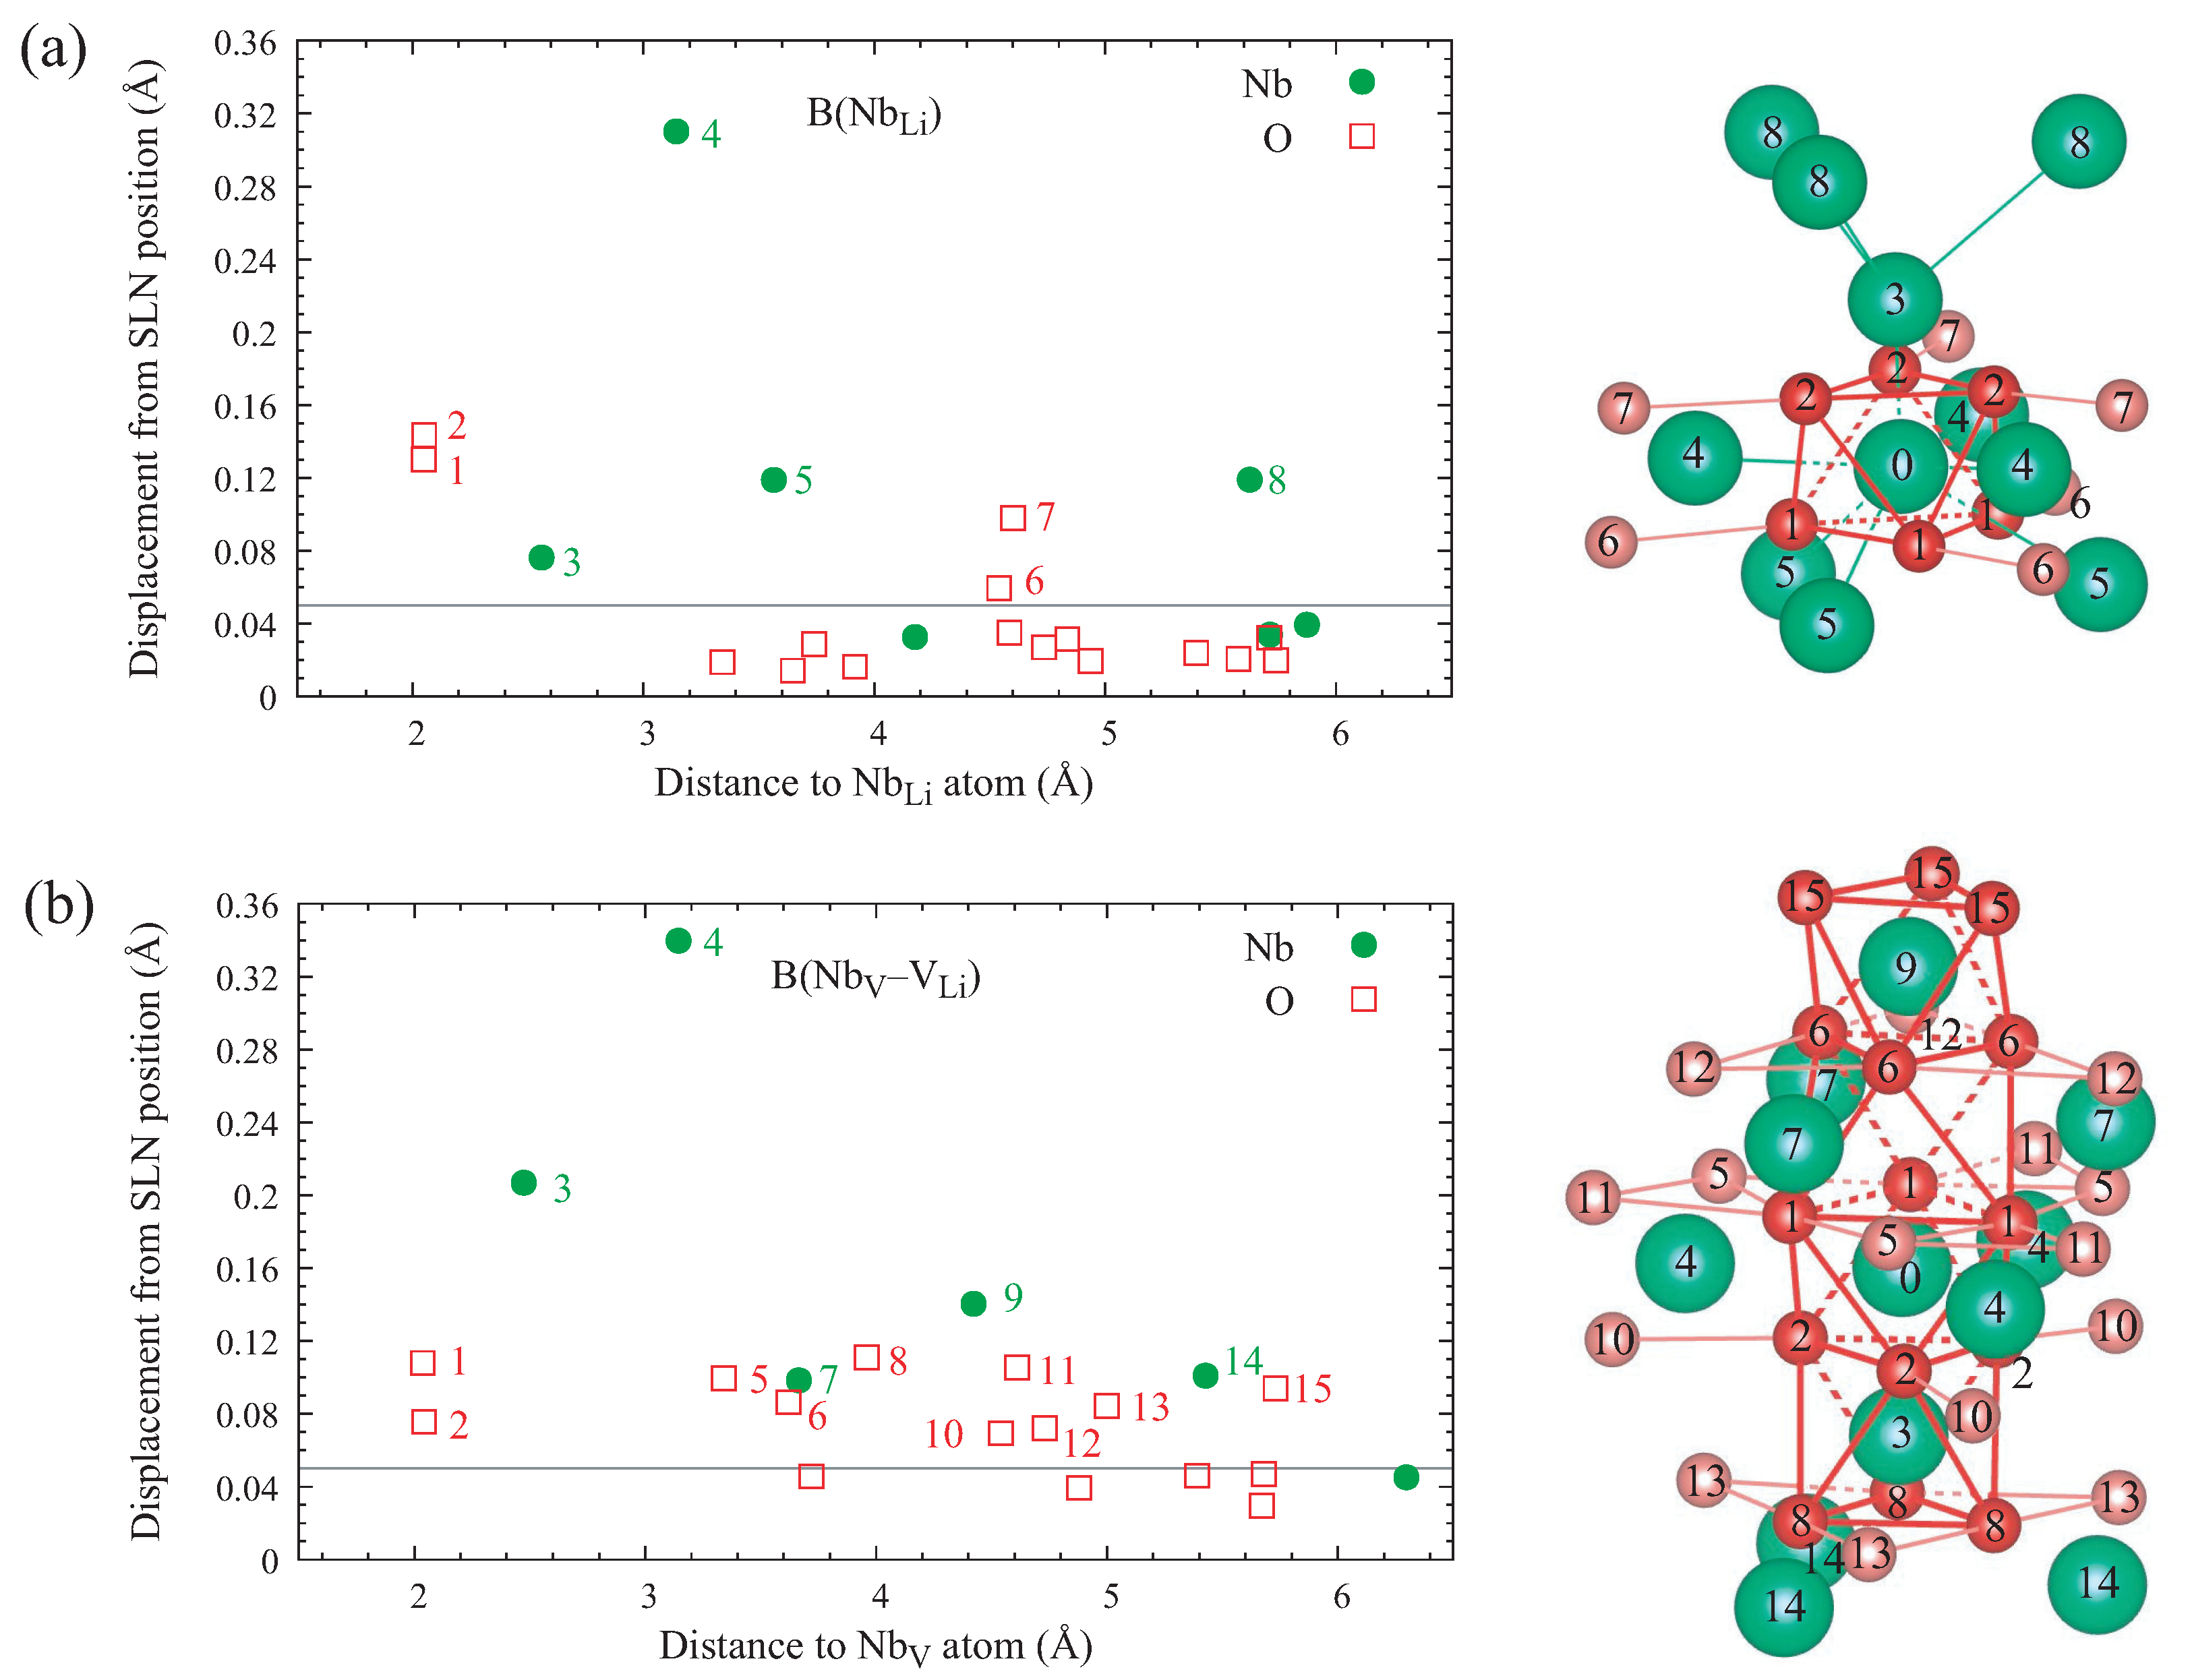
defect pairs, but it is not necessary to include its full spatial extent outside the localized charge distribution in calculations of the electronic and optical properties of polarons in LN. This justifies the use of a smaller supercell, which in turn allows us to apply sophisticated many-body techniques that would otherwise be prohibitively expensive.
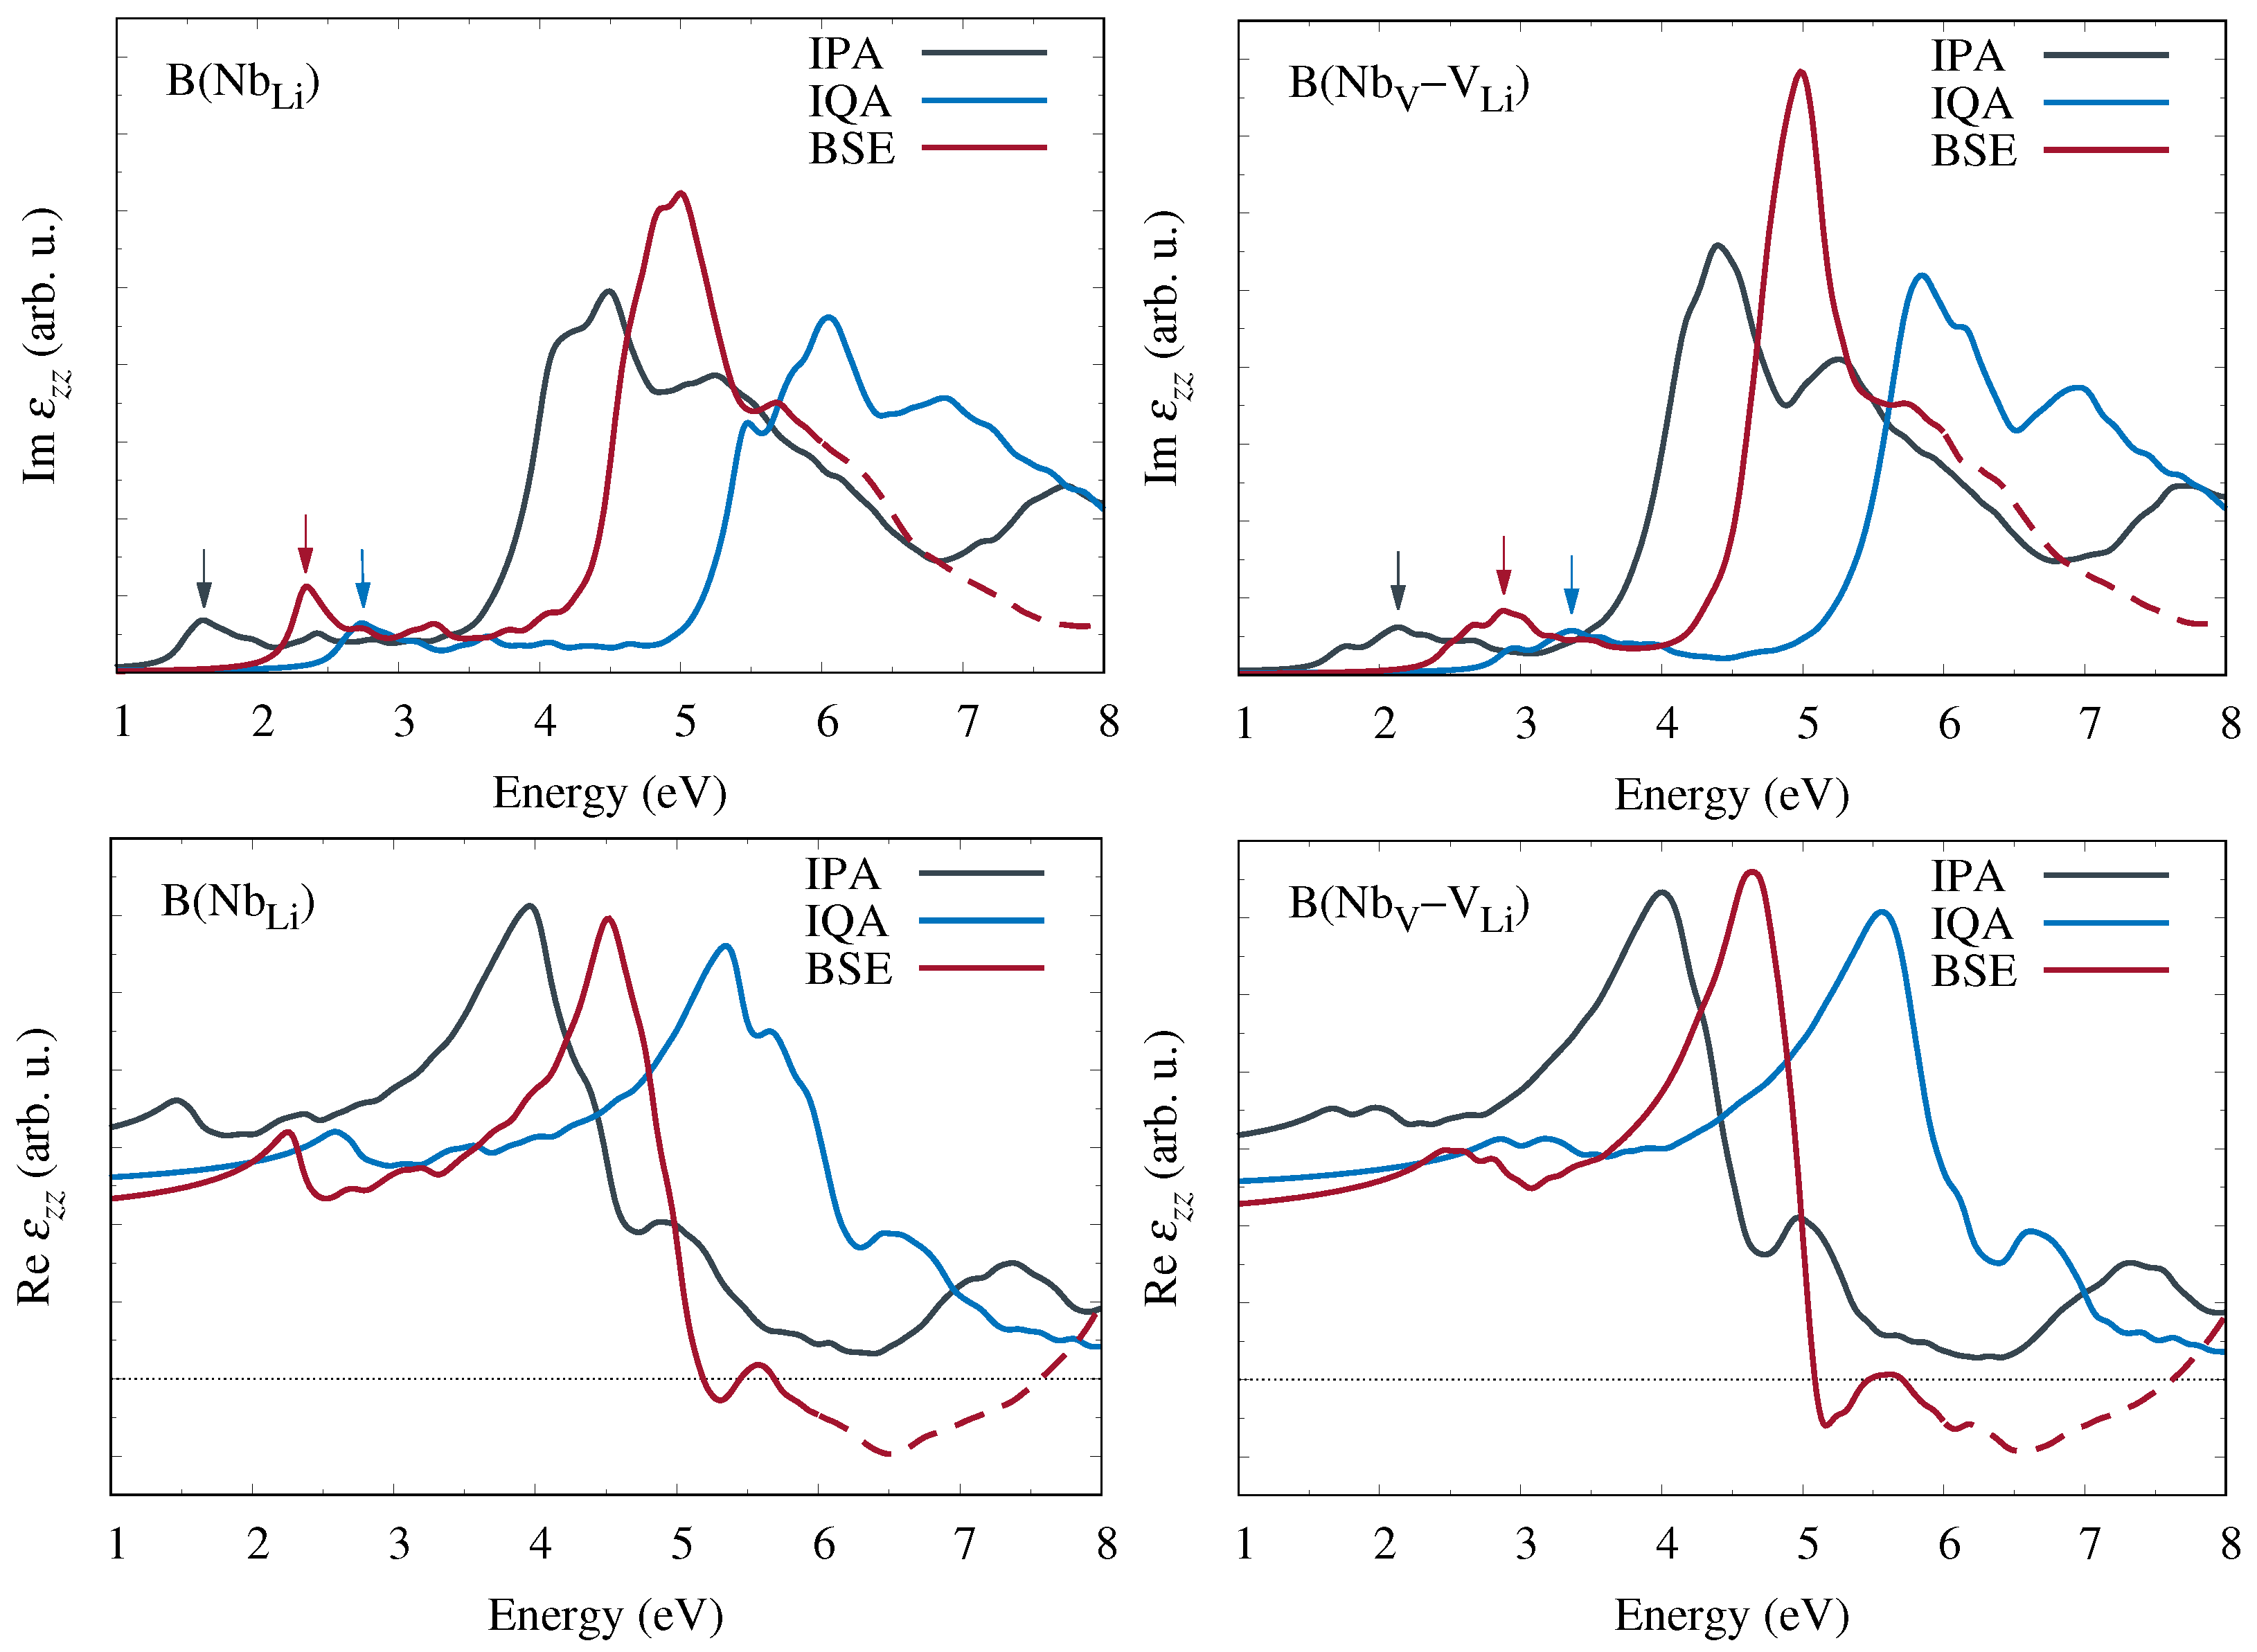
Hereupon we performed state-of-the-art first-principles calculations of the frequency-dependent complex dielectric function and related optical coefficients. Starting from the independent-particle approximation, we additionally included quasiparticle corrections within the G W approximation for the electronic self-energy as well as excitonic contributions obtained from the Bethe–Salpeter equation. Our results for bipolarons at Nb Li antisite defects and Nb V –V Li defect pairs show clear signatures at low photon energies in all optical coefficients that are characteristic of the specific defect type. A quantitative comparison of the calculated absorption spectra with experimental measurements of the absorption band attributed to bipolarons [12,13] suggests that at least some of the antisite niobium atoms indeed migrate to neighboring oxygen octahedra and form interstitial-vacancy pairs.
Finally, the structure models established in this work constitute a basis for further theoretical studies. Besides the linear optical properties already addressed here and in previous works [12,27,28,30], the nonlinear response is of particular interest, because it is central to the performance of LN as a key material in many optical technologies. Due to the enormous computational cost [41], significant challenges must still be overcome in order to facilitate accurate quantitative calculations of the polaron contribution to the nonlinear optical coefficients of congruent LN, however.

Author Contributions

Conceptualization, W.G.S. and A.S.; methodology, U.G. and W.G.S.; software, A.L.K. and U.G.; validation, U.G., A.S. and W.G.S.; formal analysis, F.S. and A.L.K.; investigation, F.S. and A.L.K.; resources, W.G.S.; data curation, U.G.; writing—original draft preparation, F.S., A.L.K. and A.S.; writing—review and editing, A.S., U.G. and W.G.S.; visualization, F.S. and A.L.K.; supervision, A.S.; project administration, A.S., U.G. and W.G.S.; funding acquisition, A.S., U.G. and W.G.S. All authors have read and agreed to the published version of the manuscript.

Funding

This research and the APC were funded by the Deutsche Forschungsgemeinschaft (DFG) via Sonderforschungsbereich TRR 142, Project No. 231447078.

Acknowledgments

Computational resources were provided by the Paderborn Center for Parallel Computing (PC 2 ) and the High Performance Computing Center Stuttgart (HLRS).

Conflicts of Interest

The authors declare no conflict of interest. The funders had no role in the design of the study; in the collection, analyses, or interpretation of data; in the writing of the manuscript, or in the decision to publish the results.

Abbreviations

The following abbreviations are used in this manuscript:
B(Nb)bipolaron at a Nb Li antisite defect
B(Nb V –V Li )bipolaron at a Nb V –V Li defect pair
BSEBethe–Salpeter equation
DFTdensity-functional theory
DOSdensity of states
EPRelectron paramagnetic resonance
FPfree polaron
IPAindependent-particle approximation
IQAindependent-quasiparticle approximation
LNlithium niobate
P(Nb Li )bound polaron at a Nb Li antisite defect
P(Nb V –V Li )bound polaron at a Nb V –V Li defect pair
PBEsolPerdew-Burke-Ernzerhof for solids
SLNstoichiometric lithium niobate

References

  1. Binh, L. Lithium niobate optical modulators: Devices and applications. J. Cryst. Growth 2006, 288, 180–187. [Google Scholar] [CrossRef]
  2. Bazzan, M.; Sada, C. Optical waveguides in lithium niobate: Recent developments and applications. Appl. Phys. Rev. 2015, 2, 040603. [Google Scholar] [CrossRef]
  3. Zaltron, A.; Bettella, G.; Pozza, G.; Zamboni, R.; Ciampolillo, M.; Argiolas, N.; Sada, C.; Kroesen, S.; Esseling, M.; Denz, C. Integrated optics on lithium niobate for sensing applications. Proc. SPIE 2015, 9506, 950608. [Google Scholar]
  4. Buse, K.; Adibi, A.; Psaltis, D. Non-volatile holographic storage in doubly doped lithium niobate crystals. Nature 1998, 393, 665–668. [Google Scholar] [CrossRef] [Green Version]
  5. Qi, Y.; Li, Y. Integrated lithium niobate photonics. Nanophotonics 2020, 9, 1287–1320. [Google Scholar] [CrossRef]
  6. Arizmendi, L. Photonic applications of lithium niobate crystals. Phys. Status Solidi A 2004, 201, 253–283. [Google Scholar] [CrossRef]
  7. Lengyel, K.; Péter, Á.; Kovács, L.; Corradi, G.; Pálfalvi, L.; Hebling, J.; Unferdorben, M.; Dravecz, G.; Hajdara, I.; Szaller, Z.; et al. Growth, defect structure, and THz application of stoichiometric lithium niobate. Appl. Phys. Rev. 2015, 2, 040601. [Google Scholar] [CrossRef] [Green Version]
  8. Volk, T.; Wöhlecke, M. Lithium Niobate; Springer: Berlin/Heidelberg, Germany, 2009. [Google Scholar]
  9. Sánchez-Dena, O.; Villalobos-Mendoza, S.D.; Farías, R.; Fierro-Ruiz, C.D. Lithium niobate single crystals and powders reviewed—Part II. Crystals 2020, 10, 990. [Google Scholar] [CrossRef]
  10. Lerner, P.; Legras, D.; Dumas, J.P. Stoechiométrie des monocristaux de métaniobate de lithium. J. Cryst. Growth 1968, 3–4, 231–235. [Google Scholar] [CrossRef]
  11. Zotov, N.; Boysen, H.; Frey, F.; Metzger, T.; Born, E. Cation substitution models of congruent LiNbO3 investigated by X-ray and neutron powder diffraction. J. Phys. Chem. Solids 1994, 55, 145–152. [Google Scholar] [CrossRef]
  12. Schmidt, F.; Kozub, A.L.; Biktagirov, T.; Eigner, C.; Silberhorn, C.; Schindlmayr, A.; Schmidt, W.G.; Gerstmann, U. Free and defect-bound (bi)polarons in LiNbO3: Atomic structure and spectroscopic signatures from ab initio calculations. Phys. Rev. Res. 2020, 2, 043002. [Google Scholar] [CrossRef]
  13. Schirmer, O.F.; Imlau, M.; Merschjann, C.; Schoke, B. Electron small polarons and bipolarons in LiNbO3. J. Phys. Condens. Matter 2009, 21, 123201. [Google Scholar] [CrossRef] [PubMed]
  14. Faust, B.; Müller, H.; Schirmer, O.F. Free small polarons in LiNbO3. Ferroelectrics 1994, 153, 297–302. [Google Scholar] [CrossRef]
  15. Sweeney, K.L.; Halliburton, L.E. Oxygen vacancies in lithium niobate. Appl. Phys. Lett. 1983, 43, 336–338. [Google Scholar] [CrossRef]
  16. Koppitz, J.; Schirmer, O.F.; Kuznetsov, A.I. Thermal dissociation of bipolarons in reduced undoped LiNbO3. EPL Europhys. Lett. 1987, 4, 1055–1059. [Google Scholar] [CrossRef]
  17. Jermann, F.; Simon, M.; Bower, R.; Kratzig, E.; Schirmer, O.F. Light-induced absorption changes in reduced lithium niobate. Ferroelectrics 1995, 165, 319–327. [Google Scholar] [CrossRef]
  18. Donnerberg, H.; Tomlinson, S.M.; Catlow, C.R.A.; Schirmer, O.F. Computer-simulation studies of intrinsic defects in LiNbO3 crystals. Phys. Rev. B 1989, 40, 11909–11916. [Google Scholar] [CrossRef]
  19. Araujo, R.M.; Lengyel, K.; Jackson, R.A.; Kovács, L.; Valerio, M.E.G. A computational study of intrinsic and extrinsic defects in LiNbO3. J. Phys. Condens. Matter 2007, 19, 046211. [Google Scholar] [CrossRef]
  20. Li, Q.; Wang, B.; Woo, C.H.; Wang, H.; Wang, R. First-principles study on the formation energies of intrinsic defects in LiNbO3. J. Phys. Chem. Solids 2007, 68, 1336–1340. [Google Scholar] [CrossRef]
  21. Xu, H.; Lee, D.; He, J.; Sinnott, S.B.; Gopalan, V.; Dierolf, V.; Phillpot, S.R. Stability of intrinsic defects and defect clusters in LiNbO3 from density functional theory calculations. Phys. Rev. B 2008, 78, 174103. [Google Scholar] [CrossRef] [Green Version]
  22. Nahm, H.H.; Park, C.H. First-principles study of microscopic properties of the Nb antisite in LiNbO3: Comparison to phenomenological polaron theory. Phys. Rev. B 2008, 78, 184108. [Google Scholar] [CrossRef]
  23. Schmidt, W.G.; Albrecht, A.; Wippermann, S.; Blankenburg, S.; Rauls, E.; Fuchs, F.; Rödl, C.; Furthmüller, J.; Hermann, A. LiNbO3 ground- and excited-state properties from first-principles calculations. Phys. Rev. B 2008, 77, 035106. [Google Scholar] [CrossRef]
  24. Thierfelder, C.; Sanna, S.; Schindlmayr, A.; Schmidt, W.G. Do we know the band gap of lithium niobate? Phys. Status Solidi C 2010, 7, 460–463. [Google Scholar] [CrossRef]
  25. Friedrich, M.; Riefer, A.; Sanna, S.; Schmidt, W.G.; Schindlmayr, A. Phonon dispersion and zero-point renormalization of LiNbO3 from density-functional perturbation theory. J. Phys. Condens. Matter 2015, 27, 385402. [Google Scholar] [CrossRef] [PubMed] [Green Version]
  26. Riefer, A.; Friedrich, M.; Sanna, S.; Gerstmann, U.; Schindlmayr, A.; Schmidt, W.G. LiNbO3 electronic structure: Many-body interactions, spin-orbit coupling, and thermal effects. Phys. Rev. B 2016, 93, 075205. [Google Scholar] [CrossRef]
  27. Friedrich, M.; Schmidt, W.G.; Schindlmayr, A.; Sanna, S. Polaron optical absorption in congruent lithium niobate from time-dependent density-functional theory. Phys. Rev. Mater. 2017, 1, 054406. [Google Scholar] [CrossRef] [Green Version]
  28. Friedrich, M.; Schmidt, W.G.; Schindlmayr, A.; Sanna, S. Optical properties of titanium-doped lithium niobate from time-dependent density-functional theory. Phys. Rev. Mater. 2017, 1, 034401. [Google Scholar] [CrossRef] [Green Version]
  29. Botti, S.; Schindlmayr, A.; Del Sole, R.; Reining, L. Time-dependent density-functional theory for extended systems. Rep. Prog. Phys. 2007, 70, 357–407. [Google Scholar] [CrossRef]
  30. Riefer, A.; Sanna, S.; Schindlmayr, A.; Schmidt, W.G. Optical response of stoichiometric and congruent lithium niobate from first-principles calculations. Phys. Rev. B 2013, 87, 195208. [Google Scholar] [CrossRef] [Green Version]
  31. Sio, W.H.; Verdi, C.; Poncé, S.; Giustino, F. Polarons from first principles, without supercells. Phys. Rev. Lett. 2019, 122, 246403. [Google Scholar] [CrossRef] [PubMed] [Green Version]
  32. Giannozzi, P.; Baroni, S.; Bonini, N.; Calandra, M.; Car, R.; Cavazzoni, C.; Ceresoli, D.; Chiarotti, G.L.; Cococcioni, M.; Dabo, I.; et al. QUANTUM ESPRESSO: A modular and open-source software project for quantum simulations of materials. J. Phys. Condens. Matter 2009, 21, 395502. [Google Scholar] [CrossRef] [PubMed]
  33. Perdew, J.P.; Ruzsinszky, A.; Csonka, G.I.; Vydrov, O.A.; Scuseria, G.E.; Constantin, L.A.; Zhou, X.; Burke, K. Restoring the density-gradient expansion for exchange in solids and surfaces. Phys. Rev. Lett. 2008, 100, 136406. [Google Scholar] [CrossRef] [Green Version]
  34. Schmidt, F.; Landmann, M.; Rauls, E.; Argiolas, N.; Sanna, S.; Schmidt, W.G.; Schindlmayr, A. Consistent atomic geometries and electronic structure of five phases of potassium niobate from density-functional theory. Adv. Mater. Sci. Eng. 2017, 2017, 3981317. [Google Scholar] [CrossRef] [Green Version]
  35. Schmidt, F.; Riefer, A.; Schmidt, W.G.; Schindlmayr, A.; Imlau, M.; Dobener, F.; Mengel, N.; Chatterjee, S.; Sanna, S. Quasiparticle and excitonic effects in the optical response of KNbO3. Phys. Rev. Mater. 2019, 3, 054401. [Google Scholar] [CrossRef]
  36. Friedrich, M.; Schindlmayr, A.; Schmidt, W.G.; Sanna, S. LiTaO3 phonon dispersion and ferroelectric transition calculated from first principles. Phys. Status Solidi B 2016, 253, 683–689. [Google Scholar] [CrossRef]
  37. Cococcioni, M.; de Gironcoli, S. Linear response approach to the calculation of the effective interaction parameters in the LDA+U method. Phys. Rev. B 2005, 71, 035105. [Google Scholar] [CrossRef] [Green Version]
  38. Marini, A.; Hogan, C.; Grüning, M.; Varsano, D. Yambo: An ab initio tool for excited state calculations. Comput. Phys. Commun. 2009, 180, 1392–1403. [Google Scholar] [CrossRef] [Green Version]
  39. Schirmer, O.F.; von der Linde, D. Two-photon- and x-ray-induced Nb4+ and O small polarons in LiNbO3. Appl. Phys. Lett. 1978, 33, 35–38. [Google Scholar] [CrossRef]
  40. Müller, H.; Schirmer, O.F. Microscopic structure of NbLi related defects in reduced undoped LiNbO3. Ferroelectrics 1992, 125, 319–324. [Google Scholar] [CrossRef]
  41. Riefer, A.; Rohrmüller, M.; Landmann, M.; Sanna, S.; Rauls, E.; Vollmers, N.J.; Hölscher, R.; Witte, M.; Li, Y.; Gerstmann, U.; et al. Lithium niobate dielectric function and second-order polarizability tensor from massively parallel ab initio calculations. In High Performance Computing in Science and Engineering ‘13; Nagel, W., Kröner, D., Resch, M., Eds.; Springer: Cham, Switzerland, 2013; pp. 93–104. [Google Scholar]
Figure 1. Stacking order of lithium niobate: Stoichiometric crystal (a), free polaron (b), bound polaron at a Nb Li antisite (c) or a Nb V –V Li defect pair (d), bipolaron at a Nb Li antisite (e) or a Nb V –V Li defect pair (f). Black squares represent oxygen octahedra, while red squares indicate the formation of a (bi)polaron at this site. Gray fillings highlight deviations from the stoichiometric solid.
Crystals 11 00542 g001
Figure 2. Atomic displacements in the vicinity of a bipolaron at the Nb Li antisite defect (a) or the Nb V –V Li defect pair (b) with respect to the positions in stoichiometric LN, plotted as a function of the distance from the defect niobium atom hosting the bipolaron. Green circles and red boxes refer to niobium and oxygen atoms, respectively. The numbering corresponds to the pictured section of the crystal structure, the label “0” marks the defect Nb Li or Nb V atom hosting the bipolaron. Large green and small red balls represent niobium and oxygen atoms, respectively. Oxygen atoms outside the central pillar of oxygen octahedra are indicated in a lighter color shade.
Crystals 11 00542 g002
Figure 3. Crystal structure in the vicinity of the free polaron (a,b), the bound polaron at a Nb Li antisite defect (c,d) or a Nb V –V Li defect pair (e,f), and the bipolaron at Nb Li (g) or Nb V –V Li (h). Subfigures (b,d,f) refer to tilted configurations with broken trigonal symmetry, all other structures exhibit axial symmetry. Black balls indicate atomic positions in stoichiometric LN without polarons, while blue, green, and red balls denote lithium, niobium, and oxygen atoms in the relaxed structures, respectively. Note that (e,f,h) show a different segment of the crystal than the other subfigures.
Crystals 11 00542 g003
Figure 4. Charge densities of the free polaron (a,b), the bound polaron at a Nb Li antisite defect (c,d) or a Nb V –V Li defect pair (e,f), and the bipolaron at Nb Li (g) or Nb V –V Li (h). Subfigures (b,d,f) refer to tilted configurations, all other structures exhibit axial symmetry. Blue, green, and red balls represent lithium, niobium, and oxygen atoms, respectively. Reproduced from [12].
Crystals 11 00542 g004
Figure 5. Electron densities of states for the free polaron (a,b), the bound polaron at a Nb Li antisite defect (c,d) or a Nb V –V Li defect pair (e,f), and the bipolaron at Nb Li (g) or Nb V –V Li (h). Subfigures (b,d,f) refer to tilted configurations, all other structures exhibit axial symmetry. The thick black line shows the imaginary part of ε z z ( ω ) within the independent-particle approximation (IPA), whose low-energy resonances correspond to transitions from the defect state into the conduction band.
Crystals 11 00542 g005
Figure 6. Imaginary (top) and real (bottom) parts of the ε z z component of the dielectric function for bipolarons localized at a Nb Li antisite defect (left) or a Nb V –V Li defect pair (right). We compare results from IPA (black), IQA (blue), and BSE (red). The arrows indicate the positions of the dominant defect-related peaks in the absorption spectra. The dashed horizontal line for Re ε z z marks zero.
Crystals 11 00542 g006
Figure 7. Imaginary (solid lines) and real (dashed lines) parts of the dielectric function ε calculated within the BSE for z-polarized (red) and x-polarized (blue) light. The left and right panel correspond to bipolarons at a Nb Li antisite defect and a Nb V –V Li defect pair, respectively.
Crystals 11 00542 g007
Figure 8. Optical properties derived from the dielectric function within the BSE: reflectivity R (top), absorption coefficient α (middle), and electron-energy-loss function L (bottom) for z-polarized (red) and x-polarized (blue) light. The left panels correspond to bipolarons at a Nb Li antisite defect, the right panels to bipolarons at a Nb V –V Li defect pair. In the plots of the absorption coefficients, vertical lines indicate the position of the absorption band assigned to bipolarons in different experiments [12,13].
Crystals 11 00542 g008
Publisher’s Note: MDPI stays neutral with regard to jurisdictional claims in published maps and institutional affiliations.

