Abstract
This communication introduces a fast material- and process-agnostic modeling approach, not reported in the open literature, that is calibrated for predicting the evolution of texture in metal additive manufacturing of stainless steel 304L as a function of a process parameter, namely the laser scanning speed. The outputs of the model are compared against independent validation experiments for the same material system and show excellent consistency. The model also predicts a trend in the change of texture intensity as a function of the process parameter. The major novelty and strength of this work is the model’s speed and extremely light computational load. The model’s calibrations and predictions were carried out in 9.2 s on a typical desktop computer.
Anisotropic material properties such as Young’s modulus [1,2], thermal [3] and electrical conductivity [4], fatigue endurance [5,6], tensile/compressive strength [7], and magnetic susceptibility [8] are remarkably affected by texture. Solidification, plastic deformation, and recrystallization are major root causes of the evolution of texture in metal materials. Manufacturing processes apply one or a combination of major causes that lead to significant texture modification. As undesired texture will cause weakness in performance [9], it is crucial to make sure the manufactured part is oriented at desired texture components. Accordingly, developing computational methods to predict texture is of significant value. There is a plethora of studies on texture evolution in materials processing and synthesis [10,11,12,13,14]. In a recent work, the impacts of twinning in two-phase duplex stainless steel on the texture evolution of cold-rolled at various strain levels was explored. It was reported that the correct textures can be predicted by considering the strong local interactions between the phases [10]. Wang et al. [15] adopted the crystal plasticity finite element method (CPFEM) to predict plastic deformation and texture evolution in a single crystal of aluminum during nine cycles of the accumulative roll-bonding (ARB) process. Increasing ARB cycles makes the texture less sensitive to thickness position change; however, the impact of interfaces becomes more pronounced. Furthermore, Xu et al. [16] predicted the texture of aluminum alloys during the hot extrusion process by utilizing FC-Taylor, Taylor-type Advanced Lamel Model(ALAMEL), and ALAMEL III models, reporting that the FC-Taylor model provides a more accurate prediction at the center position and the ALAMEL-type model are superior at the surface position. It should be noted that the majority of current models on the evolution of texture, such as self-consistent models [17], were based on a finite element [18,19,20], dealing with texture evolution due to plastic deformation. However, very few researchers reported modeling the evolution of texture with respect to process parameters [21,22,23,24], particularly predicting texture in metal additive manufacturing (MAM). In Laser Powder Bed Fusion (LPBFF), texture is of particular interest. In the Laser Powder Bed Fusion(LPBF) process, solidification and localized plastic deformation due to thermal stresses induced by rapid cooling drive significant crystallographic texture that can be dramatically different from counterparts produced by conventional methods [25].
Computationally efficient modeling for texture prediction is of great value for the savings it provides in cost and time. As described in more detail below, the current computational algorithms for predicting texture critically lack computational efficiency. Accordingly, this communication aims to provide a fast algorithm for texture prediction and validation of the prediction in the LPBF process. First, a computer model was developed and calibrated with experimentally obtained data from texture analysis in LPBF processed 304L stainless steel. Then, the model was validated with independent experiments on the same material system. The process parameter that the predictive model was constructed upon was the laser scan speed in the LPBF process.
In this work, an ORLAS Creator LPBF machine(Dieburg, Germany) was utilized to produce coupons from 304L stainless steel powder with the following process parameters: laser power of 105 W, hatch spacing of 50 μm, a layer thickness of 30 μm, and laser scan speed of 50, 200, 400 and 600 mm/s. Further details about the sample preparation can be found elsewhere [26]. In order to collect texture data, the electron backscattered diffraction (EBSD) data were obtained by using an Orientation Imaging Microscopy (OIM) software (Mahwah, NJ, USA) in FEI Quanta 3D and the collected data were analyzed using OIM Analysis software. The texture results were collected for a cross-section of the samples normal to the build direction and at half-height of the sample. Figure 1 illustrates a macro- and micrograph of the printed samples. Coding for the model development was done in MATLAB and the MTEX toolbox was used to analyze texture [27,28,29]. A desktop computer equipped with a 4-Core Intel® Xeon™ E-2024G CPU with a 3.40 GHz clock rate and 16 GB of RAM was used. For texture analysis, the collected EBSD data were projected onto the fundamental zone of the cubic system and it was verified that the cross-section was the X-Y plane of the sample coordinate system.
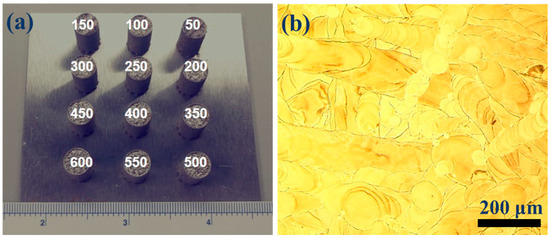
Figure 1.
(a) image of printed samples with scanning speeds annotated and, (b) optical micrograph of the etched cross-section perpendicular to the build direction of the sample printed at 50 mm/s scanning speed.
The algorithm developed for this work is based on Spherical Harmonic series expansion of the orientation distribution function (ODF). ODF, , is defined as the probability of finding a crystallite with certain orientation . represents the set of three Euler angles, , and therefore defines the orientation of the crystallite. The ODF can be expanded into a series of (symmetric) generalized spherical harmonic functions [30]
The spherical harmonic term is a function of and accommodates all the angular and geometric information about texture. The coefficient term, which is not a function of , determines the weight of each harmonic term contributing to the ultimate ODF of the aggregate. Consequently, the term contains all the information on all the process parameters affecting texture [22]. The harmonic series expansion that leads to calculation of the coefficients is reported with details elsewhere [21]:
where is a constant and represents the complex conjugate of . Consequently, a methodology for relating these weight coefficients to process parameters can be used to predict texture evolution as a function the parameters. The conventional way of obtaining the coefficients as a function of process parameters is described in detail in [22]. This method is computationally intensive and requires the series expansion to be truncated at very early terms, such as 4 terms [22]. It is worthy of attention that the coefficients are complex numbers. Our novel approach for deriving the functionality of the coefficients with respect to the process parameters is first very fast and efficient and second, as comparisons against experiments demonstrate, is impressively accurate. We tested this approach for (rather than 4 or 6 [30]), which ended up with 16,215 complex numbers, considering the cubic symmetry of SS304L. In the next step, the complex datasets are passed as a matrix into a simultaneous polynomial curve fitting function. Simultaneous refers to the fact that the fitting procedure is simultaneously applied for the all the 16,215 complex coefficients. Thus, the coefficients are not assumed to be independent. The fitting is assisted by experimental data. In our work and as explained above, the experimentally measured texture at 4 scan speed values was chosen for calibration. The whole calibration and prediction computation time was ≈9.2 s.
Figure 2 shows ODF cross sections at = 0 for the four scan speed cases used for calibration. Hence, these four samples/experiments are so-called “calibration” samples/experiments. A strong Cube texture component is observable, with high intensity at 0 and 90° and angles. The maximal intensity, which also is a function of process parameter, seems to reduce with increasing scan speed. The increased scan speed is equivalent to the lower energy density delivered to the material, which leads to a weaker evolution of texture.
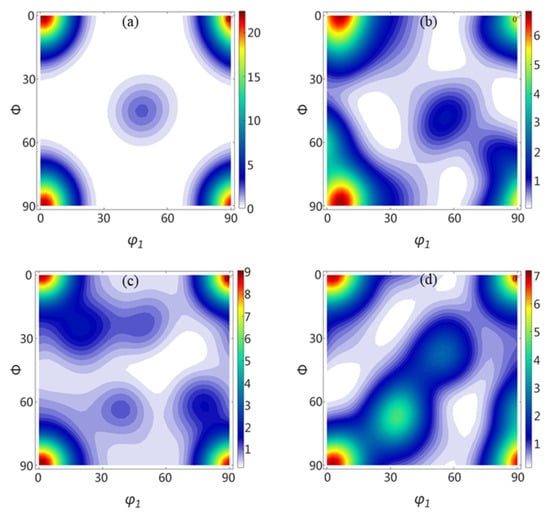
Figure 2.
Experimentally measured ODF for calibration samples at (a) 50 mm/s, (b) 200 mm/s, (c) 400 mm/s and (d) 600 mm/s scan speed.
Figure 3a,b, respectively, shows the texture predicted by the model for two randomly selected scan speeds of 100 and 300 mm/s. As common for cubic crystal systems and for the sake of completeness of ODF presentation, four constant cross-sections are shown in Figure 3. Both cases predict the presence of a strong Cube component and additionally predict that the maximal texture intensity reduces with increasing scan speed, which is in agreement with the reduced energy density delivered to the material at higher scan speeds. Samples were printed at these two scan speeds (i.e., 100 and 300 mm/s) and the texture was measured as explained above. These two experiments/samples are identified as validation experiments/samples. The same four cross-sections for the validation samples are shown in Figure 4. Similar to Figure 3, Figure 4 displays strong Cube texture properties, intensity at 0 and 90°, and angles at = 0, and high intensity components at and the three other cross-sections.
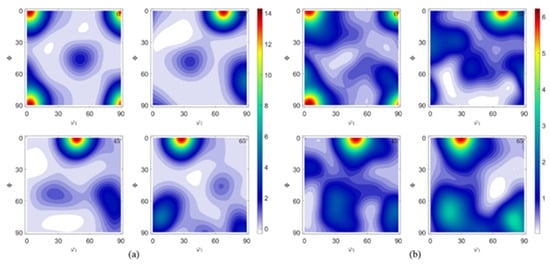
Figure 3.
Predicted ODF at four sections (0°, 25°, 45°, and 65°) for scanning speed of (a) 100 mm/s, and (b) 300 mm/s.
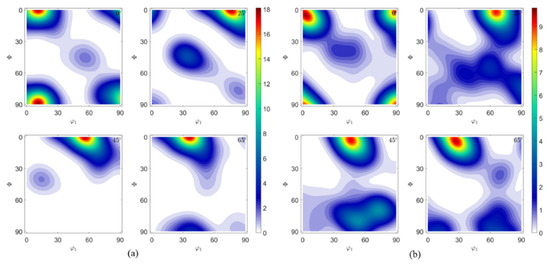
Figure 4.
ODF representation of validation samples at four sections (0°, 25°, 45°, and 65°) for scanning speed of (a) 100 mm/s, and (b) 300 mm/s.
In order to better compare the modeling results and calibration experiments, the alpha texture fibers of the four cases are plotted in Figure 5. The same trend in the texture fiber is observed in modeling and validation experiments. It is observed that at = 0°, the model predicts a texture intensity of 14 times that of a randomly oriented material for the scanning speed of 100 mm/s, while the experiments show less than 12. The same intensity value for the 300 mm/s validation experiment is ≈9, while the model predicts ≈ 6.
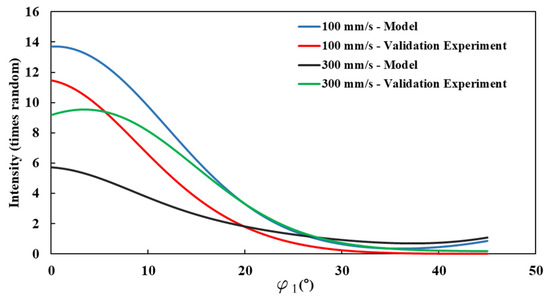
Figure 5.
Alpha fibers of model predictions and experimental validations compared for scanning speeds of 100 mm/s and 300 mm/s.
Since the common way of visualizing ODF by cross-sections (shown in Figure 2, Figure 3 and Figure 4) is prone to not showing all the significant texture characteristics (if not enough cross-sections are shown), and can also make it difficult to compare the significance of different texture components, the texture index, as a more straightforward texture comparison parameter, is introduced. The texture index, , is defineas:
is an indicator of the overall texture intensity of the material, regardless of the specific Euler angles at which the strongest texture intensities occur. The fact that provides a single value for each ODF, , makes the comparison of different ODFs (and therefore different samples) much easier. The higher the texture index, the more textured the material, regardless of the specific texture components. This type of comparison is specifically helpful for cases in which cross-sections of the ODF show the same component, (in this case Cube texture) and the objective is to compare the overall texture intensity.
Accordingly, Figure 6 illustrates the texture indices of all the experimental and modeling cases investigated in this work. It is observed that increasing the scan speed reduces the overall texture intensity in MAM, which is due to the recued energy density delivered to the material. For the scan speed of 100 mm/s, the validation experiment yields a texture index of 4.81. The model predicts 3.91. For the case of 300 mm/s, the validation experiment predicts a 2.5 texture index, while the model gives 1.65. It is observed that the model’s predictions are less intense than the experimental values, which can be due to the fact the calibration experiment at 200 mm/s turned out slightly lower in intensity compared to the trend. However, the predicted texture components themselves are exactly predicted.
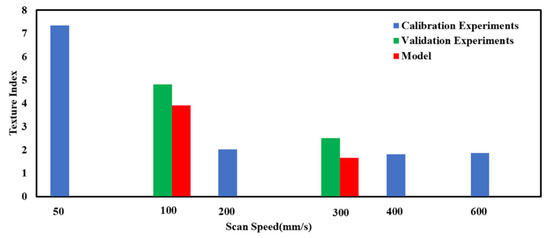
Figure 6.
Comparison of texture index for model predictions and calibration and validation experiments.
The main purpose of this communication is to prove the applicability of the simultaneous polynomial fit method explained above and to establish a predictive model to capture crystallographic texture evolution in metal additive manufacturing as a function of process parameters. The laser scanning speed was selected as the process parameter, with respect to which the evolution of texture was predicted by the model. The approach requires calibration but is also optimized by independent experiments conducted on the same material system, stainless steel 304L. The texture component prediction is precise, but the predicted texture intensity is lower than the experiments conducted for validation, though still quite acceptable in the texture context. Additionally, the trend in texture intensity versus the process parameter is captured very well by the model. The major advantage of this model is the extremely low computational cost for its execution. The whole calibration and prediction simulations took less than 10 s on a typical desktop computer. Future work consists of testing this fast predictive model to account for more than one process parameter as well as other crystal systems. The approach is both material and process-agonistic and can also be applied to non-additive processes.
Author Contributions
Conceptualization, A.T.; methodology, A.T.; software, Y.L.; validation, M.G.; formal analysis, A.T.; investigation, Y.L., M.G.; resources, S.P.; writing—original draft preparation, Y.L.; writing—review and editing, A.T.; supervision, A.T.; All authors have read and agreed to the published version of the manuscript.
Funding
This research received no external funding.
Data Availability Statement
The data of this work can be found at http://research.engr.oregonstate.edu/lmm/research/ (accessed on 26 April 2021).
Conflicts of Interest
The authors declare no conflict of interest.
References
- Hill, G. Young’s modulus. In Loudspeaker Modelling and Design; Routledge: London, UK, 2019. [Google Scholar]
- Ozaki, T.; Matsumoto, H.; Watanabe, S.; Hanada, S. Beta ti alloys with low young’s modulus. Proc. Mater. Trans. 2004, 45, 2776–2779. [Google Scholar] [CrossRef]
- Pop, E.; Varshney, V.; Roy, A.K. Thermal properties of graphene: Fundamentals and applications. MRS Bull. 2012. [Google Scholar] [CrossRef]
- Wilson, A.H.; Fowler, R.H. The electrical conductivity of the transition metals. Proc. R. Soc. A Math. Phys. Eng. Sci. 1938, 167, 580–593. [Google Scholar] [CrossRef]
- Risitano, A. Fatigue of Materials. In Mechanical Design; CRC Press: Boca Raton, FL, USA, 2020. [Google Scholar]
- Schütz, W. A history of fatigue. Eng. Fract. Mech. 1996. [Google Scholar] [CrossRef]
- Song, P.S.; Hwang, S. Mechanical properties of high-strength steel fiber-reinforced concrete. Constr. Build. Mater. 2004. [Google Scholar] [CrossRef]
- Schenck, J.F. The role of magnetic susceptibility in magnetic resonance imaging: MRI magnetic compatibility of the first and second kinds. Med. Phys. 1996, 23, 815–850. [Google Scholar] [CrossRef]
- Messing, G.L.; Poterala, S.; Chang, Y.; Frueh, T.; Kupp, E.R.; Watson, B.H.; Walton, R.L.; Brova, M.J.; Hofer, A.K.; Bermejo, R.; et al. Texture-engineered ceramics—Property enhancements through crystallographic tailoring. J. Mater. Res. 2017, 32, 3219–3241. [Google Scholar] [CrossRef]
- Chalapathi, D.; Sivaprasad, P.V.; Kanjarla, A.K. Role of deformation twinning and second phase on the texture evolution in a duplex stainless steel during cold rolling: Experimental and modelling study. Mater. Sci. Eng. A 2020. [Google Scholar] [CrossRef]
- Deeparekha, N.; Gupta, A.; Demiral, M.; Khatirkar, R.K. Cold rolling of an interstitial free (IF) steel—Experiments and simulations. Mech. Mater. 2020, 1438, 103420. [Google Scholar] [CrossRef]
- Fanton, L.; de Lima, N.B.; Encinas, E.R.; Borrás, V.A.; Afonso, C.R.M.; Fogagnolo, J.B. Effects of laser surface melting on crystallographic texture, microstructure, elastic modulus and hardness of Ti−30Nb−4Sn alloy. Trans. Nonferrous Met. Soc. China 2020, 30, 392–404. [Google Scholar] [CrossRef]
- Barrett, T.J.; McCabe, R.J.; Brown, D.W.; Clausen, B.; Vogel, S.C.; Knezevic, M. Predicting deformation behavior of α-uranium during tension, compression, load reversal, rolling, and sheet forming using elasto-plastic, multi-level crystal plasticity coupled with finite elements. J. Mech. Phys. Solids 2020. [Google Scholar] [CrossRef]
- Nazir, A.; Jeng, J.-Y. A high-speed additive manufacturing approach for achieving high printing speed and accuracy. Proc. Inst. Mech. Eng. Part C J. Mech. Eng. Sci. 2020, 234, 2741–2749. [Google Scholar] [CrossRef]
- Wang, H.; Lu, C.; Tieu, K.; Deng, G.; Wei, P.; Liu, Y. A crystal plasticity FEM study of through-thickness deformation and texture in a {112} <111> aluminium single crystal during accumulative roll-bonding. Sci. Rep. 2019, 9, 1–13. [Google Scholar] [CrossRef] [PubMed]
- Xu, Z.; Zhang, C.; Wang, K.; Zhang, K.; Zhao, G.; Chen, L. Crystal plasticity prediction of texture evolution during helical extrusion process of aluminium alloys under three-dimensional deformation path. J. Alloys Compd. 2020. [Google Scholar] [CrossRef]
- Molinari, A.; Ahzi, S.; Kouddane, R. On the self-consistent modeling of elastic-plastic behavior of polycrystals. Mech. Mater. 1997, 26, 43–62. [Google Scholar] [CrossRef]
- Wu, Y.; Shen, Y.; Chen, K.; Yu, Y.; He, G.; Wu, P. Multi-scale crystal plasticity finite element method (CPFEM) simulations for shear band development in aluminum alloys. J. Alloys Compd. 2017. [Google Scholar] [CrossRef]
- Esmaeilpour, R.; Kim, H.; Park, T.; Pourboghrat, F.; Xu, Z.; Mohammed, B.; Abu-Farha, F. Calibration of Barlat Yld2004-18P yield function using CPFEM and 3D RVE for the simulation of single point incremental forming (SPIF) of 7075-O aluminum sheet. Int. J. Mech. Sci. 2018. [Google Scholar] [CrossRef]
- Sinha, S.; Ghosh, S. Modeling cyclic ratcheting based fatigue life of HSLA steels using crystal plasticity FEM simulations and experiments. Int. J. Fatigue 2006. [Google Scholar] [CrossRef]
- Tabei, A.; Shih, D.S.; Garmestani, H.; Liang, S.Y. Derivation of Process Path Functions in Machining of Al Alloy 7075. J. Mater. Eng. Perform. 2015, 24. [Google Scholar] [CrossRef]
- Li, D.S.; Garmestani, H.; Ahzi, S. Processing path optimization to achieve desired texture in polycrystalline materials. Acta Mater. 2007, 55, 647–654. [Google Scholar] [CrossRef]
- Tabei, A.; Mirkoohi, E.; Garmestani, H.; Liang, S. Modeling of texture development in additive manufacturing of Ni-based superalloys. Int. J. Adv. Manuf. Technol. 2019, 103, 1057–1066. [Google Scholar] [CrossRef]
- Fergani, O.; Tabei, A.; Garmestani, H.; Liang, S.Y. Prediction of material microstructural texture evolution in machining via viscoplastic self-consistent modeling. J. Manuf. Process. 2014, 16. [Google Scholar] [CrossRef]
- Wang, Y.M.; Voisin, T.; McKeown, J.T.; Ye, J.; Calta, N.P.; Li, Z.; Zeng, Z.; Zhang, Y.; Chen, W.; Roehling, T.T.; et al. Additively manufactured hierarchical stainless steels with high strength and ductility. Nat. Mater. 2018, 17, 63–70. [Google Scholar] [CrossRef] [PubMed]
- Ghayoor, M.; Lee, K.; He, Y.; Chang, C.-H.; Paul, B.K.; Pasebani, S. Selective laser melting of 304L stainless steel: Role of volumetric energy density on the microstructure, texture and mechanical properties. Addit. Manuf. 2020, 32, 101011. [Google Scholar] [CrossRef]
- Hielscher, R.; Lippert, L. Locally Isometric Embeddings of Quotients of the Rotation Group Modulo Finite Symmetries. Available online: https://www-user.tu-chemnitz.de/lipl/paper/isometricembeddings.pdf (accessed on 22 April 2021).
- Hielscher, R.; Bartel, F.; Britton, T.B. Gazing at crystal balls: Electron backscatter diffraction pattern analysis and cross correlation on the sphere. Ultramicroscopy 2019, 207, 112836. [Google Scholar] [CrossRef]
- MTEX Toolbox|MTEX. Available online: https://mtex-toolbox.github.io/ (accessed on 11 February 2021).
- Bunge, H.-J. Texture Analysis in Materials Science: Mathematical Methods; Elsevier: Amsterdam, The Netherlands, 2013; ISBN 1483278395. [Google Scholar]
Publisher’s Note: MDPI stays neutral with regard to jurisdictional claims in published maps and institutional affiliations. |
© 2021 by the authors. Licensee MDPI, Basel, Switzerland. This article is an open access article distributed under the terms and conditions of the Creative Commons Attribution (CC BY) license (https://creativecommons.org/licenses/by/4.0/).