2. Design and Its Geometrical Formalism
One of the most successful branches of AR-HCFs is the tubular type where the central hollow core is surrounded by a small number of thin-wall tubular cladding elements [
5]. The tubular hollow-core fiber (THCF) with its simple geometry is relatively easy to fabricate, yet it can still exhibit transmission loss as low as just a few tens of dB∙km
−1 [
10,
14]. An idealized cross-sectional structure of a six-element THCF is presented in
Figure 1a, where gray shades correspond to the regions of dielectric medium, and white regions are hollow.
D is the core diameter which is defined as the diameter of the largest circle that fits in the middle hollow region;
d is the exterior diameter of the tubular cladding elements; and
t is their wall thickness. The size of the tubular cladding elements in THCF is often characterized in terms of the ratio
d/
D. The range of possible
d/
D is then set by the number of cladding elements,
N, i.e.,
[
15].
A variant of THCF, called nested antiresonant nodeless fiber (NANF), has additional smaller tubular elements of the same wall thickness nested inside the original cladding tubes of THCF, which provide one more antiresonant reflection layer to enhance the light confinement [
16,
17]. Their presence substantially reduces the loss, and NANFs that exhibit ultra-low loss—comparable to the loss in telecommunication fibers—have been reported in recent years [
18,
19].
Figure 1b is an idealized structure of a six-element NANF. In this design, the cladding elements are characterized by the exterior diameter of the outer cladding tubes,
d1, and that of the inner tubes,
d2. The core size,
D, and dielectric wall thickness,
t, are defined in the same way as in THCF.
Figure 1c presents the confinement loss of the fundamental core mode in silica-based THCF and NANF calculated using finite-element modeling. We apply a 20 μm thick perfectly matched layer at the boundary of our calculation domain. We set
D = 60 μm,
t = 0.6 μm, and
d =
d1 = 2
d2 = 39 μm in both fibers. Their loss spectra consist of low and high loss regions, where in the low-loss regions, NANF outperforms THCF by approximately two orders of magnitude. The locations of the high-loss bands in AR-HCFs are dictated by the dielectric wall thickness of cladding elements. This gives rise to presence of the peak seen at around 1.25 μm in both geometries. At this wavelength, dielectric wall essentially acts as a Fabry–Perot resonator, and light can easily escape from the core resulting in leakage loss. The resonant wavelengths are given by [
20,
21]:
where
t is the wall thickness, and
n is the refractive index of the dielectric material, silica.
m is a positive integer which represents the order of the resonance. Hence, the loss at 1.25 μm is the first resonant band, i.e.,
m = 1, and the low-loss region on the long-wavelength side of it is the first transmission band.
Two most influential structural parameters that govern the light guidance in AR-HCF are the dielectric wall thickness of the cladding elements and core diameter. We can express them in terms of the operating wavelength to generalize our investigation for all wavelengths, and study individually effect of each on the confinement loss. For this, we first introduce normalized frequency,
F, which represents dielectric wall thickness relative to the wavelength. This is given by:
Where
λ is the wavelength. We assume for now the refractive index of silica,
n, is fixed at 1.45 in all calculations to follow. The consequence of its large variation near the silica material resonance at around 8 μm shall be discussed in the later part in
Section 3. In Equation (2),
F naturally follows the high-loss and low-loss bands in AR-HCF. That is,
F close to an integer value (
F ≈
m) corresponds to a resonant band while
F close to a half integer value (
F ≈
m − 0.5) implies a transmission band, where
m = 1, 2, 3, … is the order of the resonant or transmission band. Next, the core diameter,
D, can also be standardized and expressed in terms of
λ by introducing the normalized core diameter,
G, which is given by:
Our comprehensive literature survey indicates that
G in the range of 25–35 is used the most often, as it strikes a good balance between the confinement and bending-induced loss [
1,
13].
It is important to note when the entire cross-sectional structure of AR-HCF and wavelength are scaled by the same factor, the imaginary part of effective indices of the core modes—responsible for the confinement loss in respective modes—remain the same. We corroborate this assertion in
Figure 2a with a plot of the imaginary part of effective index of the fundamental core mode,
, in a six-element THCF versus the scaling factor,
f. Here, the calculations are carried out for the wavelength,
fλ, on the fiber geometry characterized by
fD,
fd, and
ft as illustrated in
Figure 2b. Namely, the parameters used in the calculation are
λ = 1.06 μm,
D = 26.5 μm,
d = 17.2 μm, and
t = 0.26 μm. The confinement loss,
, expressed in dB∙m
−1 and
are related through [
22]:
Figure 2 and Equation (4) elucidate that
is not conserved when the fiber geometry and wavelength are scaled by the same amount. Rather,
varies inversely with
λ since
is the quantity that is conserved.
3. Results and Discussions
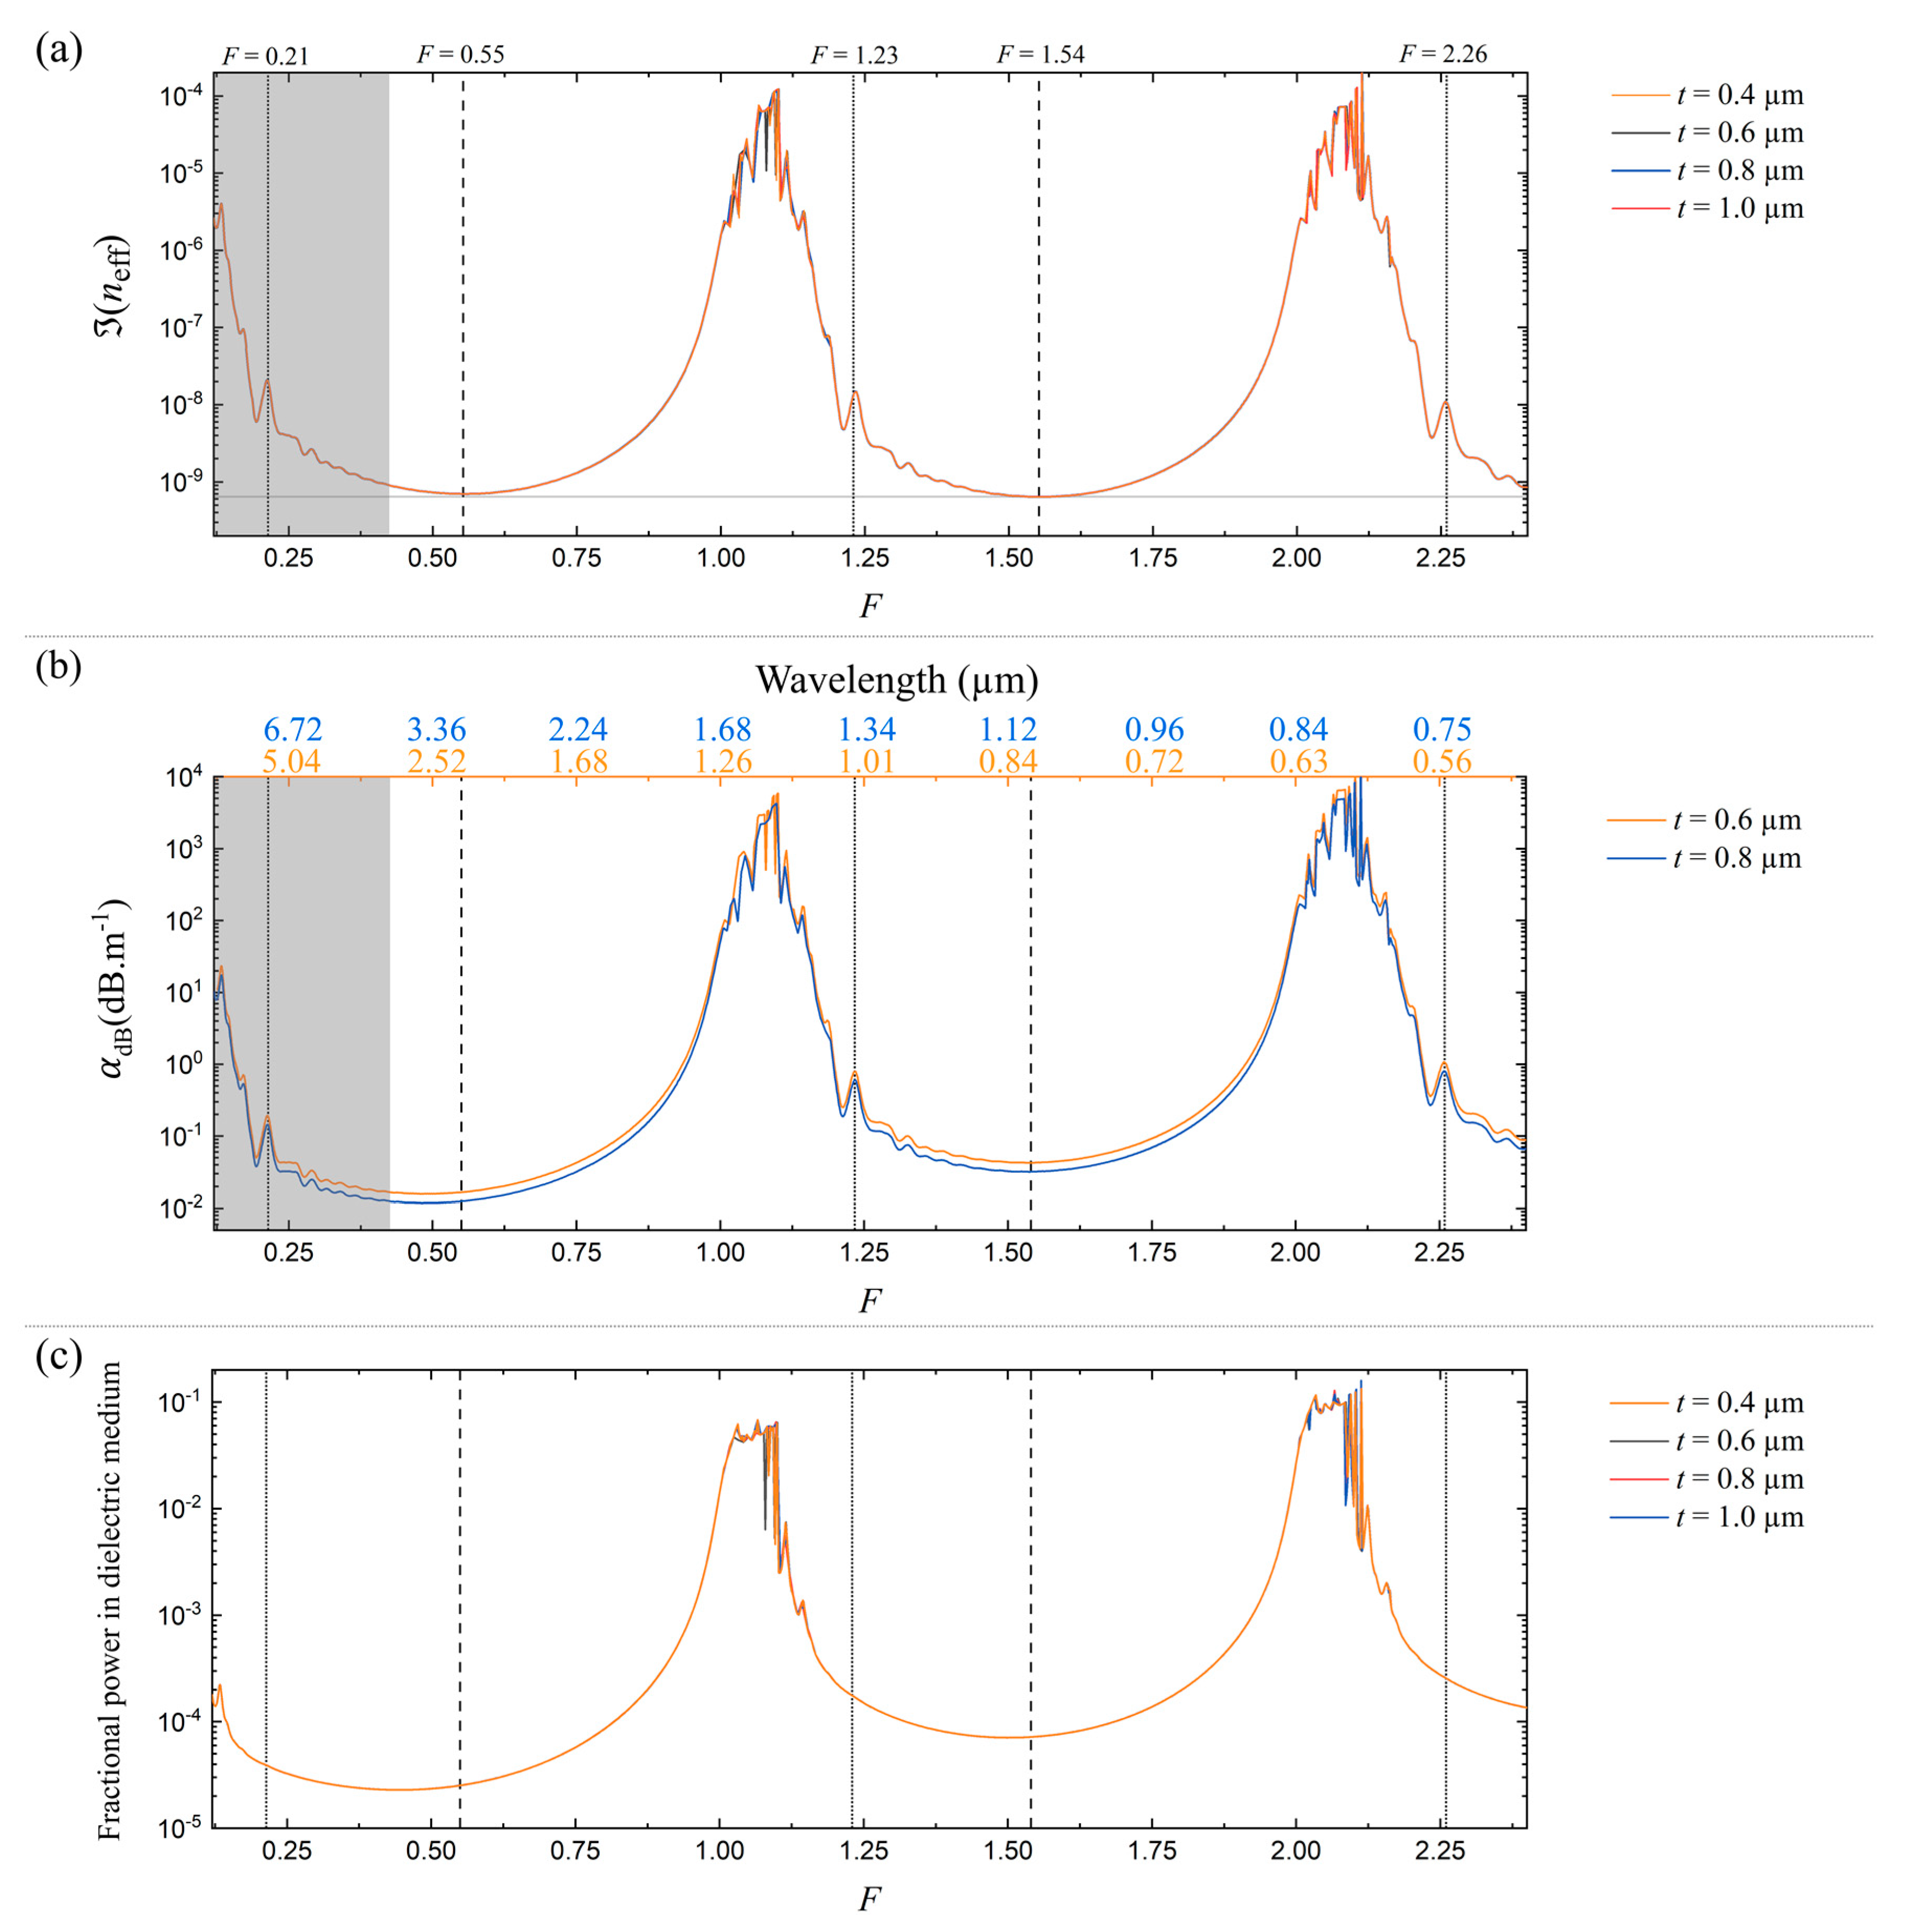
Figure 3a presents the imaginary part of the effective index of the fundamental core mode,
, as a function of the normalized frequency,
F, in a six-tube THCF when
G = 25 and
d/
D = 0.65. Note
d/
D = 0.65 is the ratio that gives the lowest loss in a six-tube THCF [
15]. We illustrate the excellent scalability of our study by repeating the calculations for four different values of
t = 0.4, 0.6, 0.8, and 1 μm. The results are accurately reproduced in all four calculations, including the highly oscillatory behaviors in the high-loss regions in
Figure 3a. Thus,
F allows us to carry out the study in the most general manner.
The presence of the transmission and resonant bands can be seen clearly in
Figure 3a. The loss peaks are shifted slightly from the integer values and placed at
F ≈
m + 0.1, while the lowest
in the
mth-order transmission band appears at
F ≈
m − 0.5 indicated with dashed-vertical lines. The small shift of the loss peak from the integer
F values has also been noted in several past numerical studies [
3,
23]. A comprehensive encounter of the origin behind the shift is presented in Reference [
23]. We note that the widths and lowest
values are roughly the same across all transmission bands. Moving in the direction of decreasing
F from the lowest
point in each transmission band, we begin to observe an oscillation and rise in the loss at
F ≈
m − 0.6. They appear in remarkably similar manner in all transmission bands with distinctive small peaks that are located near the red-edges indicated by dotted-vertical lines. The high loss regions, or the
mth-order resonant bands, are in
. The loss gradually increases towards the band edges of transmission bands. As
F approaches a resonance, the index mismatch between the fundamental core mode and dielectric cladding modes decreases, while their spatial field overlap increases, resulting in strong coupling between them. This leads to large light leakage in the core and corresponding rise in the confinement loss [
23,
24].
To give an idea on how
Figure 3a translates to the actual loss in dB∙m
−1 and wavelength, we plot, in
Figure 3b, the corresponding confinement loss in the case of two different
t values, 0.6 and 0.8 μm, with the equivalent wavelengths for the two cases shown in the upper horizontal axis. For long wavelength operation, light guidance in the first transmission band, i.e.,
F < 1, is of high relevance. In particular, the confinement loss at small
F values—in the gray-shaded regions in
Figure 3a,b—reveals how THCF is expected to operate in mid-IR. For instance,
F < 0.4 corresponds to the wavelength longer than 3.15 μm when
t = 0.6 μm. One striking observation which we discuss for the first time is how the resonance-like loss starts to show up below
F ≈ 0.4, in a much similar fashion to how it happens around the resonances at
F = 1, 2, and so on. In other words, after the minimum confinement loss is reached at
F = 0.5, the loss increases again as if there is another
t-induced resonance located at
F = 0. Even the small peaks at the red-edges of the transmission bands, marked with vertical-dotted lines at
F = 2.26 and 1.23, are replicated in the first transmission band at
F = 0.21. Considering that
F corresponds to the number of half wavelengths that fits in the thickness of the dielectric cladding tube wall, it is interesting to note that a Fabry–Perot-like resonance still exists when the thickness of the dielectric wall approaches zero. This suggests that the dielectric wall thickness in THCF must be increased accordingly to ensure
F > 0.2 and achieve low-loss guidance in the long wavelength limit.
Figure 3c shows the corresponding fractional optical power that overlaps with the dielectric medium in the fiber. Its qualitative features are identical to the loss. In the resonant bands, a large portion of light leaks out into the dielectric medium, while overlap is very small in the transmission bands. The overlap becomes smaller as the order of the transmission band is decreased. This quantity is among the most decisive factors that determine the performance of mid-IR guidance in silica-based AR-HCFs. A fiber design that ensures minimum fractional power in silica must be chosen to mitigate the dramatic increase in silica’s absorption beyond 2.4 μm.
Figure 3c implies that this can be achieved by placing the mid-IR wavelength near
F = 0.5.
We use the same approach and calculate
,
, and fractional optical power in the dielectric medium in a six-element NANF as a function of
F. These are shown in
Figure 4a–c, respectively. The structural parameters are kept the same as in
Figure 3, i.e.,
G = 25,
d1/
D = 0.65. The ratio between the exterior diameters of the outer and inner cladding elements,
d1/
d2 = 2 is used in all calculations. In
Figure 4b, we set
t = 0.6 μm to evaluate the corresponding confinement loss and wavelength. The same quantities for THCF, identical to those presented in
Figure 3, are plotted together in
Figure 4 for comparison. The reduction of over two orders of magnitude is evident in the transmission bands, clearly demonstrating its superior performance. Towards both edges of each transmission band in NANF, the loss rises rapidly and reaches the same level as in THCF beyond the vertical-dotted lines. This happens when
F <
m − 0.75 in the long- and
F >
m in the short-wavelength edges. On the other hand, NANF does not further reduce the light-glass overlap as shown in
Figure 4c. Therefore, NANF does not offer additional benefit when it comes to mitigating the high material absorption in mid-IR. Furthermore, NANF also exhibits a resonance-like loss in the long-wavelength side of its fundamental transmission band, i.e., as
F approaches 0, just like that seen in THCF in
Figure 3. This appears to be a feature that is universal to all AR-HCFs.
Thus far, we adopted
D correspondingly as
F is varied such that
G = 25 is maintained, which eliminates the effect of core size on the confinement loss in our study. Let us now look at how the core size,
D, influences the mid-IR guidance in AR-HCFs. Generally, the loss decreases with increasing core size due to larger glancing angle of light incident at the core boundary, which results in higher Fresnel reflection reducing the attenuation [
1]. We start from the Marcatili and Schmeltzer model which presents an analytic expression for the mode attenuation in an idealized capillary that consists of a circular core surrounded by infinitely thick homogenous non-absorbing dielectric medium. In this model, the imaginary part of the fundamental core mode index can be expressed as [
22]:
Here,
u = 2.405 is the first zero of the Bessell function
J0. The loss per unit length in a dielectric capillary can then be obtained through Equation (4). It indicates that the confinement loss in a dielectric capillary scales with the inverse cube of
D. For a thin wall dielectric capillary, Zeisberger and Schmidt analytically showed that the loss becomes proportional to
D−4 [
25]. This scaling changes to
D−4.5 in THCF when the tubular cladding elements are in contact with each other, i.e.,
, as demonstrated numerically in Reference [
26]. In this regard, we highlight that the two of the cases discussed above—the capillary with infinitely thick dielectric medium and THCF with touching cladding elements—represent two extreme values of
d/
D in THCF. On one end, we have the dielectric capillary when
d/
D = 0 where the loss scales with
D to the power −3, while on the other end, we arrive at THCF with touching cladding elements when
d/
D is at its maximum where the loss scales with
D to the power −4.5. An interesting question is then how this scaling changes between the two limiting cases. Knowing that the confinement loss of a six-element THCF remains relatively flat and low when 0.5 <
d/
D < 0.8 [
27,
28], understanding how the loss scales with the core size in this range is of particular interest.
Figure 5 presents our comprehensive encounter of the core size investigation. We calculate
in THCF as a function of
G. Other structural parameters that influence the guidance are varied one-by-one independently to give a clear overview of how the guidance changes with the core size under different conditions. First, we consider the case where
N and
d/
D are fixed at 6 and 0.65, respectively, and calculate the loss as a function of
G for five different values of
F, i.e.,
F = 0.4, 0.5, 0.6, and 0.8 in the first transmission band and 1.5 in the second transmission band. The results are plotted in
Figure 5a. It shows that for all
F considered, the loss reduces with increase in
G at almost the same rate. By fitting the data numerically using least squares method, we work out that
is proportional to
G−5.4. This translates to the confinement loss being proportional to
via Equation (4). Similarly, the changes in
as a function of
G for THCF with different number of cladding elements, while fixing
F = 0.5, i.e., at the center of the first transmission band, are presented in
Figure 5b. For each
, the cladding tube size that exhibits low loss, as determined in Reference [
15], is used in the calculations. These are
d/
D = 0.79, 0.65, 0.6, 0.5, 0.45 for
N = 5, 6, 7, 8, 9, respectively. We find that the rate of reduction against
does not vary much with change in
N when
d/
D that gives low loss is chosen in each
N. In fact, we obtain the same loss decay rate of 5.4 from
Figure 5b. This demonstrates that the dielectric wall thickness and number of cladding elements do not have significant impact on the rate of reduction in
with increase in the core size.
On the contrary, it turns out that the size of the cladding tubes has a major impact.
Figure 5c shows the change in
against
G for different sizes of the cladding tubes, while
F and
N are set at 0.5 and 6. The rate of reduction varies significantly depending on the size of the cladding tubes. This is in accordance with the fact that the two limiting cases of the
d/
D in THCF, i.e.,
d/
D = 0 and
have largely different rates,
G−3 for the former and
G−4.5 for the latter.
Having identified that cladding tube size is the key factor affecting the rate of change of the loss when the core size is varied, we now study in detail how the rate changes against the cladding tube size.
Figure 6 reveals the decay rate,
x, of
on
G versus the standardized cladding size, (
d/
D)′, when
N = 6, 7, 8, and
F = 0.5. Here, the decay rate,
x, means that
is proportional to
G−x, which implies through Equation (4) that
is proportional to
. At each data point in
Figure 6,
x is numerically calculated by fitting the
versus
G plot using the least squares method in the range 20 <
G < 40. Moreover, since the possible range of
d/
D in THCF depends on
N, i.e., from 0 to
, we introduce a new parameter (
d/
D)′ to standardize the cladding size for all
N for easy comparison. This is defined as:
The lines have remarkably similar shapes for all
N. The decay rate does not vary monotonically with
d/
D. They all start at 3 when (
d/
D)′ = 0, and rise to values between 4 and 4.5 when (
d/
D)′ is around 0.15–0.2. Upon further increase in (
d/
D)′, they quickly dip and remain at around 3 in the range 0.2 < (
d/
D)′ < 0.4. Beyond 0.4, the rates rise and plateau in between 5 and 5.5. This is the range most relevant as majority of THCFs have (
d/
D)′ of 0.6–0.9 [
15]. They decrease rapidly near the maximum (
d/
D)′ of 1, arriving at 4.5. We believe this non-monotonic variation of
x is mainly due to the presence or lack thereof airy modes in the space in-between the cladding tubes depending on (
d/
D)′, as well as the influence of the large bulk of dielectric material in the outer jacket tube that grows as (
d/
D)′ decreases. One striking observation in
Figure 6 is that the largest decay rate in each
N coincides with (
d/
D)′ that gives the lowest loss. These are indicated with the crosses in
Figure 6. In other words, the confinement loss in the best performing THCF has the strongest dependence on the core size.
From the results presented so far, it is made clear that the dielectric wall thickness must scale proportionately with the wavelength such that
F ≈ 0.5 is maintained even in the mid-IR region. Moreover, the core size must be sufficiently large and carefully chosen since the confinement loss increases proportionally to approximately
in low-loss THCFs. However, there is another important design aspect which we have not brought up in this work, i.e., the index of the dielectric material. This also needs to be carefully considered for realizing low-loss mid-IR guidance in AR-HCFs. One interesting aspect in this regard is that the refractive index of silica can drop below 1 in mid-IR at around 7.3 μm [
29]. While we can imagine that this may lead to a unique situation where the hollow-core fiber exhibits index guidance, its performance will be severely restricted by the high material absorption in this spectral region [
9,
11,
29]. Therefore, other compound-glass materials that are transparent in this range, such as chalcogenide glass, should be considered as the waveguide material for guidance at around 8 μm wavelength.


