Article

Optimization of AlSi10MgMn Alloy Heat Treatment Process Based on Orthogonal Test and Grey Relational Analysis

School of Mechanical Engineering, Nantong University, Nantong 226019, China
*
Author to whom correspondence should be addressed.
Crystals 2021, 11(4), 385; https://doi.org/10.3390/cryst11040385
Submission received: 12 March 2021 / Revised: 5 April 2021 / Accepted: 6 April 2021 / Published: 7 April 2021
(This article belongs to the Section Hybrid and Composite Crystalline Materials)

Abstract

:
By applying the orthogonal test, the T6 heat treatment test of the casting AlSi10MgMn alloy was carried out. Hardness, tensile strength, and elongation were selected as indicators for evaluating the toughness of alloy. Grey relational analysis was used to comprehensively evaluate the toughness of the alloy. Based on multiple linear regression, prediction models of hardness, tensile strength, elongation, and grey correlation were established. Through planning and solving, the optimal T6 heat treatment process parameters were obtained. According to the results of the metallographic structure analysis and the fracture SEM on the alloy after the T6 heat treatment, aging time, solution time, and solution temperature were identified as the most important factors affecting alloy hardness, tensile strength, and elongation, respectively. Through the application of grey relational analysis, the optimal T6 heat treatment process of an AlSi10MgMn alloy was obtained, namely 530 °C/1 h + 190 °C/6 h. Based on the solving of the prediction models, the optimal T6 heat treatment process and solution temperature of AlSi10MgMn alloy were obtained, namely 530 °C/3 h + 190 °C/8 h. Under these conditions, the hardness of the alloy was 96.9 HV, the tensile strength was 344.6 MPa, and the elongation was 6.1%. In contrast, the toughness of the alloy was better than that obtained by grey relational analysis. The T6 heat treatment refined the microstructure of the alloy, which resulted in a significant increase in fracture dimples.

1. Introduction

The AlSi10MgMn alloy is an alloy belonging to the Al-Si-Mg series. It is characterized by high specific strength, great plasticity, and excellent electrical and thermal conductivity. Thereby, it is widely used in products with thin walls, complex structures, and high loads [1,2]. According to relevant studies, appropriate heat treatment can effectively improve the toughness of Al-Si-Mg alloys [3,4].
In the early stages, researchers developed an AlSi10MgMn alloy with relatively good casting properties and mechanical properties [5,6,7]. However, no in-depth research has been conducted on the heat treatment process. Heat treatment may improve the microstructure of the alloy and reduce or even eliminate the inner stress, which is an important way to further improve the toughness of alloy [8,9].
T6 is a kind of heat treatment process for wrought aluminum alloy [10]; that is, the solution heat treatment is performed on the aluminum alloy first, and then the artificial aging is performed [11]. The artificial aging refers to the process of heating the alloy after solution treatment to an appropriate temperature above room temperature and maintaining it for a certain period of time to change the properties of the alloy. The main parameters that affect the properties of the alloy after T6 heat treatment include solution temperature, solution time, aging temperature, and aging time [12]. The T6 heat treatment can improve the mechanical properties and corrosion resistance of aluminum alloy [13].
In this paper, we explore the optimal T6 heat treatment process of AlSi10MgMn alloy through the application of metallographic structure analysis and fracture SEM and the design of an orthogonal test. With hardness, tensile strength, and elongation used as the evaluation indicators of alloy toughness, grey relational analysis is used to comprehensively evaluate the alloy toughness to establish the alloy toughness prediction model and obtain the optimal T6 heat treatment process parameters.

2. Test Materials and Methods

The test material was an Al-10Si-0.4Mg-0.35Mn-0.7Ni-0.1Sr alloy, which was melted by high-purity aluminum (99.99%), Al-10Mg, Al-20Si, Al-20Mn, Al-10Ni, and Al-10Sr intermediate alloys. The melting temperature was 750–800 °C. Then, the melt was poured into the metal mold at 750 °C. The inner diameter of the metal mold was Φ55 mm, the outer diameter was 135 mm, and the height was Φ250 mm. The pouring height was 50 mm from the upper end surface. It should be noted that the metal mold was preheated to 250 °C in advance.
After rough grinding, fine grinding, polishing, and Keller reagent (2.5% HNO3 + 1.5% HCl + 1% HF + 95% H2O) etching for 10–20 s, the metallographic microstructure was observed using an inverted metallographic microscope (DM2000X type, produced by Zhengzhou Zhuotai Testing Equipment Co., Ltd., Zhengzhou, China). The fracture appearance of the alloy was observed using a scanning electron microscope (HITACHI S-3400N type, Hitachi Group, Tokyo, Japan).
The alloy hardness test was carried out in accordance with the Chinese national standard GB/T4340.1-2009 Metal Hardness Testing [14]. The ambient-temperature tensile testing was carried out on an electronic tensile testing machine (CMT5504 type, produced by MTS Industrial Systems (China) Co., Ltd., Shenzhen, China) in accordance with the Chinese national standard GB/T 228-2002 Metallic Materials Tensile Testing at Ambient Temperature [15], with the tensile speed of 2 mm/min and the maximum tensile force of 10 KN.
There were 4 factors to be investigated in our experiment: solution temperature, solution time, aging temperature, and aging time, which were denoted as A, B, C, and D, respectively. Three levels were selected for each factor. The factor levels of the orthogonal test are shown in Table 1. The commonly used L9(34) orthonormal factor level table was selected to design the orthogonal test scheme, as shown in Table 2. By testing the hardness, tensile strength, and elongation of the alloy under the test protocol, and then performing the range analysis and variance analysis on them, the optimal T6 heat treatment process parameters were obtained.

3. Experiment Results and Analysis

3.1. Range Analysis of Orthogonal Test Results

The process of the orthogonal experiment was divided into nine groups. For each group, we tested three indexes: hardness (HV), tensile strength (Rm), and elongation (δ). Each index was tested three times, and the average value was calculated as the final test results. The results of the orthogonal test are shown in Table 3. It can be seen from Table 3 that the elongation of the alloy had a large scatter. This is because the surface of liquid aluminum was easily oxidized during melting, transfer, and casting, which may have entrained the oxide film into the casting. The entrainment of this surface film and the formation of biofilms are the root causes of most casting defects, which lead to a significant decrease in the mechanical properties of aluminum alloy castings, especially the elongation of the alloy [16].
By means of range analysis, the results of orthogonal test were analyzed and calculated, and the results are shown in Table 4. The range R value in range analysis can directly reflect the influence degree of the factors on the testing index. The larger the range R value, the greater the influence of factors on the testing index, which is usually the main influence factor. The smaller the range R value, the smaller the influence of the factor on the testing index, which is usually the secondary influence factor. It can be seen from Table 4 that the primary and secondary order of the impact of the four factors on the three testing indexes were as follows: hardness: aging time > solution temperature > solution time > aging temperature; tensile strength: solution time > solution temperature > aging temperature > aging time; elongation: solution temperature > aging time > solution time > aging temperature.
Based on the analysis results in Table 4, the impact trend graph between the testing index and various factors was drawn, as shown in Figure 1. Through the analysis of the data in Table 4 and Figure 1, it can be concluded as follows:
(1) Hardness
Among all testing indexes, aging time had the greatest impact on the hardness of the AlSi10MgMn alloy. When the aging time was 6 h, the hardness of the AlSi10MgMn alloy was the largest. Solution temperature had a relatively large impact on the hardness of the alloy, second only to aging time. Within the range of the solution temperature, the higher the solution temperature, the greater the hardness of the alloy. The effect of the solution time on the hardness of the alloy was relatively small. Within the value range of the studied solution time, the longer the solution time, the greater the hardness of the alloy. In contrast, the aging temperature had the least effect on the hardness of the alloy. When the aging temperature was 175 °C, the hardness of the alloy was the largest.
When the solution temperature was 530 °C, the solution time was 3 h, the aging temperature was 175 °C, and the aging time was 6 h, the AlSi10MgMn alloy reached the maximum hardness.
(2) Tensile strength
Among all the testing indexes, the solution time had the greatest impact on the tensile strength of the AlSi10MgMn alloy. Within the research solution time range, the longer the solution time, the greater the alloy’s tensile strength. The solution temperature had a relatively large impact on the alloy’s tensile strength, second only to the solution time. Within the range of the solution temperatures, the higher the solution temperature, the greater the alloy’s tensile strength. The effect of the aging temperature on the tensile strength of the alloy was relatively small. When the aging temperature was 190 °C, the alloy reached the maximum tensile strength. In contrast, the aging time had the least effect on the alloy’s tensile strength. Within the researched aging time value range, the longer the aging time, the greater the alloy’s tensile strength.
When the solution temperature was 530 °C, the solution time was 3 h, the aging temperature was 190 °C, and the aging time was 8 h, the AlSi10MgMn alloy reached the maximum tensile strength.
(3) Elongation
Among all the testing indexes, the solution temperature had the greatest influence on the elongation of the AlSi10MgMn alloy. When the solution temperature was 530 °C, the elongation of the alloy was the largest. The influence of aging time on alloy elongation was relatively large, second only to the solution temperature. Within the researched aging time range, the shorter the aging time, the greater the elongation of the alloy. The effect of solution time on the elongation of the alloy was relatively small. Within the researched solution time range, the longer the solution time, the greater the elongation of the alloy. In contrast, the aging temperature had the least effect on the alloy elongation. Within the researched aging temperature range, the higher the aging temperature, the greater the alloy elongation.
When the solution temperature was 530 °C, the solution time was 1 h, the aging temperature was 190 °C, and the aging time was 8 h, the AlSi10MgMn alloy reached the maximum elongation.
We analyzed the underlying mechanisms of the above experimental. We knew that the solution temperature, solution time, aging temperature, and aging time have a great influence on the properties of the alloy. During the solution process, the soluble particles in the cast alloy dissolved into the aluminum matrix to form a supersaturated solution. In the subsequent aging process, it precipitated in the form of a precipitated phase to strengthen the alloy matrix and improved the performance of the alloy. Therefore, the solution treatment should be carried out at a high temperature that is close to the eutectic temperature of the alloy.
Increasing the solution temperature could shorten the time required for the soluble phase to dissolve into the matrix to achieve the maximum solution effect. The solution time should be kept within a certain range, because the alloy inevitably produces defects such as holes during the casting process. If the solution time is too long, in addition to the spheroidization of the silicon phase, the Mg element will be enriched at the interface between the hole and the aluminum matrix [17]. The Mg element reacts with the air in the hole to form MgO nanoparticles, which reduces the Mg element used to form the Mg-Si strengthening phase in the subsequent artificial aging process, resulting in a decline in the ability of the aging strengthening effect. However, too long a solution time will cause excessive coarsening of the Si phase, thereby reducing the elongation of the alloy.
The aging process after the solution causes the alloying elements in the supersaturated solid solution to be precipitated in the form of sedimentary facies. It is generally thought that the precipitation sequence of an Al-Si-Mg alloy is similar to that of an Al-Mg-Si alloy [18]. In industry, the alloy will inevitably be stored at room temperature for a period of time before artificial aging, which is equivalent to the natural aging of the alloy. For alloys that have undergone natural aging, the effect of aging strengthening at the initial stage of artificial aging will be suppressed [19]. Therefore, too short an artificial aging is not conducive to exerting the strengthening effects.
Through comprehensive analysis, it can be understood that the AlSi10MgMn aluminum alloy’s requirements for high strength and toughness are high tensile strength (Rm > 260 MPa) and the highest elongation. Therefore, the optimal T6 heat treatment verification test parameters for an AlSi10MgMn aluminum alloy should be as follows: the solution temperature is 530 °C, the solution time is 1 h, the aging temperature is 190 °C, and the aging time is 8 h. The results of the verification test are shown in Table 5.
According to the results of the T6 heat treatment orthogonal test, we concluded that the AlSi10MgMn aluminum alloy casting can obtain higher tensile strength (Rm = 312 MPa), elongation (δ = 6.5%), and hardness (84.5 HV) after T6 heat treatment, which meets the requirements of AlSi10MgMn aluminum alloy for high strength and toughness.

3.2. Grey Relational Analysis of Orthogonal Test Results

Through the comprehensive evaluation of the test results by grey relational analysis [20,21] and the comprehensive influence of the T6 heat treatment process parameters on the toughness of AlSi10MgMn aluminum alloy, the process plan was selected and the grey correlation mathematical model was established for production applications [22]. Among the test indexes, the greater the hardness (HV), tensile strength (Rm), and elongation (δ), the better the alloy toughness. In the signal-to-noise ratio processing of the three test indexes, the larger the processed result, the higher the alloy toughness.
The signal-to-noise ratio RSN of hardness, tensile strength, and elongation was calculated by the following formula [23]:
R SN = 101 g 1 Y i 2
where Yi represents the value of hardness, tensile strength, or elongation under the ith test.
Due to the different dimensions, grey correlation analysis could not be performed on the calculated results. Therefore, the following formula was used for the dimensional processing of signal-to-noise ratio processed data:
x i j = y i j min j y i j max j y i j min j y i j
where xij represents the dimension value of the jth testing index under the ith test; yij represents the signal-to-noise ratio value of the jth testing index under the ith test.
The grey correlation coefficient ε i j is the core of grey relational analysis, which can be calculated by the following formula [24]:
ε i j = min i min j x i 0 + x i j ξ max i max j x i 0 x i j x i 0 x i j + ξ max i max j x i 0 x i j
where the reference number x i 0 generally takes the optimal value. In our experiment, x i 0 = 1 . The resolution coefficient ξ could be calculated by the following formula:
α = 1 m k j = 1 k i = 1 m x i 0 x i j
where m is the number of testing groups; k is the number of testing index; α is the mean value of the difference between all reference numbers x i 0 and dimension value x i j .
According to the calculation, α = 0.44. Since 2 ≤ 1/α = 2.27 ≤ 2, ζ = 2α = 0.88.
The correlation degree can be calculated using the following formula:
γ i = 1 k j = 1 k ε i j
where γ i is the value of grey correlation calculated from the test results of the ith test.
The specific results are shown in Table 6.
According to the ranking obtained by the value of grey correlation [25,26], we found that when the solution temperature is 530 °C, the solution time is 1 h, the aging temperature is 190 °C, and the aging time is 6 h, the toughness of the alloy is optimal.

3.3. Alloy Toughness Prediction Model

In order to explore the optimal T6 heat treatment process, the alloy needed to reach the maximum toughness, the alloy hardness, tensile strength, and elongation needed to reach maximum values. The grey relational analysis refers to the selection of the optimal process parameters from the existing test data [27]. In order to select the parameters of the T6 heat treatment process in the entire range, prediction models based on multiple linear regression of hardness, tensile strength, and elongation were established. x1 was defined as the solution temperature, x2 as the solution time, x3 as the aging temperature, and x4 as the aging time. The following prediction model was obtained:
HV = −119.661 + 0.423333x1+ 2.833333x2 − 0.00889x3 − 1.825x4
Rm = −830.083 + 1.841667x1 + 24.333x2 + 0.522222x3 + 3.291667x4
δ = −0.36667 + 0.005x1 − 0.35x2 + 0.015556x3 + 0.233333x4
γi = −3.705 + 0.0075x1 + 0.06x2 + 0.002x3 + 0.0075x4
In the prediction model significance test, the four prediction models all passed the significance test on the 95% confidence interval, which indicated that the model was accurate and reliable.
Equation (9) was solved by planning, where the solution temperature was 510–530 °C, the solution time was 1–3 h, the aging temperature was 160–190 °C, and the aging time was 4–8 h. By calculation, it can be obtained that when the solution temperature is 530 °C, the solution time is 3 h, the aging temperature is 190 °C, and the aging time is 8 h, Equation (9) can reach the maximum value. At this time, γi = 0.89, which is greater than the maximum value of grey correlation in Table 6.
By substituting the solution temperature at 530 °C, the solution time at 3 h, the aging temperature at 190 °C, and the aging time at 8 h into Equations (6)–(8), it can be obtained that HV = 96.9, Rm = 344.6 MPa, and δ = 6.1. Compared with the results of the seventh test, the tensile strength was significantly increased by about 15.63%, while the hardness and elongation were slightly decreased by 2.22% and 3.17%, respectively. It was concluded that the prediction model can obtain better T6 heat treatment process parameters.

4. Metallographic Structure Analysis

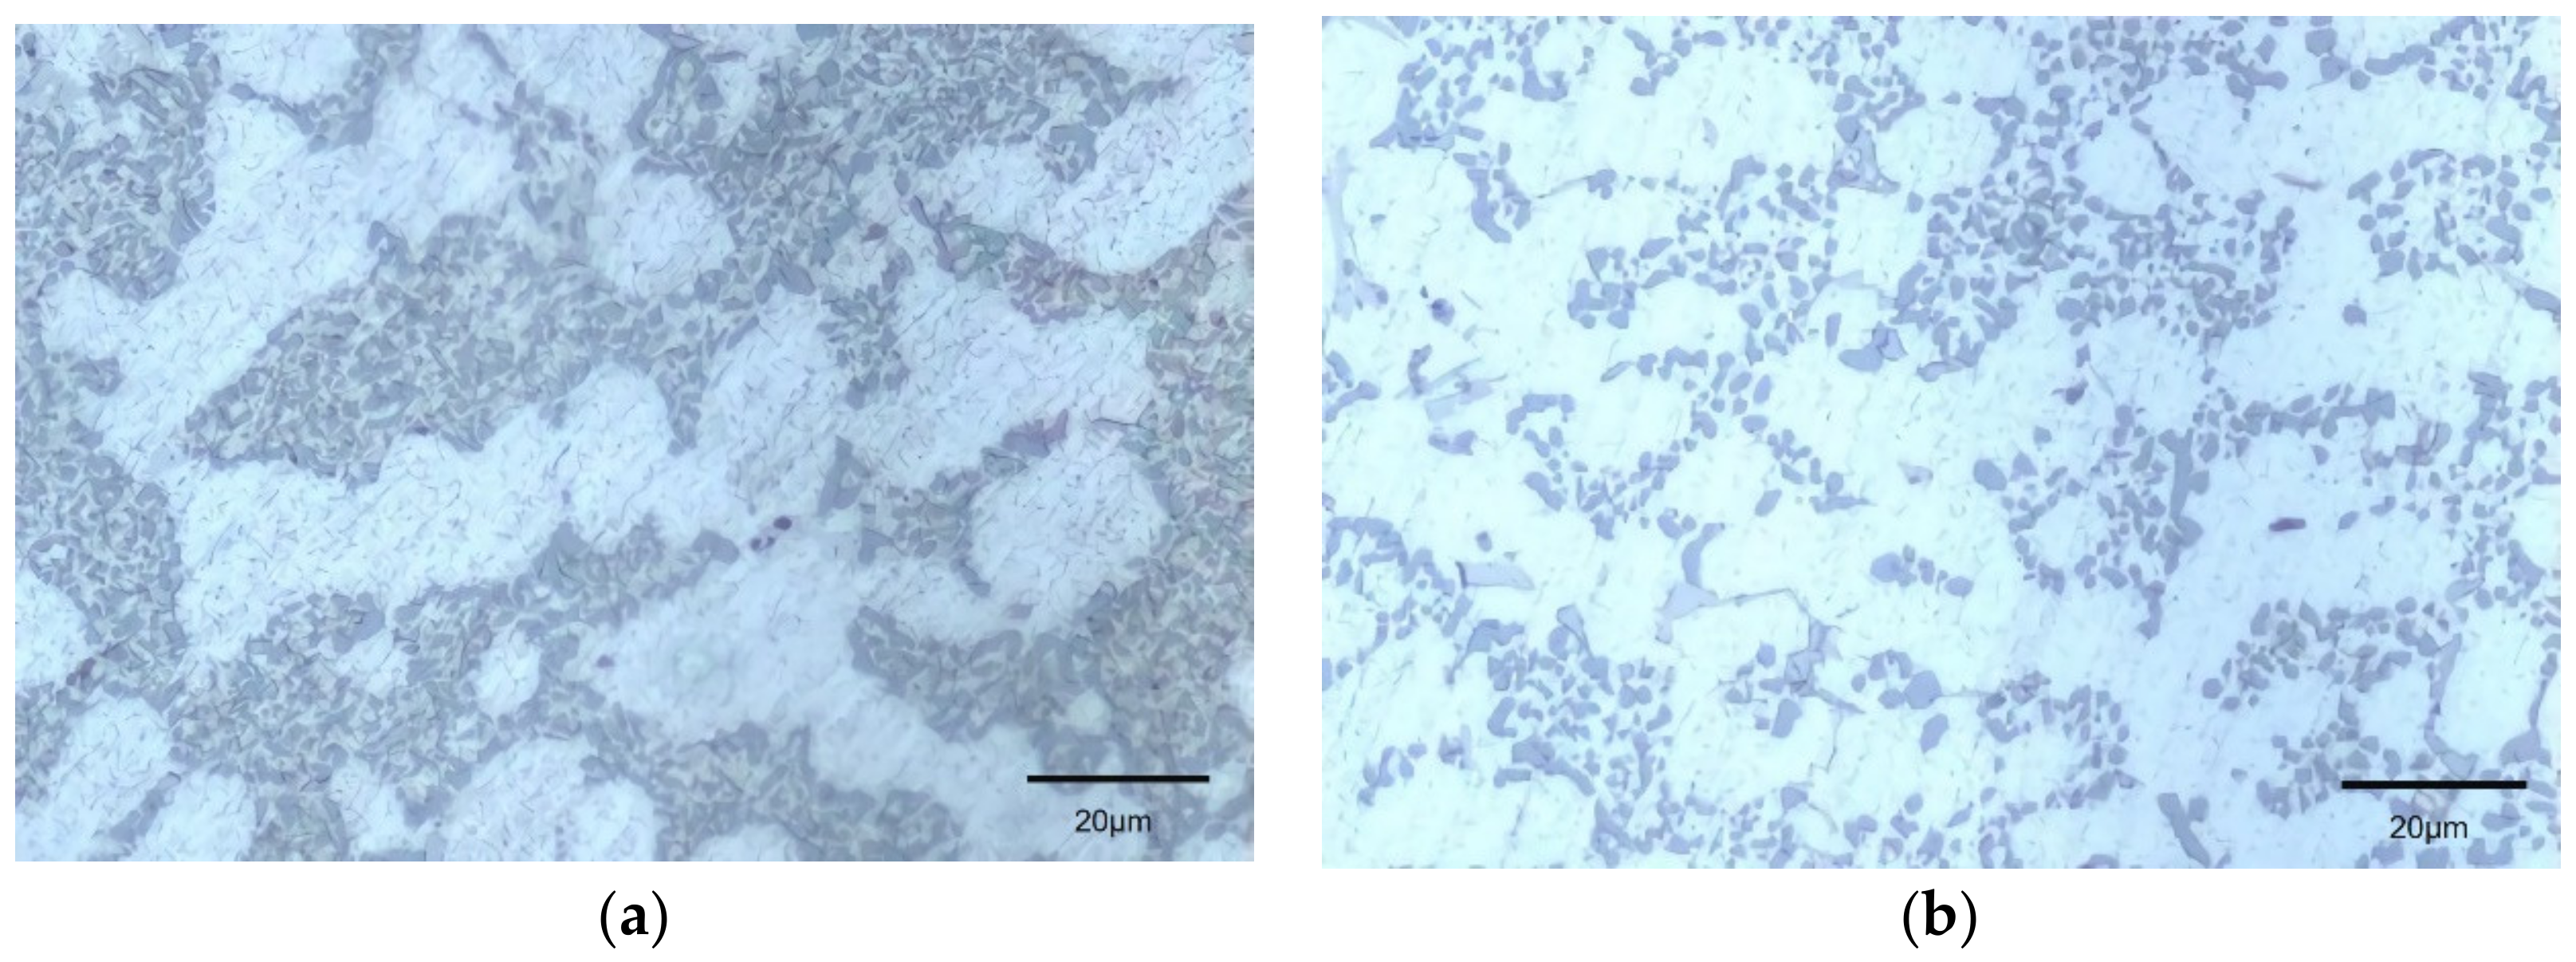
Figure 2 shows the metallurgical microstructure of AlSi10MgMn alloy in cast state and the T6 heat-treated state. The location of the micrographs is on the end face of the specimen. It can be seen from Figure 2 that the microstructure of the alloy changed significantly after the T6 heat treatment. In Figure 2, the light-etching phase is the α-Al matrix, and the dark-etching phase is the silicon phase. According to Figure 2, it can be understood that the α-Al matrix of an AlSi10MgMn alloy in the cast state was relatively coarse and unevenly distributed, while the silicon phase was mainly in the shape of flakes, dendrites and needles. After the heat treatment, the flake, dendritic, and needle-shaped eutectic silicon and the bulky primary silicon phase began to change. Compared with as-cast alloy, the dendritic and needle-shaped eutectic silicon phase in the metallurgical microstructure of the alloy in the heat-treated state basically disappeared. Due to the high-temperature solution treatment, most of the eutectic silicon phase experienced the process of necking, fusing, granulation and spheroidization. The eutectic silicon phase became a dark-etching phase, and the edges and corners of the large primary silicon phase were rounded [28,29]. As can be seen from Figure 2, the heat treatment process will affect the uniform distribution of black eutectic silicon particles.

5. Tensile Fracture SEM Scanning Analysis

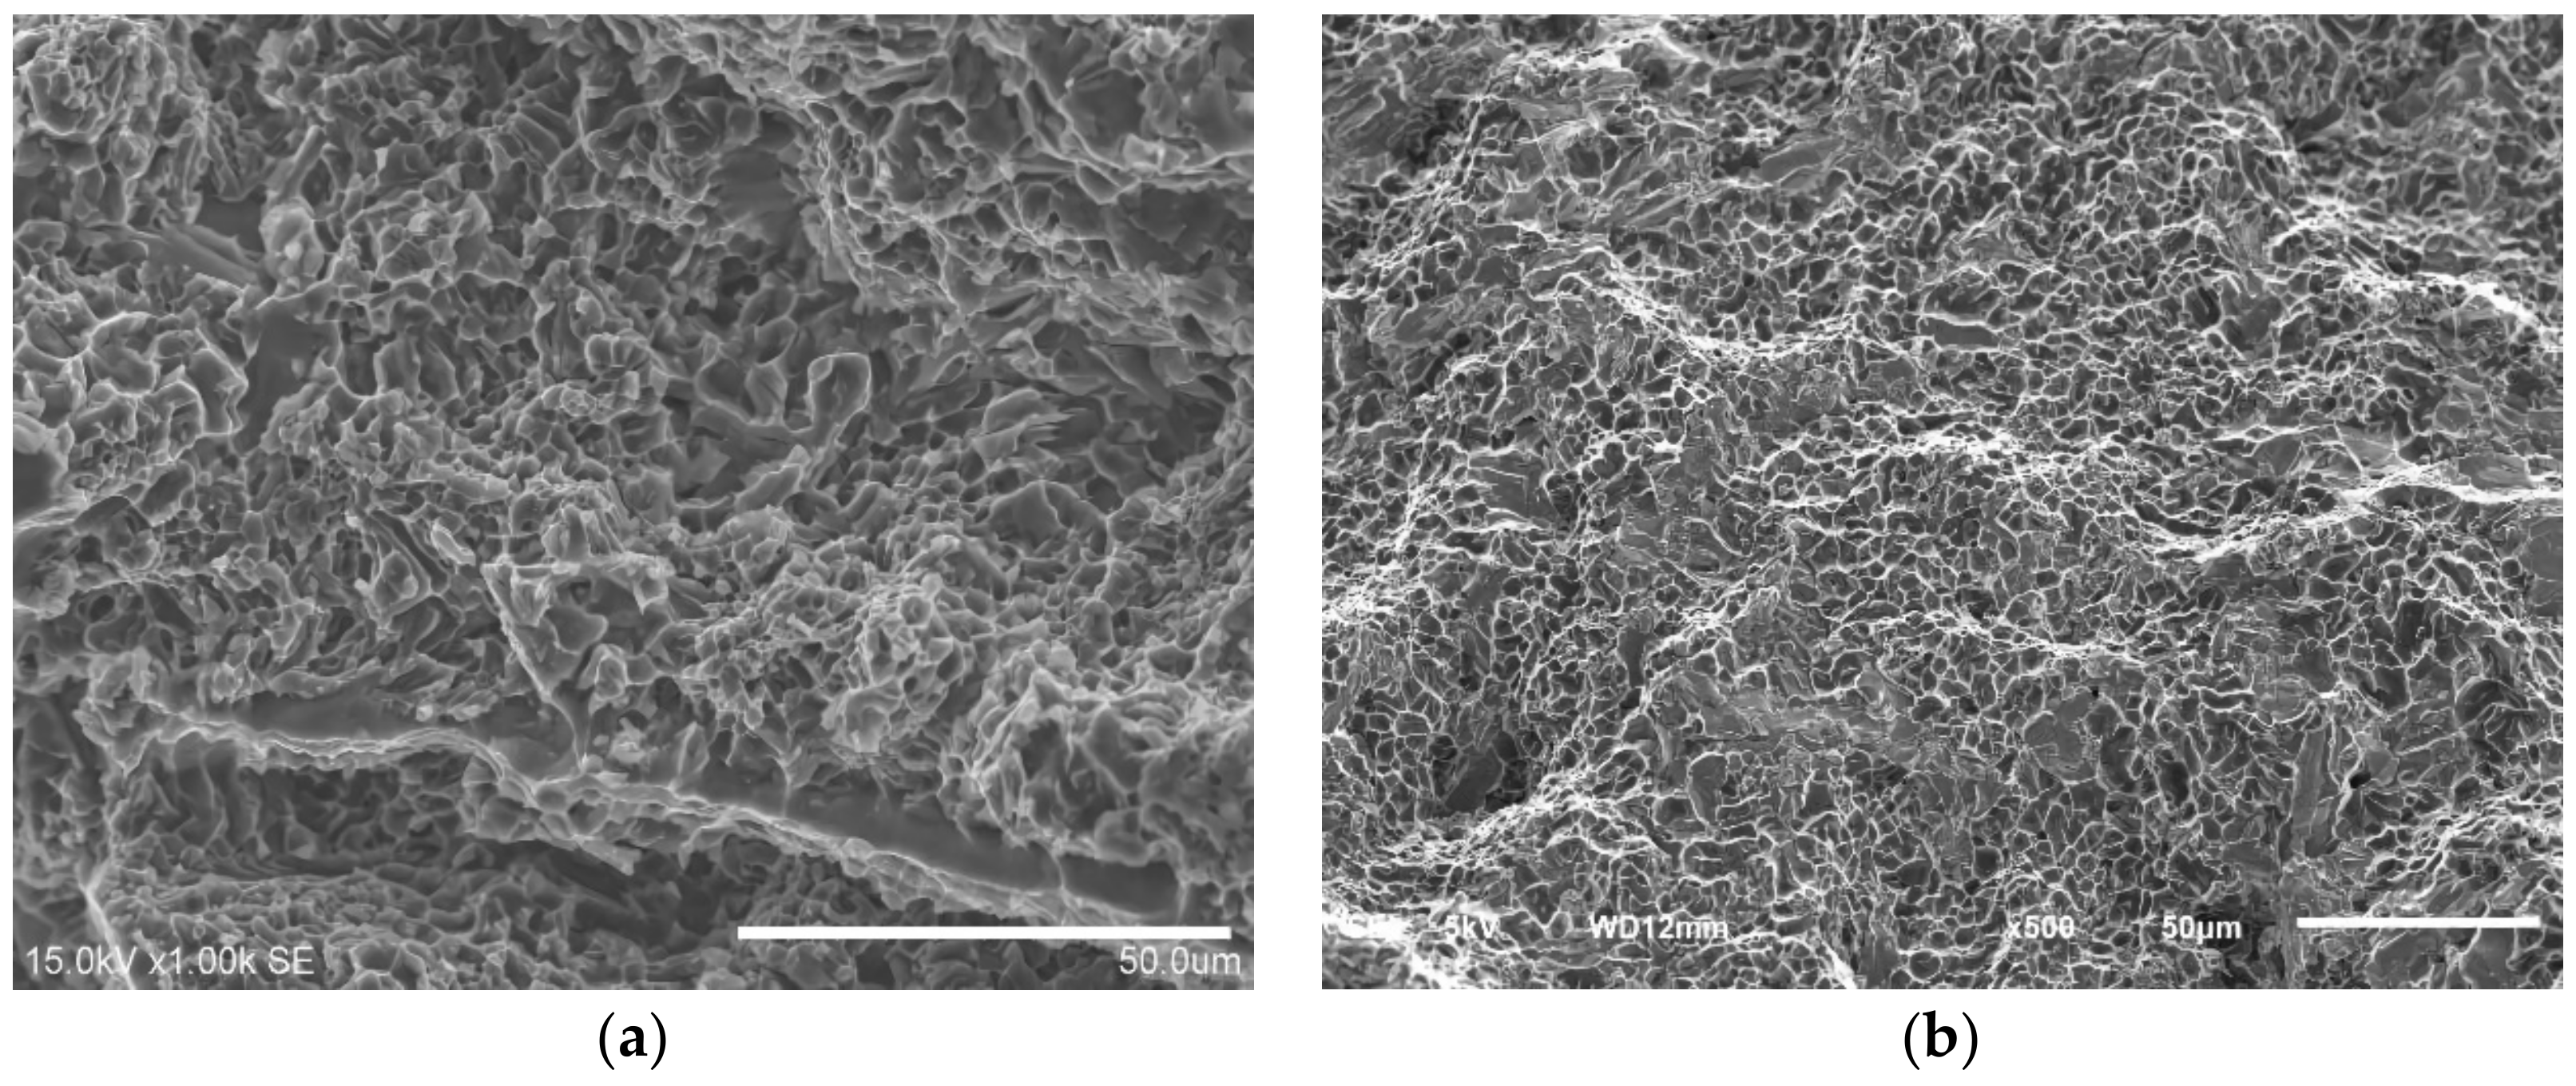
Figure 3 shows the tensile fracture SEM of the AlSi10MgMn alloy in the cast state and the T6 heat-treated state. The micrographs were taken from the central area of the fracture of the specimen. In the cast state, the fracture had many large cleavage planes and tearing edges, few dimples and uneven distribution, and the alloy fracture showed the appearance of a cleavage fracture [30]. This was because there were many needle-shaped and blocky silicon phases in the as-cast alloy. These silicon phases are brittle phases, which are difficult to coordinate with the α-Al matrix by external forces and then deform. Therefore, cracks propagate along the silicon phase on the micro level. On the macro level, it is characterized by cleavage fracture. Therefore, the mechanical properties of the as-cast alloy were relatively poor. Compared with the cast state, the fracture appearance of AlSi10MgMn alloy after the T6 heat treatment underwent great changes. It can be clearly seen from Figure 3 that in the fracture appearance under the heat-treated state, the teaching edge and cleavage platform significantly reduced, and many small and deep dimples evenly distributed on the fracture surface. These morphological characteristics indicate that the mechanical properties of the as-cast alloy after T6 heat treatment were improved.

6. Conclusions

(1)
According to the range analysis of the orthogonal test, it can be seen intuitively that the aging time and the solution temperature are the first and second main factors affecting the alloy’s hardness. The solution time and the solution temperature are the first and second main factors affecting the alloy tensile strength. The solution temperature and the aging time are the first and second main factors affecting the alloy elongation.
(2)
Through grey relational analysis, the optimal process parameters can be effectively selected from the existing test data. Furthermore, the optimal T6 heat treatment process of the AlSi10MgMn alloy was obtained as follows: the solution temperature is 530 °C, the solution time is 1 h, the aging temperature is 190 °C, and the aging time is 6 h.
(3)
Through the planning and solving of the prediction model, the T6 heat treatment process parameter selection was carried out in the whole range. The final optimal T6 heat treatment process of the AlSi10MgMn alloy was as follows: solution temperature is 530 °C, solution time is 3 h, aging temperature is 190 °C, and aging time is 8 h. At this point, the alloy hardness is 96.9 HV, the tensile strength is 344.6 MPa, and the elongation is 6.1%. By contrast, the toughness of the alloy is better than the toughness of the alloy obtained based on the grey relational analysis.
(4)
After T6 heat treatment, the microstructure of AlSi10MgMn alloy is refined. Needle-shaped and blocky silicon phases become dark-etching phase evenly distributed in the alloy. The tearing edge and cleavage platform in the alloy’s fracture are reduced, while the small and deep dimples are significantly increased. The mechanical properties of the alloy are improved.

Author Contributions

Conceptualization, F.Z. and Y.Z.; methodology, H.N.; validation, J.Z. and K.C.; formal analysis, F.Z. and X.W. (Xingxing Wang); resources, F.Z. and H.N.; writing-original draft, J.Z.; writing-review and editing, F.Z. and X.W. (Xiaofeng Wan); visualization, J.Z.; supervision, F.Z. All authors have read and agreed to the published version of the manuscript.

Funding

This research was supported by A Priority Academic Program Development of Jiangsu Higher Education Institutions (PAPD); Engineering Research Center for Harmless Treatment and Resource Utilization of Aluminum Ash and Slag Solid Waste in Jiangsu Province; Nantong Applied Research Project, grant number JC2018115 and JC2019129; Ministry of Education’s Cooperative Education Project, grant number 201901189019.

Institutional Review Board Statement

Not applicable.

Informed Consent Statement

Not applicable.

Data Availability Statement

Not applicable.

Acknowledgments

Sincere thanks to the anonymous reviewers for their valuable comments and great suggestions that helped to improve this article.

Conflicts of Interest

The authors declare no conflict of interest.

References

  1. Lin, Y.C.; Luo, S.C.; Huang, J.; Yin, L.K.; Jiang, X.Y. Effects of solution treatment on microstructures and micro-hardness of a Sr-modified Al-Si-Mg alloy. Mater. Sci. Eng. A 2018, 725, 530–540. [Google Scholar] [CrossRef]
  2. Beroual, S.; Boumerzoug, Z.; Paillard, P.; Borjon-Pironb, Y. Effects of heat treatment and addition of small amounts of Cu and Mg on the microstructure and mechanical properties of Al-Si-Cu and Al-Si-Mg cast alloys. J. Alloys Compd. 2019, 784, 1026–1035. [Google Scholar] [CrossRef]
  3. Lin, Y.C.; Luo, S.C.; Yin, L.X.; Huang, J. Microstructural evolution and high temperature flow behaviors of a homogenized Sr-modified Al-Si-Mg alloy. J. Alloys Compd. 2018, 739, 590–599. [Google Scholar] [CrossRef]
  4. Ibrahim, A.I.; Elgallad, E.M.; Samuel, A.M.; Doty, H.W.; Samuel, F.H. Effects of Addition of Transition Metals on Intermetallic Precipitation in Al–2%Cu–1%Si-Based Alloys. Inter. Metalcast. 2018, 12, 574–588. [Google Scholar] [CrossRef]
  5. Žihalová, M.; Marek, M. Change in the Microstructure of AlSi10MgMn Alloy with Higher Iron Content Due to an Increase in the Amount of Nickel. Tehnički Vjesnik 2021, 28, 34–37. [Google Scholar]
  6. Shuaishuai, L.; Jiaqiao, Z.; Hongjun, N.; Xingxing, W.; Yu, Z.; Tao, G. Study on Preparation of Aluminum Ash Coating Based on Plasma Spray. Appl. Sci. 2019, 9, 4980. [Google Scholar]
  7. Žihalová, M.; Bolibruchová, D. Influence of iron in AlSi10MgMn alloy. Arch. Foundry Eng. 2014, 14, 109–112. [Google Scholar] [CrossRef] [Green Version]
  8. Kumar, P.; Upadrasta, R. Microstructural optimization through heat treatment for enhancing the fracture toughness and fatigue crack growth resistance of selective laser melted Ti6Al4V alloy. Acta Mater. 2019, 169, 45–59. [Google Scholar] [CrossRef]
  9. Yang, K.V.; Rometsch, P.; Davies, C.H.J.; Huang, A.; Wu, X. Effect of heat treatment on the microstructure and anisotropy in mechanical properties of A357 alloy produced by selective laser melting. Mater. Des. 2018, 154, 275–290. [Google Scholar] [CrossRef]
  10. Zhu, M.; Jian, Z.; Yang, G.; Zhou, Y. Effects of T6 heat treatment on the microstructure, tensile properties, and fracture behavior of the modified A356 alloys. Mater. Des. 2012, 36, 243–249. [Google Scholar] [CrossRef]
  11. Sharma, S.; Nanda, T.; Pandey, O.P. Investigation of T4 and T6 heat treatment on the wear properties of sillimanite reinforced LM30 aluminium alloy composites. Wear 2019, 426, 27–36. [Google Scholar] [CrossRef]
  12. Mahathaninwong, N.; Plookphol, T.; Wannasin, J.; Wisutmethangoon, S. T6 heat treatment of rheocasting 7075 Al alloy. Mater. Sci. Eng. A 2012, 532, 91–99. [Google Scholar] [CrossRef]
  13. Mohamed, A.M.A.; Samuel, F.H. A review on the heat treatment of Al-Si-Cu/Mg casting alloys. In Heat Treatment-Conventional and Novel Applications; InTec: Rijeka, Croatia, 2012; pp. 55–72. [Google Scholar]
  14. China National Standardization Management Committee. GB/T4340.1-2009. Metal Hardness Testing; China National Standardization Management Committee: Beijing, China, 2010. (In Chinese) [Google Scholar]
  15. China National Standardization Management Committee. GB/T 228-2002. Metallic Materials Tensile Testing at Ambient Temperature; China National Standardization Management Committee: Beijing, China, 2006. (In Chinese) [Google Scholar]
  16. Gopalan, R.; Prabhu, N.K. Oxide bifilms in aluminium alloy castings—A review. Mater. Sci. Technol. 2011, 27, 1757–1769. [Google Scholar] [CrossRef]
  17. Kertész, L.; Kojnok, J.; Szász, A. The determination of Mg surface enrichment in heat treated AlMgSi alloys using the sxes method. Acta Phys. Acad. Sci. Hung. 1980, 49, 169–174. [Google Scholar] [CrossRef] [Green Version]
  18. Rinderer, B.; Couper, M.; Xiong, X.Y.; Gao, S.X.; Nie, J.F. Precipitation Sequence in an Al-Si-Mg Foundry Alloy. Mater. Sci. Forum 2010, 654, 590–595. [Google Scholar] [CrossRef]
  19. Sha, G.; Möller, H.; Stumpf, W.E.; Xia, J.H.; Govender, G.; Ringer, S.P. Solute nanostructures and their strengthening effects in Al–7Si–0.6 Mg alloy F357. Acta Mater. 2012, 60, 692–701. [Google Scholar] [CrossRef] [Green Version]
  20. Wang, Z.; Zhang, T.; Yu, T.; Zhao, J. Assessment and optimization of grinding process on AISI 1045 steel in terms of green manufacturing using orthogonal experimental design and grey relational analysis. J. Clean. Prod. 2020, 253, 119896. [Google Scholar] [CrossRef]
  21. Lian, G.; Zhang, H.; Zhang, Y.; Tanaka, M.L.; Chen, C.; Jiang, J. Optimizing Processing Parameters for Multi-Track Laser Cladding Utilizing Multi-Response Grey Relational Analysis. Coatings 2019, 9, 356. [Google Scholar] [CrossRef] [Green Version]
  22. Agboola, O.O.; Ikubanni, P.P.; Adeleke, A.A.; Adediran, A.A.; Adesina, O.S.; Aliyu, S.J.; Olabamiji, T.S. Optimization of heat treatment parameters of medium carbon steel quenched in different media using Taguchi method and grey relational analysis. Heliyon 2020, 6, e04444. [Google Scholar] [CrossRef]
  23. Ilmaya, R.M.; Pranowo, S.; Rachman, F. Optimasi Kekerasan Baja S45C pada Proses Hardening Helical Gear Menggunakan Metode Taguchi. In Proceedings of the Conference on Design Manufacture Engineering and Its Application; 2018; Volume 2, pp. 159–164. Available online: https://core.ac.uk/download/pdf/236670678.pdf (accessed on 1 December 2018).
  24. Satolo, E.G.; Leite, C.; Calado, R.D.; Goes, D.A.; Salgado, D.D. Ranking lean tools for world class reach through grey relational analysis. Grey Syst. Theory Appl. 2018, 8, 399–423. [Google Scholar] [CrossRef] [Green Version]
  25. Hu, Y.; Wu, L.; Shi, C.; Wang, Y.; Zhu, F. Research on optimal decision-making of cloud manufacturing service provider based on grey correlation analysis and TOPSIS. Int. J. Prod. Res. 2020, 58, 748–757. [Google Scholar] [CrossRef]
  26. Wang, X.; Yang, C.; Yong, G.; Feng, D. The influence of shrinkage-reducing agent solution properties on shrinkage of cementitious composite using grey correlation analysis. Constr. Build. Mater. 2020, 264, 120194. [Google Scholar]
  27. Das, M.K.; Kumar, K.; Barman, T.K.; Sahoo, P. Optimization of process parameters in plasma arc cutting of EN 31 steel based on MRR and multiple roughness characteristics using grey relational analysis. Procedia Mater. Sci. 2014, 5, 1550–1559. [Google Scholar] [CrossRef] [Green Version]
  28. Borko, K.; Eva, T.; Mária, C. The Impact of Sr content on Fe-intermetallic phases morphology changes in alloy AlSi10MgMn. Manuf. Technol. 2016, 16, 20–26. [Google Scholar]
  29. Ni, H.; Zhang, J.; Lv, S.; Wang, X.; Zhu, Y.; Gu, T. Preparation and Performance Optimization of Original Aluminum Ash Coating Based on Plasma Spraying. Coatings 2019, 9, 770. [Google Scholar] [CrossRef] [Green Version]
  30. Tillová, E.; Chalupová, M.; Borko, K.; Kuchariková, L. Changes of fracture surface in recycled A356 cast alloy. Mater. Today 2016, 3, 1183–1188. [Google Scholar] [CrossRef]
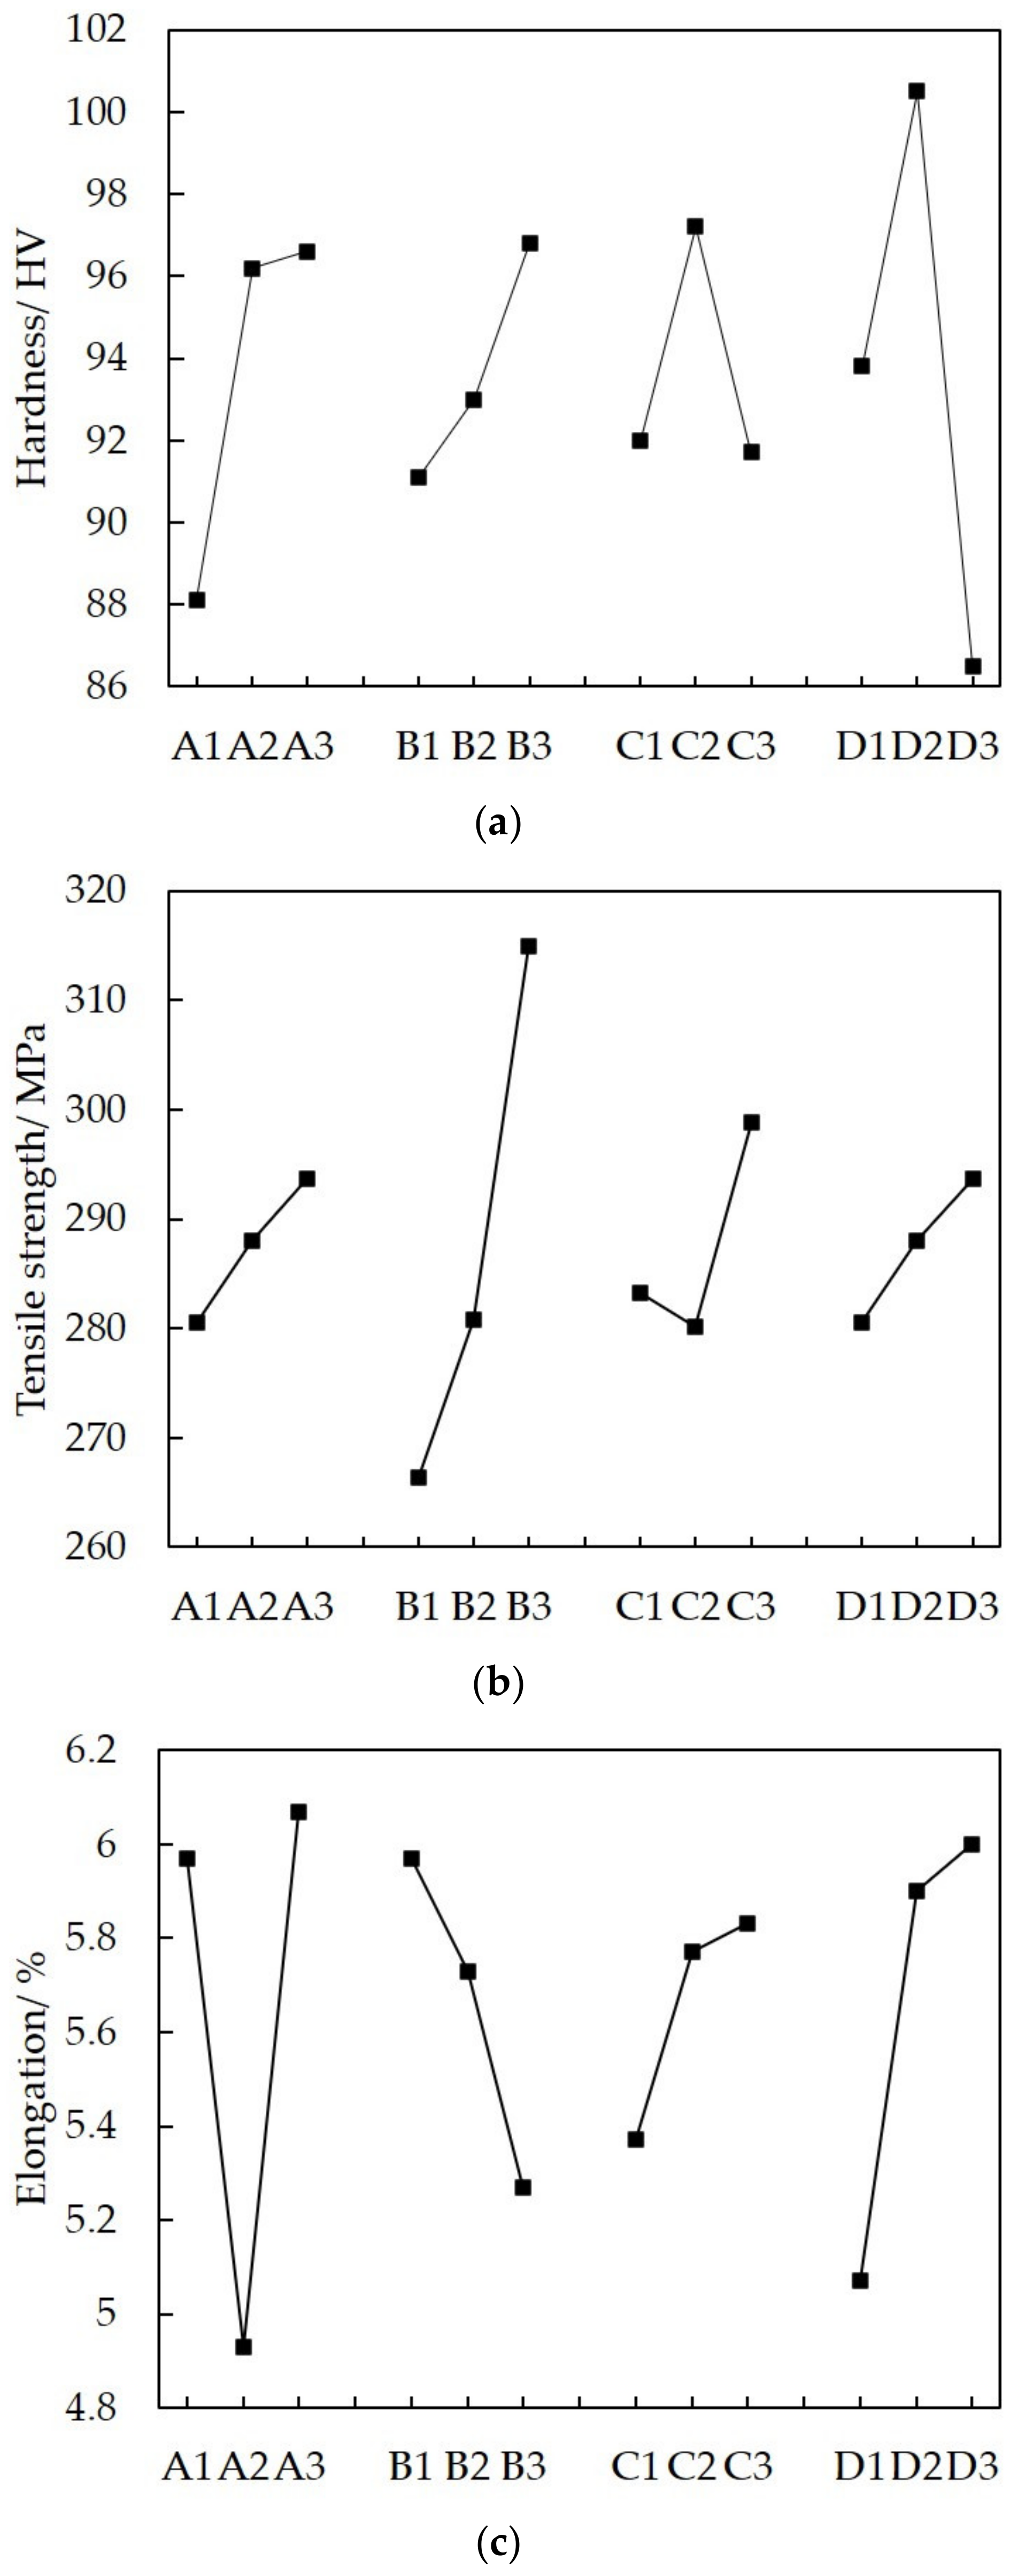
Figure 1. Trend diagram of the impact between the testing indexes and various factors: (a) hardness; (b) tensile strength; (c) elongation.
Crystals 11 00385 g001
Figure 2. Metallurgical microstructure of AlSi10MgMn alloy in (a) cast state; (b) T6 heat-treated state.
Crystals 11 00385 g002
Figure 3. Tensile fracture SEM scanning image of an AlSi10MgMn alloy in the (a) cast state; (b) T6 heat-treated state.
Crystals 11 00385 g003
Table 1. Factor levels of the orthogonal test.
LevelSolution
Temperature (°C)
Solution Time (h)Aging
Temperature (°C)
Aging Time (h)
ABCD
151011604
252021756
353031908
Table 2. Scheme and results of the orthogonal test (L9(34)).
NumberSolution
Temperature (°C)
Solution Time (h)Aging
Temperature (°C)
Aging Time (h)
ABCD
151011604
251021756
351031908
452011758
552021904
652031606
753011906
853021608
953031754
Table 3. Results of the orthogonal test.
NumberHardness (HV)Tensile Strength (MPa)Elongation (%)
184.22385.4
297.92576.4
382.3315.56.1
490.12635.7
593.82834.6
6104.63094.5
799.12986.3
887.2302.56.2
9103.5320.55.2
Table 4. Range analysis of the orthogonal test results.
Testing indexRangeSolution
Temperature
(°C)
Solution Time
(h)
Aging
Temperature
(°C)
Aging Time
(h)
ABCD
Hardness (HV)k188.191.19293.8
k296.293.097.2100.5
k396.696.891.786.5
Range R8.55.75.214
Impact FactorAging time > Solution temperature > Solution time > Aging temperature
Optimal
Composition
530 °C/3 h + 175 °C/6 h
Tensile Strength (MPa)k1270.2266.3283.2280.5
k2285280.8280.2288
k3307315298.8293.7
Range R37.248.715.613.2
Impact FactorSolution time > Solution temperature > Aging temperature > Aging time
Optimal
Composition
530 °C/3 h + 190 °C/8 h
Elongation (%)k15.975.975.375.07
k24.935.735.775.9
k36.075.275.836
Range R1.140.750.460.93
Impact FactorSolution temperature > Aging time > Solution time > Aging temperature
Optimal
Composition
530 °C/1 h + 190 °C/8 h
Table 5. Verification test results.
Testing IndexTensile Strength (MPa)Elongation (%)Hardness (HV)
3126.584.5
Table 6. Results of the grey correlation analysis.
NumberSignal-to-Noise Ratio Dimension Value xijCorrelation
Coefficient ε i j
Correlation Degree γiOrder
HVRmδHVRmδHVRmδ
138.5147.5314.650.1000.440.490.470.610.529
239.8248.2016.120.720.260.850.760.540.860.725
338.3249.9815.7100.950.740.470.940.770.734
439.0948.4015.120.380.340.570.590.570.670.617
539.4449.0413.260.550.580.050.660.680.480.617
640.3949.8013.0610.88010.880.470.783
739.9249.4816.650.770.7610.800.7810.861
838.8149.6115.850.240.810.780.540.820.800.725
940.3050.1214.320.9610.350.9510.580.842
Publisher’s Note: MDPI stays neutral with regard to jurisdictional claims in published maps and institutional affiliations.