Abstract
A major problem in the field of adsorbents is that binders (kaolin clay, bentonite) introduced to bind zeolites and ensure the needed mechanical strength, are not able to sorb gases like CO2 and N2, and decrease the overall adsorption capacity. To solve this problem, one of the pathways is to introduce a binder able to sorb such gases. Thus, in this study, the physical and mechanical properties of a novel binder based on metakaolin and its composite with zeolite 4A in the granular form were studied. Metakaolin was used as a precursor for alkali-activated binder, which was synthesized using an 8M NaOH activation solution. Raw materials were characterized using granulometry, X-ray diffraction (XRD), and differential thermal analysis (DTA); and final products were characterized using density measurements, a compressive strength test, XRD, Brunauer–Emmett–Teller (BET) analysis, and scanning electron microscopy (SEM). Alkali-activated metakaolin was found to be efficient as a binding material when data for morphological properties were analyzed. A relationship was observed—by increasing the liquid-to-solid ratio (L/S), compressive strength decreased. Zeolite granule attrition was higher than expected: 2.42% and 4.55% for ZG-0.8, 3.64% and 5.76% for ZG-1.0, and 2.73% and 4.85% for ZG-1.2, measured at 4 and 5 atmospheres, respectively.
1. Introduction
During this last decade, a shift has been seen toward more research dedicated to alkali-activated materials [1,2,3,4,5,6,7,8], because of their applications and properties. One way to utilize these kinds of materials is to use them as binders in a composition with other materials to enhance the overall properties of the composite. Many researchers like Awoyera and Rivera studied how alkali-activated binders could be incorporated with Portland cement [1]. Amrhein, Biel, and Takeda [9,10,11] researched the alkaline activation of kaolinitic clay and fly ash, while Zhang researched the NaOH concentration effect on the overall properties of alkali-activated material [4]. Nevertheless, the sustainability advantage is coupled with its potentially enhanced properties, and due to the limitations of the use of alkali-activated binders (AABs) in terms of their hardened-material properties for commercial and large-scale production, as mentioned in Adesina’s study [12], those issues must be overcome for AAB to be universally accepted and compete with other binders. As AABs are categorized as zeolite-like materials [13], one of their potential uses is to combine them with zeolites to increase the overall adsorption capacity, as well as to ensure the needed mechanical strength.
The formation of zeolites with alkali-activated binders would improve overall mechanical strength, as well as sorption capacity because it is proven that different types of zeolites in certain amounts (such as zeolite Na-A, hydrosodalite, zeolite X, faujasite, and analcime) can be formed as secondary alkali-activation products in the structure of an alkali-activated binder (AAB) [14,15,16,17]. Zeolites have a large surface area, a uniform pore size, and a good physical sorption capacity [18], as they are polysilicate-type aluminum silicate minerals consisting of tetrahedral silicon cations (Si4+) and aluminum cations (Al3+) surrounded by four oxygen anions (O2−). Some of the zeolites must have high mechanical strength for use in pressurized gas vessels as adsorbents, so they are blended with binders, which improves their mechanical properties, but concurrently reduces sorption capacity [19,20]. Gleichmann and Chester reported a comprehensive study characterizing zeolites for adsorbent purposes [2,21]. Thereby, the development of zeolite and alkali-activated binder composites could become a promising direction in the development of modified adsorbents with a wider range of applications than practically used adsorbents.
The aim and novity of this study are to produce granules with commercial zeolite 4A powder with the development of an alkali-activated binder, using metakaolin as a base while finding an optimal granulation method of non-Newtonian fluid consisting of metakaolin and alkali-activated solution. Both granules and binder must have high mechanical compressive strength while exhibiting high crystalline phase intensity of zeolite 4A for the exploitation of granules in pressurized adsorption vessels.
2. Materials and Methods
2.1. Raw Materials
As an aluminum silicate source for the production of AAB, a commercially available kaolin clay from a local distributor SIA “Keramserviss” (Adazi, Latvia) was used. The chemical composition of kaolin is given in Table 1. The kaolin was calcined to obtain metakaolin (MK) in the laboratory using an “Uterna W-80” (Utena, Lithuania) electric furnace. The calcination took place at 850 °C for 2.5 h with heat rate 10 °C/min (up to 100 °C) and 5 °C/min (up to 850 °C). A total of 99% of the kaolin had a particle size lower than 45 μm. DTA thermograms showed phase change of materials at elevated temperatures; for this study, a calcination temperature of 850 °C was based on the thermograms shown in Figure 1 and Figure 2. Figure 1 shows the DTA thermogram of metakaolin, Figure 2 shows the DTA thermogram for zeolite 4A, and Figure 3a shows an SEM micrograph of used metakaolin.

Table 1.
Chemical composition of solid raw materials shown as weight percentage (unit%).
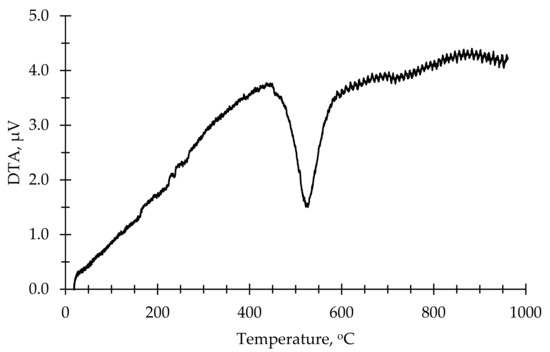
Figure 1.
DTA thermogram of kaolin.
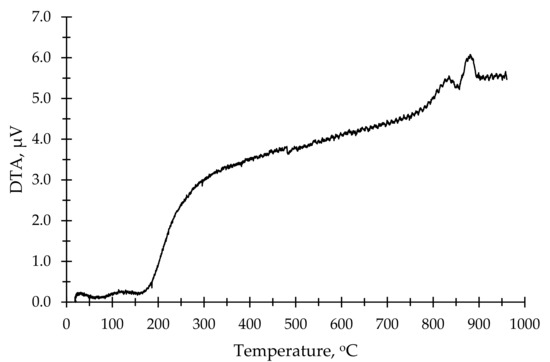
Figure 2.
DTA thermogram of zeolite 4A.
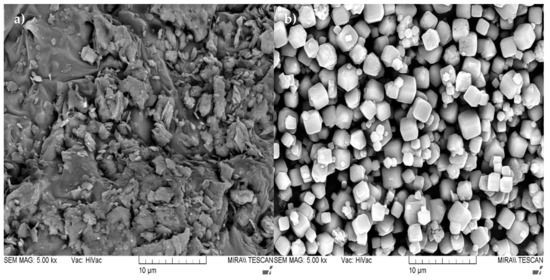
Figure 3.
SEM micrographs presenting the microstructure of the used raw materials at 5000× magnification: (a) MK; (b) Zeolite 4A.
Sodium hydroxide flakes “Tiany Chemicals” (China) with a purity of 99% were used to produce the alkali-activation solution (8M NaOH solution).
Zeolite 4A (China) with a purity of 99% was used. Granulometry showed that 100% of the particle size of zeolite 4A was under 45 μm. Figure 3b shows the SEM micrograph of used zeolite 4A.
2.2. Mixture Design and Sample Preparation
In this research, an AAB based on metakaolin was studied, as well as alkali-activated zeolite granules.
2.2.1. Mixture Design and Sample Preparation of Alkali-Activated Binder
The mixture-design-related details of the AAB are provided in Table 2. In this research, 3 ratios of liquid/solid (L/S) (alkali-activation solution/metakaolin ratio in this case) were studied—0.8, 1.0, and 1.2, respectively. Three different L/S ratios were used to determine which ratio was more effective for the production of zeolite granules. These 3 ratios were chosen based on previous experience. The blend of MK and the activation solution (NaOH) was mixed for 5 min using a mechanical mixer. After that, molds (20 × 20 × 20 mm) were filled and kept at room temperature (20 ± 2 °C) for 1 h. Molds were covered by a plastic film to ensure humidity, and were put in a curing chamber and kept at 80 °C for 24 h. After 24 h, samples were demolded and put in ambient conditions (atmospheric pressure, 20 ± 2 °C) for curing. Curing took place for the next 28 days.
Table 2.
Composition of the studied alkali-activated binder.
2.2.2. Mixture Design and Sample Preparation of Zeolite Granules
The mixture-design-related details of the zeolite granules are given in Table 3. For production of zeolite granules, AABs with L/S ratios 0.8; 1.0; 1.2 were used. For zeolite formation, the main oxide ratio is important (in this case, SiO2:Al2O3:Na2O). The theoretical oxide ratio for zeolite 4A is SiO2:Al2O3:Na2O = 2:1:2. In our case, ratios in the AABs were as follows:
Table 3.
Composition of the studied alkali-activated zeolite granules.
AAB-0.8 SiO2:Al2O3:Na2O = 1.31:1.00:0.35
AAB-1.0 SiO2:Al2O3:Na2O = 1.31:1.00:0.44
AAB-1.2 SiO2:Al2O3:Na2O = 1.31:1.00:0.53
As zeolites in AAB are formed as an alkali-activation-reaction byproduct (along with the main reaction product—N-A-S-H gel), the ratios are less important than the initial hardening conditions, which cause the formation of zeolites.
A blend of MK and activation solution was mixed for 5 min using a mechanical mixer. After that, zeolite 4A and water in small proportions were added to the mix. In this stage, zeolite and water must be added in small proportions; if not, zeolite adsorbs water from the blend and makes it harder to mix. After the blend had been mixed, the blend was extruded through a mechanical extruder a few times to get a more homogenous mix. The blend was extruded through a mechanical extruder, and green zeolite granules fell into a bed of zeolite 4A, where they were coated. A bed of zeolite 4A powder provided the granules with a layer of zeolite 4A, which helped them not to stick to each other and to absorb extra water in granules.
The produced zeolite granules were fractioned to get different sizes of the granules. Granule sizes were as follows: 4.0–5.6 mm; 2.0–4.0 mm; 1.0–2.0 mm; 0.5–1.0 mm; and <0.5 mm. Granules of the same size were put in plastic sealable bags and transferred to a curing chamber for curing. The curing chamber was set to 80 °C for 24 h; after that granules were cured for 28 days in ambient conditions (atmospheric pressure, 20 ± 2 °C). Samples from the 2.0–4.0 mm fraction were analyzed in this study, as it was the biggest fraction of all samples. Samples from granules were taken on days 14 and 28. On the 14th day, a sample was taken and ground up for XRD analysis; on the 28th day, samples were taken for XRD analysis and attrition tests.
2.3. Characterization Techniques
Samples of the AABs were mechanically tested on days 7, 14, and 28; for each test, 5 cubic samples were used to obtain accurate results. One sample cube on each test day was left untouched for specific surface-area analysis (based on the Brunauer–Emmett–Teller (BET) theory), and one of the cubes after the mechanical test was ground up for XRD analysis.
The compressive strength of 5 parallel samples (cubic AAB specimens) of each activation-solution ratio was tested on days 7, 14, and 28. The cubes with a rough dimension of 20 mm × 20 mm × 20 mm were tested by using a Zwick Z100 universal testing system (ZwickRoell, Kennesaw, GA, USA) with a testing speed of 0.5 mm/min. The cubic specimens were also measured before the crushing to determine the material density, which was calculated by dividing the sample’s mass by the respective volume. Compressive strength was calculated from force applied to the sample’s specific area.
Material density for granular material was calculated by impregnating granules with water, and after complete impregnation, granules were placed in a measuring cylinder with water and scaled; after that, calculations of volume and mass were made to obtain the material density. Bulk and tapped densities were calculated before impregnating the granules with water.
Attrition tests were carried out by weights that were put on a cylindrical press form, with the form being full of zeolite granules. Weight on the press form was carried out for 5 min; after that weight was slowly taken off the press form. Remains of the press form were sieved, and from the starting mass and produced fines, attrition was calculated
The XRD characterization of the AAB powders was performed with a BRUKER-AXS D8 ADVANCE X-ray diffractometer (Bruker, Billerica, MA, USA), using CuKα1 and CuKα2 radiation at a 2θ range of 5–65°.
The specific surface area and the porosity of the AABs were studied via N2 sorption and desorption based on the BET theory. The specific surface area was measured using the QUADRASORB SI (Quantachrome Instruments, Boynton Beach, FL, USA) equipment. Degassing was performed to free the surface of the specimens from moisture and other contaminants, according to the International Union of Pure and Applied Chemistry (IUPAC) guidelines. The degassing was performed for 20 h at 80 °C using Autosorb Degasser model “AD-9” (Quantachrome Instruments, USA).
The scanning electron microscopy (SEM) of the AABs and ZGs microstructures was performed using a “Mira/LMU” (Tescan, Czech Republic).
3. Results
3.1. Alkali-Activated Binder Based on Metakaolin
The material densities and compressive strength of the monolithic AABs are shown in Table 4. According to the obtained results, the material densities of the AABs ranged from 1.052 to 1.198 g/cm3 (Figure 4), depending on the liquid-to-solid ratio (L/S) and curing time. As seen in Table 4, the samples of series AAB-1.2 exhibited lower material densities (1.052–1.062 g/cm3) compared to samples of series AAB-0.8 (material density: 1.193–1.198 g/cm3) depending on curing day. The samples of series AAB-1.0 exhibited material densities of 1.127–1.178 g/cm3 depending on time.
Table 4.
Density and compressive strength of the produced AABs.
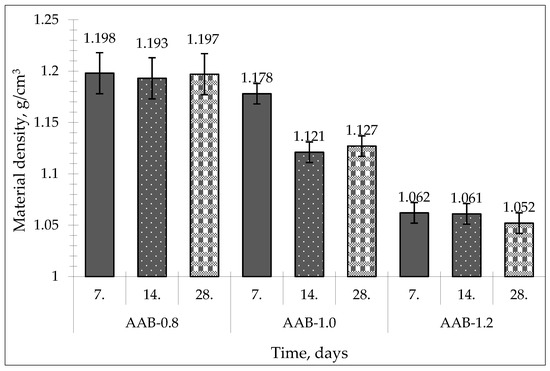
Figure 4.
Material density of obtained alkali-activated binders.
As seen in Table 4 and Figure 5, the studied AABs had a compressive strength ranging from 3.38 to 12.55 MPa, depending on the L/S ratio and curing time. Mechanical properties are very important for zeolite granules due to abrupt gas and packing movements and other mechanical influences in the adsorption bed during the long operational period (at least 3–5 years) [22,23]. Typical zeolite granules should have compressive strengths of at least 10 MPa for the gas adsorption-pressure vessels [24]. The compressive strength of most of the obtained binders reported in this work was not above this compressive-strength threshold.
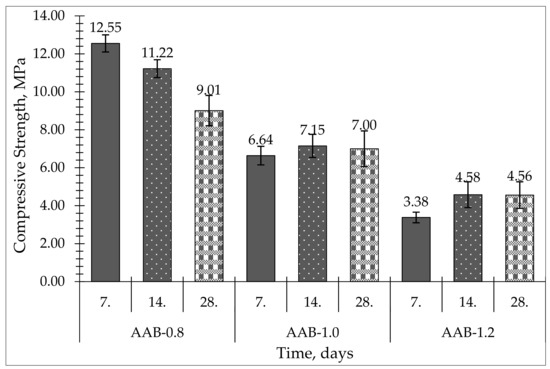
Figure 5.
Compressive strength of produced alkali-activated binders.
All samples were cured at ambient pressure and temperature (20–23 °C). Sample series AAB-0.8 presented the highest compressive strength: 12.55 MPa on day 7 and 9.01 MPa on day 28. The AAB-1.2 samples had the greatest L/S ratio and exhibited the lowest compressive strength: 3.38 MPa on day 7 and 4.56 MPa on day 28. AAB-1.0 samples exhibited 6.64 MPa on day 7 and 7.00 MPa on day 28.
Among the three obtained series, series AAB-0.8 exhibited the highest compressive strength, although the strength dropped by 3 MPa from day 7 to day 28. AAB-1.0 exhibited the most stable compressive strength in the curing timeframe, increasing its value from 6.64 MPa on day 7 to 7.00 MPa on day 28, but the overall compressive strength was lower than needed for adsorbent granules.
When looking at Figure 5, we can see that when increasing the L/S ratio in the activation solution, compressive strength decreased.
The results shown in Table 4 can be compared with the results from a study by Liang Chen [25], who did a similar study of preparation and property assessment of alkali-activated metakaolin. In that research, a compressive strength of 26.42 to 37.40 MPa was achieved, using elevated temperature for curing and sodium silicate solution as part of the mixture design.
Figure 6 shows the X-ray diffractograms for the produced AABs taken on day 28 of production. According to the data, an alkali activation reaction took place because the X-ray diffractograms show a halo shift of the amorphous phase (curvature at 15–30°) to the right (curvature at 20–35°), and the main product of the alkali activation reaction—N-A-S-H gel—was obtained. The effect of the L/S ratio on the mineralogical composition was observed.
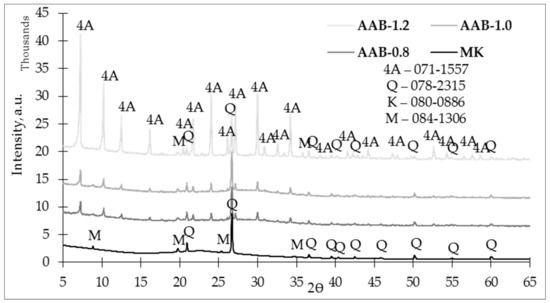
Figure 6.
X-ray diffractogram (XRD) of the studied alkali-activated binders on the 28th day.
As seen in Figure 6, crystalline phases of quartz (SiO2) and muscovite (KAl3Si3O10(OH)2) could observed after an alkali-activation reaction. In addition to the L/S ratios affecting observation, alkali-activation byproducts—zeolites—were obtained. Following the analysis of the data, zeolites contained in the AABs corresponded to zeolite 4A (Na12Al12Si12O48). Increasing the L/S ratio increased the crystalline phase intensity of zeolite 4A. Zeolite 4A crystalline phase intensities for AAB-0.8 and AAB-1.0 were quite similar, which could be due to the lack of water in the system to initiate the crystallization process [26], but the crystalline phase of 4A in AAB-1.2 was significantly more intensive. The effects of L/S on the formation of zeolites in the AABs consisted of both increased Na2O levels and increased quantities of H2O, i.e., by adding more activation solution, more water entered the system as a whole, which helped the raw materials and formed more zeolite 4A [27].
The specific surface area was determined for the AABs (Table 5.) to see how the L/S ratio influenced surface area. Samples were degassed in order to free their surfaces so it would be possible to obtain more accurate results for their surface areas. The largest surface area was for the AAB-1.0 sample, which was 5.138 m2/g, while AAB-0.8 was second, with 5.088 m2/g. AAB-1.2 exhibited the lowest surface area of all samples, with 2.487 m2/g.
Table 5.
The surface areas of the alkali-activated binders.
Samples of AAB were subjected to scanning electron microscopy to study their microstructure. For AAB samples, images were taken at magnifications of 5000× and 15,000×, as shown in Figure 7. According to the XRD results, crystals of plate-like formations corresponded to N-A-S-H gel, and crystals of cubic structure corresponded to zeolite 4A.
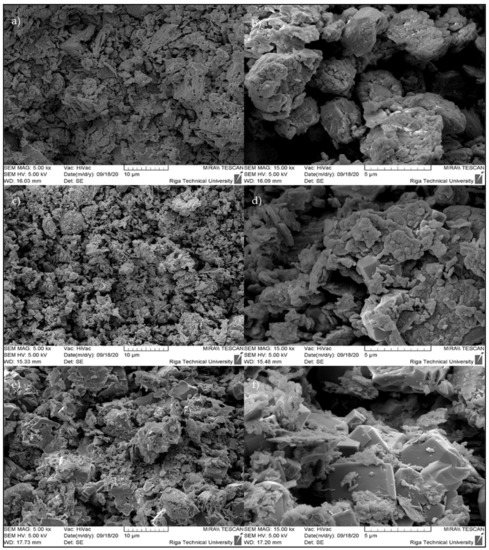
Figure 7.
SEM micrographs presenting the microstructures of the studied AABs: (a) AAB-0.8, 5 kx; (b) AAB-0.8, 15 kx; (c) AAB-1.0, 5 kx; (d) AAB-1.0, 15 kx; (e) AAB-1.2, 5 kx; (f) AAB-1.2, 15 kx.
When looking at Figure 7a,c,e, we can see that there were not many pronounced cubic crystal structures that corresponded to zeolite 4A, but when looking at Figure 7b,d,f, showing images that were captured at greater magnification, we can see the crystal formation of a cubic structure much clearer. As shown in Figure 7, without monocrystalline cubic crystals, polycrystalline formations formed from zeolite 4A monocrystals.
3.2. Alkali-Activated Zeolite Granules
Table 6 contains material, bulk, and tapped densities that were measured for the produced zeolite granules. The Hausner ratio was measured by dividing tapped density with bulk density; this was important because it measured granule flowability. If the ratio is lower than 1.25, granules have a great flowability, meaning granules will flow freely and will not block the feeder; if the ratio is greater than 1.50, the flowability of granules is poor.
Table 6.
Densities and attrition of produced ZG.
To obtain information about granule strength, an attrition test was conducted for two levels of pressure—4 and 5 atm.
Tapped density was measured by tapping the granules with the shock table used in the ASTM C143 standard. Thirty handle revolutions were used for compacting the granules. The highest material density (1.500 g/cm3) was measured for granules ZG-0.8, with bulk densities in free and compacted states of 0.703 and 0.781 g/cm3, respectively. The material density of ZG-1.2 was 1.472 g/cm3, with bulk densities in free and compacted states of 0.685 and 0.753 g/cm3, respectively. Bulk densities in the compacted states were higher than in the free states because the granules filled more voids between granules when compacted, thereby occupying a smaller volume. Material densities were greater than both bulk densities because the values for the material densities were for the materials without pores and voids.
Data that we obtained from the attrition test showed how much fines were produced under each pressure, which should be as low as possible. If fewer fines are produced from adsorbents, then the equipment will work properly for a longer period. If a lot of fines are produced, it will clog the compressors and the reactor will have to shut down for maintenance, and that can be expensive. Attrition was measured for a 2–4 mm fraction of produced zeolite granules at atmospheric pressures of 4 and 5. ZG-0.8 attrition was 2.42% at 4 atmospheric pressures and 4.55% at 5 atmospheric pressures. ZG-1.2 also showed similar attrition results: 2.73% and 4.85% at 4 and 5 atmospheric pressures, respectively. ZG-1.0 exhibited 3.64% and 5.76% attrition at 4 and 5 atmospheric pressures, respectively. Attrition was affected by several factors, such as particle size and shape, chemical composition, and mechanical compressive strength. Higher attrition resulted in lower mechanical compressive strength. From data obtained in this study, these granules were not suitable for adsorption above 4 atmospheric pressures; however, they could be used in some reactors that operate at a lower pressure.
Figure 8 shows an X-ray diffractogram for the ZG-0.8 samples, in which we can assess the crystalline phase’s development over time. When comparing the 14th- and 28th-day diffractograms, it could be assessed that zeolites kept developing through time, because the 28th-day diffractograms show a more intense zeolite 4A crystalline phase.
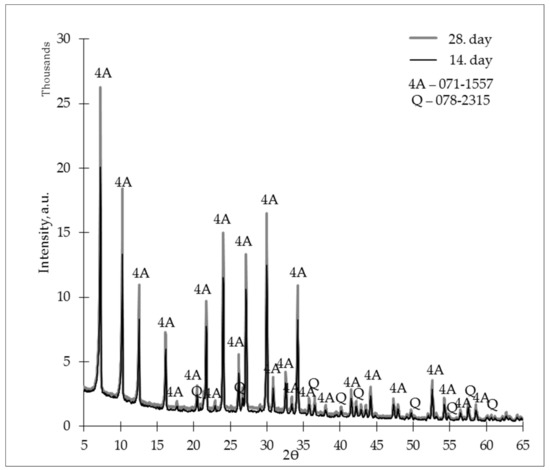
Figure 8.
X-ray diffractogram (XRD) of the studied zeolite granules (L/S 0.8) on days 14 and 28.
The ZG-1.0 sample X-ray diffractograms are shown in Figure 9. When comparing these diffractograms, we could assess similarities with the ZG-0.8 samples, i.e., on the 28th day, the crystalline phase of zeolite 4A was more intense than on the 14th day.
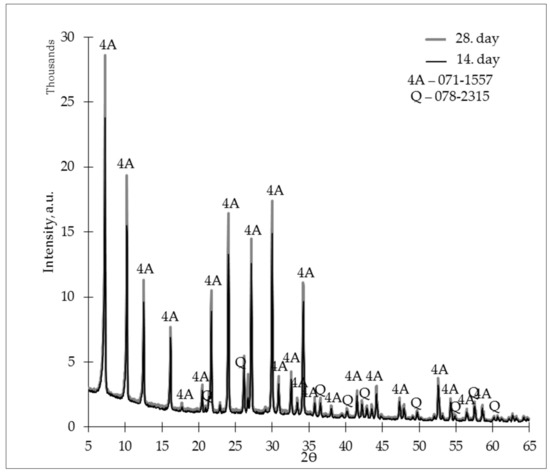
Figure 9.
X-ray diffractogram (XRD) of the studied zeolite granules (L/S 1.0) on days 14 and 28.
Figure 10 shows the ZG-1.2 X-ray diffractograms on the 14th and 28th days. Using an L/S ratio of 1.2, it was possible to create a material that, compared to AAB-0.8 and AAB-1.0, did not show a sharp change in crystalline phase intensities during the curing process, which means that zeolite granules made with an L/S ratio of 1.2 could develop a more intensive zeolite 4A crystalline phase in a shorter period.
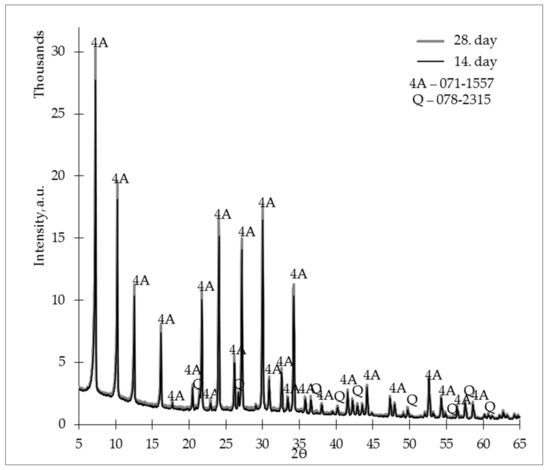
Figure 10.
X-ray diffractogram (XRD) of the studied zeolites granules (L/S 1.2) on days 14 and 28.
X-ray diffractograms of the studied zeolites are shown in Figure 11. According to the data, an alkali-activation reaction occurred, because the amorphous phase (curvature at 15–30°) was offset to the right (curvature at 20–35°) in the X-ray diffractogram, and the main product of the alkali-activation reaction—N-A-S-H gel—was obtained. The L/S ratio affected the mineralogical composition.
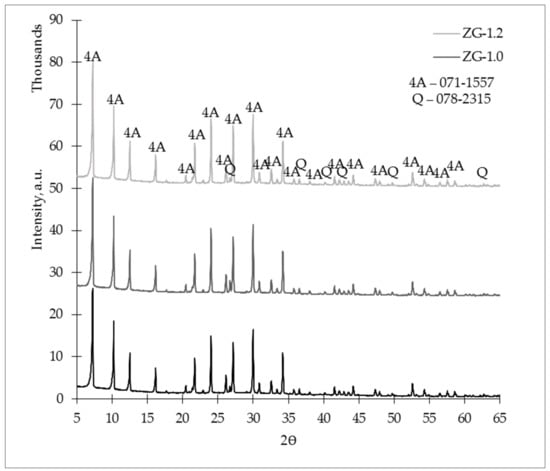
Figure 11.
X-ray diffractogram (XRD) of the studied zeolites granules on the 28th day.
In Figure 11, we can observe that in the ZG-1.2 sample, the crystalline phase of zeolite 4A was slightly more intense than those of the ZG-0.8 and ZG-1.0 crystalline phases. There were no significant changes between ZG-0.8 and ZG-1.0, but the ZG-1.0 crystalline phases were slightly more intense than the ZG-0.8 crystalline phases. From this data, we can assess a regularity that increasing the L/S ratio led to a more intensive crystalline phase of zeolite 4A in the ZG samples.
Table 7 shows the surface area of the ZG samples. Zeolite granule samples exhibited similar values for the 0.8 and 1.2 L/S ratios (3.841 and 3.635 m2/g, respectively), but the ZG-1.0 sample showed the highest surface area, 4.314 m2/g.
Table 7.
The specific surface area of zeolite granules.
Figure 12, Figure 13 and Figure 14 show the microstructures of the zeolite granules at 1000×, 5000×, and 15,000×. Figure 12 illustrates the microstructures of the zeolite granule samples, in which their appearance on the surface may be observed. In this image, suitable particle distribution and homogenous pore placement can be observed. The SEM micrographs were taken with broken zeolite granules to assess their cross-section’s inner structure.
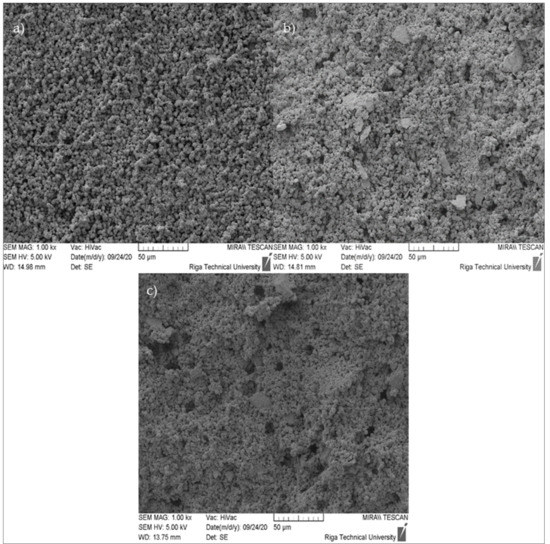
Figure 12.
SEM micrographs of ZG samples (cross-section) at 1000× magnification: (a) ZG-0.8; (b) ZG-1.0; (c) ZG-1.2.
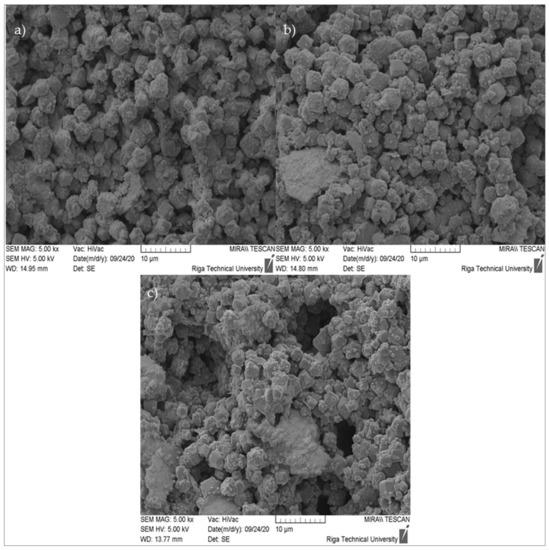
Figure 13.
SEM micrographs of ZG samples (cross-section) at 5000× magnification: (a) ZG-0.8; (b) ZG-1.0; (c) ZG-1.2.
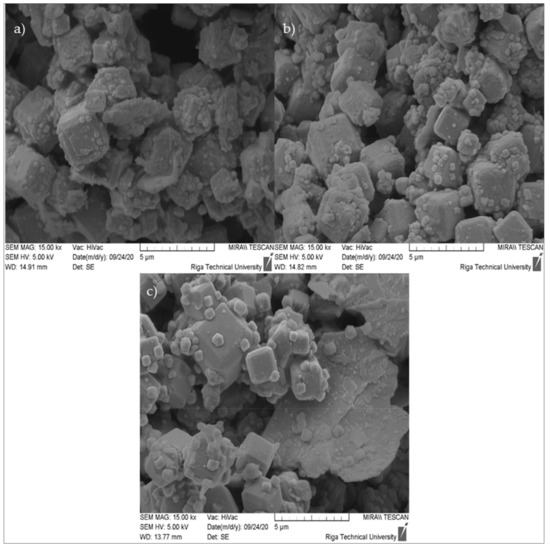
Figure 14.
SEM micrographs of ZG samples (cross-section) at 15,000× magnification: (a) ZG-0.8; (b) ZG-1.0; (c) ZG-1.2.
The produced zeolite granule microstructure, at a magnification of 5000×, can be observed in Figure 13. The figure shows a large number of cubic crystalline formations, corresponding to the results of the XRD for zeolite 4A, as well as plate-like formations corresponding to the N-A-S-H gel.
Figure 14 shows formations of cube-shaped crystals corresponding to zeolite 4A and plate-like crystals formations corresponding to N-A-S-H gel. There is also a pronounced polycrystallinity on the surface of zeolite 4A, expressed as growth on new zeolite 4A crystals on the surface of existing zeolite 4A crystals.
4. Discussion
For granular adsorbents, a sufficient mechanical performance is a critical parameter [11,28,29,30]. In this study, physical and mechanical characteristics of MK-based alkali-activated binders and zeolite granules were studied and linked to the microstructures and mineralogical compositions of the final products. The liquid-to-solid ratio (L/S—0.8; 1.0; 1.2) of the 8M NaOH activation solution and the curing time had crucial roles that resulted in varying properties of the obtained products.
By looking at the material densities of the AAB samples, we can assess that the L/S ratio affects density. By increasing the L/S ratio, material density decreases, and this can be explained by the water content in the sample [10,31]. AAB-1.2 had the most water content inside the sample, and as the sample cured (ambient conditions), water evaporated, thus resulting in a lower material density at the end of curing. AAB-0.8 exhibited a material density of 1.197 g/cm3 at the end of curing, AAB-1.0 exhibited 1.127 g/cm3, and AAB-1.2 exhibited 1.052 g/cm3. Curing time did not affect the material density, and all the material density changes can be explained by water evaporation from samples.
For good mechanical performance in gas adsorption under pressure applications, typical zeolite granules should reach at least 10 MPa [24] in compressive strength. In this study, only the AAB-0.8 sample showed the closest value, with 12.55 MPa on the 7th day and 9.01 MPa on the 28th day. AAB-1.0 samples showed 6.64 and 7.00 MPa on the 7th and 28th day, respectively; and AAB-1.2 showed 3.38 and 4.56 MPa on the 7th and 28th day, respectively. Looking at all samples, we can assess that there was a linear relationship between mechanical properties and the liquid-to-solid (L/S) ratio; when increasing the L/S ratio, compressive strength in the AAB samples decreased. The strength drop of AAB-0.8 can be explained by the low formation of zeolites and more N-A-S-H gel formation at initial curing. With high N-A-S-H gel formation at the start of curing, the material gains tension in later phases of curing when zeolites are formed from the existing N-A-S-H gel, and as the zeolites form, the structure of the material is damaged, resulting in a compressive strength drop. The increase of the L/S ratio promotes more intensive zeolite formation at the start of the curing by filling the voids, which form when N-A-S-H gel transforms into zeolites. As the material cures, these voids are filled with zeolites, resulting in an increased material-to-void ratio and an increase of compressive strength in later phases of curing. To support this hypothesis, a quantitative XRD study and longer curing times will be conducted.
When evaluating the XRD diffractograms, it could be concluded that the crystalline phases of zeolite 4A were more intense than ZG-0.8 and ZG-1.0 in sample ZG-1.2. No significant changes in the intensities of the crystalline phases were observed between the sample series ZG-1.0 and ZG-0.8, but ZG-1.0 had a slightly higher intensity of these phases. From this, it can be assessed that by increasing the L/S ratio, a more intense crystalline phase of zeolite 4A can be observed. Examining the intensity of crystallization over time in all series of ZG samples, it was concluded that zeolite 4A in zeolite granules also develop over time [32], because on the 28th day, the diffractograms showed crystalline phases of higher-intensity zeolite 4A.
BET values were low because the test was carried out using nitrogen as the adsorbate gas. Nitrogen molecules are bigger than CO2 molecules, and cannot travel through the zeolite’s small pore structure. Zeolite 4A forms a smaller pore structure, resulting in a smaller space for adsorbate molecule, and as the nitrogen is bigger than the pore, zeolite does not adsorb it, and the BET value is low. To support this hypothesis, a more pronounced adsorption study, including CO2 adsorption, will be conducted. CO2 adsorption is the target adsorbate for future study. An L/S ratio affecting surface area can be described similarly to the strength drop of AAB-0.8.
When assessing the SEM images at 1000× magnification, it was observed that a good particle distribution and homogeneous pore arrangement had been formed; at 5000× magnification, large and pronounced cubic zeolite 4A crystals and plate-like metakaolin crystals could be observed. At a magnification of 15,000×, the presence of polycrystallinity on the surface of zeolite 4A crystals could be observed [33].
5. Conclusions
- The AAB-0.8 sample showed the highest compressive strength and density: 9.01 MPa and 1.197 g/cm3, respectively.
- The highest crystalline phase intensities of zeolite 4A were observed in sample AAB-1.2.
- The largest surface area for alkali-activated binders was observed in sample AAB-1.0, with 5.138 m2/g.
- In SEM micrographs of AAB samples, it could be observed that without monocrystalline cubic crystals representing zeolite 4A, polycrystalline formations had formed as well.
- Similar to the AAB samples, ZG-0.8 showed the highest densities: 1.500 g/cm3, 0.703 g/cm3, and 0.781 g/cm3, representing material density, bulk density, and tapped density, respectively.
- The ZG-0.8 sample exhibited the lowest attrition: 2.42%, and 4.55% at 4 and 5 atmospheres, respectively.
- As in the case of crystalline phase intensities of zeolite 4A in AAB-1.2, ZG-1.2 exhibited the same correlation in which it had the highest crystalline phase intensities, which means that with an L/S ratio of 1.2, a more pronounced crystallinity of zeolite 4A could be achieved.
- The largest surface area for ZG samples was observed in ZG-1.0, with 4.314 m2/g, meaning that with an L/S ratio of 1.0, a more pronounced surface area could be achieved.
- The ZG SEM micrographs exhibited good particle distribution, as well as polycrystallinity similar to the AAB samples.
When evaluating the results for the obtained granules, from the point of view of density and friability, the series samples with L/S 0.8 were perspective, because the advantage with this ratio was the high density and low friability. From the point of view of the intensities of the crystalline phases, the most advantageous L/S ratio was 1.2, showing more pronounced crystalline phases of zeolite 4A in a faster period of time. From the BET point of view, the best results were with an L/S ratio of 1.0, giving the advantage of a large surface area. The L/S ratio had a major impact on the outcome of the AABs and the granules. By increasing this ratio, material mechanical properties decreased; however, crystalline phase intensities of zeolite 4A increased, and vice versa.
Author Contributions
Conceptualization, K.V. and L.V.; methodology, P.P.A., K.V., and L.V.; formal analysis, P.P.A. and L.V.; investigation, P.P.A., L.V., K.V., and D.B.; resources, K.V. and D.B.; data curation, L.V. and K.V.; writing—original draft preparation, P.P.A., L.V., and K.V.; writing—review and editing, P.P.A., L.V., K.V., and D.B.; visualization, P.P.A.; supervision, K.V. and L.V.; project administration, K.V.; funding acquisition, K.V. All authors have read and agreed to the published version of the manuscript.
Funding
This research was funded by the European Regional Development Fund within the Activity 1.1.1.2 “Post-doctoral Research Aid” of the Specific Aid Objective 1.1.1 of the Operational Program “Growth and Employment” (No. 1.1.1.2/VIAA/1/16/116, “The development of biomethane production technologies”).
Acknowledgments
P.P.A. is especially grateful to Girts Bumanis for help with the extrusion process, and grateful to be a part of MP-2020/10 “Alkali-activated metakaolin as a zeolite-like binder for the production of adsorbents” for strengthening scientific personnel capacity 2019/2020 at Riga Technical University.
Conflicts of Interest
The authors declare no conflict of interest.
References
- Awoyera, P.; Adesina, A. A critical review on application of alkali activated slag as a sustainable composite binder. Case Stud. Constr. Mater. 2019, 11, e00268. [Google Scholar] [CrossRef]
- Gleichmann, K.; Unger, B.; Brandt, A. Industrial Zeolite Molecular Sieves. Zeolites Useful Miner. 2016. [Google Scholar] [CrossRef]
- Kerry, C.; Weston, P.P. Molecular Sieve Adsorbent Blends and Uses Thereof. U.S. Patent 8,680,344 B2, 25 March 2014. [Google Scholar]
- Zhang, Z.; Wang, H.; Provis, J.L.; Bullen, F.; Reid, A.; Zhu, Y. Quantitative kinetic and structural analysis of geopolymers. Part 1. the activation of metakaolin with sodium hydroxide. Thermochim. Acta 2012. [Google Scholar] [CrossRef]
- Vegere, K.; Vitola, L.; Argalis, P.P.; Bajare, D.; Krauklis, A.E. Alkali-activated metakaolin as a zeolite-like binder for the production of adsorbents. Inorganics 2019, 7. [Google Scholar] [CrossRef]
- Rivera, O.G.; Long, W.R.; Weiss, C.A.; Moser, R.D.; Williams, B.A.; Torres-Cancel, K.; Gore, E.R.; Allison, P.G. Effect of elevated temperature on alkali-activated geopolymeric binders compared to portland cement-based binders. Cem. Concr. Res. 2016, 90, 43–51. [Google Scholar] [CrossRef]
- Jacobs, P.A.; Dusselier, M.; Sels, B.F. Will zeolite-based catalysis be as relevant in future biorefineries as in crude oil refineries? Angew. Chem. Int. Ed. 2014, 53, 8621–8626. [Google Scholar] [CrossRef]
- Garcia-Lodeiro, I.; Palomo, A.; Fernández-Jiménez, A. An overview of the chemistry of alkali-activated cement-based binders; Woodhead Publishing Limited: Cambridge, MA, USA, 2015; ISBN 9781782422884. [Google Scholar]
- Amrhein, C.; Haghnia, G.H.; Kim, T.S.; Mosher, P.A.; Gagajena, R.C.; Amanios, T.; De La Torre, L. Synthesis and properties of zeolites from coal fly ash. Environ. Sci. Technol. 1996, 30, 735–742. [Google Scholar] [CrossRef]
- Biel, O.; Rożek, P.; Florek, P.; Mozgawa, W.; Król, M. Alkaline activation of kaolin group minerals. Crystals 2020, 10. [Google Scholar] [CrossRef]
- Takeda, H.; Hashimoto, S.; Yokoyama, H.; Honda, S.; Iwamoto, Y. Characterization of zeolite in zeolite-geopolymer hybrid bulk materials derived from kaolinitic clays. Materials 2013, 6, 1767–1778. [Google Scholar] [CrossRef] [PubMed]
- Awoyera, P.O.; Adesina, A.; Sivakrishna, A.; Gobinath, R.; Kumar, K.R.; Srinivas, A. Alkali activated binders: Challenges and opportunities. Mater. Today Proc. 2020, 27, 40–43. [Google Scholar] [CrossRef]
- Zhang, B.; MacKenzie, K.J.D.; Brown, I.W.M. Crystalline phase formation in metakaolinite geopolymers activated with NaOH and sodium silicate. J. Mater. Sci. 2009, 44, 4668–4676. [Google Scholar] [CrossRef]
- Król, M.; Minkiewicz, J.; Mozgawa, W. IR spectroscopy studies of zeolites in geopolymeric materials derived from kaolinite. J. Mol. Struct. 2016, 1126, 200–206. [Google Scholar] [CrossRef]
- Grutzeck, M.; Kwan, S.; DiCola, M. Zeolite formation in alkali-activated cementitious systems. Cem. Concr. Res. 2004, 34, 949–955. [Google Scholar] [CrossRef]
- Duxson, P.; Fernández-Jiménez, A.; Provis, J.L.; Lukey, G.C.; Palomo, A.; Van Deventer, J.S.J. Geopolymer technology: The current state of the art. J. Mater. Sci. 2007, 42, 2917–2933. [Google Scholar] [CrossRef]
- Criado, M.; Fernández-Jiménez, A.; de la Torre, A.G.; Aranda, M.A.G.; Palomo, A. An XRD study of the effect of the SiO2/Na2O ratio on the alkali activation of fly ash. Cem. Concr. Res. 2007, 37, 671–679. [Google Scholar] [CrossRef]
- Stöcker, M. Gas phase catalysis by zeolites. Microporous Mesoporous Mater. 2005, 82, 257–292. [Google Scholar] [CrossRef]
- Bikit, I.; Mrdja, D.; Bikit, K.; Grujic, S.; Knezevic, D.; Forkapic, S.; Kozmidis-Luburic, U. Radon adsorption by zeolite. Radiat. Meas. 2015, 72, 70–74. [Google Scholar] [CrossRef]
- Abd, A.A.; Naji, S.Z.; Hashim, A.S.; Othman, M.R. Carbon dioxide removal through physical adsorption using carbonaceous and non-carbonaceous adsorbents: A review. J. Environ. Chem. Eng. 2020, 8, 104142. [Google Scholar] [CrossRef]
- Chester, A.W. Zeolite Characterization and Catalysis: A Tutorial; Springer Science+Business Media B.V: Heidelberg, Germany, 2009; Volume 2010, ISBN 781402096778. [Google Scholar]
- Shanmugam, S. Granulation techniques and technologies: Recent progresses. BioImpacts 2015, 5, 55–63. [Google Scholar] [CrossRef] [PubMed]
- Rodriguez, L.; Cavallari, C.; Passerini, N.; Albertini, B.; González-Rodríguez, M.L.; Fini, A. Preparation and characterization by morphological analysis of diclofenac/PEG 4000 granules obtained using three different techniques. Int. J. Pharm. 2002, 242, 285–289. [Google Scholar] [CrossRef]
- Narang, K. Tailoring of Adsorptive Properties of Zeolites for Biogas Upgrading. Licentiate Thesis, Luleå University of Technology, Luleå, Sweden, 2019. [Google Scholar]
- Chen, L.; Wang, Z.; Wang, Y.; Feng, J. Preparation and properties of alkali activated metakaolin-based geopolymer. Materials 2016, 9, 767. [Google Scholar] [CrossRef]
- Müller, P.; Russell, A.; Tomas, J. Influence of binder and moisture content on the strength of zeolite 4A granules; Elsevier: New York, NY, USA, 2015; Volume 126, ISBN 4939167518. [Google Scholar]
- Fernández-Jiménez, A.; Palomo, A. Composition and microstructure of alkali activated fly ash binder: Effect of the activator. Cem. Concr. Res. 2005, 35, 1984–1992. [Google Scholar] [CrossRef]
- David, E. Mechanical strength and reliability of the porous materials used as adsorbents/ catalysts and the new development trends. Arch. Mater. Sci. Eng. 2015, 73, 5–17. [Google Scholar]
- Mosca, A. Structured zeolite adsorbents for PSA applications. Doctoral Thesis, Luleå University of Technology, Luleå, Sweden, 2009. [Google Scholar]
- Ruthven, D.M. Principles of Adsorption and Adsorption Processes; John Wiley & Sons Inc.: Hoboken, NJ, USA, 1984. [Google Scholar]
- Król, M. Natural vs. Synthetic zeolites. Crystals 2020, 10, 622. [Google Scholar] [CrossRef]
- Ameh, A.E.; Fatoba, O.O.; Musyoka, N.M.; Petrik, L.F. Influence of aluminium source on the crystal structure and framework coordination of Al and Si in fly ash-based zeolite NaA. Powder Technol. 2017, 306, 17–25. [Google Scholar] [CrossRef]
- Ren, X.; Qu, R.; Liu, S.; Zhao, H.; Wu, W.; Song, H.; Zheng, C.; Wu, X.; Gao, X. Synthesis of zeolites from coal fly ash for the removal of harmful gaseous pollutants: A review. Aerosol Air Qual. Res. 2020, 20, 1127–1144. [Google Scholar] [CrossRef]
Publisher’s Note: MDPI stays neutral with regard to jurisdictional claims in published maps and institutional affiliations. |
© 2021 by the authors. Licensee MDPI, Basel, Switzerland. This article is an open access article distributed under the terms and conditions of the Creative Commons Attribution (CC BY) license (http://creativecommons.org/licenses/by/4.0/).