Article

A New Process of Extracting Titanium from Vanadium–Titanium Magnetite

1
Key Laboratory of Extraordinary Bond Engineering and Advanced Materials Technology (EBEAM), Yangtze Normal University, Chongqing 408100, China
2
School of Artificial Intelligence and Automation, Huazhong University of Science and Technology, Wuhan 430074, China
3
College of Materials Science and Engineering, Chongqing University, Chongqing 400044, China
*
Author to whom correspondence should be addressed.
Crystals 2021, 11(4), 327; https://doi.org/10.3390/cryst11040327
Submission received: 14 March 2021 / Revised: 21 March 2021 / Accepted: 23 March 2021 / Published: 25 March 2021
(This article belongs to the Special Issue Crystalline Microstructures in Stainless Steels)

Abstract

:
A new process of extracting titanium from vanadium–titanium magnetite (VTM) in the Panxi area in Sichuan, China is introduced in this work. Various experiments, including reduction–magnetic separation, leaching and hydrolyzing experiments, are carried out. The results show that the optimum conditions for leaching experiments are an acid/slag ratio of 4:1, a leaching temperature of 60 °C, a leaching time of 80 min, and a liquid/solid ratio of 3.2:1. The leaching rate of titanium in Ti-bearing slag is 92.41%. The optimum conditions for hydrolyzing experiments are an H+ concentration of 0.75 g·L−1, hydrolyzing temperature of 100 °C, and hydrolyzing time of 180 min, and the hydrolyzing rate of titanium in acid leaching liquor is 96.80%. After the leaching and hydrolyzing experiments, the recovery rate of titanium from the Ti-bearing slag is 89.45%.

1. Introduction

Vanadium–titanium magnetite (VTM) owes its extremely high and comprehensive utilization value due to abundant associating and valuable elements such as iron, vanadium and titanium [1]. The reserve of the VTM resources attains over 10 billion tons in the Panzhihua and Xichang regions, in which the reserve of the TiO2 reaches 873 million tons and accounts for 90.5% of total national reserves [2,3]. In the last decades, VTM has been treated by BF (Blast Furnace) ironmaking and a BOF (Basic Oxygen Furnace) vanadium extracting/semi-steel smelting process in China [4]. As a result, a mountain of titanium in VTM enters the BF slag, which is piled along the Jinsha River and is difficult to utilize. Consequently, this leads to a serious issue of environmental pollution and a large supply of valuable titanium is lost.
In order to achieve the comprehensive utilization of titanium from ilmenite and VTM, a large number of processes for extracting titanium have been put forward nowadays [5,6,7,8]. The sulphate process is the first commercialized technology to produce TiO2 using ilmenite. However, the lower quality products are obtained associating with a high cost and acid consumption to removing impurities in iron and vanadium. In addition, the by-product, ferrous sulphate, is less marketable [9,10,11,12,13,14,15,16].
The chloride process of producing TiO2 employs more complicated technology. First, the high grade of feedstocks containing more than 90% of TiO2, such as natural rutile, synthetic rutile and high grade of titanium slag, are obtained from upgrading the ilmenite and VTM, then these feedstocks are purified by chlorination at a high temperature to obtain pure TiCl4. After condensation and distillation, the TiCl4 is oxidized at high temperatures to produce titanium dioxide. In this process, the cost and waste materials are both reduced [17,18,19,20]. However, strict requirements for equipment and raw materials hindered the chloride process development in China. Therefore, a new process should be developed to extract titanium from VTM.
In this work, the process of extracting titanium from VTM through roasting and leaching Ti-bearing slag obtained from metalizing reduction and magnetic separation process [21] with H2SO4 was carried out. Then the hydrolyzing experiments of acid leaching liquor were investigated. In this process, the valuable elements of iron and vanadium have been recycled by a pyro-metallurgical process. Thus, the elimination of by-products can be reduced and simultaneously, the energy consumption can be decreased. Meanwhile, the waste problem of titanium in the BF process is solved.

2. Experimental Methods

2.1. Raw Materials

The chemical compositions of VTM and industrial analysis of reduction coal examined in this work are presented in Table 1, where Aad for ash content, Vad for volatile content, Mad for moisture content, FCad for fixed carbon content and ad means air-dried basis. The particle sizes of VTM and reduction coal are ground to less than 0.074mm. As listed in Table 1, the VTM from PanXi area of China contains 53.91% Fe and 13.03% TiO2, and the main minerals in the VTM are magnetite, titano-magnetite, ilmenite and vanadium spinel [21].
Other chemical agents mainly include concentrated sulfuric acid (98 vol.%) and deionized water in the leaching and hydrolyzing process.

2.2. Experimental Procedure

The first step is the testing of valuable elements separation rate and the preparation of Ti-bearing slag. During the tests, the process parameters, such as reduction and magnetic separation, specifically, the magnetic intensity, reduction temperature, reduction time and carbon ratio, were changed within the default ranges. Then, the optimal parameters were determined, and the best Ti-bearing slag was obtained [3]. The second step involves acid leaching the Ti-bearing slag. The Ti-bearing slag, concentrated sulfuric acid, and deionized water were added into a three-necked, round-bottomed flask with a mechanical stirrer. Then, the leaching experiments were carried out at the preset temperature for the preset time. The third step involves hydrolyzing enrichment experiments of the acid leaching liquor. The acid leaching liquor was added into another three-necked, round-bottomed flask with a mechanical stirrer. The flask was placed in an electric heating jacket setting with the preset temperature and the preset time. The experimental flow accompanying the main apparatus is shown in Figure 1.
In this study, the leaching and hydrolysis mechanism were analyzed using X-ray diffraction (XRD, D8 Discover, Bruker, Karlsruhe, Germany) with Cu Ka radiation for phase structures, scanning electron microscopy (SEM, Ultra Plus, ZEISS, Jena, Germany) for microstructural analysis and energy-dispersive X-ray spectroscopy (EDS, Ultra Plus, ZEISS, Jena, Germany) for element content, and the leaching kinetics was determined by the unreacted core model.

3. Results and Discussions

3.1. Preparation of Ti-Bearing Slag

During the previous reduction and magnetic separation experiments of VTM and coal, four key process factors, including carbon ratio of 0.8–1.8, reduction temperature of 1250–1355 °C, reduction time of 10–60 min, and magnetic intensity of 25–125 mT, have been considered. The optimal process parameters for reduction and magnetic separation are a carbon ratio of 1.0, a reduction temperature of 1350 °C, reduction time of 60 min and magnetic intensity of 50 mT [21]. Under the above conditions, the Ti-bearing slag was obtained and then analyzed by chemical methods, SEM and XRD.
The chemical composition of the Ti-bearing slag is given in Table 2. As listed in Table 2, the TiO2 content reaches 40.91%. As the XRD pattern and EDS analysis of the Ti-bearing slag are shown in Figure 2, the main mineralogical phases of the Ti-bearing slag are MgAl2O4, MgxTi3−xO5, FeTiO3, Mg2SiO4 and TiO2.

3.2. Leaching of Ti-Bearing Slag by H2SO4

3.2.1. Effects of Acid/Slag Ratio on Leaching Rate

In order to get the optimum acid/slag ratio, the Ti-bearing slag and H2SO4 mixtures were prepared with the acid/slag ratios of 2:1, 3:1, 4:1 and 5:1. The other process parameters were kept constant as follows: roasting temperature of 200 °C, roasting time of 90 min, leaching temperature of 70 °C, leaching time of 60 min, liquid/solid ratio of 3.2:1. The variation of leaching rate of titanium at different acid/slag ratios is given in Figure 3.
As shown in Figure 3, the leaching rate of titanium increases from 71.56% to 90.97% as the acid/slag ratio increases from 2:1 to 4:1. With further increases in acid/slag ratio from 4:1 to 5:1, the leaching rate of titanium presents a downward trend. The definite reason for this phenomenon is that a rising acid/slag ratio can effectively restrain hydrolysis reaction of the acid leaching liquor as well as improve the kinetic conditions of the acidolysis reaction between H2SO4 and Ti-bearing slag. However, a high acid/slag ratio may lead to two adverse factors of the leaching process. On the one hand, the consumption of H2SO4 increases; on the other hand, the emergence of gelatinous matter results in lots of soluble titanium ions absorbed, which can decrease the leaching rate of titanium. Accordingly, the optimum acid/slag ratio of 4:1 is selected for the subsequent tests.

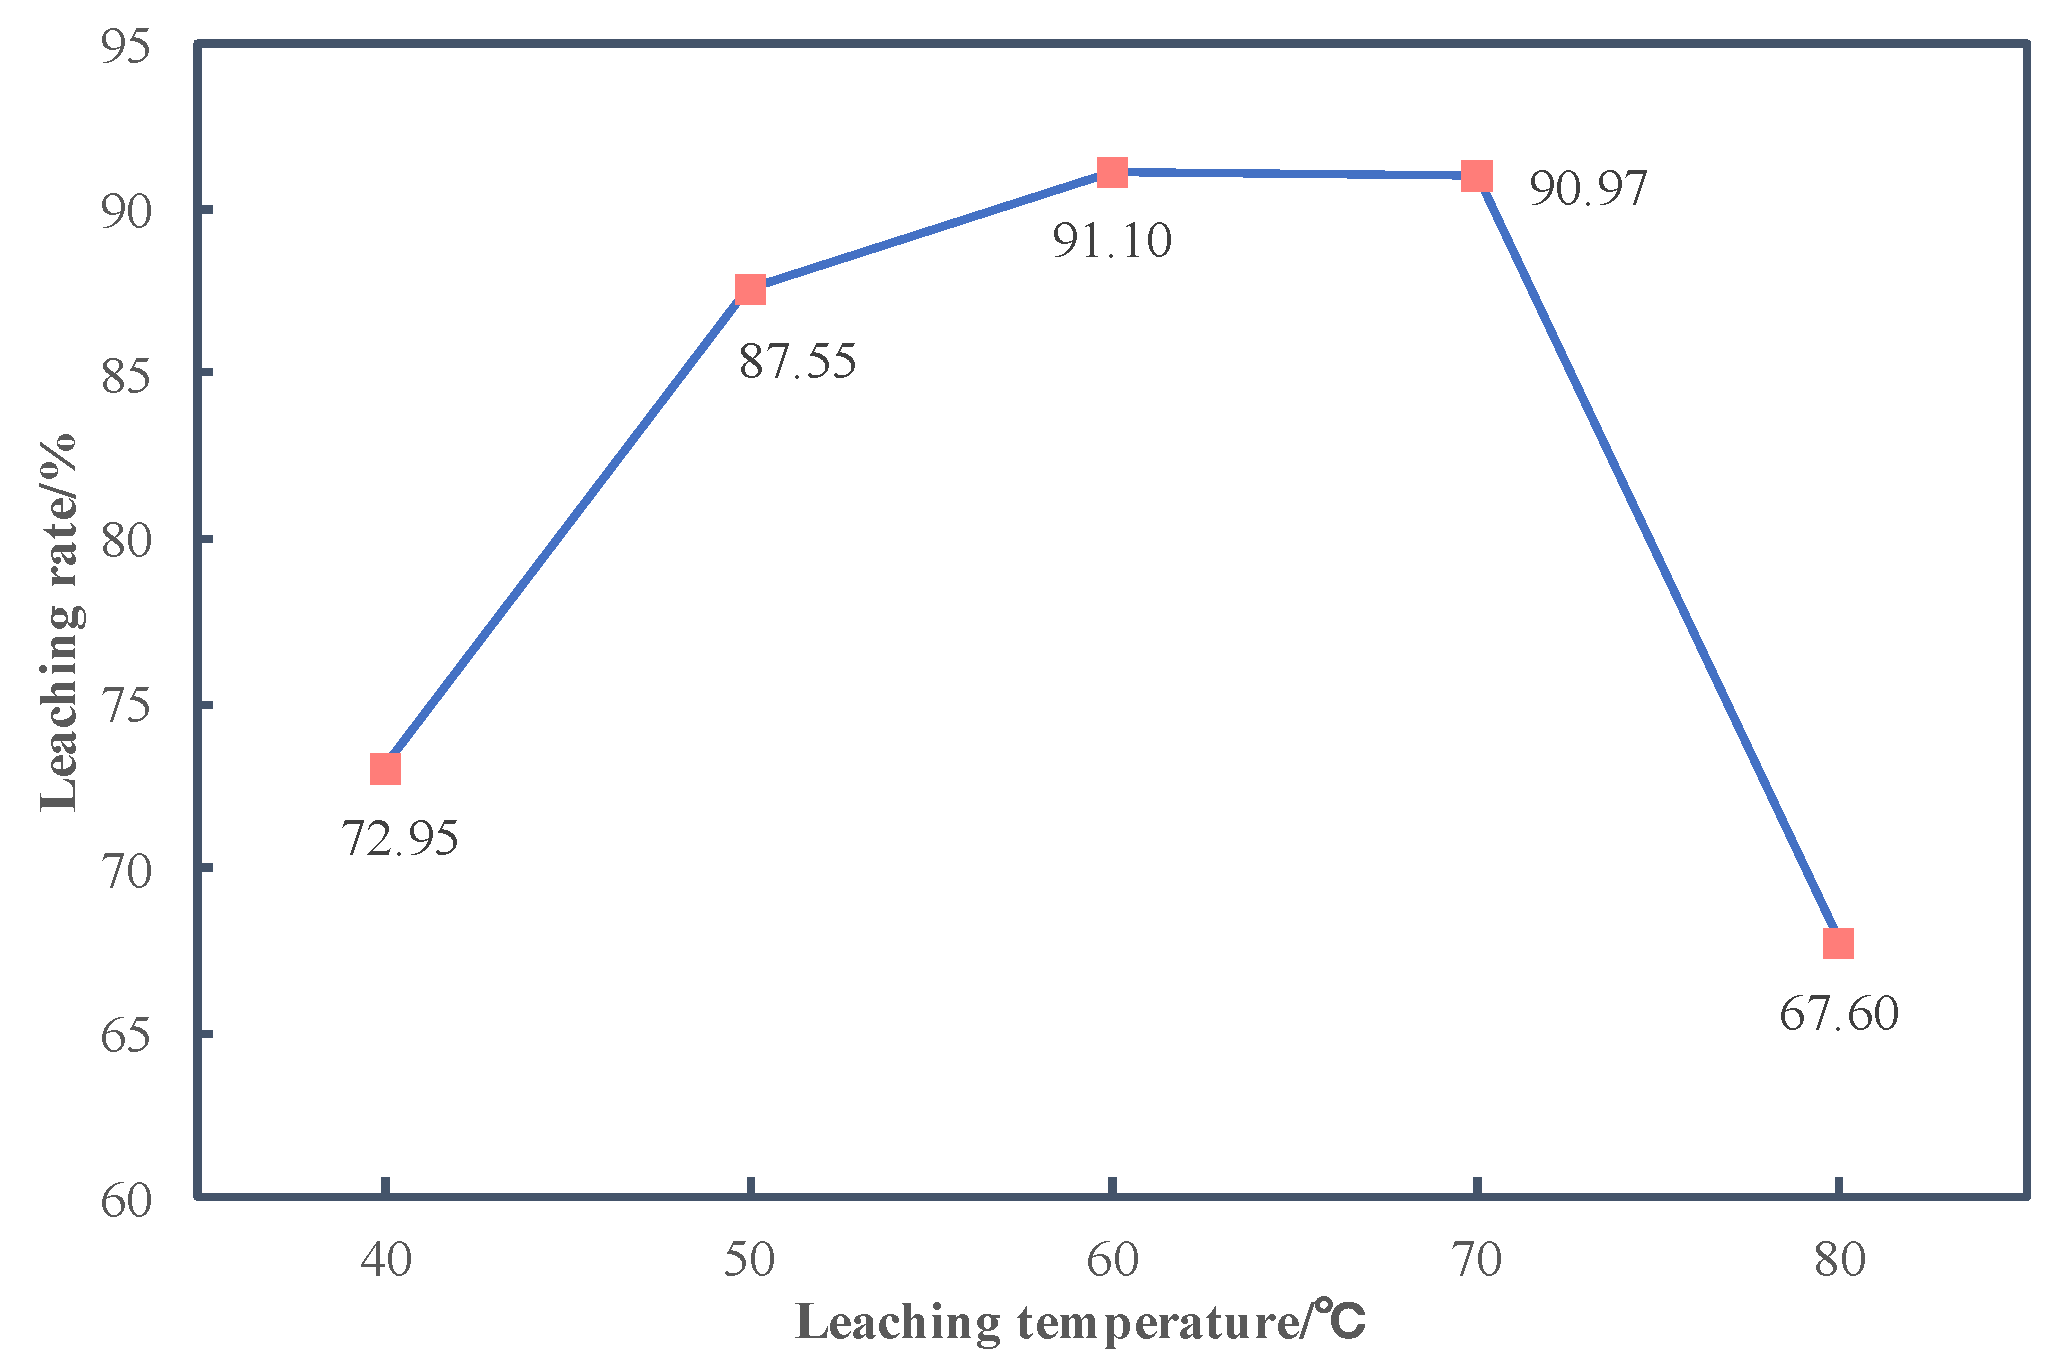
3.2.2. Effects of Temperature on Leaching Rate

To obtain the optimum leaching temperature, a series of leaching experiments were carried out at temperatures of 40, 50, 60, 70 and 80 °C. The other process parameters were set as follows: roasting temperature of 200 °C, roasting time of 90 min, acid/slag ratio of 4:1, leaching time of 60 min and liquid/solid ratio of 3.2:1. The influence of temperature on leaching rate of titanium is shown in Figure 4.
As shown in Figure 4, after the leaching tests, the valuable element of titanium in the Ti-bearing slag separates from the residue and enters the acid leaching liquor. The leaching rate of titanium in the acid leaching liquor increases from 72.95% to 91.1% as the temperature increases from 40 °C to 60 °C. However, the leaching rate sharply decreases when the leaching temperature is over 70 °C. This could be caused by a variety of complex reasons. On the one hand, when the leaching temperature increases within the reasonable range, the reactivity of the interfaces between H2SO4 and Ti-bearing slag and the flowability of the acid leaching liquor are improved effectively. Therefore, the leaching reactions proceed under the optimum dynamic conditions. On the other hand, when the leaching temperature increases further, an insoluble film forming on the Ti-bearing slag surface hinder the proceeding of leaching reaction. Accordingly, the optimum leaching temperature of 60 °C is selected for the subsequent tests.

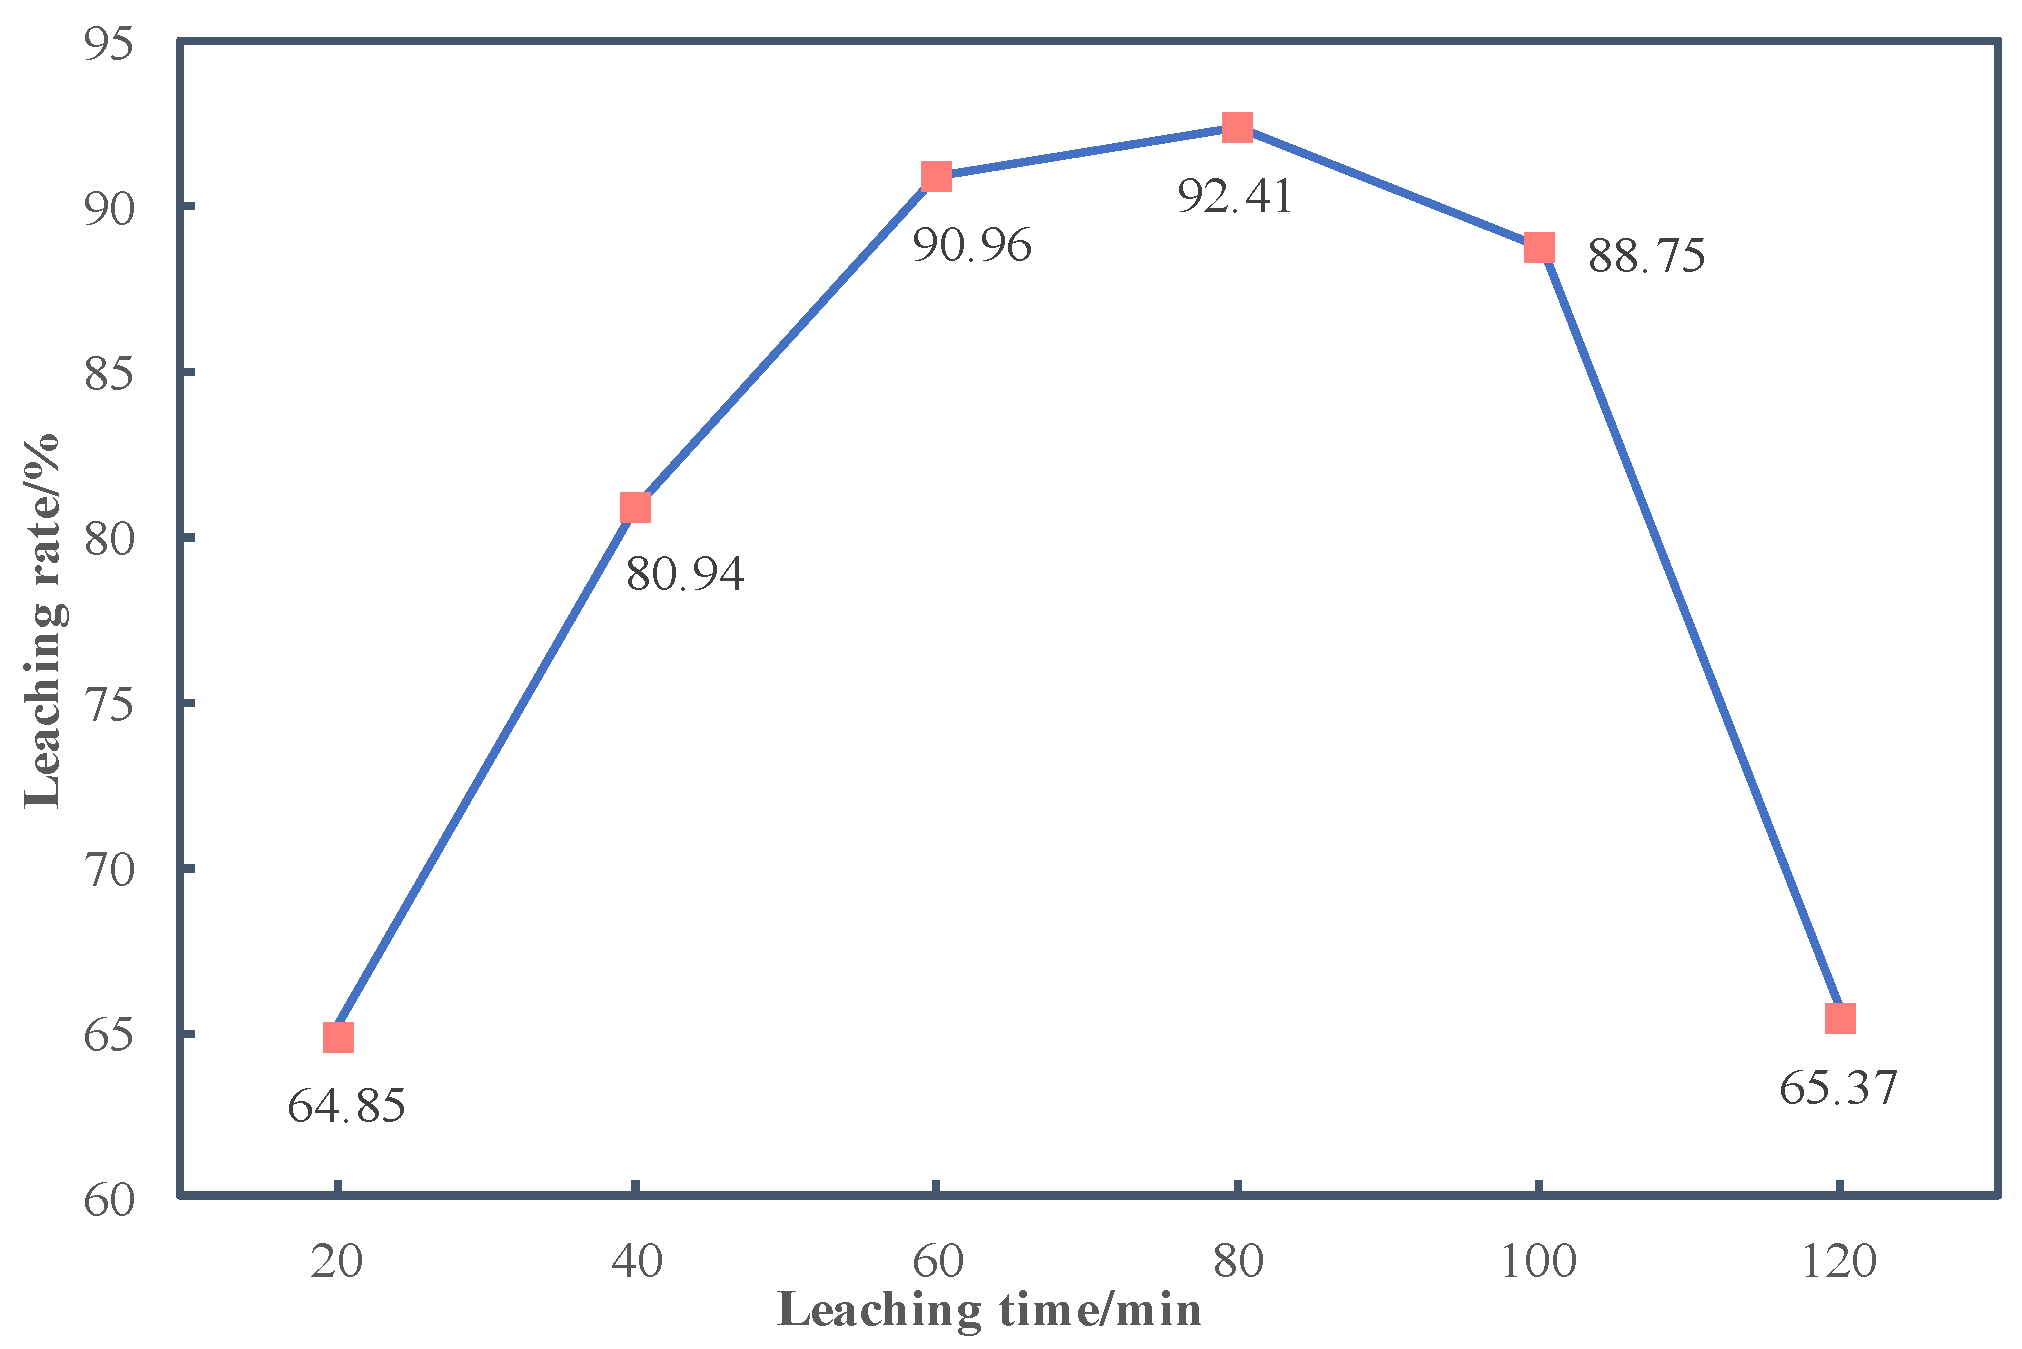
3.2.3. Effects of Reaction Time on Leaching Rate

To optimize the leaching time, a series of leaching experiments were conducted at various times of 20, 40, 60, 80, 100 and 120 min. The other process parameters were kept constant as follows: roasting temperature of 200 °C, roasting time of 90 min, acid/slag ratio of 4:1, leaching temperature of 60 °C, liquid/solid ratio of 3.2:1. The influence of time on leaching rate of titanium is shown in Figure 5.
As shown in Figure 5, the leaching rate of titanium increases from 64.85% to 92.41% as the leaching time increases from 20 min to 80 min. When the leaching time is longer than 80min, the leaching rate of titanium begins to decline. This phenomenon can be explained by the two factors on which the leaching rate of titanium from Ti-bearing slags mainly depends: leaching reaction rate and hydrolyzing reaction rate. In the initial stage, the content of TiO2+ in the leaching system is low, the leaching reaction plays the leading role, and it makes the titanium leached from Ti-bearing slag to the acid leaching liquor. However, with the leaching reaction rising, the content of TiO2+ in the leaching system becomes higher and higher, the hydrolyzing reaction begins to play the leading role, and the hydrous titanium dioxide is generated rapidly. Therefore, the optimum leaching time of 80 min is selected for the subsequent tests.

3.2.4. Effects of Liquid/Solid Ratio on Leaching Rate

To optimize the liquid/solid ratio, a series of leaching experiments are carried out with different liquid/solid ratios of 1.6, 2.4, 3.2, 4.0 and 4.8. The other process parameters are kept constant as follows: roasting temperature of 200 °C, roasting time of 90 min, acid/slag ratio of 4:1, leaching temperature of 60 °C, leaching time of 80 min. The influence of the acid/slag ratio on leaching rate of titanium is shown in Figure 6.
As shown in Figure 6, the leaching rate of titanium obviously increases when the liquid/solid ratio increased from 1.6 to 3.2. However, the leaching rate of titanium decreases from 92.41% to around 88% as the liquid/solid ratio increases further. The reason causing this above phenomenon is because titanium cannot be leached completely when the liquid/solid ratio is relatively low. However, when the liquid/solid ratio is too high, the hydrolyzing reaction is promoted and the hydrous titanium dioxide is generated. Therefore, the optimum liquid/solid ratio of 3.2:1 is selected for the subsequent tests.

3.3. Hydrolyzing of Acid Leaching Liquor

After leaching tests of the Ti-bearing slag, the optimum process conditions for leaching are acid/slag ratio of 4:1, leaching temperature of 60 °C, leaching time of 80 min and liquid/solid ratio of 3.2:1. Based on the above experimental parameters, the acid leaching liquor was obtained and analyzed by the chemical method. The results showed that the content of total titanium was 56.5 g·L−1.

3.3.1. Effects of H+ Concentration on Hydrolyzing Rate

To determine the optimum H+ concentration, various hydrolyzing tests with H+ concentrations of 0.5, 0.75, 1.00, and 1.25 g·L−1 were carried out. The other hydrolyzing process parameters were kept constant as follows: hydrolyzing temperature of 90 °C, hydrolyzing time of 180 min. The influence of H+ concentration on hydrolyzing rate of titanium is shown in Figure 7.
As shown in Figure 7, the hydrolyzing rate of titanium increases from 88.17% to 93.96% as the H+ concentration increases from 0.5 g·L−1 to 0.75 g·L−1. However, the hydrolyzing rate of titanium begins to decrease when the H+ concentration is over 0.75 g·L−1. This is because the hydrolyzing reaction of TiOSO4 in acid leaching liquor can be promoted when the H+ concentration varies in a certain range. But the stability of acid leaching liquor is destroyed as the H+ concentration increases further, and the hydrolyzing rate of titanium decreases as a result.

3.3.2. Effects of Temperature on Hydrolyzing Rate

A series of tests at the temperatures of 70, 80, 90, and 100 °C were carried out to determine the optimum hydrolyzing temperature under the conditions of H+ concentration 0.75 g·L−1 and hydrolyzing time 180 min. The influence of temperature on hydrolyzing rate of titanium is shown in Figure 8.
As shown in Figure 8, the hydrolyzing rate of titanium increases from 70.08% to 96.80% as the temperature increases from 70 °C to 100 °C. The increase in hydrolyzing temperature is beneficial to the hydrolyzing reaction of titanium in acid leaching liquor. This is because, on the one hand, the hydrolyzing reaction of acid leaching liquor is one endothermic reaction, so the high temperature is propitious to the hydrolyzing reaction; on the other hand, Ti3+ in acid leaching liquor can be oxidized to Ti4+ at a higher temperature.
The influence of hydrolyzing temperature on the product morphology is shown in Figure 9. As shown in Figure 9a,b, the size of product increases with the hydrolyzing temperature increasing from 80 °C to 100 °C. At the temperature of 80 °C, the product is precipitated with a high nucleation rate and relatively low growth rate; thus, a large number of grains are generated, but the size of the grain is relatively small. At the temperature of 100 °C, two main reasons lead to the growth of grains. On the one hand, the saturation and viscosity of solution are decreased at high temperature and the mass transfer coefficient is increased; thus, the growth rate of grains greatly increases. On the other hand, the energy of molecular motion increases with the temperature increases and the recrystallization of grains is enhanced.

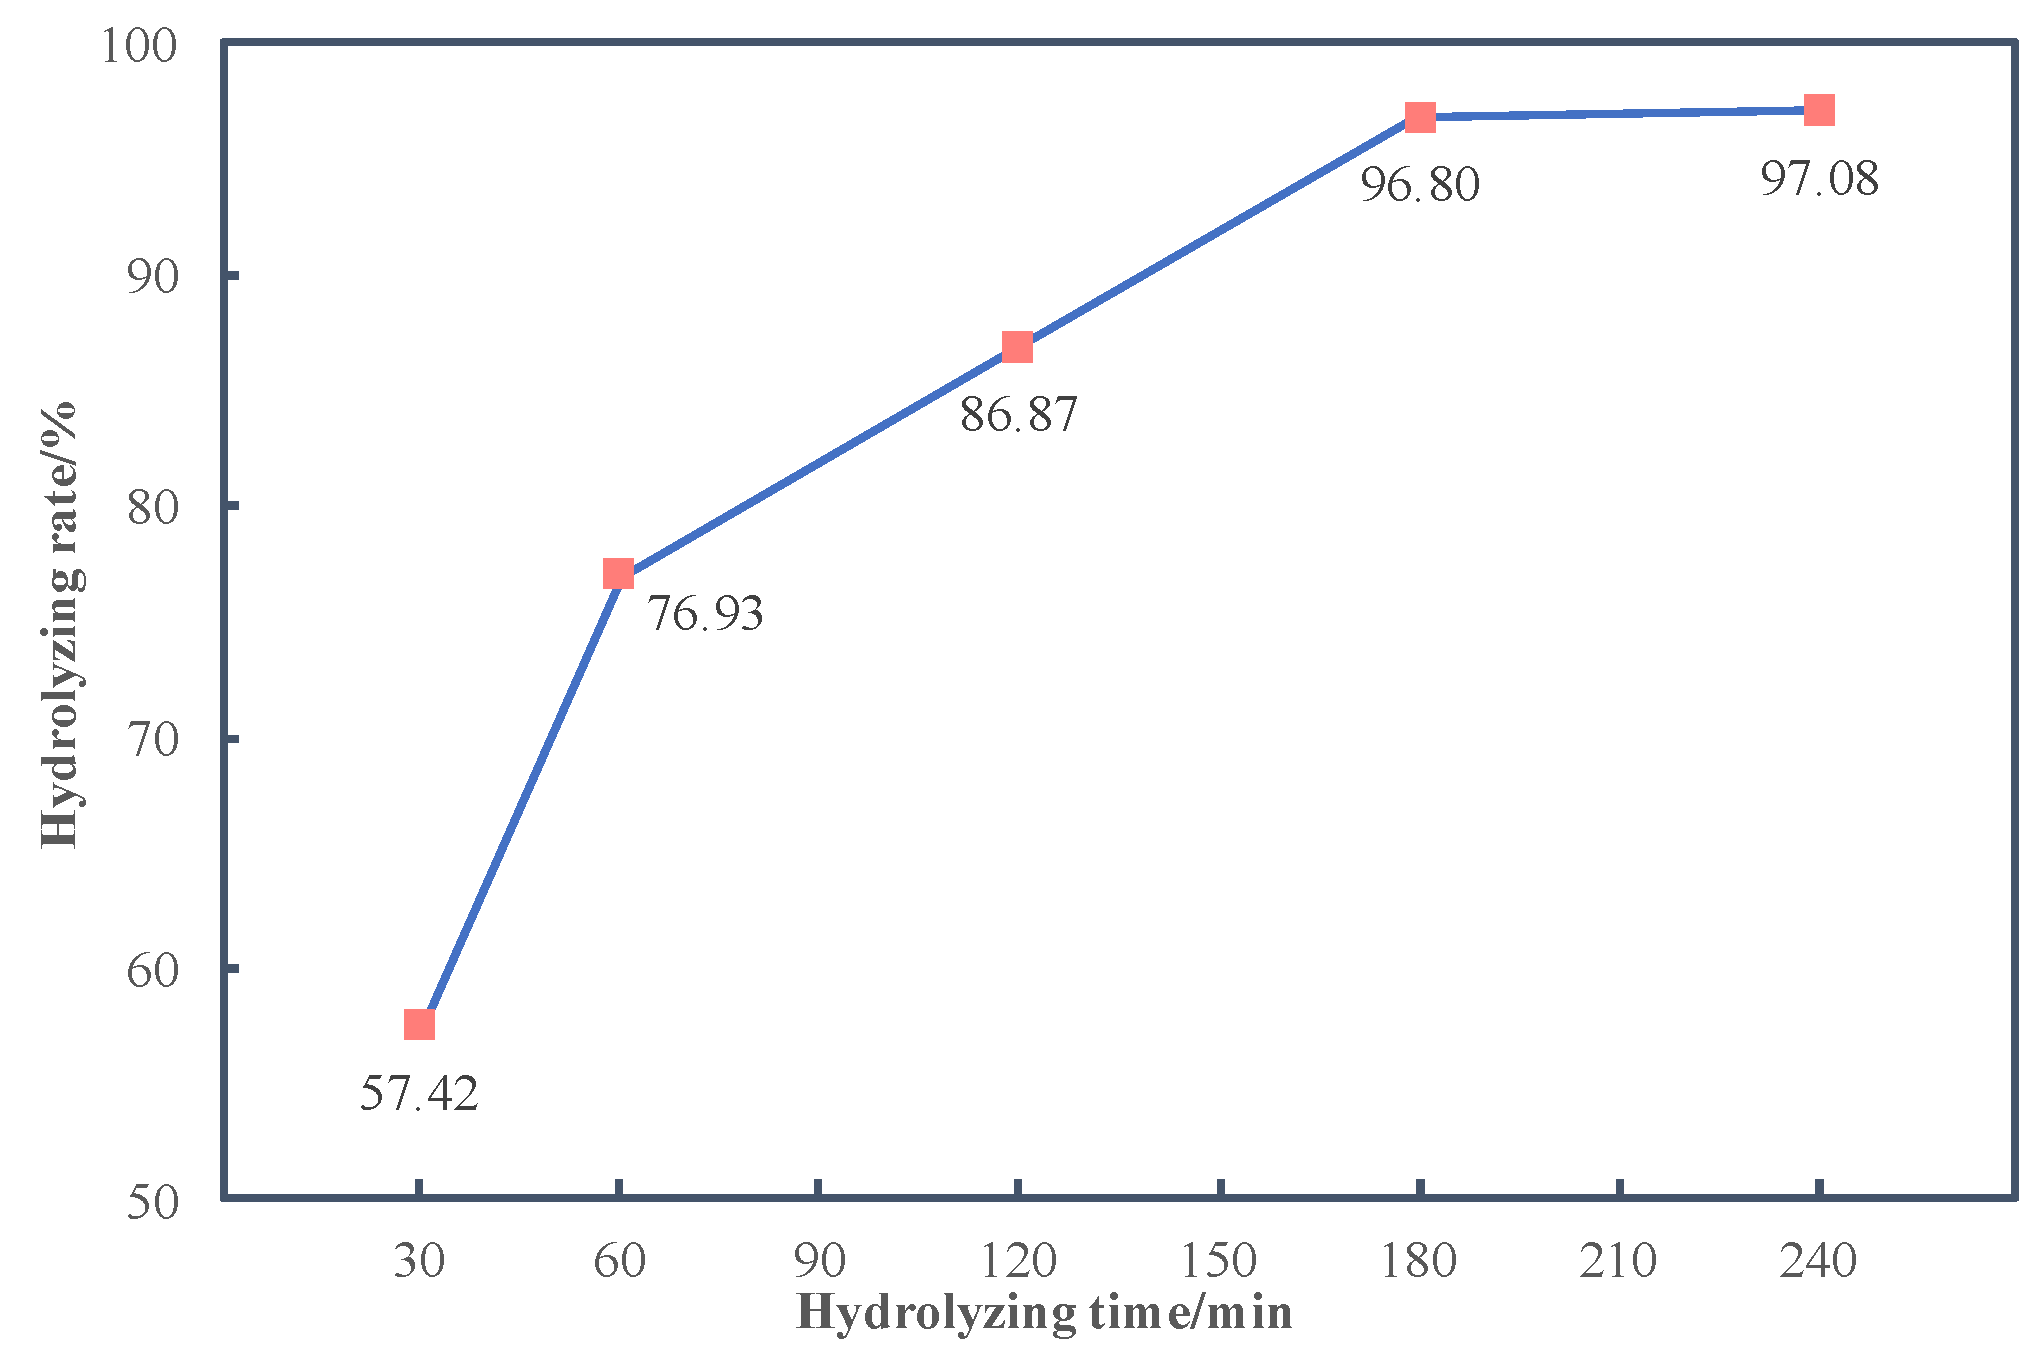
3.3.3. Effects of Time on Hydrolyzing Rate

To determine the optimum hydrolyzing time, a series of tests at the times of 30, 60, 120, 180 and 240 min are carried out under the conditions of H+ concentration 0.75 g·L−1 and hydrolyzing temperature 100 °C. The influence of time on hydrolyzing rate of titanium is presented in Figure 10.
As shown in Figure 10, the hydrolyzing rate of titanium increases from 57.42% to 96.80% as the hydrolyzing time increases from 30 min to 180 min, and the hydrolyzing rate holds the line even if the hydrolyzing time keeps increasing. On the one hand, extend hydrolyzing time is beneficial to the growth of grains and the generation of hydrous titanium dioxide. On the other hand, the hydrous titanium dioxide would be re-dissolved after reaches equilibrium as the hydrolyzing time increases further. Therefore, an optimum hydrolyzing time of 180 min is selected for the subsequent tests.
The influence of hydrolyzing time on the product morphology is shown in Figure 11. As shown in Figure 11a,b and Figure 9b, the size of the product increases with the hydrolyzing time increasing from 30 min to 180 min. When the growth rate is larger than the generation rate of hydrous titanium dioxides, the product size starts to grow up. In addition, as the extension of hydrolyzing time, the crystal nucleus of the grains begins to aggregate and form the agglomeration. This may lead to a negative effect on product growth.

4. Conclusions

According to the comprehensive comparisons at a series of experimental conditions, the optimum conditions for leaching experiments are obtained as follows: the acid/slag ratio of 4:1, the leaching temperature of 60 °C, the leaching time of 80 min and the liquid/solid ratio of 3.2:1. Under the above conditions, the leaching rate of titanium in Ti-bearing slag gets 92.41%. The optimum conditions for hydrolyzing experiments are the H+ concentration of 0.75 g·L−1, the hydrolyzing temperature of 100 °C and the hydrolyzing time of 180 min. Under the above conditions, the hydrolyzing rate of titanium in acid leaching liquor is 96.80%. After the leaching and hydrolyzing experiments, the recovery rate of titanium from the Ti-bearing slag reaches 89.45%, which is feasible at the technological level.

Author Contributions

Validation, H.D.; Writing—original draft, S.C.; Writing—review & editing, Y.L. All authors have read and agreed to the published version of the manuscript.

Funding

This research received no external funding.

Institutional Review Board Statement

Not applicable.

Informed Consent Statement

Not applicable.

Data Availability Statement

Not applicable.

Acknowledgments

This work was supported by Research Project from Chongqing Committee of Education (KJQN201801408).

Conflicts of Interest

The authors declare no conflict of interest.

References

  1. Zhang, Y.; Lu, M.; Zhou, Y.; Su, Z.; Liu, B.; Li, G.; Jiang, T. Interfacial Interaction between Humic Acid and Vanadium, Titanium-Bearing Magnetite (VTM) Particles. Miner. Process. Extr. Met. Rev. 2018, 41, 75–84. [Google Scholar] [CrossRef]
  2. Chen, D.S.; Song, B.; Wang, L.N.; Qi, T.; Wang, Y.; Wang, W.J. Solid state reduction of Panzhihua titanomagnetite concentrates with pulverized coal. Miner. Eng. 2011, 24, 864–869. [Google Scholar] [CrossRef]
  3. Chen, S.-Y.; Chu, M.-S. Metalizing reduction and magnetic separation of vanadium titano-magnetite based on hot briquetting. Int. J. Miner. Metall. Mater. 2014, 21, 225–233. [Google Scholar] [CrossRef]
  4. Li, W.; Fu, G.Q.; Chu, M.S.; Zhu, M.Y. Oxidation induration process and kinetics of Hongge vanadium titanium-bearing magnetite pellets. Ironmak. Steelmak. 2017, 44, 294–303. [Google Scholar] [CrossRef]
  5. Chen, S.; Fu, X.; Chu, M.; Liu, Z.; Tang, J. Life cycle assessment of the comprehensive utilisation of vanadium titano-magnetite. J. Clean. Prod. 2015, 101, 122–128. [Google Scholar] [CrossRef] [Green Version]
  6. Chen, W.; Dong, Z.; Jiao, Y.; Liu, L.; Wang, X. Preparation, sintering behavior and consolidation mechanism of vanadium-titanium magnetite pellets. Crystals 2021, 11, 188. [Google Scholar] [CrossRef]
  7. Li, W.; Fu, G.; Chu, M.; Zhu, M. An effective and cleaner process to recovery iron, titanium, vanadium, and chromium from Hongge vanadium titanomagnetite with hydrogen-rich gases. Ironmak. Steelmak. 2020, 1–7. [Google Scholar] [CrossRef]
  8. Fu, G.; Li, W.; Chu, M.; Zhu, M. Influence mechanism of SiO2 on the oxidation behavior and induration process of hongge vanadium titanomagnetite pellets. Metall. Mater. Trans. B 2020, 51, 114–123. [Google Scholar] [CrossRef]
  9. Akhgar, B.N.; Pazouki, M.; Ranjbar, M.; Hosseinnia, A.; Keyanpour-Rad, M. Preparation of nanosized synthetic rutile from ilmenite concentrate. Miner. Eng. 2010, 23, 587–589. [Google Scholar] [CrossRef]
  10. Chernet, T. Applied mineralogical studies on Australian sand ilmenite concentrate with special reference to its behaviour in the sulphate process. Miner. Eng. 1999, 12, 485–495. [Google Scholar] [CrossRef]
  11. Han, K.N.; Rubcumintara, T.; Fuerstenau, M.C. Leaching behavior of ilmenite with sulfuric acid. Metall. Trans. B 1987, 18, 325–330. [Google Scholar] [CrossRef]
  12. Jabłoński, M.; Przepiera, A. Kinetic Model for the Reaction of Ilmenite with Sulphuric Acid. J. Therm. Anal. Calorim. 2001, 65, 583–590. [Google Scholar] [CrossRef]
  13. Lasheen, T.A.I. Chemical benefication of Rosetta ilmenite by direct reduction leaching. Hydrometallurgy 2005, 76, 123–129. [Google Scholar] [CrossRef]
  14. Li, C.; Liang, B.; Guo, L.-H. Dissolution of mechanically activated Panzhihua ilmenites in dilute solutions of sulphuric acid. Hydrometallurgy 2007, 89, 1–10. [Google Scholar] [CrossRef]
  15. Sasikumar, C.; Rao, D.S.; Srikanth, S.; Ravikumar, B.; Mukhopadhyay, N.K.; Mehrotra, S.P. Effect of mechanical activation on the kinetics of sulfuric acid leaching of beach sand ilmenite from Orissa, India. Hydrometallurgy 2004, 75, 189–204. [Google Scholar] [CrossRef]
  16. Zhang, W.; Zhu, Z.; Cheng, C.Y. A literature review of titanium metallurgical processes. Hydrometallurgy 2011, 108, 177–188. [Google Scholar] [CrossRef]
  17. Puvvada, G.V.K.; Sridhar, R.; Lakshmanan, V.I. Chloride metallurgy: PGM recovery and titanium dioxide production. JOM 2003, 55, 38–41. [Google Scholar] [CrossRef]
  18. Rhee, K.I.; Sohn, H.Y. The selective chlorination of iron from llmenite ore by CO-Cl2 mixtures: Part I. intrinsic kinetics. Metall. Trans. B 1990, 21, 321–330. [Google Scholar] [CrossRef]
  19. Van Deventer, J.S.J. Kinetics of the selective chlorination of ilmenite. Thermochim. Acta 1988, 124, 205–215. [Google Scholar] [CrossRef]
  20. Zhang, Y.; Qi, T.; Zhang, Y. A novel preparation of titanium dioxide from titanium slag. Hydrometallurgy 2009, 96, 52–56. [Google Scholar] [CrossRef]
  21. Chen, S.Y.; Chu, M.S. A new process for the recovery of iron, vanadium, and titanium from vanadium titanomagnetite. J. S. Afr. Inst. Min. Metall. 2014, 114, 481–488. [Google Scholar]
Figure 1. Schematic diagram of experimental procedure and apparatus.
Crystals 11 00327 g001
Figure 2. XRD pattern and EDS analysis of separated tailings.
Crystals 11 00327 g002
Figure 3. Effect of acid/slag ratios on leaching rate of titanium.
Crystals 11 00327 g003
Figure 4. Effect of temperature on leaching rate of titanium.
Crystals 11 00327 g004
Figure 5. Effect of time on leaching rate of titanium.
Crystals 11 00327 g005
Figure 6. Effect of liquid/solid ratio on leaching rate of titanium.
Crystals 11 00327 g006
Figure 7. Effect of H+ concentration on hydrolyzing rate of titanium.
Crystals 11 00327 g007
Figure 8. Effect of temperature on hydrolyzing rate of titanium.
Crystals 11 00327 g008
Figure 9. SEM images of hydrolyzing product at different temperatures: (a) 80 °C, 180 min and (b) 100 °C, 180 min.
Crystals 11 00327 g009
Figure 10. Effect of temperature on hydrolyzing rate of titanium.
Crystals 11 00327 g010
Figure 11. SEM images of hydrolyzing product at different times: (a) 100 °C, 30 min and (b) 100 °C, 120 min.
Crystals 11 00327 g011
Table 1. Chemical compositions of VTM and industrial coal (mass%).
VTMCoal
TFeFeOV2O5TiO2CaOSiO2MgOAl2O3AadVadMadFCad
53.9131.130.5213.030.683.202.713.828.8827.521.9261.68
Table 2. Chemical composition of the Ti-bearing slag (mass%).
TiO2CaO SiO2MgOAl2O3TFe
40.911.4714.0412.9512.348.78
Publisher’s Note: MDPI stays neutral with regard to jurisdictional claims in published maps and institutional affiliations.

