1. Introduction
As the world is progressively evolving towards a photonic future, there is a need for miniaturization and functionalization of photonic devices (including photonic chips, wavelength converters, lenses, retardation waveplates, waveguides, etc.) [
1]. In this context, femtosecond (fs)-laser irradiation in glass materials is an attractive way to functionalization [
2,
3]. By using temporal ultra-short laser pulses (e.g., 10–1000 fs) with very high intensities (up to 10–100 TW/cm
2), highly selective local modifications (few µm
3 in volume) can be achieved thanks to multiphotonic absorption of the laser light.
Different kinds of materials modifications can be obtained, depending on the glass material considered, as well as laser parameters (e.g., pulse energy, repetition rate, and scanning speed). For instance, in silica glass, both positive and negative index contrasts can be achieved [
4,
5]. The glass response to fs-laser is manifold, and includes, for instance, formation of defects, densification, fictive temperature changes, stress fields, crystallization, and so forth. The latter (crystallization) is a promising pathway in the functionalization of optical devices. The precipitation in glasses of several crystals has drawn interest for their nonlinear, or electro-optic properties, among which we can cite Fresnoite (barium or strontium-based [
6]), barium borate (BaB
2O
4) [
7], LaBGeO
5 [
8,
9], or again Lithium niobate (LiNbO
3) [
10], but many others exist (see, for instance, [
11] for an extended and thorough review).
Given the plethora of crystals that can be induced from glasses, it is therefore important to comprehend the mechanisms that may lead to property tunability. In this work, we investigate the role played by scanning speed (v) vs. the energy during the crystallization process, and specifically draw our attention to nano-crystallization orientation and self-organized phase separation (so called nanogratings). From an application standpoint, the goal is to provide means to target future glass fabrication in order to maximize scanning speed and property response (e.g., second harmonic generation i.e., SHG, birefringence), while keeping scattering losses as low as possible. From a fundamental perspective, this work aims to better understand the mechanisms that drive light-matter structuring in these glasses. More specifically, we intend to highlight links between scanning speed and the resulting structuring (crystallization, its size and orientation distribution, and nanograting formation). To conduct this study, two glasses were fabricated with the melt-quenching technique, with the following batch composition (mol%): 33Li2O-33Nb2O5-34SiO2 (labeled as LNS), and 33Li2O-33Nb2O5-13SiO2-21B2O3 (labeled as LNSB). The addition of B2O3 is known to lower the crystallization temperature and increase the crystallization rate. Subsequently, each glass sample was irradiated by fs-laser while laser parameters are varied (scanning speed, pulse energy, and laser polarization).
In the subsequent Introduction
Section 1.1,
Section 1.2,
Section 1.3 and
Section 1.4, we provide a brief discussion on several important points that will give the reader context in order to better comprehend the Results and Discussion Sections. First, we discuss background information on oriented crystallization in lithium niobium silicate glasses. Secondly, we consider the role played by the incubation time and its impact on the time-temperature-transformation (TTT) crystallization diagram in LNS glass. Then, the temperature profile evolution (in space and time) after laser irradiation inside the glass is addressed, as well as the impact of pulse temporal overlapping. Finally, we highlight the choice of laser parameters, using a pulse energy-repetition rate landscape, which are prerequisites to induce oriented nano-crystallization.
1.1. Oriented-Crystallization of LiNbO3 Induced by Fs-Laser in Lithium Niobium Borosilicate Systems
In a series of papers [
10,
12,
13,
14,
15,
16], our group has extensively investigated fs-laser-induced crystallization in lithium niobium silicate (generically labeled as LNS) glass, and more specifically the material response upon laser parameter changes including pulse energy (E
p), pulse repetition rate (f), and laser polarization direction (with respect to the scanning direction). Among these studies, it was pointed out that precipitated nanocrystals inside LNS could be oriented in space through a control of laser polarization. At low pulse energies (typ. ~0.5 µJ/pulse as per this paper), a maximum SHG optical response was observed perpendicularly to the writing laser polarization direction, no matter its orientation. This SHG response was attributed to the crystallization of LiNbO
3 nanocrystals, the latter having their polar axes perpendicular to the laser polarization. This texturing of LiNbO
3 nanocrystals was later confirmed by electron backscatter diffraction (EBSD). At slightly higher pulse energies (typ. ~1.25 µJ/pulse as per this paper), a second texture appeared, indicating that LiNbO
3 polar axis was partly oriented in the direction of laser polarization in these conditions. The existence domain of this texture still must be confirmed. These results are in agreement with previous results [
17]. Very recently ([
18]), we reported that B
2O
3 incorporation into LNS glass preserved the dynamical modifications yielding to SHG response, while keeping its polarization-dependence. This added an important parameter, namely the laser polarization, to the engineer’s toolbox for optical device elaboration and tuning.
1.2. Incubation Time and Temperature-Time-Transformation (TTT) Curve in Static Mode
In the same previous work [
18] as described above, we observed that the addition of B
2O
3 drastically reduced the incubation time with respect to B
2O
3-free (i.e., LNS) glass. The incubation time is the time taken, upon fs-laser irradiation, until the observation of the SHG signal. The variation of the incubation time with respect to the average laser power and upon the addition of B
2O
3 to the glass produces a displacement of the time-temperature-transformation (TTT) curve. Using results from [
18], the incubation time is represented in
Figure 1a, while the TTT curve for LNS is reported in
Figure 1b.
Now, to further pinpoint the decrease in the incubation time when adding B
2O
3 into LNS glass, and to make the link with the TTT diagram, we must consider the temperature distribution upon (pulsed) laser irradiation. For a single pulse with a given pulse energy (E
p), the associated thermal deposition (transfer to the lattice vibrations) leads to a temperature distribution profile T(r, t). The latter is as wide as the beam waist diameter immediately after the pulse is deposited, which corresponds to the period start as defined by t
1 in
Figure 1c. Following this initial step, the T profile broadens very rapidly due to heat diffusion following a bell shape, and consequently, the maximum temperature (at the center) conversely decreases since the amount of heat given to the system is constant. Finally, at the end of a period, T slowly reaches a minimum value, T
min, towards the end of the period. This temperature profile evolution is illustrated in
Figure 1c.
Now in the multipulses regime, at radius r including the center, the temperature T(r, t) oscillates between T
max (r, N) and T
min (r, N) [
19]. N corresponds to the number of pulses deposited before the time t, and τ
p is the period of the pulses. When T(r, t) is computed within one time period, it is clear that close to the center (r < 3w
0, w
0 being the width of the beam at 1/e) and for weak time overlapping pulses (τ
p >> τ
D, the heat diffusion time) there is no crystallization:
- (1)
neither at the beginning of the period, T is too high (several thousand degrees) during a short time
- (2)
nor at the end of the period, T is too low during a long part of the period (specifically when the pulse time overlapping is small).
So, the “active part” of the period is between T
max and T
min. Consequently, our reasoning is based on the averaged power delivered within a pulse time period. The average temperature
(the mathematical expression can be found in
Appendix A Equations (A2) and (A3)) appears to be a function of the averaged power
and of the number of pulses N. Note that
is constant within each period.
For a given
, the
distribution is thus a bell shape curve around the beam axis that does not oscillate anymore but slowly evolves with respect to time i.e., N. Now looking at the TTT diagram in
Figure 1b, several scenarios can be envisioned. First, if maximum
is just above the crystallization onset temperature, T
x, and if the irradiation time is at least equal to the incubation time, crystallization will occur. Now, if the maximum
increases slightly (though an increase of
) approaching to T
p (crystallization temperature peak), a larger area will be above T
x and crystallize. Finally, if
max > T
p, there will be a radius r > 0 where T = T
p that will crystallize first rather than the center of the bell. The apparent incubation time measured with the laser is thus a uniform decreasing function on
and so on
(see
Section 4.3) as in
Figure 1a.
1.3. Heat Accumulation (Multi-Pulse Irradiation) Considerations and Impact on Crystallization
Within heat accumulation regime, the spatial temperature profile evolution (
Figure 1c) described above for a single pulse is expected to be modified by subsequent pulses while the contributions from the former ones are not vanished yet. This will influence the temperature distribution in space. The time needed to reach a steady state of overlapping pulses (in time) can be associated with a minimal number of pulses, labeled as N
ssm(r) in
Appendix A (Equation (A5)). In this case, a memory effect is at play from one pulse to the other. It seems that growth of nanocrystals and nanogratings is of such category. This may also explain that the incubation time is dependent on the average power and not only on pulse energy. Several key features can be extracted from modeling heat deposition and temperature profile in multi-pulse regime (see
Appendix A for more details regarding the hypotheses and the calculations used):
- (1)
when there is no pulse overlap in time; typ. when the pulse period (τP) is greater than a few hundreds of the diffusion time (τD~²/4DT, is the beam waist radius at 1/e and DT is the thermal diffusivity):
E
p (and more specifically the absorbed part of E
p) sets the temperature amplitude (T
0 in
Appendix A, T
0 = 3⋅A⋅E
p/(4⋅π⋅ρ⋅C
p⋅
3)) and this is not dependent on the thermal conductivity. On the contrary, the shape of T(r, t) is from the solution of the Fourier’s equation with one pulse and is defined by w, f and the thermal diffusivity D
T.
Note that f/v controls the density of pulses per μm (PD) or the pulse overlap in space. PD is ranging from <2000 to 200,000 pulses/μm in this present work. Moreover, the number of pulses deposited punctually is given by 2PD ( is the beam radius).
- (2)
when there is an important overlap between pulses in time (typ. τP < τD/10):
- (3)
when the pulse overlap is intermediate (typ. τP~τD):
An average approximation may be considered for the temperature.
Case n°1:: this corresponds to an average temperature during the total pulse period, numbered N.
Case n°2: we can say that below a given temperature (Tmin), no effect happens (e.g., below Tg for a crystallization, but another Tmin can be used for another process depending on the kinetics involved). No effect occurs also above a given Tmax (e.g., Tm or liquidus temperature in the case of crystallization). Consequently, the average temperature is bound as in the next expression where t1(N) = inf (Tmax(r, N), Tm) and t2(N) = sup (Tg, Tmin(r, N)). It is worth pointing out that for this suggestion, . Note: sup(.,.) and inf(.,.) mean the largest and the smallest values of the quantities in the brackets.
Therefore, the important parameter to consider is the pulse overlapping in time. It is ruled by the ratio R
t = t
p/t
D. For the glasses to be considered in this study, R
t = 18 as D
T = 9∙× 10
−7 m
2/s either for LNS or LNSB glasses. The number of overlapping pulses is around 10
−15 (see
Appendix A Equation (A5)). This means that pulses deposited between 10 and 15 time periods before the last pulse have a negligible contribution to the pulse’s summation. Note that our experiments herein are rather in the conditions of weakly overlapping pulses. Consequently, from the beginning of irradiation and after 10–15 pulses, a steady state is reached where T oscillations become repetitive. However, in most of the observed phenomena, the relevant quantity is the average temperature
that becomes time independent after 15 pulses. It is written
in
Appendix A Equation (A4) (for instance) and its time-independent shape is thus very convenient to discuss the effect of thermal treatment in scanning mode with a laser.
In this work, we will mostly focus on the effect played by the scanning speed. As shown above, the latter plays a different role than the pulse energy (Ep). It must be pointed out that the heat diffusion speed (~4DT/, i.e., a few 10 m/s in our experimental conditions) is much larger than the scanning speed (typ. <1 mm/s). Consequently, the scanning speed is expected to have a negligible effect on the temperature distribution profile.
1.4. Phase Separation Induced by Fs-Laser in Lithium Niobium Silicate Glass and Choice of Laser Parameters in This Study
In addition to precipitate oriented nano-crystals in LNS glass, it is possible to induce laser polarization-oriented phase separation upon laser irradiation under the form of lamellar-like structures perpendicular to the laser polarization [
13]. These lamellas are quasi-periodic and form an array of crystalline phase (LiNbO
3-rich) and glass phase (SiO
2-rich) at the sub-wavelength scale [
13]. A direct consequence of this re-organization is the appearance of measurable form birefringence, which can be characterized under an optical microscope with polarized light through optical retardance measurements [
13,
21].
To study the effect of scanning speed on this phase separation, we first need to find the adequate laser conditions to fall within the domain of orientable nanocrystals. In a previous publication on LNS glass with a close composition to the LNS glass used herein, three laser-induced modification regimes were stated [
14] as highlighted in
Figure 2a using a Ep–f landscape. There is a first regime at low pulse energies where the material remains in a vitreous state. In this regime, both the refractive index and the etching rate are modified (isotropically), which is associated with a change of fictive temperature (a parameter characterizing the degree of disorder in glass). A second regime appears at higher pulse energies (in fact above an averaged incident laser power of 0.16 W), where nano-crystallization is observed, and that is textured such that the polar axis of the nanocrystals is perpendicular to the writing laser polarization. Then, increasing the pulse energy, a third regime appears (above an average incident power around 0.32 W) where larger crystallized zones with the same orientation appear. In this case, a part of the heat-affected volume (HAV) is melted and crystallizes driven by the peripheral part of the HAV that has not melted. In our conditions and as will be detailed in the Materials and Methods Section, we used two pulse energies: 0.5 and 1.0 µJ/ pulse (at f = 200 kHz), which correspond to 0.1 and 0.2 W, respectively. For completeness, based on previous experiments carried out in the samples investigated herein [
18], we could identify the thresholds (T1, T2, T3) for the 3 regimes. Therefore, in
Figure 2b we place the thresholds on a similar E
p–f landscape found for LNS. It is worth pointing out that the LNSB glass would exhibit slightly lower threshold values. With the experimental conditions considered in this paper, we are in the regime of oriented nano-crystals formation.
Finally, in [
12], the effect of the scanning speed in regime 2 has not been investigated deeply but pointed nevertheless an effect. At an energy of 1.4 µJ, the orientable possibility was seen for 25 µm/s with the polar axis perpendicular to the laser polarization; but for 10 µm/s there was another texture with the polar axis parallel to the laser polarization [
17]. On the other hand, at high pulse energies (4.2 µJ), the authors from [
22] obtained a perfect single texture (a third one with the polar axis aligned along the direction of scanning) in the whole heat-affected volume (HAV) for speeds lower than about 25 µm/s. However, at this pulse energy, the laser track width is a bit large for a single-mode waveguide (25 µm). Nevertheless, these works showed that controlling the scanning speed may enable the control of nano-/micro-crystallization of the laser track.
2. Materials and Methods
The two glasses investigated in this work were fabricated using the conventional melt-quenching technique. These glasses are the same as the ones used in Ref. [
18]. The targeted compound concentration (in mol%) of each glass is: 33Li
2O-33Nb
2O
5-34SiO
2 (labeled as LNS) and 33Li
2O-33Nb
2O
5-13SiO
2-21B
2O
3 (labeled as LNSB). Briefly, powders of Li
2O
3, SiO
2, and Nb
2O
5 (and H
3BO
3 for LNSB glass) were crushed together in acetone to homogenize the powder mixture. Subsequently, each powder batch was placed inside a platinum crucible and dried at 200 °C for ~2 h. Following this, the temperature was increased up to 1400 °C (LNS) and 1350 °C (LNSB) and set at these temperatures for 1.5 h. Then, the molten mixture was quenched between two metal plates preheated at around ~350 °C and maintained at this temperature for about 30 min. The quenched glass formed a plate about 1-mm thick. Finally, few pieces of each glass sample were polished on top and bottom surfaces until optical roughness was reached. Each glass sample was thus placed on a motorized translation stage and subsequently irradiated using a femtosecond laser (Satsuma, Amplitude Systèmes Ltd. Pessac, France, λ = 1030 nm, pulse duration = 250 fs, numerical aperture (NA) = 0.6). Each irradiation was performed with the laser focal point situated approximately 240 µm (in air) below the sample top surface. The translation stage enables a displacement in the XY plane, while the laser beam direction is along the Z direction. The experimental setup is displayed in
Figure 3. Here, the reference in the direction of writing laser polarization is given by +X in the XY plane (illustrated by e in
Figure 3); the scanning direction is identified as S in the same figure.
Lines were written in the plane perpendicular to the laser propagation direction (i.e., the XY plane) at various scanning speeds (from 5 to 600 μm/s). A half-wave plate placed along the beam path controlled the linear polarization. 5 mm-long lines (at f = 200 kHz) were written inside each glass sample (LNS and LNSB), using two laser polarization configurations: parallel (labeled as Yy), and perpendicular (labeled as Yx) to the laser scanning direction (being along the Y axis, or S). Other parameters were varied, including pulse energy (0.5 and 1.0 µJ), and scanning speed. At this point, it is worth to point out that prior to each scanning, the sample was irradiated with a static beam with a time at least equal to the incubation time. The minimum scanning speed was set to 1 µm/s, and the maximum scanning speed was determined once no green light could be detected during the irradiation. This green light is characteristic of SHG induced by LiNbO3, and no light detected was indicative that no more crystallization occurred during the inscription (typically at speeds of few hundreds of µm/s at a pulse energy of 1 µJ).
To investigate the differences of the lines inscribed in both LNS and LNSB and when scanning speed is varied, we used an Olympus BX51 optical microscope (Olympus). A first observation was done under white light to gain general insights on the laser track transparency, homogeneity, and dimensions. A second analysis was performed under polarized light to detect birefringence, characteristic of textured nano-scale phase separation, and neutral axis directions. Using a first-order (full wave) retardation waveplate, the slow and fast axes of the lines (if birefringent) have been determined. Finally, we measured the linear retardance (R) at the center of the irradiated lines, using the De Sénarmont compensator technique. R is proportional to the birefringence (B) through the relation R = B × L, where L is the thickness of the birefringent object.
Finally, to better comprehend the origin of the differences observed in optical microscopy, the laser track cross-sections of the LNSB sample (at different speeds and for 0.5 µJ/pulse) were brought under a field-emission gun scanning electron microscope (Carl Zeiss Microscopy GmbH). (FEG-SEM ZEISS SUPRA 55 VP) equipped with an electron backscatter diffraction (EBSD) detector. The samples were side polished perpendicularly to the scanning direction and until the laser-cross section was exposed. Crystalline texture, size, and nano-/micro-texturing could be observed.
3. Results
3.1. Effect of Scanning Speed: Optical Microscope Observation under White Light Illumination (Transmission Mode)
In
Figure 4a, the optical microscope images of some sections of the inscribed lines (Yx configuration, in transmission mode, top view, and upon white light illumination) for LNS and LNSB samples are displayed. At this point, it is worth pointing out that the black lines (at low speeds, typ. < 25 µm/s) were associated with a bright and well visible green light observation during the laser irradiation and the brown colored lines with less vivid green light intensity (although still visible). Finally, for the nearly transparent lines (at the highest scanning speeds), no green light could be detected during the irradiation. Detection of SHG is a direct indication if LiNbO
3 crystals were precipitated during laser scanning. As can be seen from
Figure 4, the samples are lightly colored (orange). Absorption spectra were recorded and are presented in
Appendix B,
Figure A1. They revealed a linear absorption tail starting below 500 nm and a cutoff wavelength in the UV region at around 350 nm for both glasses. However, no absorption band is detected at the laser wavelength that could be a source of strong linear absorption. From
Figure 4a, a very different behavior is observed with respect to each glass sample. For LNS at 0.5 µJ/pulse no crystallization could be detected at scanning speeds above ~50 µm/s, and there was a sharp transition between crystallized lines to no crystallization. For LNSB glass, crystallization was detected up to ~225 µm/s for the same pulse energy regime and configuration. Additionally, the transition regime from dark lines to transparent ones was incremental. Comparison made between LNS and LNSB for a higher pulse energy (1.0 µJ) shows no crystallization at scanning speeds beyond ~100 µm/s for LNS glass and beyond ~600 µm/s for LNSB. Moreover, the line width fluctuates in a periodic fashion for LNS whereas it is very weak for LNSB. This is rather similar to what has been reported in [
23] using a CW laser 1080 nm, 1.4–1.8 W, NA = 0.8, at the surface.
Finally, the averaged heat-affected volume (HAV) width for each line is reported in
Figure 4b, for Yy and Yx configurations. In both LNS and LNSB, increasing the pulse energy causes, on the first order, an increase of the HAV width. For LNSB glass at low pulse energy, the laser track thickness slowly decreases as the scanning speed increases. On the other hand, at 1.0 µJ/pulse, the laser track width increases and reaches a maximum at around 150–250 µm/s, then progressively decreases.
3.2. Birefringence Measurements and Polarization-Dependent Orientation
Based on the previous observation under optical microscopy, we could classify three (3) types of line inscription regimes: one at low speed (lines appear dark, little to no light passing through them), one at medium speed (brownish lines, with light passing through them), and one at high speed (no detectable crystallization, and light fully passing through them). These three-speed regimes are reported in
Figure 5a for lines written in LNSB using increasing speeds: 1, 75, and 350 µm/s. To further investigate the differences between these speed regimes, we used different illumination conditions:
- (1)
transmission with natural light; we see rough modifications
- (2)
transmission with crossed polarizer (P) and analyzer (A) (polarized light)
- (3)
same as (2) with a full waveplate inserted with its orientation perpendicular to the scanning direction; see
Figure 5a.
In (2): the background (glass) whatever the sample orientation appears dark due to glass isotropy. The lines are also dark when they are placed parallel to either P or A. On the contrary, when the lines (low and medium speed regime) were rotated at any other angle than parallel (//) to P or A, light passes through them, with a maximum at an angle of 45° with respect to both A and P axes (with a precision of ±5°). This feature was maximized for the medium speed regime (75 µm/s in
Figure 5a) indicating that the orientations of the neutral axes are parallel and perpendicular to the line scanning direction.
In (3): with the insertion of a full retardation waveplate and the neutral axes at 45° from A and P, we distinguish the slow axis from the fast axis. When the slow axis of the line is parallel or perpendicular to the slow axis of the full retardation plate (at 550 nm), it appears blue or yellow, respectively. Here, whatever the investigated configurations, the slow axis of the written line is found perpendicular to the writing laser polarization. This agrees with [
21], and is attributed to (i) the formation of quasi-periodic lamellas with two different refractive indices, and (ii) not to the birefringence related to the oriented LiNbO
3 nanocrystals contained in one of the lamellas.
Finally, retardance (R) was quantitatively measured at the center of each irradiated line as reported in
Figure 5b,c. In LNS glass, the retardance arises from the formation of a sub-wavelength and lamellar-like structure with periodic alternation of LiNbO
3-rich regions (crystallized) with LiNbO
3-poor (glass rich) ones, leading to form birefringence, hence retardance [
21].
From
Figure 5b,c, we observe general trends with respect to the retardance of the lines. At the lowest speed (1 µm/s) the measured retardance is null and this for each glass and at every pulse energy (either 0.5 or 1.0 µJ). Now, in LNSB, as the scanning speed is progressively increased, the retardance also increases, until it reaches a maximum. Lowering the pulse energy (going from 1.0 to 0.5 µJ) results in the enhancement of the retardance. In LNSB, this increase approximately corresponds to a factor of 4 (up to 200 nm). At 0.5 µJ retardance disappears beyond 350 µm/s, whereas for 1.0 µJ it is roughly constant until 600 µm/s. For LNS, the maximum is always roughly 100 nm. However, if retardance increases just from a few µm/s until 50 µm/s at 0.5 µJ, it starts to increase the latter by 1.0 µJ but both exhibit a steep decay at 200 µm/s. Although at higher speeds the lines are not crystallized, at low speeds crystallization occurs. Therefore, the low-speed regime exhibits a birefringent response, but the white light is scattered as it travels through the cross-section due to the presence of large crystallites along the laser track. Finally, no writing polarization effect is detected on the retardance amplitude, and the maximum retardance response found for LNSB is about twice larger compared to LNS.
3.3. Investigation of Scanning Speed Effect on the Laser Track Morphology in LNSB Glass
To better understand the various trends observed when the scanning speed is varied, we investigated the morphology and nanostructure using scanning electron microscope imaging and electron backscatter diffraction (EBSD). In
Figure 6a, we report the laser track cross-section (for 0.5 µJ/pulse, Yy configuration) SEM micrographs and EBSD diffraction pattern images taken in LNSB sample, at three different speeds: 1, 10, and 75 µm/s. As one can rotate the lamellas by rotating the laser polarization, the choice of Yy configuration was decided for investigating the crystallization in the plane of the lamellas (see for instance [
14]). We first confirm the presence of LiNbO
3 nanocrystals, and no other crystalline phase was detected, i.e., all Kossel’s figures were indexed. Secondly, we observe that the crystallization is rather homogeneously distributed. As it has been seen before in a similar analysis performed on SiO
2 [
24], there are some regions that are not phase separated. We can suppose that this is the case at the center of the laser track, especially for 25 and 50 µm/s. However, we cannot completely rule out the possibility to partially investigate some areas that are between two crystalline zones, hence they would appear amorphous. We observe a concentration of nanocrystals at the laser track center in the head as the speed increases, whereas at a low speed we observe larger regions of similar crystalline orientation, i.e., similar color in the inverse pole figure (IPF). The average size of the regions of the same orientation (single texture) as a function of scanning speed is reported in
Figure 6b (in magenta), along with the error bar, which corresponds to the standard deviation (providing information of the size distribution). Additionally, we also report the evolution of the number of regions as a function of scanning speed. This figure emphasizes the observation of larger crystalline domains with the same orientation in the low-speed regime relative to the high-speed one. Interestingly, beyond 25 µm/s, we observe a plateauing in the crystalline size evolution (averaged size centered at 100 nm) with a narrower distribution (small standard deviation). This is also accompanied with a rather constant number of a single texture region: approximately 600 to 800 regions from 10 to 175 µm/s, while this number drops to 300 for the lowest scanning speed (1 µm/s).
Lastly, in
Figure 6c, the pole figures of LiNbO
3 c axis reveal a dominant texture, where the c axis is found preferentially perpendicular to the laser polarization for all laser tracks. This is consistent with previous works (see for instance [
10,
18]). However, we observe that, as the scanning speed increases, the preferential orientation of the c axis becomes less contrasted.
In addition, SEM imaging was performed on the laser track cross-section of LNSB sample but this time in the Yx configuration. This allows seeing any lamellar-like nano-structuring as already suspected based on the observation of birefringence. This variety of nanogratings, previously observed in LNS glass ([
13]) within the crystallized region, “grow” perpendicularly to the laser polarization. The SEM micrographs reported in
Figure 7 show some interesting features worth pointing out. First, the observed crystallized volume becomes smaller as the scanning speed increases (in yellow). Additionally, the length, but not so much the width, of the region where lamella-like structuring is observed, framed by the orange dashed line, progressively decreases as the scanning speed increases. At low speeds (<25 µm/s), there is a complete overlap between the crystallized and lamellas regions, while it is much reduced at higher speeds. Similar observations have been reported in [
12]. At low pulse energy (0.5 µJ/pulse), the lamella area also coincides with the crystallized one. But when energy is increased, the lamella area becomes smaller with respect to the crystallized one, i.e., the overlap is reduced. Note that lamellas forming nanogratings are resulting from direct interaction with the laser light whereas crystallization is not.
4. Discussion
4.1. Temperature and Its Distribution Profile during Irradiation in LNS and in LNSB Glasses
The laser energy deposition inside the material is achieved through a nonlinear—multiphotonic—absorption effect. The absorbed energy is then redistributed in the lattice in form of heat, typically in a Gaussian-like shape (in space). After a short stage of non-linearity, the absorbed energy proportion is independent of the pulse energy [
25]. One advantage of using a converging beam is that the absorption is triggered in-depth and then controllable.
In pulsed regime, the time for the instantaneous temperature to reach a steady state for our compounds and laser conditions can be shown from the Fourier’s equation to be around 270·τ
D (see
Appendix A), with τ
D =
²/4D
T, w
0 ~1 µm) and D
T(LNS) = 9 × 10
−7 m²/s [
21]. This gives τ
D ≈ 0.28 µs and thus 76 µs to reach the steady state or 15 pulses in our conditions (200 kHz). This is indicative that we have a weak temporal overlapping between pulses, and that we are close to the so-called “single pulse regime” discussed in the Introduction. Moreover, the thermal diffusivity
, where
is the thermal conductivity,
the density, and
the heat capacity, should not be drastically different when moving from LNS to LNSB. Indeed, the partial substitution of 21 mol% SiO
2 with B
2O
3 into the glass system is not expected to change the thermal diffusivity by much (see for instance Table 8.20 in Ref. [
26]). Additionally, the
and
values, extracted from Sciglass software, are
(LNS, 20 °C) = 3482 kg/m
3,
(LNS, 20 °C) = 629.2 J/(kg·K),
(LNSB, 20 °C) = 3535 kg/m
3, and
(LNSB, 20 °C) = 657.8 J/(kg·K). The
product differs only by 6% between the two glasses.
Consequently, the spatial temperature distribution profiles, for both LNS and LNSB glasses, are very similar for a given set of conditions. This is in good agreement with our experimental results where the HAV widths appear not to vary much with the chemical composition (
Figure 4).
4.2. Nucleation and Growth in LNS and LNSB Glasses: Tendencies and Comparisons
One interesting parameter to investigate differences in crystallization kinetics between the two glasses is the reduced glass transition temperature, T
gr, defined as T
gr = T
g(K)/T
L(K), where T
g is the glass transition temperature and T
L is the liquidus temperature (or the melting temperature). To get T
g values, we ran differential scanning calorimetry (DSC) scans on the samples (LNS and LNSB), in addition to two other glasses with an incremental amount of B
2O
3. The results are reported in
Figure 8. The T
g could not be easily distinguished for LNS glass, and therefore we took the value provided by Sciglass (T
g ≈ 579.1 °C). On the other hand, we obtained T
g ≈ 520 °C for LNSB glass with 21 mol% of B
2O
3. For both glasses, we used T
L = 1257 °C (corresponding to the melting temperature of LiNbO
3 as in [
27]); we obtained T
gr(LNS) ≈ 0.56 and T
gr(LNSB) ≈ 0.52. Additionally, and for completeness, we observe that the progressive addition of B
2O
3 shifts down the crystallization peak to lower temperatures: by about 150 °C between LNS and LNSB with 21 mol% B
2O
3.
The T
gr values are only indicative and further work (including viscosity measurements) is required to more precisely ascertain these values, such as melting temperatures (which in glass can be defined as the temperature for which the viscosity reaches log (viscosity, Pa·s) = 1). This will be important in the future, since the melting temperature of LNSB glass is lower than LNS, and this would have the tendency to shift the T
gr value of LNSB slightly to higher values. Aside from these caveats, the differences of T
gr between the glasses can be, at least quantitatively, compared to the maximum nucleation rate (I
max) and time lag of nucleation (incubation time) reported in Figure 4.3 of [
28]. Interestingly, these observed differences in T
gr can lead up to several orders of magnitude higher I
max values for LNSB relative to LNS, while the incubation time is correspondingly two orders of magnitude lower [
28,
29]. The detection of SHG (through intense green light detection) for LNSB is much faster than for LNS upon laser irradiation (up to 20× faster) [
18] and indicates a faster nucleation rate. Additionally, by looking at Figure 2 from [
29], the maximum growth rate can be crudely estimated. For LNS, it would be in the 100 µm/s range, while it would be higher for LNSB by an order of magnitude. Once again, these trends agree well with the experimental observations. At a pulse energy of 1.0 µJ, crystallization (through SHG observation) is observed up to 100 µm/s in LNS, while it is detected up to 600 µm/s in LNSB. For completeness, T
gr is determined for a glass but excluding migration of chemical species. If the latter occurs (e.g., in Sr
2TiSi
2O
8 glasses as in [
30] or other silicate glasses [
3]), the situation becomes more complex and growth will become composition-dependent and temperature-dependent.
Another interesting point to highlight is that the net crystal growth rate in glass is directly related to the mobility of the atoms, i.e., the diffusion coefficient (Wilson–Frenkel’s theory [
31]), which, in turn, is proportional to the inverse of the viscosity through the Stoke–Einstein’s relation [
28]. Moreover, incorporation of B
2O
3 into the silicate glass melt is known to decrease viscosity [
26]. Another observation is that the LNSB glass yielded to some occasional surface crystallization upon cooling, whereas it was not observed for LNS glass. These are the first indications of the more pronounced tendency to crystallize for LNSB relative to LNS. Additionally, we can estimate the Hruby Criterion k
H = (T
x − T
g)/(T
m − T
x), which is indicative of the tendency of glass to crystallize (especially upon heating) [
32]. In this criterion, T
x stands for the onset crystallization temperature, T
g the glass transition temperature, and T
m the melting temperature (here taken as T
m of LiNbO
3). For LNSB, T
g ≈ 520 °C and T
x ≈ 560 °C. For LNS, T
g ≈ 579.1 °C (Sciglass) and T
x ≈ 700 °C (see for instance Ref. [
33]). This yields to k
H ≈ 0.06 for LNSB and k
H ≈ 0.22 for LNS. The smaller k
H value for LNSB (≈4 times lower) with respect to LNS indicates its higher tendency to crystallization.
4.3. What Does Limit Crystallization as the Scanning Speed Is Increased?
To answer this question, let us first briefly recall what has been learned from the Introduction:
The incubation time t
i at a given temperature is the time for the glass to produce a volumetric number of nanocrystals that gives rise to detectable SHG intensity. This time provides information on the TTT curve that binds the domain of crystallization in the frame of homogeneous nucleation assumption [
34] (see
Figure 1b).
The spatial temperature distribution T(r, t(N)) (
Figure 1c) has a maximum directly related to the pulse energy (E
p), the heat capacity (C
p) and the irradiated volume (width and length): this situation is valid for pulses with no overlapping in time.
An average curve can be obtained by averaging the T(r, t(N)) curve on the period of the pulse
. This curve becomes stationary after about 270τ
D or N > N
ssm(0) = 15 pulses (see
Appendix A Equation (A5)).
A time-averaged temperature curve is a convenient mean to consider the temperature spatial distribution, and to understand the effective incubation time (t
eff) obtained from laser irradiation. This last is close to the shortest one in the possible crystallization range from T
g to the maximum average temperature (T
maxi) controlled by the average light power
:
where t
i(T) is the domain boundary in
Figure 1b.
Thus, for low-average power (
),
is close to T
g, t
eff is large, but as
increases, t
eff decreases drastically until a value defined by the TTT curve (at the T
p temperature), and then slows down weakly for further increase of
. This explains the shape of the curve shown in
Figure 1a.
When the beam is moving (let us say along x), considering that the steady state is rapidly reached, is a bell shape curve moving. Considering one point in the material, its temperature travels along this curve, increasing and decreasing: this is the local treatment and the bell shape that we know in space is translated in time domain. This is what we call the thermal treatment curve.
Following these previous considerations and based on our results, in
Figure 9 we sketch the TTT diagrams for LNS (
Figure 9a) and LNSB (
Figure 9b), considering the differences in T
g, T
x, T
p, t
eff while T
m is assumed constant. On this figure, several heat treatments (heating-cooling curves) are drawn: note that the mean power is fixed so the maximum T is a constant and will not change as a function of scanning speed, as discussed earlier. Consider first the diagram of
Figure 9a, which is for LNS glass. The scanning speed (v) is chosen so that the heat treatment does not reach the crystallization domain. Now, if we consider scanning at a speed of v/2, the treatment may penetrate the crystallization domain (i.e., the nuclei have time to form and to grow). Reversely, at higher scanning speeds (e.g., 2v in the sketched diagram) no crystallization will be detected. The situation is different for LNSB as the incubation time is much shorter and T
p much lower. This has the effect of shifting the crystallization domain to lower temperature and closer to the ordinate axis, as illustrated in
Figure 9b. Therefore, for the same scanning speed v, the treatment curve will now penetrate the crystallization domain. It is thus possible to increase the scanning speed until a value given by the experiment (i.e., 5v) to reach the critical value beyond which the crystallization stops.
4.4. Evolution of The Heat Affected Volume (HAV) Width and Length with Respect to the Scanning Speed V
Based on our previous discussion, we can now understand better the evolution of HAV width with respect to the scanning speed (as observed in
Figure 4, for instance). To observe crystallization, the temperature should overcome T
x, and this temperature is slightly dependent on the time of irradiation (or the equivalent in laser irradiation: the number of pulses). This can be visualized from
Figure 10: when the heat treatment time increases, the crystallization is possible at slightly lower temperatures (see the red portion in the TTT diagram). Consequently, the slight decrease of the HAV width with v observed in
Figure 4b is attributed to the combination of (1) incubation time to reach the crystallization growth boundary at a given temperature and (2) the decrease of deposited pulse density when v is increased. There is also the possibility that a smaller number of pulses yields to less created defect levels absorbing in the bandgap [
5], decreasing the energy transfer from the light through linear absorption thus decreasing T and HAV width.
The length (or depth) of the HAV after the steady state is, like the width (defined by the beam waist w
0), defined by the light absorption length (i.e., 1/α at 1/e with α being an effective absorption coefficient beyond the non-linear absorption stage [
25]). Additionally, the related diffusion time (say τ
Dz) is ~1/4·α
2D
T. As 1/α >> w
0 (at least by a factor of 10), τ
Dz >> τ
Dr and the steady-state temperature along the beam propagation axis would be reached much later (2 or 3 order of times later) than along the radial direction. The total number of pulses deposited punctually (at f = 200 kHz) is above 400,000 (for v = 1 μm/s) and 4000 (for v = 100 μm/s). This is larger than the pulses needed to reach the steady-state temperature (~1500). In this case, the length follows a similar effect than for the width, so the length is shortened with the speed increase.
This is not the case at speeds such as v = 500 μm/s, for which the number of pulses deposited is only 800. Therefore, the steady state is not reached, and the temperature is smaller than the steady state one, decreasing even more the length at .
4.5. Nanogratings Region Inside The HAV Area, but Not Always Coinciding with It
In
Figure 7, we highlighted the difference between the HAV area and the area where lamellas were present. At low speed (<25 µm/s) and low energy (0.5 µJ/pulse), both regions coincide but it is no more the case when either the energy or the speed are increased (>25 µm/s).
We mentioned before that the HAV dimensions are related to the T distribution because HAV boundary is defined by a minimum T for inducing an effect (e.g., Tx for crystallization). When the temperature amplitude increases, the temperature shape distribution (related to the diffusion time) remains the same. However, the radius where T reaches Tx is pushed further out. On the other hand, the width of the nanograting region (where there are lamellas) does not change much. Indeed, it is defined by the width of the beam since nanogratings are enabled by a light-plasma interaction.
At low energy and low speed, the top of the temperature distribution penetrating the crystallization domain (as speed v/2 in
Figure 9a) may define a minimum width and coincides with the width of the beam. At higher energy, the amplitude of the T distribution increases and the HAV width becomes larger than the beam width. When the speed is increased, the T distribution does not change much, but the lamellar-structured volume is likely to shrink. The latter can be explained making the following arguments:
(1) The length and the number of the nanoplanes increase with the deposited pulses number (2
·P
D) above some number that is why the birefringence is also increasing [
35].
(2) The form birefringence increases also with the pulse energy above a threshold. We can thus assume that the self-organized volume depends on the dose (I(x,y,z)·PD-D0), where I(x,y,z) is the local light intensity, and D0 is a dose threshold above which self-organization structures appear.
(3) If we note that
, where z
0 is the depth where nanostructure begins to appear [
36], (4) therefore, the extension of the self-organized volume is defined by local dose above the minimum dose D
0, i.e.,
or
. Hence, when v increases, P
D decreases, and thus the self-organized volume as it is observed experimentally.
4.6. Phenomenological Link between Birefringent Response and Scanning Speed
By investigating the microstructure and crystal size and distribution inside the laser track (
Figure 6), we observe that larger crystallized domains made up by LiNbO
3 nanocrystals with the same orientation are present at low speeds (<25 µm/s) and can reach up to several hundreds of nm in size. These “particles” with a size around λare strongly scattering light resulting in “black” lines in natural light transmission as we observe in
Figure 5a. On the other hand, increasing the scanning speed will avoid crystallites to grow, and they will only be a few ten percent (in size) of the microscope light wavelength (550 nm). Interestingly, we observed that this size distribution of crystallized domains is rather similar for lines written at speeds > 50 µm/s in LNSB (
Figure 6). Under optical microscopy, there is strong light scattering but nevertheless some light still passes through them. This tuning of scanning speed may be an efficient way to control photonic device scattering losses related to the crystals’ size. From
Figure 7, the presence of lamellar-like structures is taken responsible of the birefringent response of the inscribed lines [
21]. The volume occupied by the lamellar-like structure becomes smaller as the scanning speed increases (and the retardance decreases). Maximizing this lamellar-like structuring would therefore bring higher retardance values and low speeds may be preferred. However, an associated low speed tradeoff is the formation of larger regions with single texture, which ultimately would cause light scattering as well. Therefore, there exists a sweet spot in the medium speed range regime where the laser track retardance response is maximized. This sweet spot is much wider for LNSB relative to LNS: typ. by a factor of 4 or 5 as it can be seen in the retardance measurements reported in
Figure 5b,c.
5. Conclusions
In this work, fs-laser irradiation on two glasses, LNSB (33Li2O-33Nb2O5-13SiO2-21B2O3) and LNS (33Li2O-33Nb2O5-34SiO2), was performed. The effect of scanning speed on crystallization was investigated in various writing conditions. Experimentally, we determined that the beam scanning speed limit is 32 ± 12 μm/s for LNS and 237 ± 12 μm/s for LNSB at 0.5 μJ/pulse, and 112 ± 12 μm/s for LNS and 612 ± 12 μm/s for LNSB at 1.0 µJ/pulse. In the conditions used, faster crystallization (>5×) can be achieved when SiO2 is substituted with B2O3 (here 21 mol% substitution).
Based on SEM-EBSD analysis, we observed that both the width and the length of the crystallized volume change slightly as the scanning speed is varied. We have determined the orientation distribution of the nanocrystals by SEM-EBSD. We found that a preferential texture with LiNbO3 c axis perpendicular to laser polarization could be preserved when scanning speed was increased, but its contrast decreased. In addition, while the width of the nanogratings region does not change much, the length is drastically reduced when the scanning speed increases.
By using a simple approach based on temperature distribution averaged on a pulse time period, along with its characteristics in a stationary state, we showed that the irradiations were performed in the regime of weak time overlapping between pulses or heat accumulation: only 15 pulses are needed to reach 94% of the temperature steady-state value. Key results can be summarized as follows:
We identified the variations of the thermal properties (Tx, Tp, incubation time) with respect to the glass chemical compositions. From these data, we deduced the variation of the crystallization domain in the time-temperature framework. The lower part of the crystallization domain in the TTT diagram (growth limited) is shifted to lower temperatures when B2O3 is added to the glass matrix. As a result for LNSB, the minimum incubation time is reduced by a factor larger than 5 with respect to LNS.
We stated that the effective incubation time is better translated by a number of pulses whatever the repetition rate and is a function of the average laser power (rather than pulse energy only) and the number of pulses (equivalent to irradiation duration).
We specified the concepts of spatial pulse overlap (pulse density that means irradiation time) and time pulse overlap, which govern the heat accumulation and the average temperature.
We explained the scanning speed limit to induce crystallized lines as follows: there exists an effective irradiation time that is related to the width of the average temperature spatial distribution, and that is translated in the temporal domain during scanning. When the heat treatment time becomes smaller than the incubation time, crystallization cannot occur. Interestingly, we can deduce that faster scanning speeds while preserving the nano-crystallization are possible when the mean power is increased as illustrated in
Figure 11.
We explained the weak decrease of the HAV width when the scanning speed is increased (or the decrease of dot diameter with the decrease of the irradiation time in static irradiation) by the decrease of the incubation time with the increase of the onset temperature Tx. Crystallization starts thus at a higher temperature and this corresponds to a radius closer to the center. Two processes explain the length decrease: the same phenomena as above but in addition the decrease of the temperature amplitude due to a smaller absorption coefficient for smaller pulse densities.
The width of the nanograting region coincides with HAV at low speeds and low energy because only a small part of the T distribution (in fact the top) is touching the crystallization domain. Assuming that these self-organized structures are dependent on the light dose (I(x,y,z)·PD) above a threshold dose (D0), when the speed is increased, the local dose decreases on all points of the irradiated volume. Consequently, the volume where the dose overcomes D0 also decreases.
Finally, we observed that birefringence response of the inscribed line is a function of scanning speed. This is related to the variation of the nanograting region volume as explained above. On the contrary, the crystallized volume varied only weakly with the scanning speed, as well as the nanocrystal density. As a matter of fact, the latter is defined by the average temperature distribution, which is fixed by both pulse energy and repetition rate. However, the contrast of orientation is larger for low speed and this is likely to be due to the larger volume taken by nanogratings.
Author Contributions
Conceptualization, E.M., M.C., M.L. and B.P.; Data curation, E.M.; Formal analysis, E.M., M.C., R.Q. and B.P.; Funding acquisition, M.C. and B.P.; Investigation, E.M., M.C. and F.B.; Methodology, E.M., M.C. and R.Q.; Project administration, M.C. and B.P.; Resources, D.P. and B.P.; Supervision, M.C. and B.P.; Validation, M.C. and B.P.; Visualization, E.M.; Writing—original draft, E.M., M.C. and B.P.; Writing—review & editing, E.M., M.C., M.L., D.P., D.J. and B.P. All authors have read and agreed to the published version of the manuscript.
Funding
This work was supported by the French National Research Agency under the program CHARMMMAT ANR-11-LABX-0039-grant.
Institutional Review Board Statement
Not applicable.
Informed Consent Statement
Not applicable.
Data Availability Statement
Via corresponding author.
Conflicts of Interest
The authors declare no conflict of interest.
Appendix A
Foreword: the formulas below are deduced from the Fourier’s equation with temperature independent and uniform coefficients, of a fs multipulse irradiation with the hypothesis that the pulse energy is deposited in a time short enough before active thermal diffusion with a spherical geometry around the focus. This simplified model is enough for reasoning and allows to manage simple expressions. After a while corresponding to a number of pulses N
ss, the system reaches a steady state, beyond which the temperature at the distance r from the center of the focus oscillates between T
min(r, ∞) and T
max(r, ∞) within the period [
19,
37]. In addition, when the temperature is averaged on the period, there is no more time dependence arising from the pulsed character and discussions on the structural modifications are rendered easier. We point out that a paper will be published in the near future that will extensively describe the subsequently established equations that express analytically the results obtained numerically in Refs. [
19,
37] and other references. To help the Reader, the designation, definition, and units of each variable employed in the equations below are listed in
Table A1 at the end of
Appendix A.
The instantaneous temperature increase (T) from the room temperature at time t and distance r from the center of the beam can be shown to be [
38]:
with τ
p = 1/f, τ
D =
2/4D
T, Rτ = τ
p/τ
D, T
0 = 3·A·E
p/(4·π·ρ·C
p·
3), f is the pulse repetition rate,
is a beam waist radius (at 1/e). Performing an averaging on the period, we get the average temperature expression:
This quantity increases at the beginning of the irradiation and reaches a steady state limit that is:
This one is reached at the level of ε after a number of pulses N
ssm(r) for a distance r:
This means for ε = 6%, f = 200 kHz, DT = 9·10–7 m2/s, τD = 0.28μs, Rτ = 18, Nssm(0) ≈ 15 pulses or 270·τD.
We note that the maximum temperature according to the radius is at the center and has the value:
N.B.: for cylindrical geometry, the expression of the maximum temperature is slightly modified with the introduction of an absorption coefficient resulting from non-linear absorption. We read:
Table A1.
Parameters, definitions and units used in the above equations.
Table A1.
Parameters, definitions and units used in the above equations.
| Parameters | Definitions | Units |
|---|
| Fraction of reflected light by the plasma | none |
| Light absorption coefficient | μm−1 |
| A small quantity for computation needs | none |
| Pulse period | μs |
| Heat diffusion time
| μs |
| | none |
| Beam waist radius (at 1/e) | μm |
| Thermal diffusivity
| m2/s |
| Thermal conductivity | W/(m∙K) |
| Pulse energy | J |
| Pulse repetition rate | MHz |
| Density | kg/m3 |
| Specific heat capacity | J/(kg∙K) |
Appendix B
Figure A1.
Absorption spectra for LNS, LNSB, with SiO2 (Suprasil) added as a reference. The data were taken using a Cary5000 spectrophotometer. There is no specific absorption band situated at 1030 nm that could cause a drastic multiphoton absorption difference between the two silicate glasses.
Figure A1.
Absorption spectra for LNS, LNSB, with SiO2 (Suprasil) added as a reference. The data were taken using a Cary5000 spectrophotometer. There is no specific absorption band situated at 1030 nm that could cause a drastic multiphoton absorption difference between the two silicate glasses.
References
- Karabchevsky, A.; Katiyi, A.; Ang, A.S.; Hazan, A. On-chip nanophotonics and future challenges. Nanophotonics 2020, 9, 3733–3753. [Google Scholar] [CrossRef]
- A round-up of recent papers in the field of photonics published by the physical sciences division of the Nature Publishing Group. Nat. Photonics 2008, 2, 251. [CrossRef]
- Fernandez, T.; Sakakura, M.; Eaton, S.; Sotillo, B.; Siegel, J.; Solis, J.; Shimotsuma, Y.; Miura, K. Bespoke photonic devices using ultrafast laser driven ion migration in glasses. Prog. Mater. Sci. 2018, 94, 68–113. [Google Scholar] [CrossRef]
- Bricchi, E.; Kazansky, P.G. Extraordinary stability of anisotropic femtosecond direct-written structures embedded in silica glass. Appl. Phys. Lett. 2006, 88, 111119. [Google Scholar] [CrossRef]
- Stoian, R.; Mishchik, K.; Cheng, G.; Mauclair, C.; D’Amico, C.; Colombier, J.-P.; Zamfirescu, M. Investigation and control of ultrafast laser-induced isotropic and anisotropic nanoscale-modulated index patterns in bulk fused silica. Opt. Mater. Express 2013, 3, 1755. [Google Scholar] [CrossRef]
- He, X.; Poumellec, B.; Liu, Q.; Brisset, F.; Lancry, M. One-step photoinscription of asymmetrically oriented fresnoite-type crystals in glass by ultrafast laser. Opt. Lett. 2014, 39, 5423–5426. [Google Scholar] [CrossRef]
- Miura, K.; Qiu, J.; Mitsuyu, T.; Hirao, K. Space-selective growth of frequency-conversion crystals in glasses with ultrashort infrared laser pulses. Opt. Lett. 2000, 25, 408–410. [Google Scholar] [CrossRef]
- McAnany, S.D.; Veenhuizen, K.J.; Kiss, A.M.; Thieme, J.; Nolan, D.A.; Aitken, B.G.; Dierolf, V.; Jain, H. Evolution of glass structure during femtosecond laser assisted crystallization of LaBGeO5 in glass. J. Non-Cryst. Solids 2021, 551, 120–396. [Google Scholar] [CrossRef]
- Lipatiev, A.S.; Lipateva, T.O.; Lotarev, S.V.; Okhrimchuk, A.G.; Larkin, A.S.; Presnyakov, M.Y.; Sigaev, V.N. Direct Laser Writing of LaBGeO5 Crystal-in-Glass Waveguide Enabling Frequency Conversion. Cryst. Growth Des. 2017, 17, 4670–4675. [Google Scholar] [CrossRef]
- Cao, J.; Poumellec, B.; Brisset, F.; Helbert, A.-L.; Lancry, M. Tunable angular-dependent second-harmonic generation in glass by controlling femtosecond laser polarization. J. Opt. Soc. Am. B 2016, 33, 741. [Google Scholar] [CrossRef]
- Komatsu, T. Design and control of crystallization in oxide glasses. J. Non-Cryst. Solids 2015, 428, 156–175. [Google Scholar] [CrossRef]
- Cao, J.; Lancry, M.; Brisset, F.; Mazerolles, L.; Saint-Martin, R.; Poumellec, B. Femtosecond Laser-Induced Crystallization in Glasses: Growth Dynamics for Orientable Nanostructure and Nanocrystallization. Cryst. Growth Des. 2019, 19, 2189–2205. [Google Scholar] [CrossRef]
- Cao, J.; Poumellec, B.; Mazerolles, L.; Brisset, F.; Helbert, A.-L.; Surble, S.; He, X.; Lancry, M. Nanoscale Phase Separation in Lithium Niobium Silicate Glass by Femtosecond Laser Irradiation. J. Am. Ceram. Soc. 2016, 100, 115–124. [Google Scholar] [CrossRef]
- Cao, J.; Mazerolles, L.; Lancry, M.; Brisset, F.; Poumellec, B. Modifications in lithium niobium silicate glass by femtosecond laser direct writing: Morphology, crystallization, and nanostructure. J. Opt. Soc. Am. B 2016, 34, 160. [Google Scholar] [CrossRef]
- Cao, J.; Mazerolles, L.; Lancry, M.; Solas, D.; Brisset, F.; Poumellec, B. Form birefringence induced in multicomponent glass by femtosecond laser direct writing. Opt. Lett. 2016, 41, 2739–2742. [Google Scholar] [CrossRef]
- Cao, J.; Poumellec, B.; Brisset, F.; Lancry, M. Pulse energy dependence of refractive index change in lithium niobium silicate glass during femtosecond laser direct writing. Opt. Express 2018, 26, 7460–7474. [Google Scholar] [CrossRef]
- Cao, J.; Poumellec, B.; Brisset, F.; Helbert, A.-L.; Lancry, M. Angular Dependence of the Second Harmonic Generation Induced by Femtosecond Laser Irradiation in Silica-Based Glasses: Variation with Writing Speed and Pulse Energy. World J. Nano Sci. Eng. 2015, 5, 96–106. [Google Scholar] [CrossRef]
- Muzi, E.; Cavillon, M.; Lancry, M. Controlled Orientation of Second Harmonic Generation Induced by femtosecond laser Crystallization in Li2O-Nb2O5-SiO2-B2O3 glasses. Opt. Mater. Express 2021, in press. [Google Scholar]
- Eaton, S.M.; Zhang, H.; Herman, P.R.; Yoshino, F.; Shah, L.; Bovatsek, J.; Arai, A.Y. Heat accumulation effects in femtosecond laser-written waveguides with variable repetition rate. Opt. Express 2005, 13, 4708–4716. [Google Scholar] [CrossRef] [PubMed]
- Lax, M. Temperature rise induced by a laser beam. J. Appl. Phys. 1977, 48, 3919–3924. [Google Scholar] [CrossRef]
- Cao, J. Creation and Orientation of Nano-Crystals by Femtosecond Laser Light for Controlling Optical Non-Linear Response in Silica-Based Glasses, Material Chemistry; Université Paris Saclay (COmUE): Paris, France, 2017. [Google Scholar]
- Veenhuizen, K.; McAnany, S.; Nolan, D.; Aitken, B.; Dierolf, V.; Jain, H. Fabrication of graded index single crystal in glass. Sci. Rep. 2017, 7, srep44327. [Google Scholar] [CrossRef]
- Shimada, M.; Honma, T.; Komatsu, T. Laser patterning of oriented LiNbO3 crystal particle arrays in NiO-doped lithium niobium silicate glasses. Int. J. Appl. Glass Sci. 2018, 9, 518–529. [Google Scholar] [CrossRef]
- Desmarchelier, R.; Poumellec, B.; Brisset, F.; Mazerat, S.; Lancry, M. In the Heart of Femtosecond Laser Induced Nanogratings: From Porous Nanoplanes to Form Birefringence. World J. Nano Sci. Eng. 2015, 5, 115–125. [Google Scholar] [CrossRef]
- Lancry, M.; Groothoff, N.; Poumellec, B.; Guizard, S.; Fedorov, N.; Canning, J. Time-resolved plasma measurements in Ge-doped silica exposed to infrared femtosecond laser. Phys. Rev. B 2011, 84, 1–8. [Google Scholar] [CrossRef]
- Bansal, N.P.; Doremus, R. Handbook of Glass Properties; Academic Press: London, UK, 1986. [Google Scholar] [CrossRef]
- Lotarev, S.V.; Lipatiev, A.S.; Lipateva, T.O.; Fedotov, S.S.; Naumov, A.S.; Moiseev, I.A.; Sigaev, V.N. Ultrafast-laser vitrification of laser-written crystalline tracks in oxide glasses. J. Non-Cryst. Solids 2019, 516, 1–8. [Google Scholar] [CrossRef]
- Allix, M.; Cormier, L. Crystallization and Glass-Ceramics. In Springer Handbook of Glass; Springer: Cham, Switzerland, 2019; Chapter 4; pp. 113–167. [Google Scholar] [CrossRef]
- Fokin, V.M.; Nascimento, M.L.; Zanotto, E.D. Correlation between maximum crystal growth rate and glass transition temperature of silicate glasses. J. Non-Cryst. Solids 2005, 351, 789–794. [Google Scholar] [CrossRef]
- He, X.; Liu, Q.; Lancry, M.; Brisset, F.; Poumellec, B. Space-Selective Control of Functional Crystals by Femtosecond Laser: A Comparison between SrO-TiO2-SiO2 and Li2O-Nb2O5-SiO2 Glasses. Crystals 2020, 10, 979. [Google Scholar] [CrossRef]
- Varshneya, A.K.; Mauro, J.C. Fundamentals of Inorganic Glasses. Fundam. Inorg. Glasses 2019. [Google Scholar] [CrossRef]
- Cabral, A.; Cardoso, A.; Zanotto, E. Glass-forming ability versus stability of silicate glasses. I. Experimental test. J. Non-Cryst. Solids 2003, 320, 1–8. [Google Scholar] [CrossRef]
- Prapitpongwanich, P.; Pengpat, K.; Rüssel, C. Phase separation and crystallization in LiNbO3/SiO2 glasses. Mater. Chem. Phys. 2009, 113, 913–918. [Google Scholar] [CrossRef]
- Neuville, D.R.; Cormier, L.; Caurant, D.; Montagne, L. From Glass to Crystal; EDP Sciences: Les Ulis, France, 2017; p. 645. [Google Scholar]
- Richter, S.; Heinrich, M.; Döring, S.; Tünnermann, A.; Nolte, S.; Peschel, U. Nanogratings in fused silica: Formation, control, and applications. J. Laser Appl. 2012, 24, 042008. [Google Scholar] [CrossRef]
- Poumellec, B.; Lancry, M.; Chahid-Erraji, A.; Kazansky, P.G. Modification thresholds in femtosecond laser processing of pure silica: Review of dependencies on laser parameters [Invited]. Opt. Mater. Express 2011, 1, 766–782. [Google Scholar] [CrossRef]
- Zhang, H.; Eaton, S.M.; Li, J.; Herman, P.R. Heat accumulation during high repetition rate ultrafast laser interaction: Waveguide writing in borosilicate glass. J. Phys. Conf. Ser. 2007, 59, 682–686. [Google Scholar] [CrossRef]
- Shimizu, M.; Sakakura, M.; Ohnishi, M.; Yamaji, M.; Shimotsuma, Y.; Hirao, K.; Miura, K. Three-dimensional temperature distribution and modification mechanism in glass during ultrafast laser irradiation at high repetition rates. Opt. Express 2012, 20, 934–940. [Google Scholar] [CrossRef][Green Version]
Figure 1.
(
a) Evolution of the incubation time as a function of LNSB glass composition. The results are recalled from [
18]. (
b) Representation of the crystallization domain for LNS glass in TTT (time-temperature-transformation) scheme; T
p: crystallization peak temperature, T
g: glass transition temperature. (
c) Scheme of the temperature spatial distribution T(r, t) evolution after pulse deposition inside the glass, and as time evolves. We note that as the maximum temperature decreases with time, the width of the distribution increases (the heat energy in the system remains constant). As a side note, the beam waist radius w
0 is typ. around 1 to 1.5 μm.
Figure 2.
(
a) The three regimes of laser induced modifications in the pulse energy—repetition rate plane (E
p–f). The scheme on the left is for a LNS glass with a close composition than the one used in this paper ([
12]). (
b) Regimes established from results obtained with the glass composition and pulse duration used in the present paper. We note that the energy thresholds are a bit lower for the LNSB glass. N.B., the mention “static” means no beam scanning (dot production, the relevant parameter is the duration of irradiation) contrarily to “scanning” (the relevant parameter is the scanning speed).
Figure 3.
Experimental laser setup, and convention for the reference on the sample and its relation to the reference on the laser. S and e correspond to the scanning direction and the polarization direction, respectively. Note: in this work, Yy configuration corresponds to e parallel to S (e is along Y), and Yx configuration to e perpendicular to S (e is along X).
Figure 4.
(a) Optical microscope images of lines inscribed by fs-laser in silicate (LNS) and borosilicate (LNSB) glasses at various scanning speeds and for two pulse energies: 0.5 and 1.0 µJ (Yx configuration). (b) Heat-affected volume (HAV) width as a function of scanning speed, measured from optical microscope images in LNS and LNSB glass samples, for 0.5 and 1.0 µJ, and in both Yy and Yx configuration modes. Other (fixed) parameters are: λ = 1030 nm; f = 200 kHz; NA = 0.6; pulse duration = 250 fs; focal depth: 240 µm (in air).
Figure 5.
(a) Optical microscope images, under different illumination conditions, of lines written at different scanning speeds (1, 75, and 350 µm/s) for LNSB glass sample at a pulse energy of 0.5 µJ. P = polarizer; A = analyzer. Other (fixed) parameters are: λ (fs-laser wavelength) = 1030 nm; f = 200 kHz; NA = 0.6; pulse duration = 250 fs; focal depth: 240 µm (in air). Retardance (in nm) measured for (b) Yy and (c) Yx configurations at 550 nm at the center of the irradiated lines as a function of scanning speed, for both LNS and LNSB glasses, at pulse energies of 0.5 and 1.0 µJ.
Figure 6.
(a) Scanning electron microscope (SEM) micrographs and electron backscatter diffraction (EBSD) maps on the laser track cross-sections induced by fs-laser on LNSB glass sample and for different scanning speeds. Other (fixed) parameters are: pulse energy = 0.5 µJ; configuration = Yy (laser polarization // to the scanning direction); λ = 1030 nm; f = 200 kHz; NA = 0.6; pulse duration = 250 fs; focal depth: 240 µm (in air). (b) Number of single texture regions and their averaged diameter (assuming a spherical shape) as a function of scanning speeds, extracted from EBSD data, i.e., (a). (c) Pole figure of the LiNbO3 c axis (labeled as 0001), also extracted from the EBSD data.
Figure 7.
Scanning electron micrographs of the laser track cross-sections induced by fs-laser on LNSB glass sample and for different scanning speeds. The surrounded areas are (i) in yellow: area where crystallization within the laser track, associated with crystallization, is detected; and (ii) in orange: area where lamella-like nanogratings are observed (see for example insets). Other (fixed) parameters are: pulse energy = 0.5 µJ; configuration = Yx (laser polarization ⊥ to the scanning direction); λ = 1030 nm; f = 200 kHz; NA = 0.6; pulse duration = 250 fs; focal depth: 240 µm (in air). N.B. the crystallized volumes (in yellow) are similar to the ones in the Yy configuration (
Figure 6).
Figure 8.
Differential scanning calorimetry (DSC) scans for four glasses with an increasing amount of B2O3 in the batch composition; in mol%: 33Li2O-33Nb2O5-(34–x)SiO2-xB2O3, with x = 0, 7, 14, and 21. Heating rate was 10 °C/min. Black curve corresponds to LNS, while the pink curve to LNSB. Tg = glass transition temperature; Tp = crystallization peak temperature; Tx = onset of crystallization temperature.
Figure 9.
Scheme of the effect of the scanning speed on the crystallization for the two glasses ((
a) LNS and (
b) LNSB) investigated in this paper. (1) The crystallization domains are sketched based on the following rules: they are limited by the T
g on bottom side and T
m on top side; the nucleation top side is not changed because it only depends on the thermodynamics driving force of the nuclei that we assume the same for both glasses [
34]. However, the growth rate is increasing with the strong decrease of the viscosity. These changes lead to a strong decrease of the incubation time. (2) The maximum average temperature is defined by pulse energy and the repetition rate (E
p f). It does not change on the scanning speed (v) and very little on the chemical composition. Whatever the speed, the coincidence of the time scales between TTT and treatment curve is fixed when the treatment curves cross T
g, considered to be the starting time for crystallization (what happens below T
g is expected to have insignificant effect on the crystallization kinetics).

Figure 10.
Sketch explaining the effect of scanning speed on the heat-affected volume (HAV) width. As the scanning speed decreases, the number of pulses deposited for a given volume increases. Consequently, the crystallization onset is reached at lower temperatures.
Figure 10.
Sketch explaining the effect of scanning speed on the heat-affected volume (HAV) width. As the scanning speed decreases, the number of pulses deposited for a given volume increases. Consequently, the crystallization onset is reached at lower temperatures.
Figure 11.
The figure shows the possibility of increasing the scanning speed in preserving the nanocrystal microstructure. The objective is that the treatment curve crosses the nose of the crystallization domain. If the speed is increased, the mean power must be increased in relation. Quite rapidly, the treatment curve overcomes the melting temperature, and the mechanism evolves from solid-solid to liquid-solid crystallization.
| Publisher’s Note: MDPI stays neutral with regard to jurisdictional claims in published maps and institutional affiliations. |
© 2021 by the authors. Licensee MDPI, Basel, Switzerland. This article is an open access article distributed under the terms and conditions of the Creative Commons Attribution (CC BY) license (http://creativecommons.org/licenses/by/4.0/).


 ,
, 


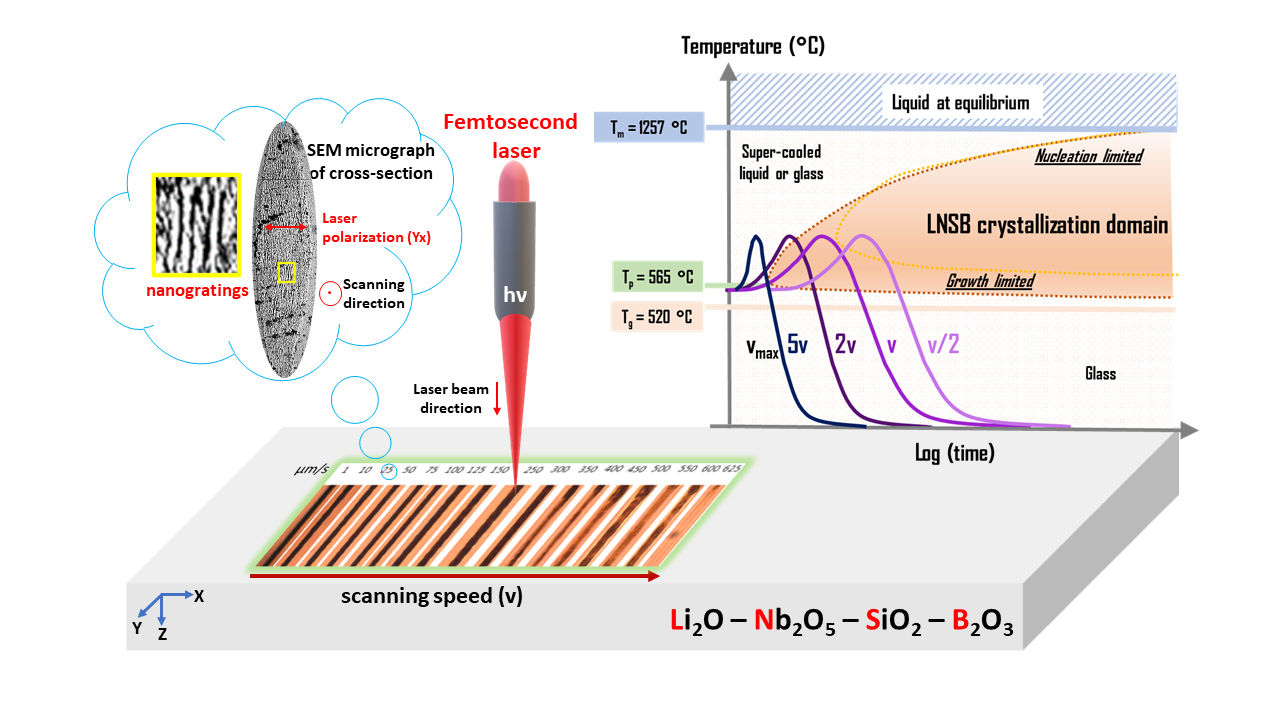
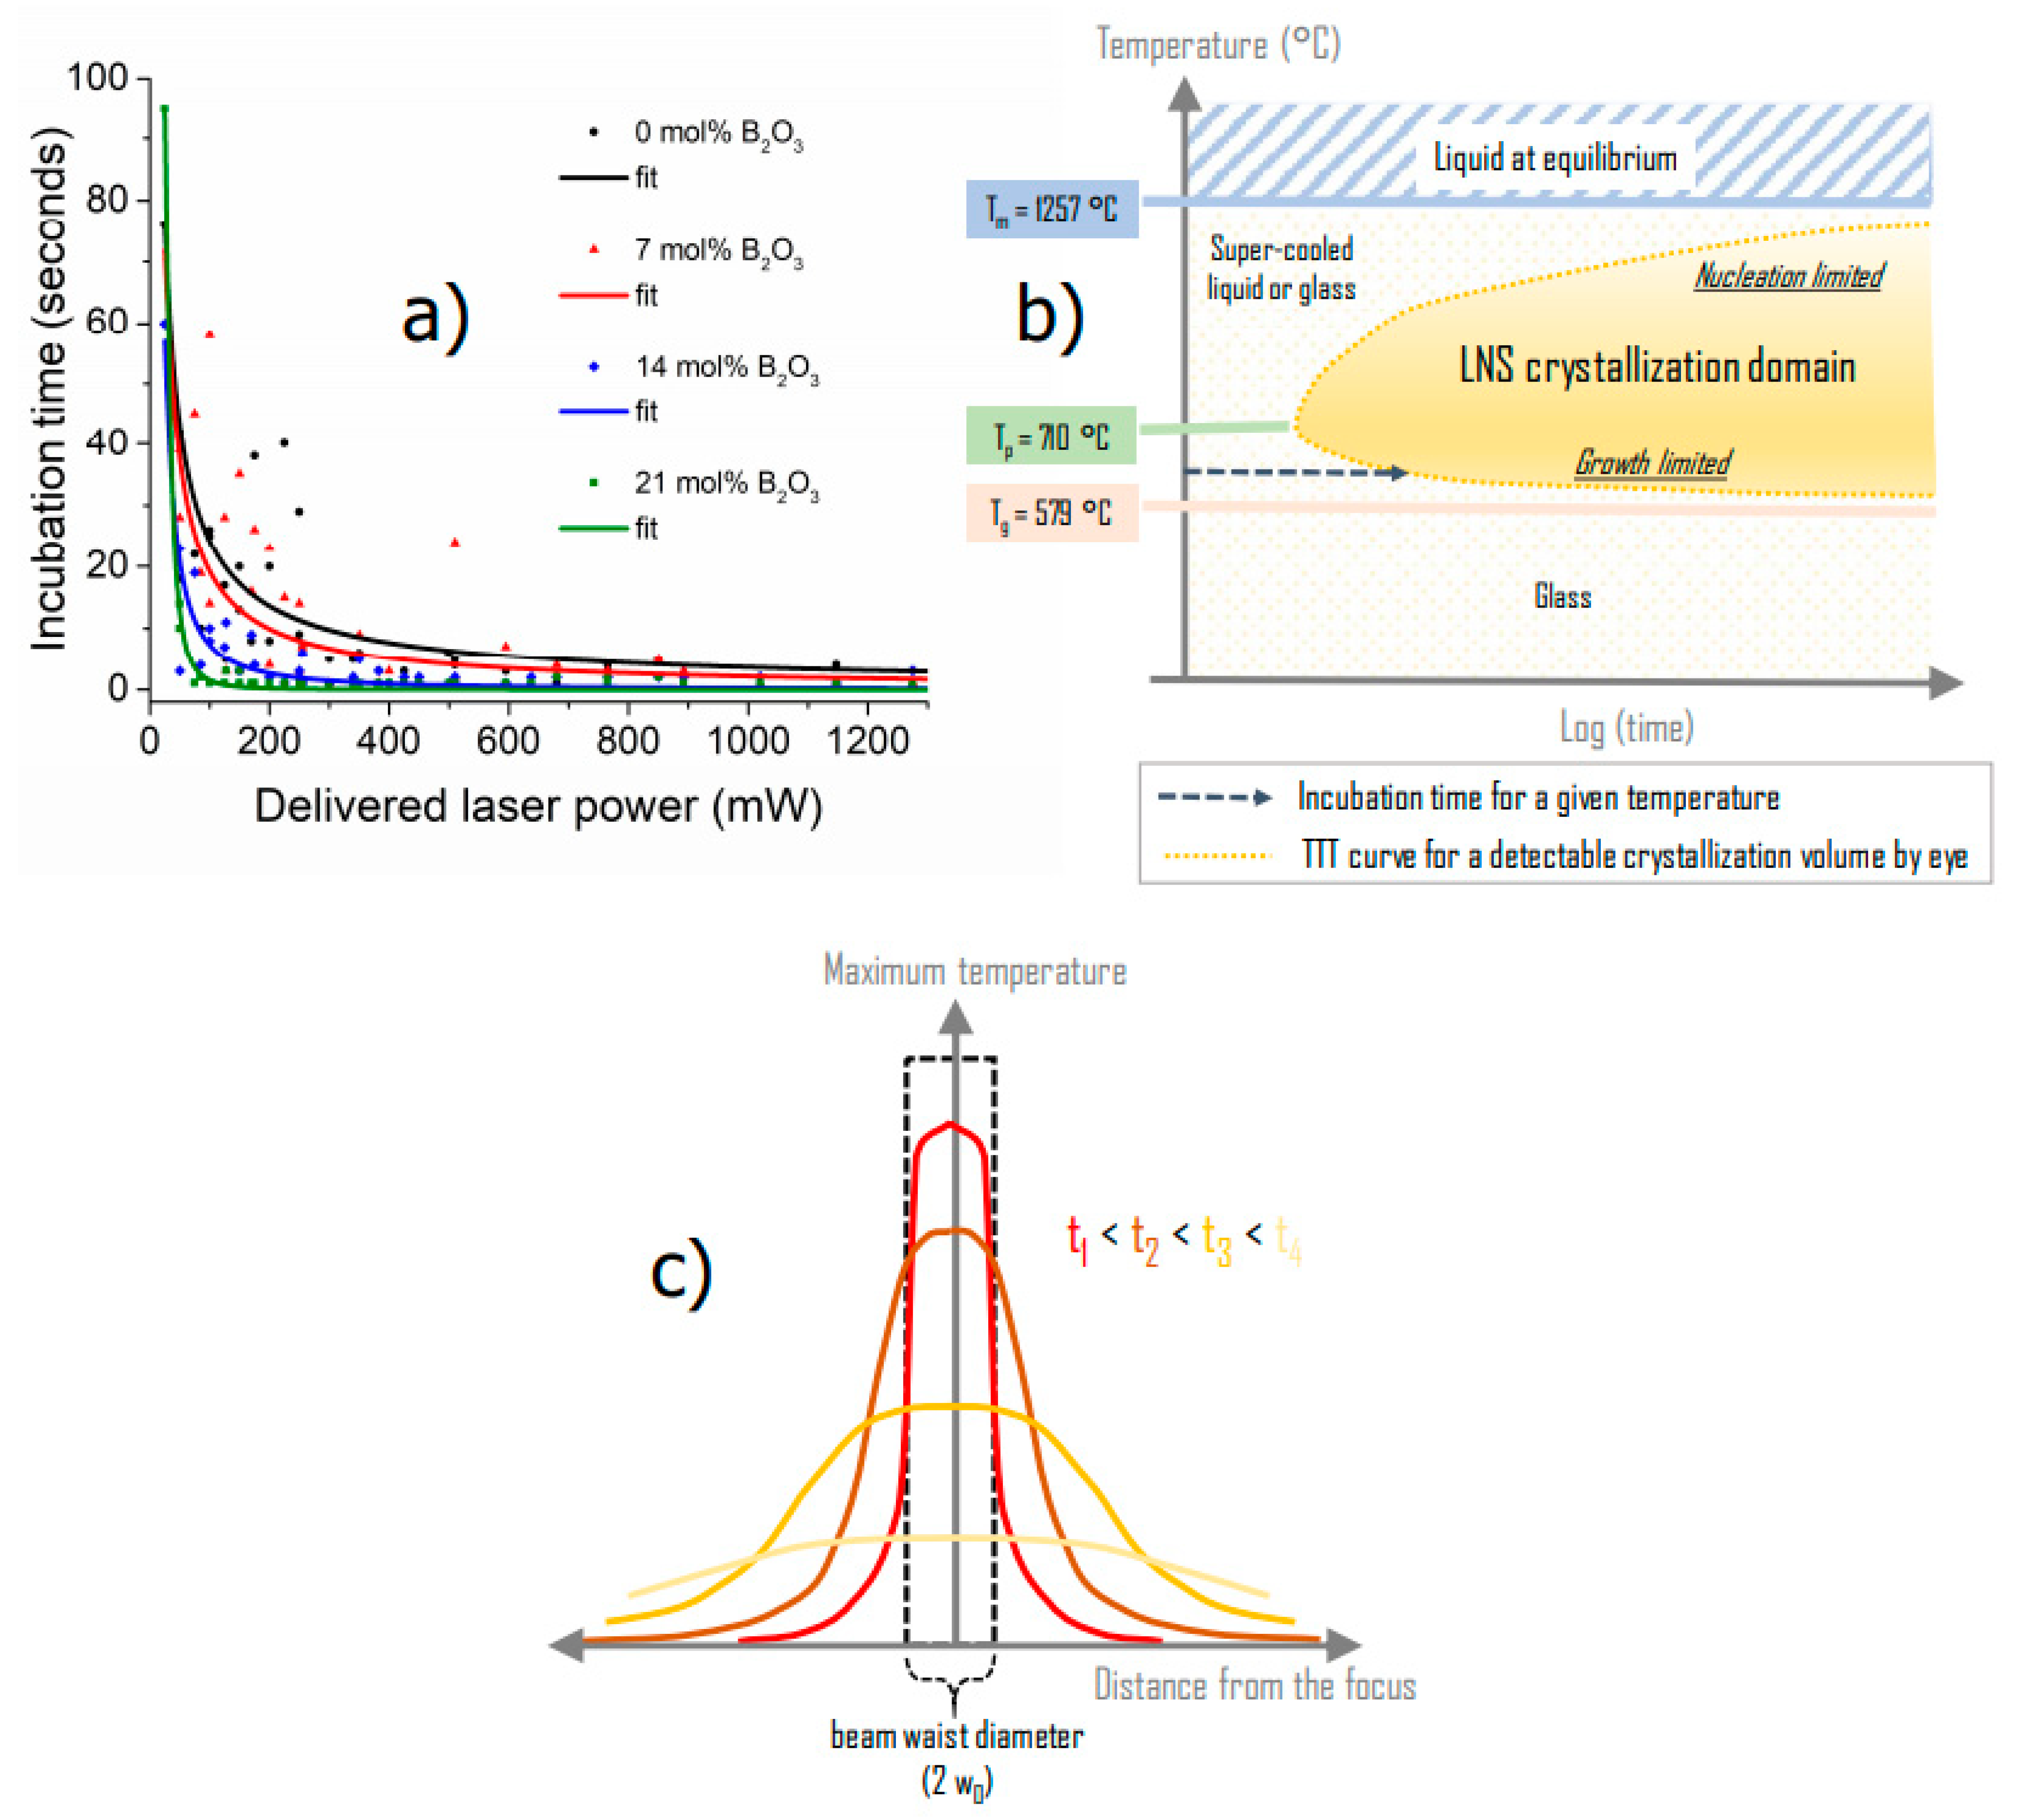
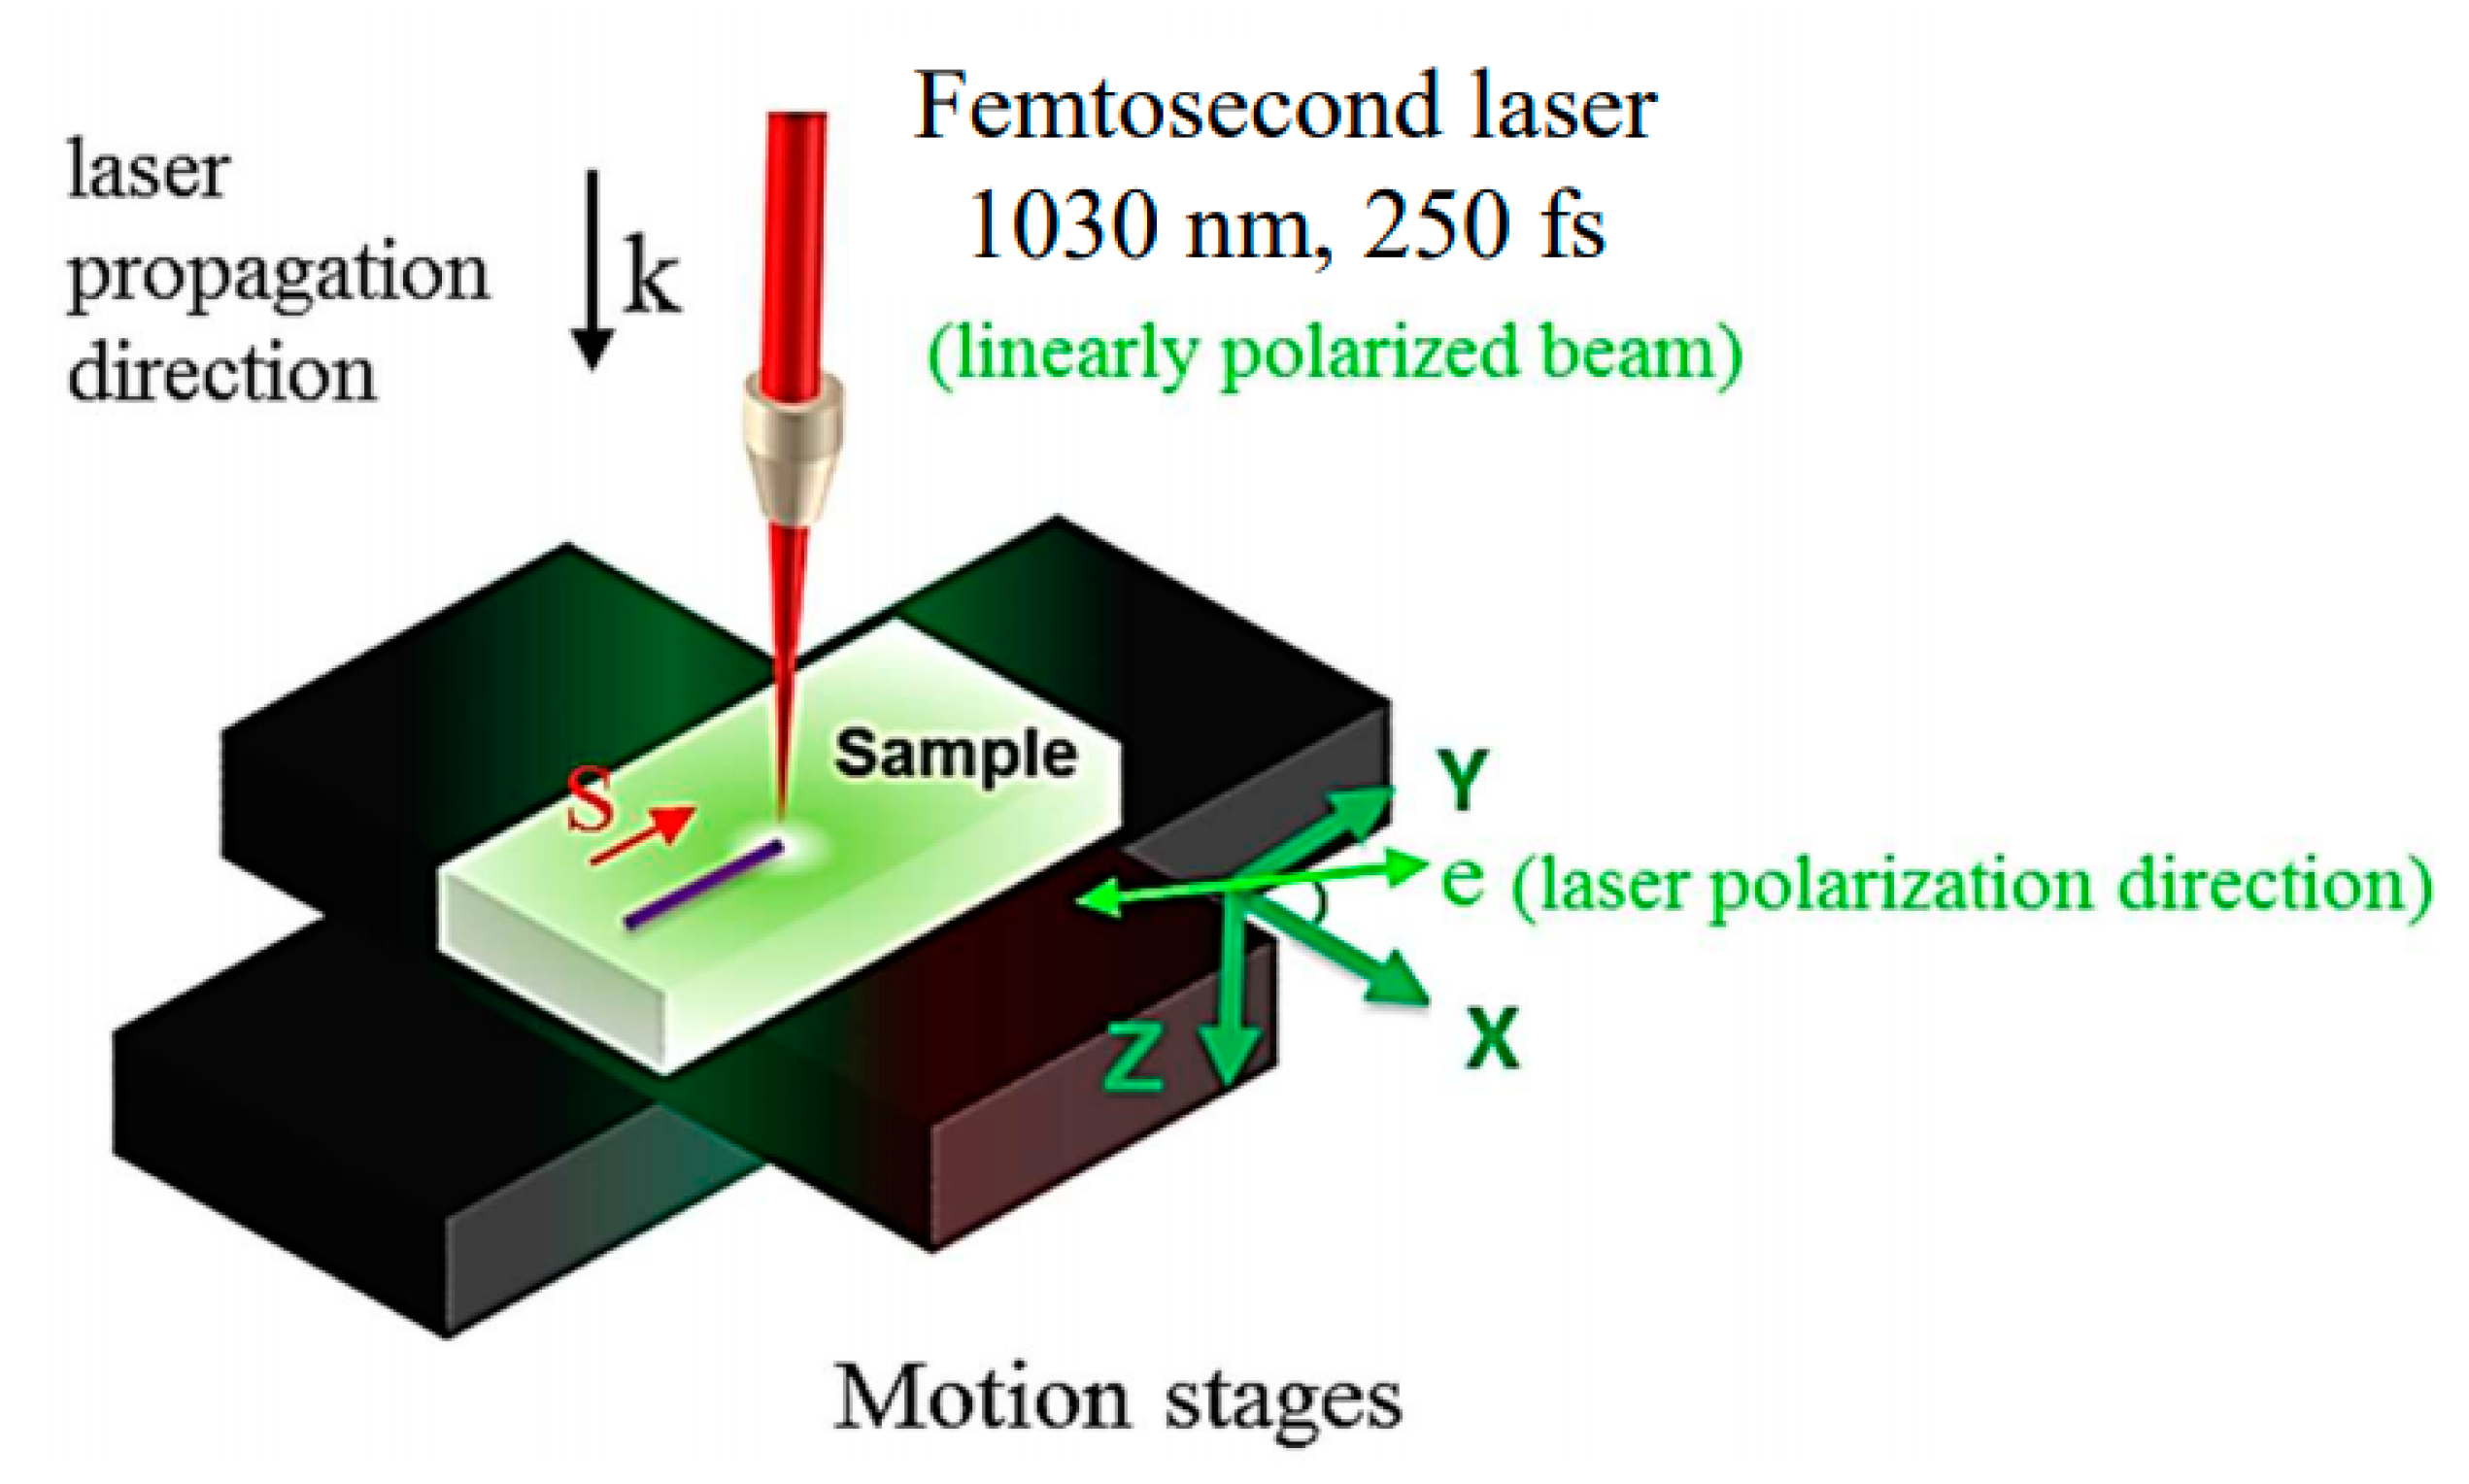
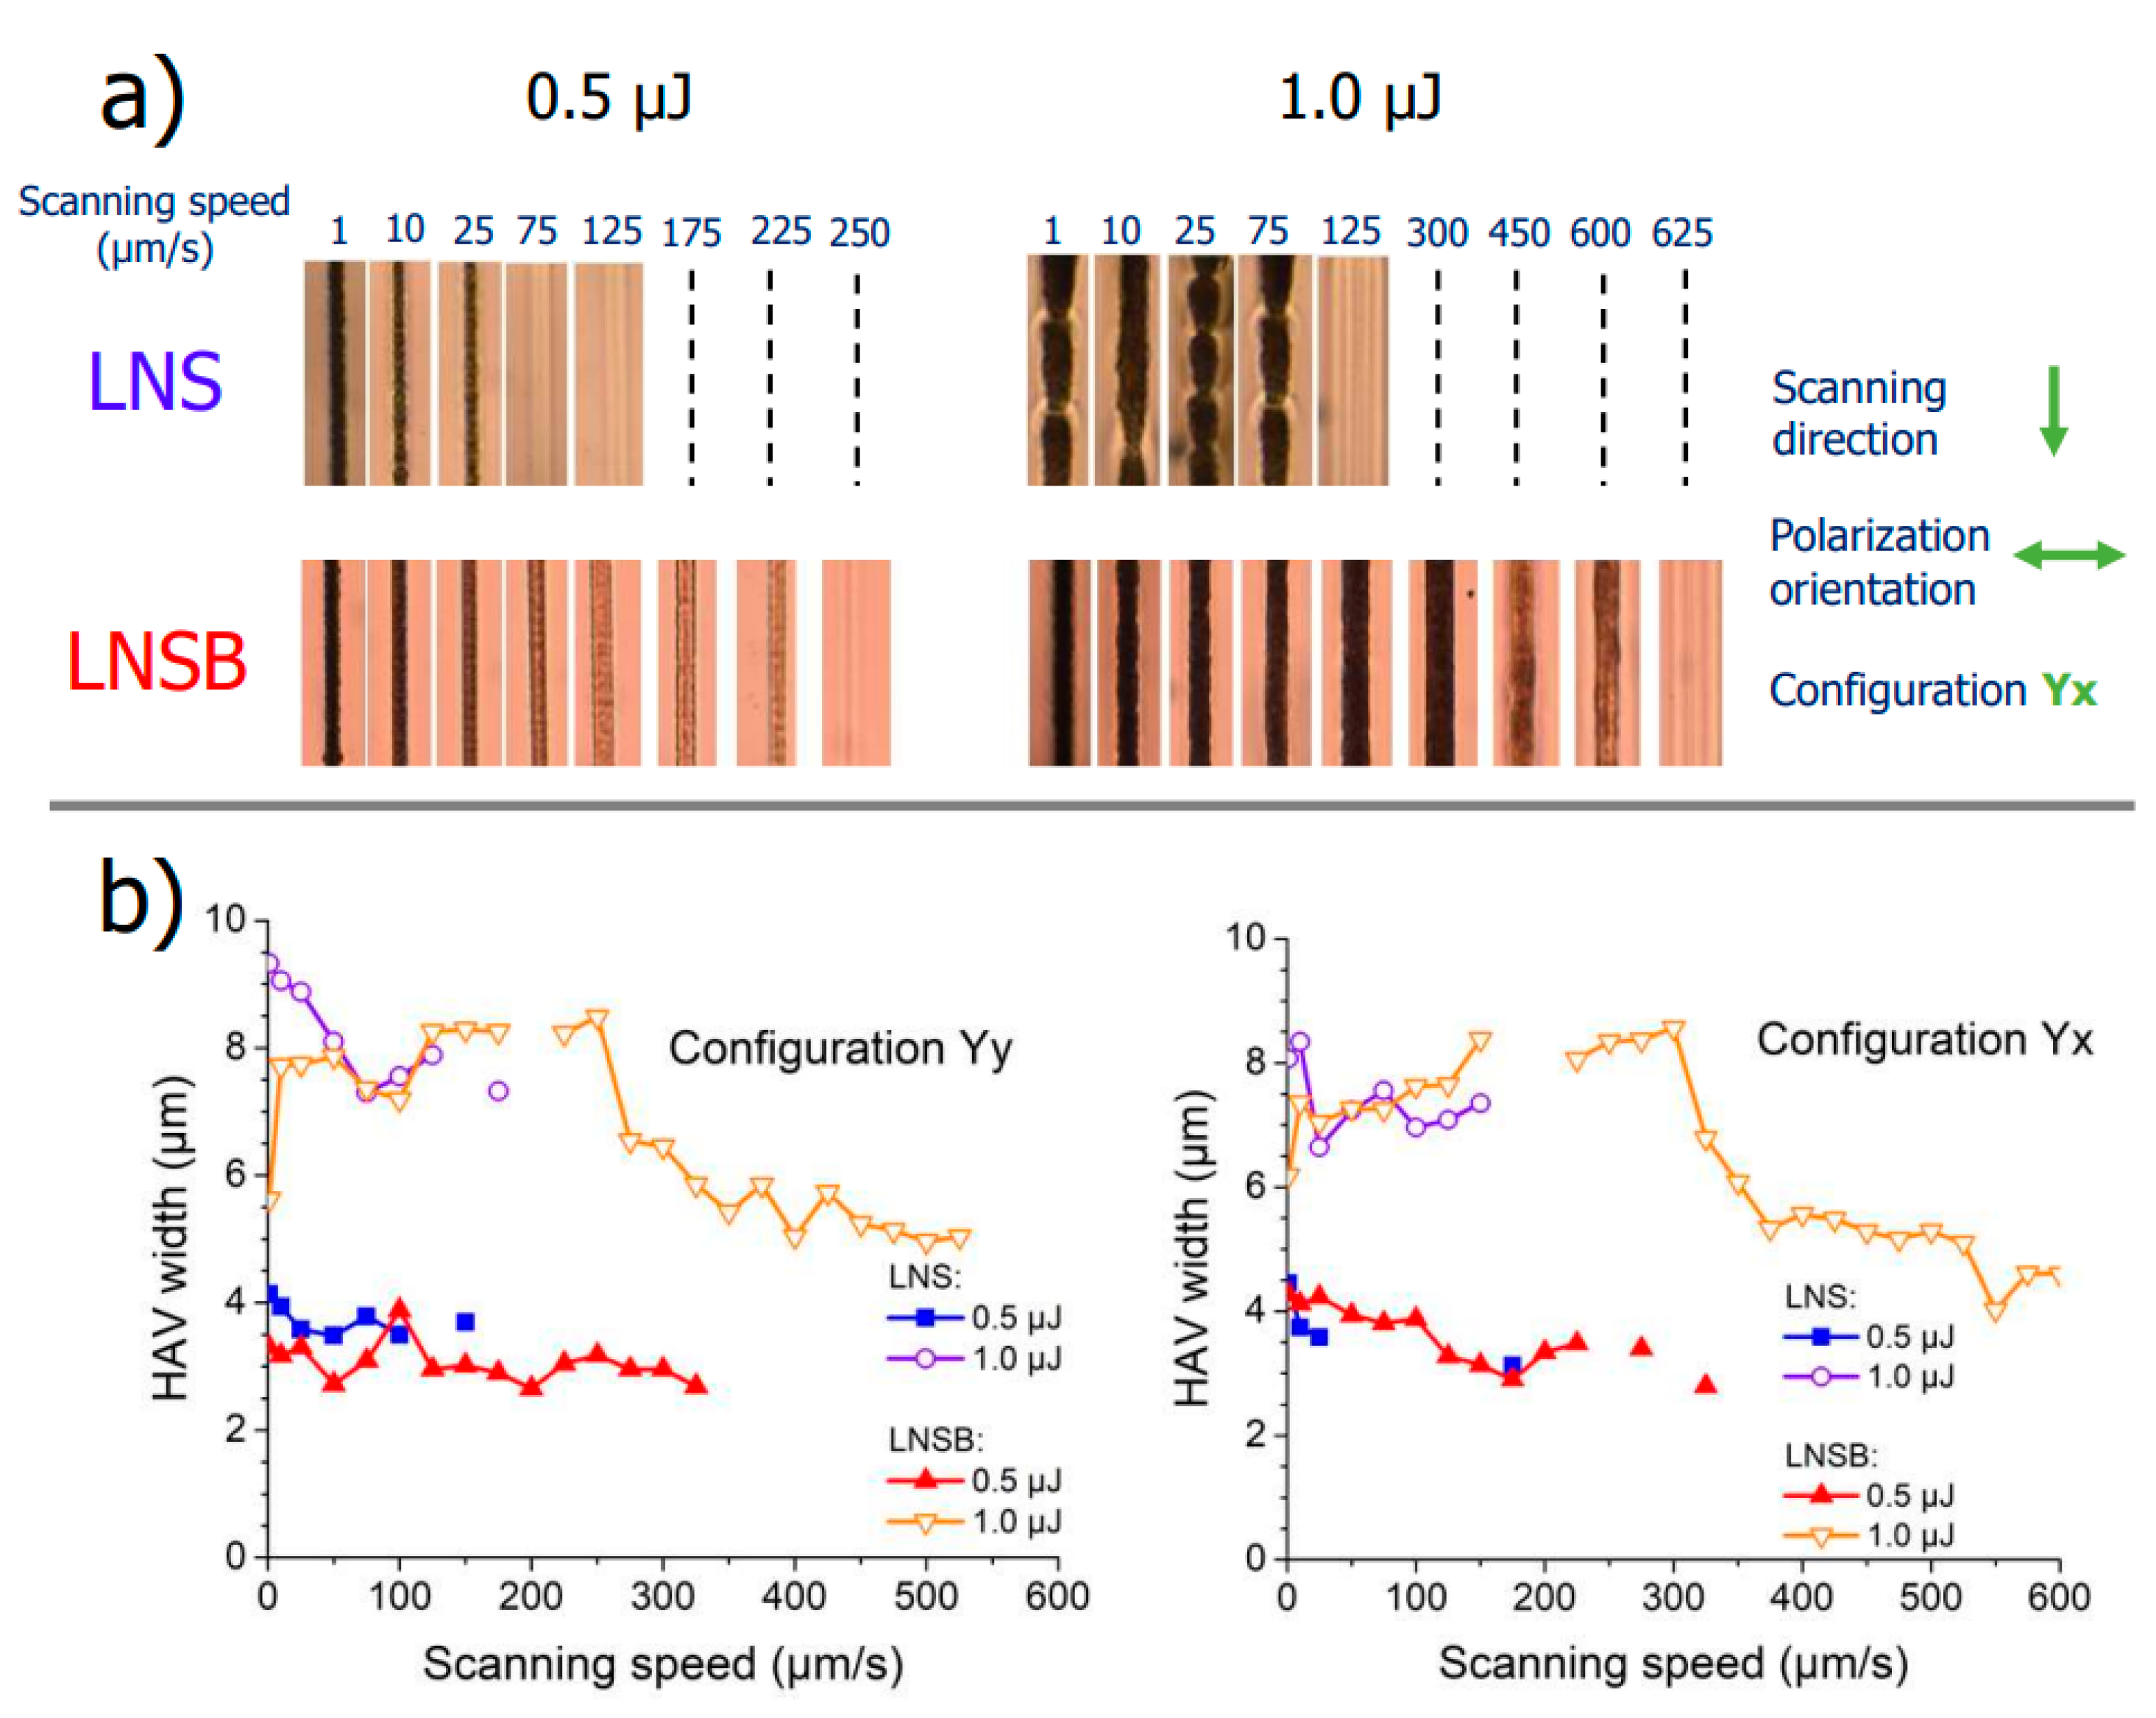
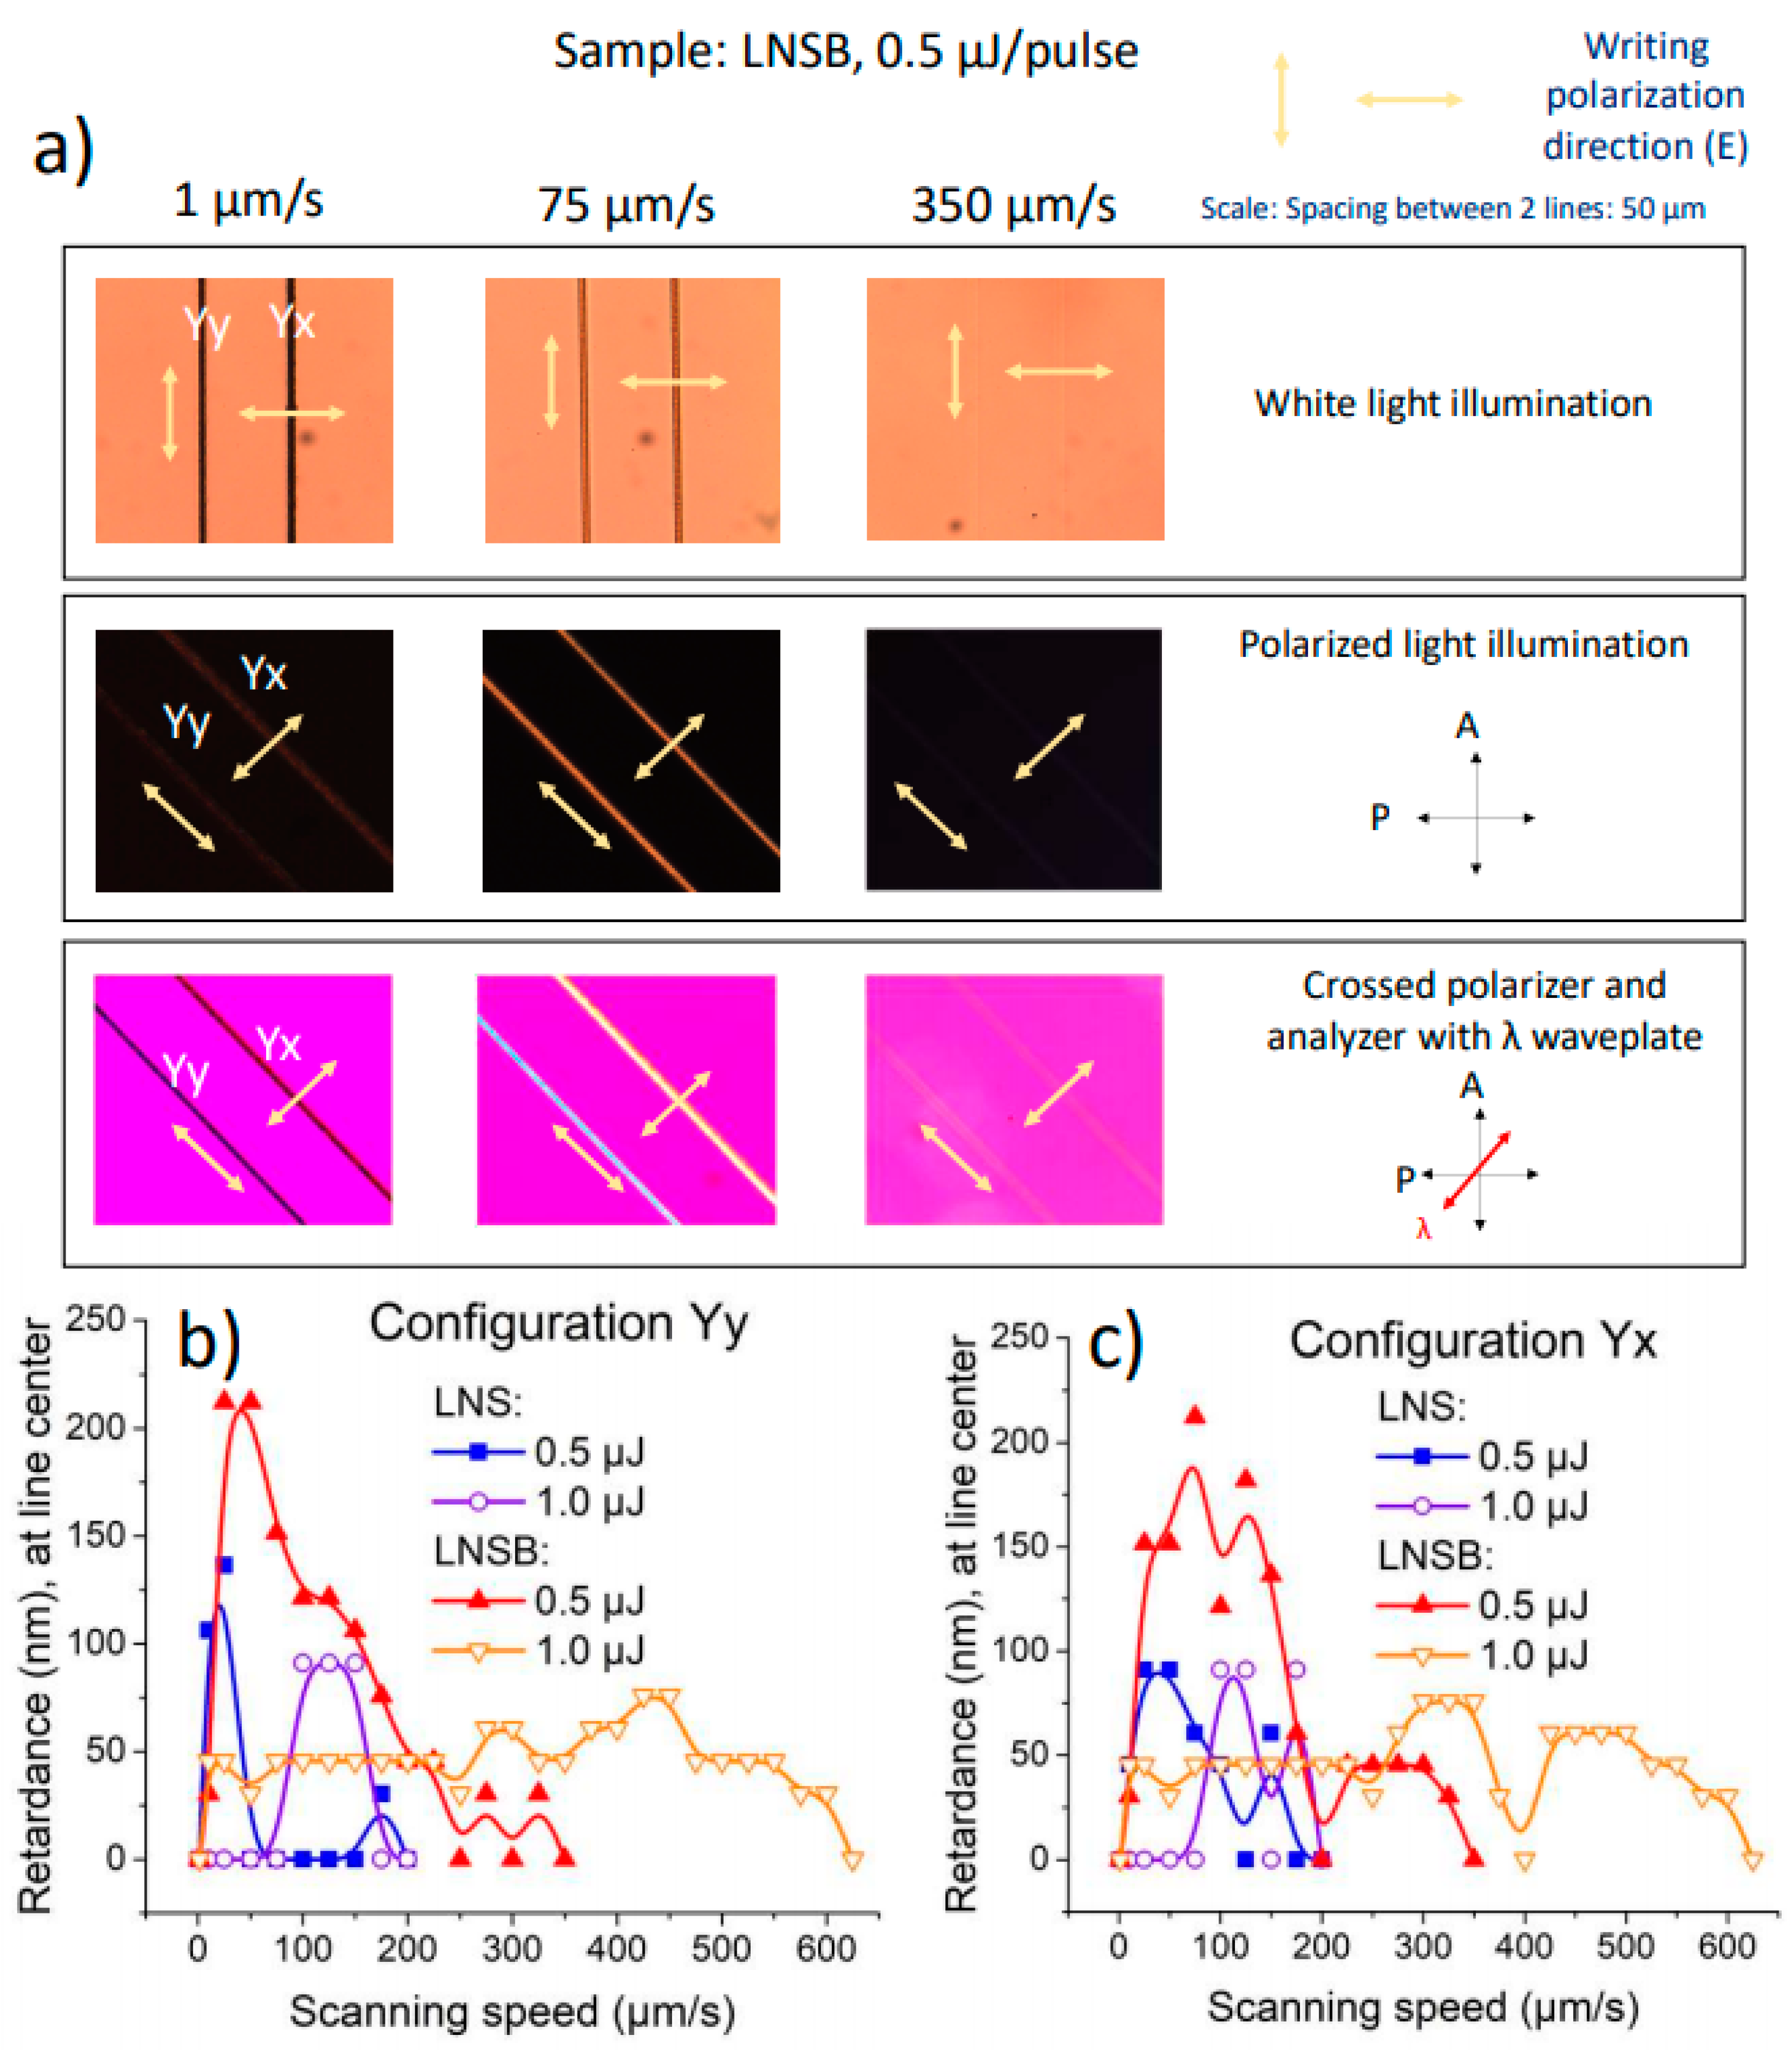
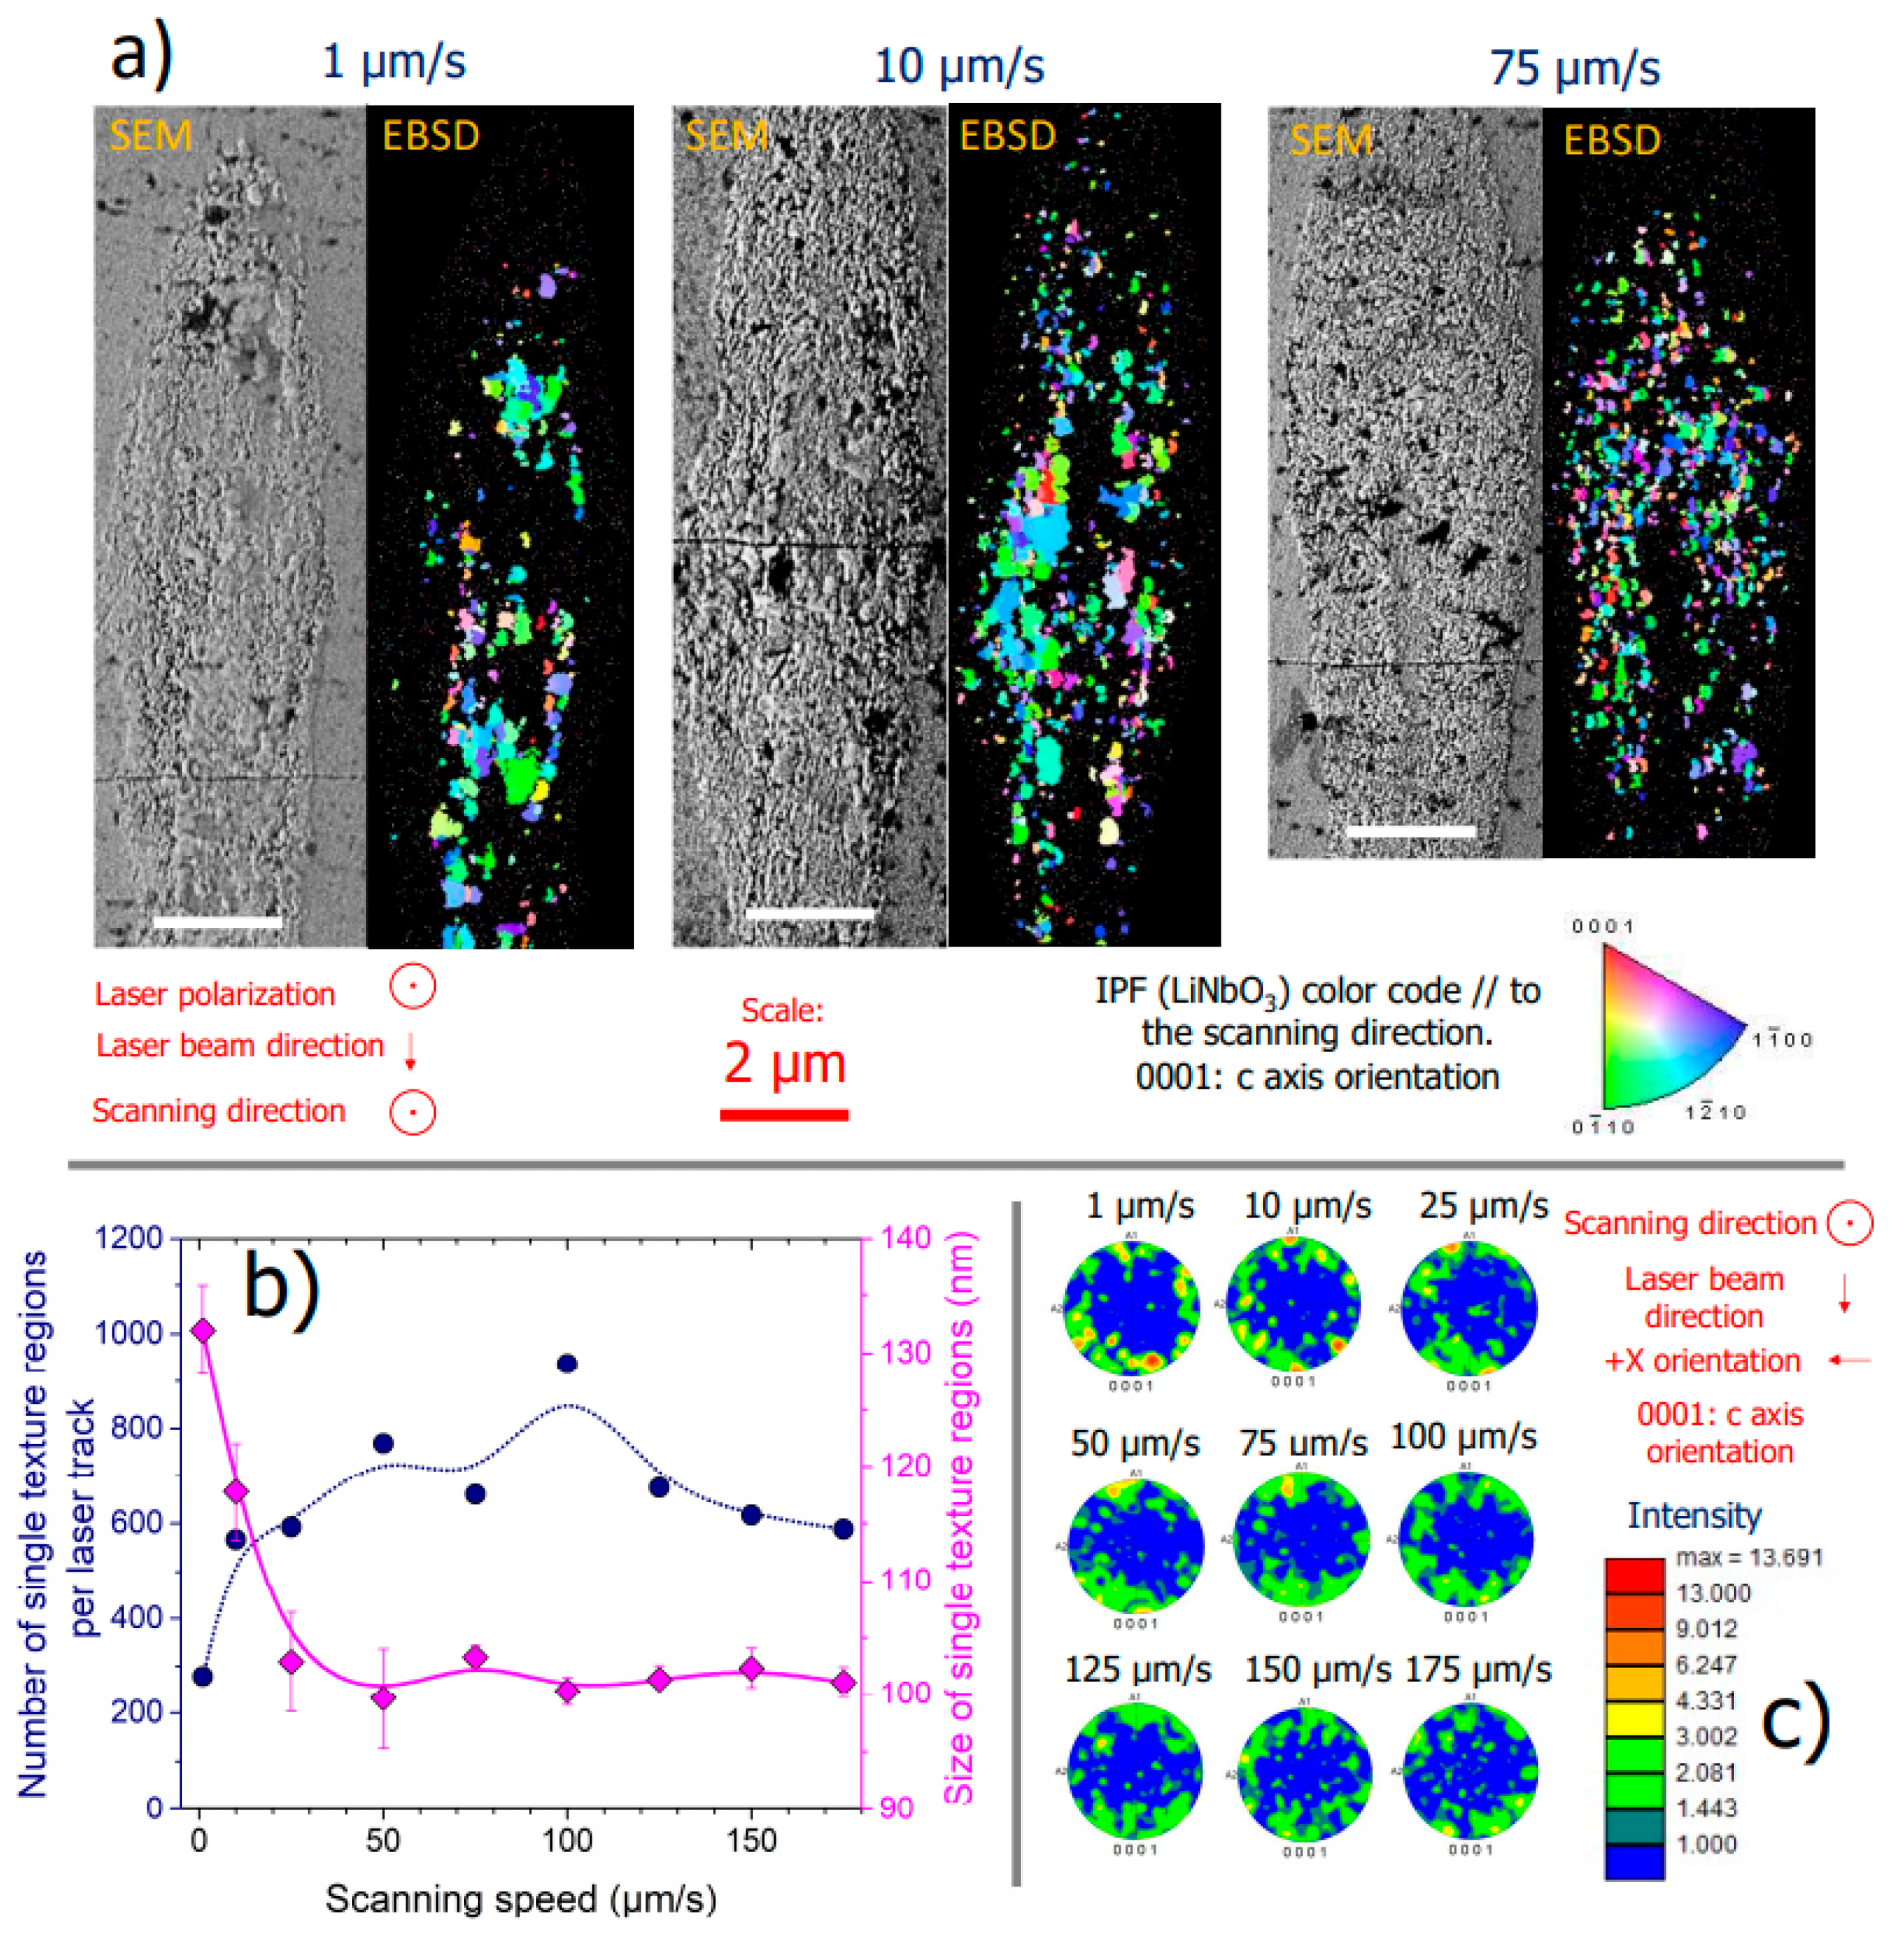
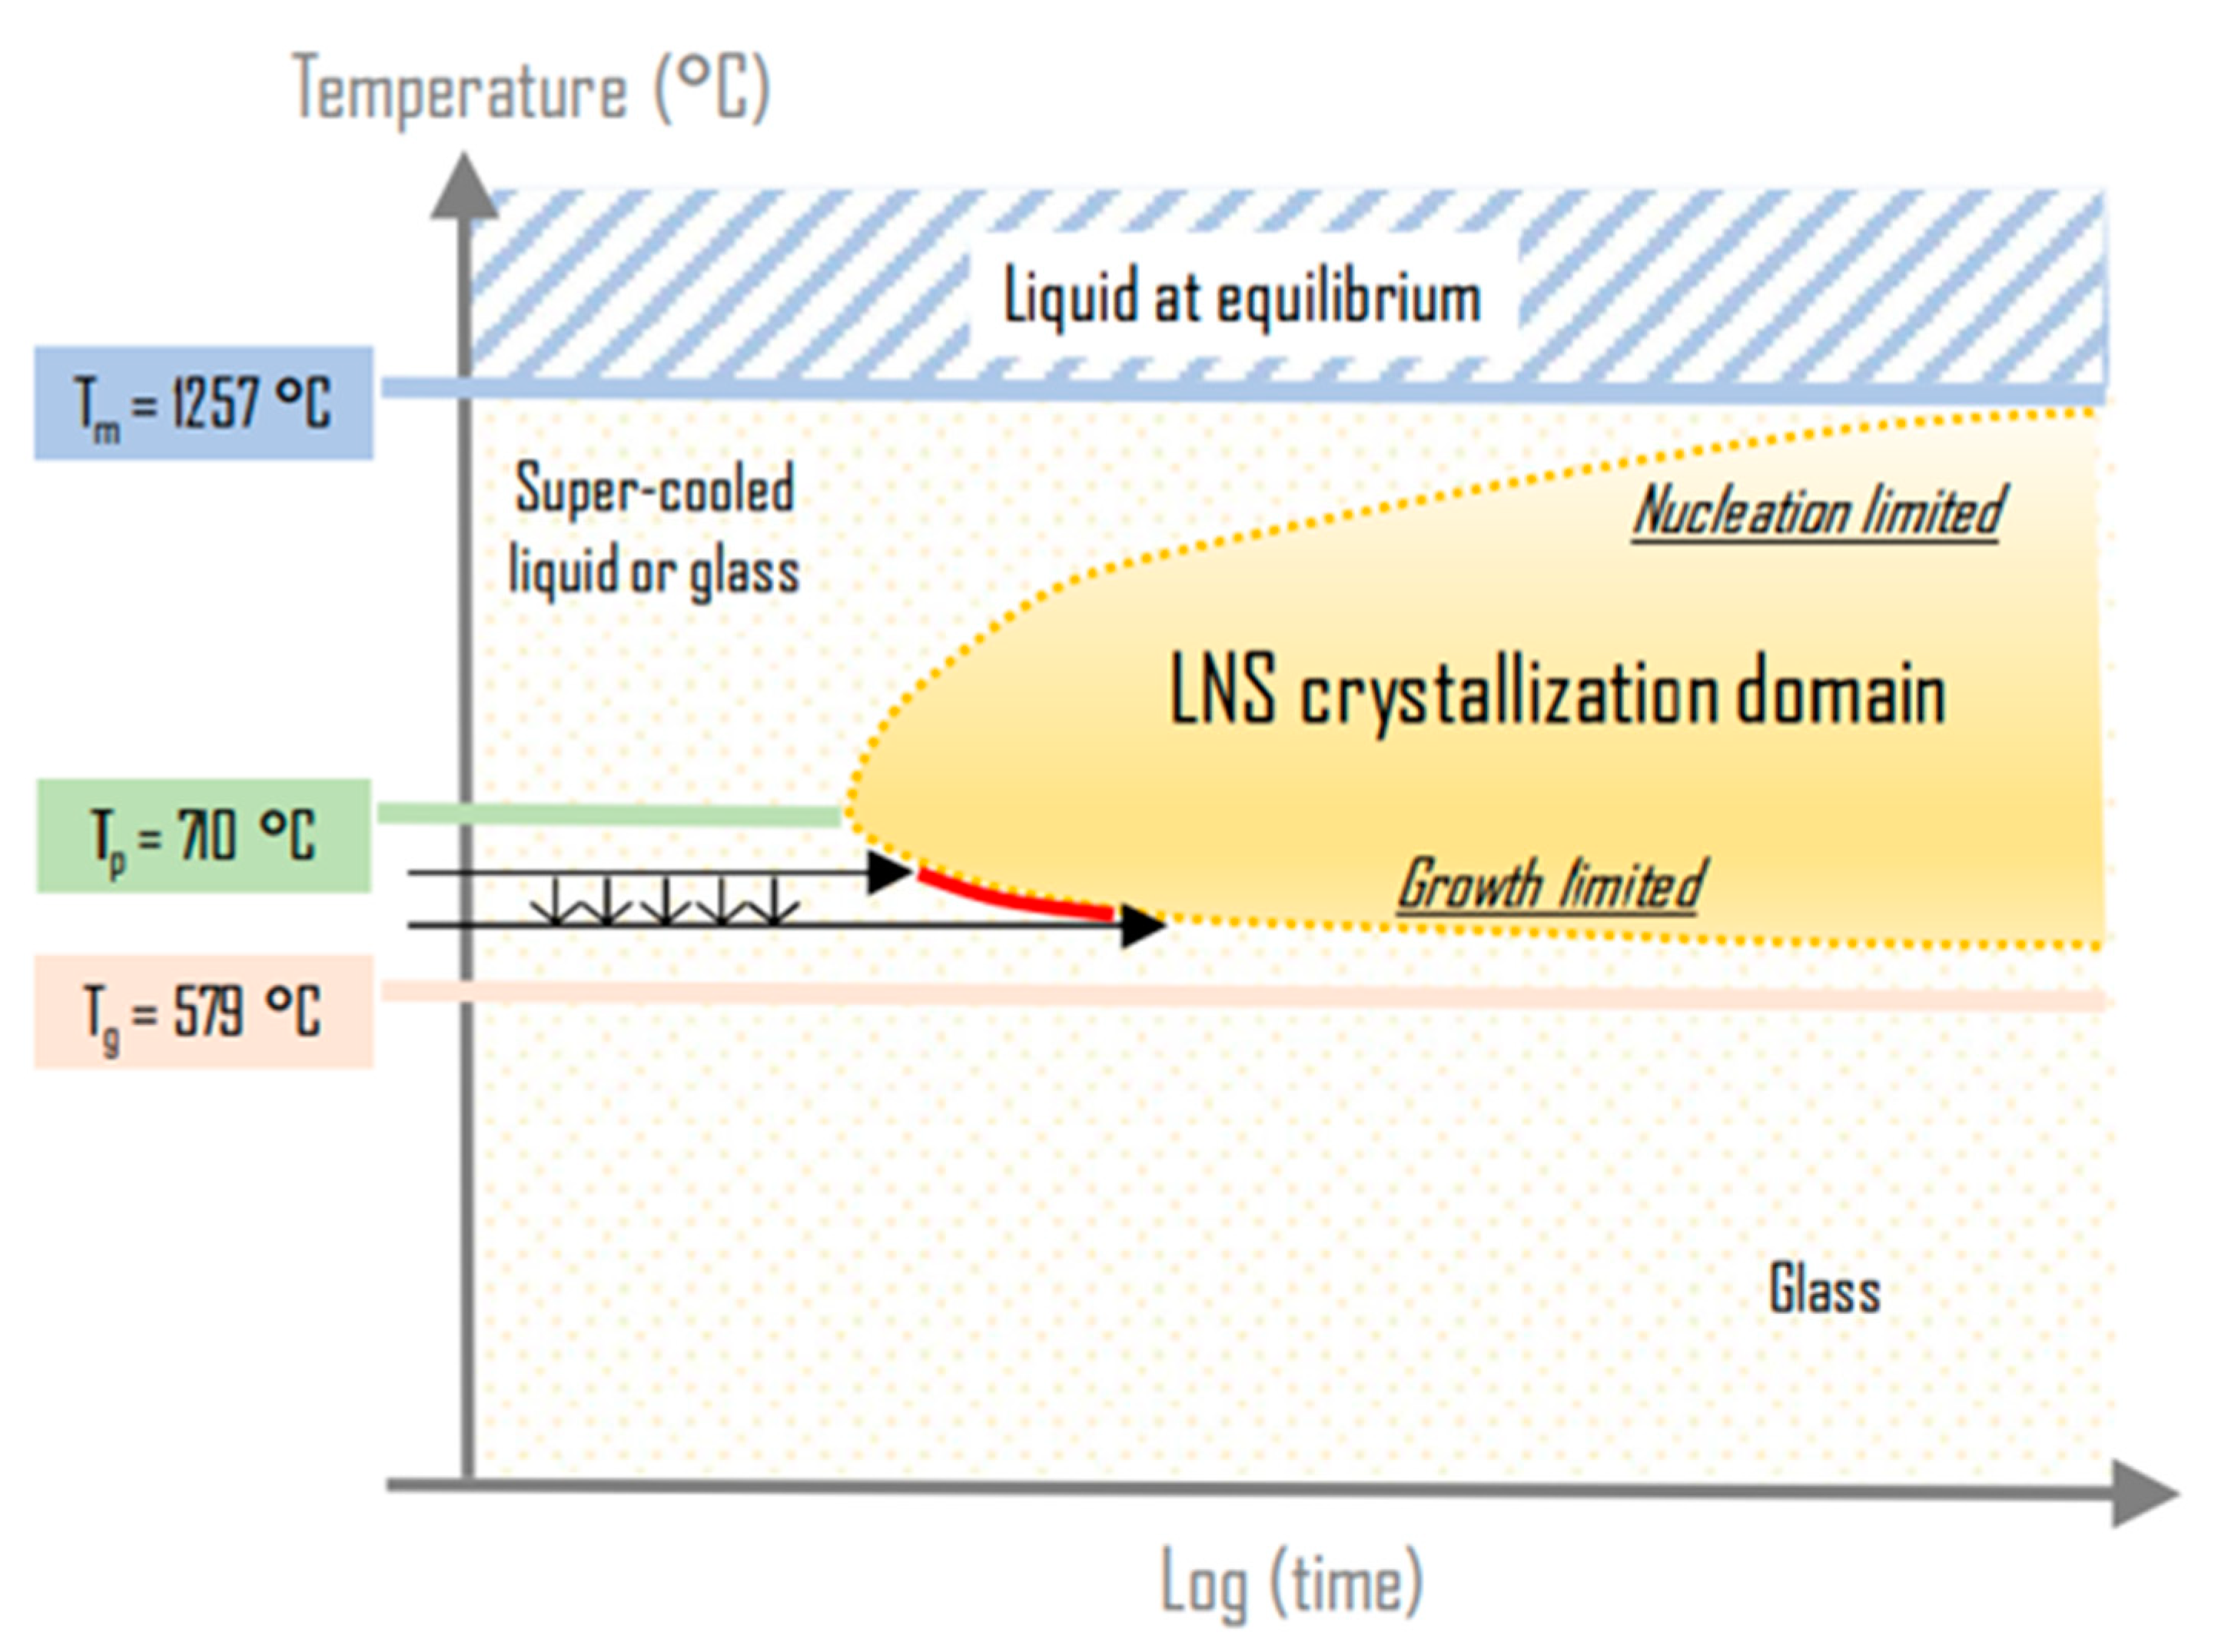
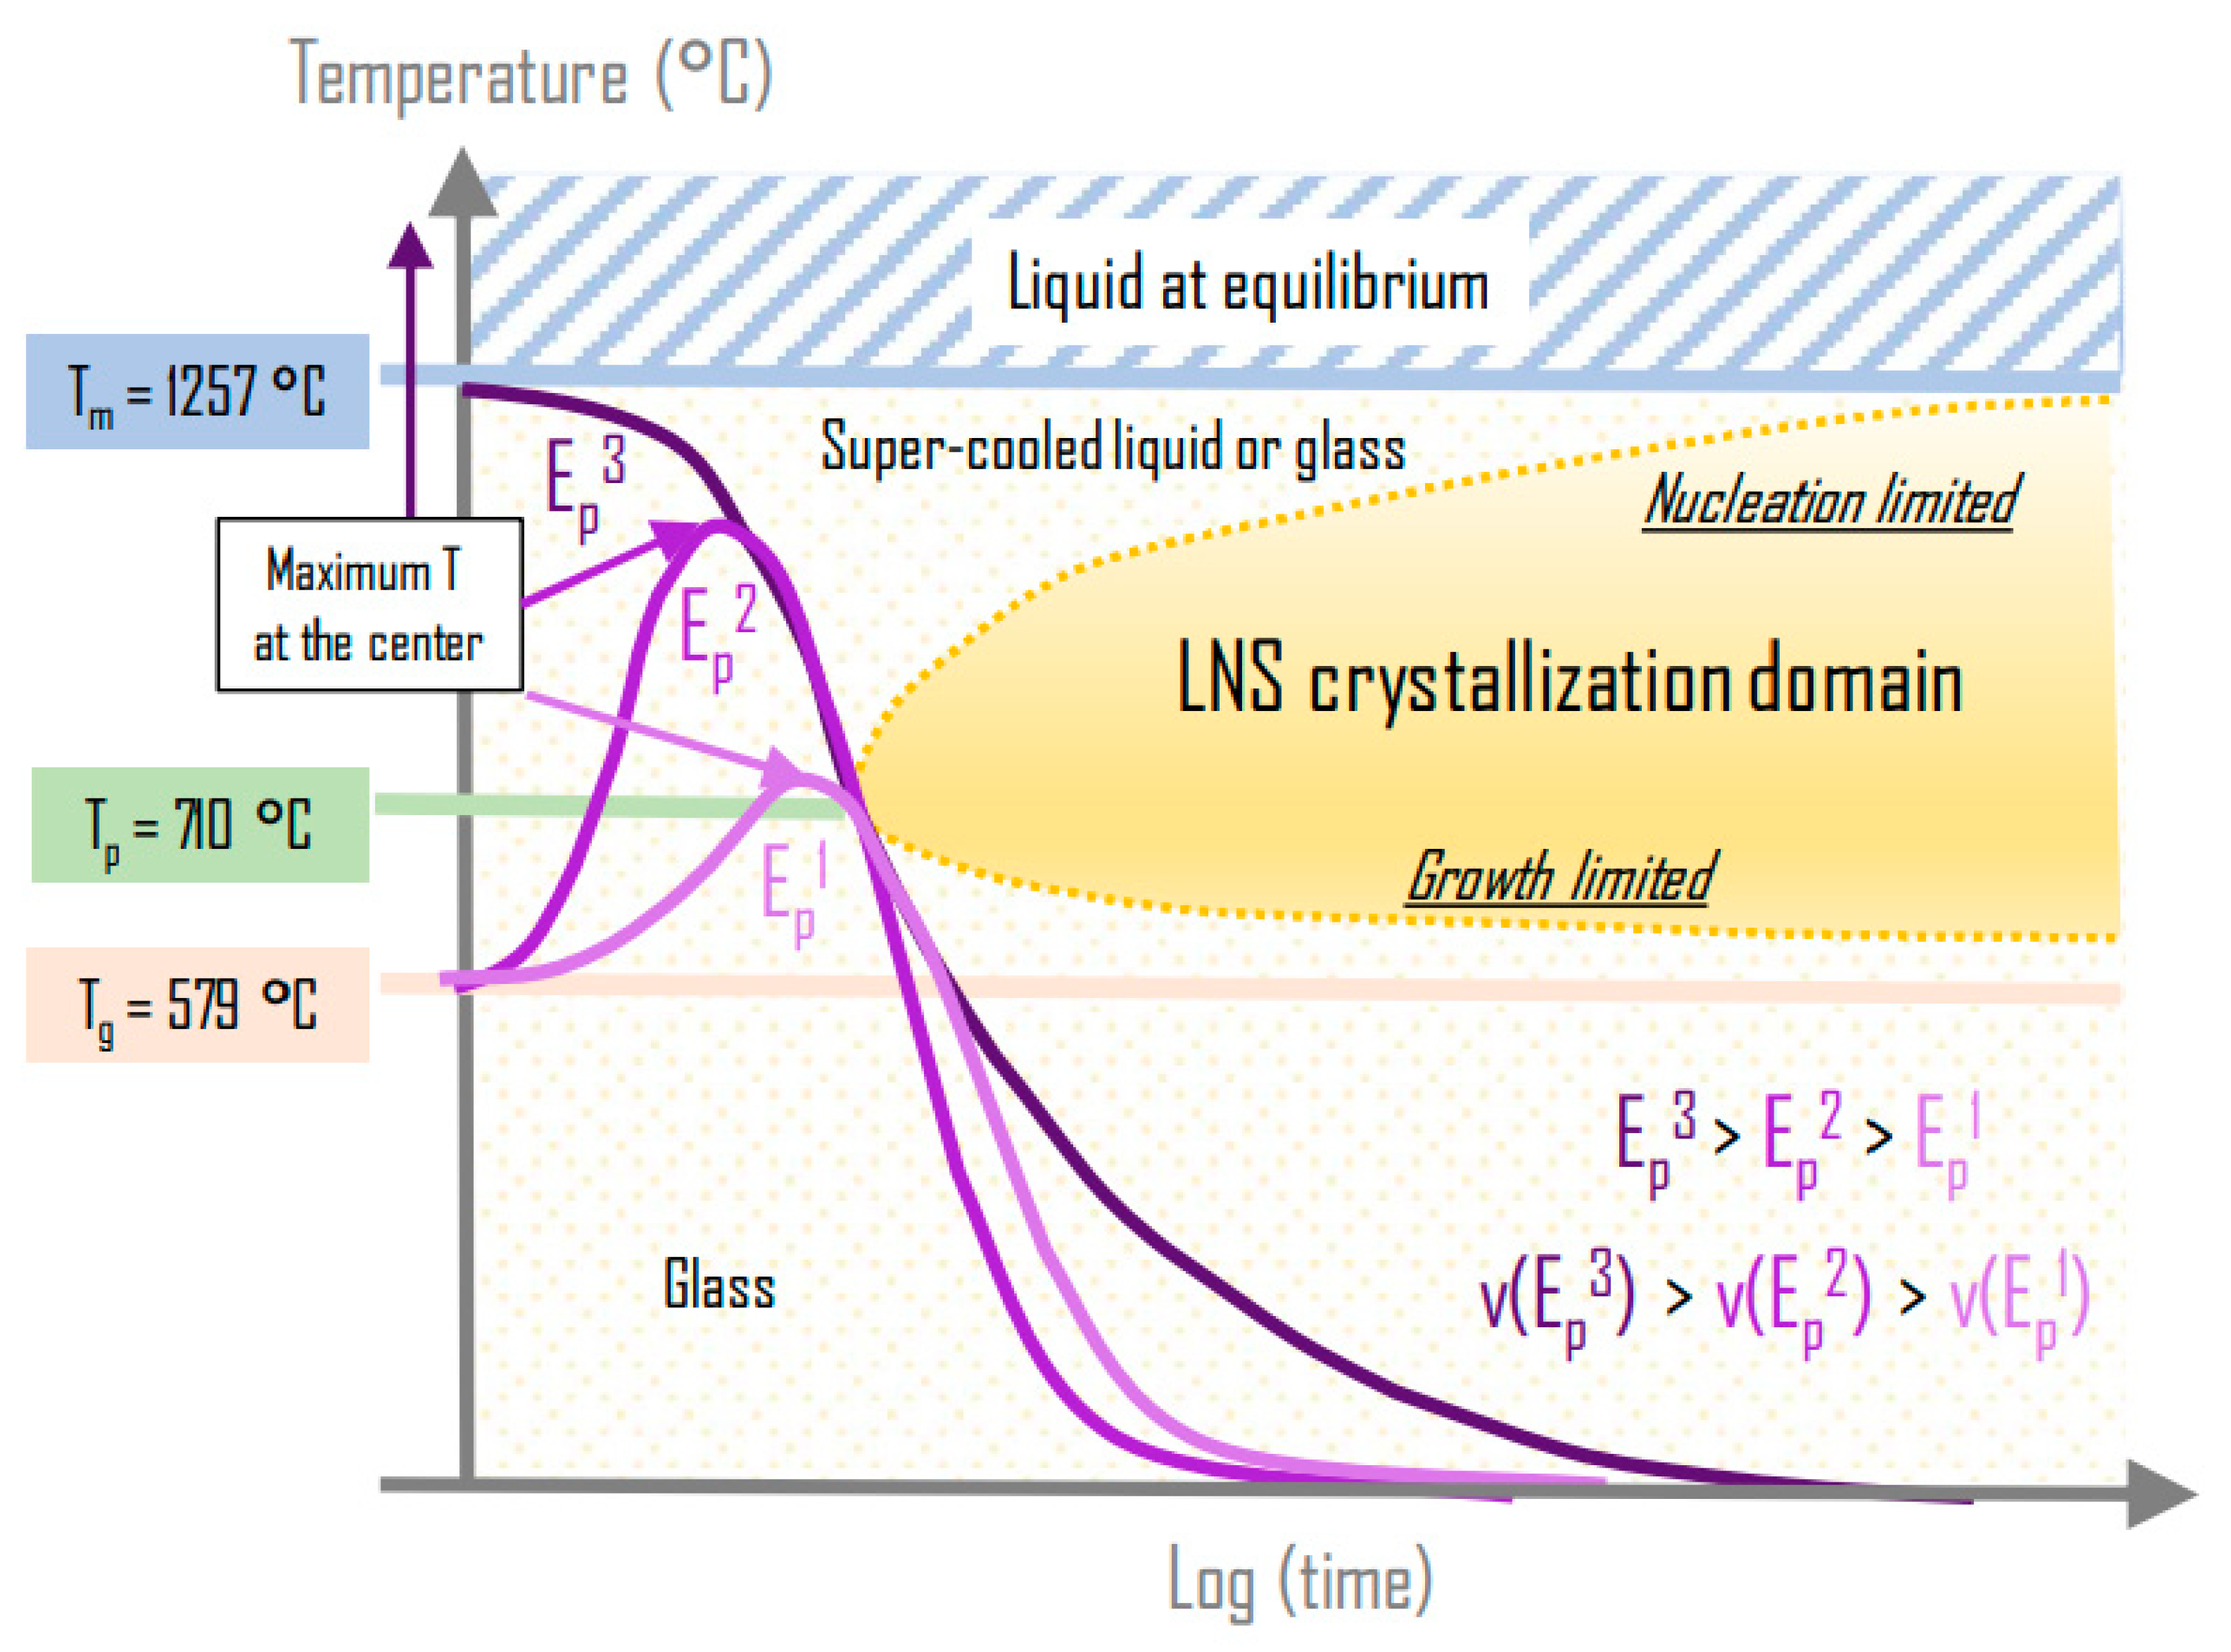


