Article

Influence of Temperature and Plastic Strain on Deformation Mechanisms and Kink Band Formation in Homogenized HfNbTaTiZr

by
Hans Chen
1,*,
Theresa Hanemann
1,
Sascha Seils
2,3,
Daniel Schliephake
2,
Aditya Srinivasan Tirunilai
2,
Martin Heilmaier
2,
Klaus-Peter Weiss
1 and
Alexander Kauffmann
2
1
Institute for Technical Physics, Karlsruhe Institute of Technology (KIT), 76344 Eggenstein-Leopoldshafen, Germany
2
Institute for Applied Materials (IAM-WK), Karlsruhe Institute of Technology (KIT), 76131 Karlsruhe, Germany
3
Karlsruhe Nano Micro Facility (KNMF), Karlsruhe Institute of Technology (KIT), 76344 Eggenstein-Leopoldshafen, Germany
*
Author to whom correspondence should be addressed.
Crystals 2021, 11(2), 81; https://doi.org/10.3390/cryst11020081
Submission received: 22 December 2020 / Revised: 16 January 2021 / Accepted: 19 January 2021 / Published: 21 January 2021
(This article belongs to the Special Issue Deformation Mechanisms in High Entropy Alloys)

Abstract

:
Due to its outstanding ductility over a large temperature range, equiatomic HfNbTaTiZr is well-suited for investigating the influence of temperature and plastic strain on deformation mechanisms in concentrated, body centered cubic solid solutions. For this purpose, compression tests in a temperature range from 77 up to 1073 K were performed and terminated at varying plastic strains for comparison of plastic deformation behavior. The microstructure and chemical homogeneity of a homogenized HfNbTaTiZr ingot were evaluated on different length scales. The compression tests reveal that test temperature significantly influences yield strength as well as work hardening behavior. Electron backscatter diffraction aids in shedding light on the acting deformation mechanisms at various temperatures and strains. It is revealed that kink band formation contributes to plastic deformation only in a certain temperature range. Additionally, the kink band misorientation angle distribution significantly differs at varying plastic strains.

Graphical Abstract

1. Introduction

Metals and alloys usually deform plastically by (uniform) dislocation slip or by deformation twinning if diffusion-based processes (at elevated temperatures) are excluded. In body centered cubic (bcc) metals and alloys, pencil glide occurs in { 011 } , { 132 } and { 121 } 1 2 1 1 ¯ 1 slip systems, whereas twinning is found in a { 112 } 1 6 1 ¯ 1 ¯ 1 -type system [1,2]. Additionally, localized deformation mechanisms can be active in metals and alloys, such as the formation of kink bands. Kink band formation was firstly described by Orowan [3] as a mechanism that can be neither assigned to uniform dislocation slip nor to deformation twinning. Kink bands form by highly localized dislocation-mediated rotation of one crystal/crystallite segment by a certain misorientation angle with respect to the non-kinked segment. The misorientation angle of the kinked region does not necessarily possess an obvious crystallographic relationship to the undeformed crystal [3]. This property unambiguously distinguishes kink bands from deformation twins [3]. The rotation axes depend on the crystal structure of the metals and alloys. In general, a certain rotation axis is located within the slip plane in operation and is perpendicular to the corresponding slip direction [4]. For bcc metals and alloys with 1 1 ¯ 1 slip directions and potential { 011 } , { 132 } and { 121 } slip planes, rotation axes are therefore expected to be of 21 1 ¯ -, 51 4 ¯ - and 1 ¯ 01 -type, respectively [5].
Localized plastic deformation by kink band formation has experimentally been revealed and investigated in bcc metals and alloys. For example, room temperature (RT) compression tests on Nb single crystals show that kink bands only form if the rotation results in a progressively increasing Schmid factor [4]. RT compression tests on oxygen containing β -Ti alloys reveal kink band formation being accompanied by deformation twinning and pencil glide all are possible mechanisms for plastic deformation [6,7]. Recently, kink bands have been found in a HfNbTaTiZr multi-principal element alloy after cold-rolling at RT [8]. This high entropy alloy (HEA) has attracted great interest as a candidate for novel structural applications [9] due to its outstanding combination of strength and ductility over a wide range of temperatures [10,11]. HEAs are expected to form single-phase solid solutions [12]. However, HfNbTaTiZr exhibits a tendency for segregation and even precipitation at intermediate temperatures [13]. In equiatomic HfNbTaTiZr, it is shown that the misorientation angle seems to vary along the kink band boundary and that the kink band misorientation apparently increases with increasing plastic strain [8].
Although the presence of kink bands after RT deformation has been proven in single-phase bcc HfNbTaTiZr, the temperature influence on active deformation mechanisms and, particularly, kink band properties has to be clarified. As already stated, the formation of kink bands is based on the rotation of crystal segments. The rotation occurs by localized dislocation slip within slip planes, which become kink band boundaries [4]. However, dislocation slip of bcc metals and alloys is strongly temperature-dependent [14]. In the low-temperature range (defined as temperature range “I” in this work), the comparably high Peierls barrier for screw dislocations governs dislocation motion leading to increased yield strength [15]. Work hardening is mainly governed by the multiplication of screw dislocations and their interaction causing jog formation [16]. In an intermediate temperature range (temperature regime “II”), above the characteristic knee temperature [17], screw dislocations are able to easily cross-slip and, thereby, generate dislocation sources [16]. In this temperature regime, strength is temperature- and strain rate-independent. At homologous temperatures T h o m   0.5 [18] (temperature regime “III”), diffusion-based climb of edge dislocations can influence the work hardening behavior [18]. The characteristic temperature regimes I, II and III were experimentally proven in high entropy alloys from the Nb-Mo-Cr-Ti-Al system [19].
In this work, plastic deformation behavior with a focus on kink band formation under various temperature and strain conditions was investigated in terms of terminated compression tests in a temperature range from 77 up to 1073 K and a plastic strain range between 1.9% and 16.3%. The appearance and properties of kink bands are investigated in terms of electron backscatter diffraction (EBSD).

2. Materials and Methods

Equiatomic HfNbTaTiZr was synthesized by arc melting in an AM/0.5 device (Edmund Bühler GmbH, Bodelshausen, Germany) from elemental granules of Hf, Nb, Ta, Ti, and Zr with purities higher than 99.8% in all cases. The melting process was performed in Ar atmosphere using a water-cooled Cu crucible. The HfNbTaTiZr ingot was re-melted five times to ensure uniform element distribution. Prior to each melting step, the disc-shaped specimen was flipped, and a Zr lump was melted to getter residual O within the process chamber. The alloy composition, estimated by means of inductively coupled plasma optical emission spectrometry (ICP-OES), is presented in Table 1. In order to obtain a chemically homogeneous microstructure, the ingot was homogenized in a tube furnace (Carbolite Gero GmbH and Co. KG, Neuhausen, Germany) at a temperature of 1473 K for 24 h under flowing Ar gas and subsequently furnace-cooled. The mean value and standard deviation of O concentration in the homogenized state was determined by means of hot gas carrier extraction, averaging three measurements.
For crystal structure and phase analysis, a Bruker D8 Discover X-ray diffraction (XRD) device equipped with a LynxEye XE line detector was used in a 2 Θ range of 10 up to 140° and a step size of 0.03° while rotating the sample at a speed of 0.5 s−1. The Bragg-Brentano experiment was performed using a Cu Kα radiation source at 40 kV and 40 mA and 2.5° Soller slits on both, beam and detector side. Further microstructural investigations in terms of electron channeling contrast imaging (ECC) and energy-dispersive X-ray spectroscopy (EDX) were performed using an Apreo scanning electron microscope (SEM; Thermo Fisher Scientific Inc., Waltham, USA). For attaining ECC, the SEM was operated at an acceleration voltage of 15 kV, a beam current of 3.2 nA, and an aperture size of 32 µm. For EDX mapping, an Octane Elite system by EDAX (AMETEK Inc., Berwyn, USA) was used at an acceleration voltage of 25 kV, a step size of 3 µm, a dwell time of 100 µs, and a total number of 20 frames. A Strata dual beam device (Thermo Fisher Scientific Inc., Waltham, USA) was used to prepare tip-shaped specimens for atom probe tomography (APT). A LEAP 4000X HR atom probe (Cameca SAS, Gennevilliers, France) was used in pulsed laser mode for the analysis. Laser pulses had a repetition rate of 125 kHz with a pulse energy of 50 pJ. The detection rate was set to 0.3% fraction of pulses, leading to ion detection. The reconstruction and analysis of the APT experiment were conducted with the IVAS 3.6.14 software of Cameca SAS.
Terminated, displacement-controlled compression tests were conducted in a temperature range of 77 up to 298 K as well as in a range of 873 up to 1073 K on a MTS25 testing device equipped with a CryoVac He gas continuous flow cryostat and a Zwick Z100 universal testing device equipped with a Maytec resistance furnace, respectively. The term “terminated” means that the compressions tests were purposely stopped at desired plastic strains. The strain was measured using extensometers to avoid discrepancies by finite machine compliance. The cuboidal samples with (3 · 3 · 4.5) mm3 in dimensions were loaded with an initial strain rate of 10−3 s−1. In order to avoid barreling during compression tests, the samples were lubricated using BN spray films. Plastic deformation behavior was investigated by evaluating engineering stress; load with respect to the initial cross-section area of the compression sample, with respect to engineering strain; the difference in height with respect to initial sample height in stress-strain curves to ensure immediate comparison to literature data [9,11].
For the investigation of deformation mechanisms, EBSD on longitudinal sections of deformed samples was performed using a Auriga 60 dual beam microscope (Carl Zeiss AG; Oberkochen, Germany) equipped with an EDAX DigiView (AMETEK Inc., Berwyn, USA) EBSD system. Data were acquired on an area of (2100 · 2100) µm2 in size at a step size of 5 µm for an overview, whereas regions of interests (ROI) were scanned at a step size of 0.8 µm. EBSD data of the bcc phase was handled with the Matlab tool MTex [20].

3. Results and Discussion

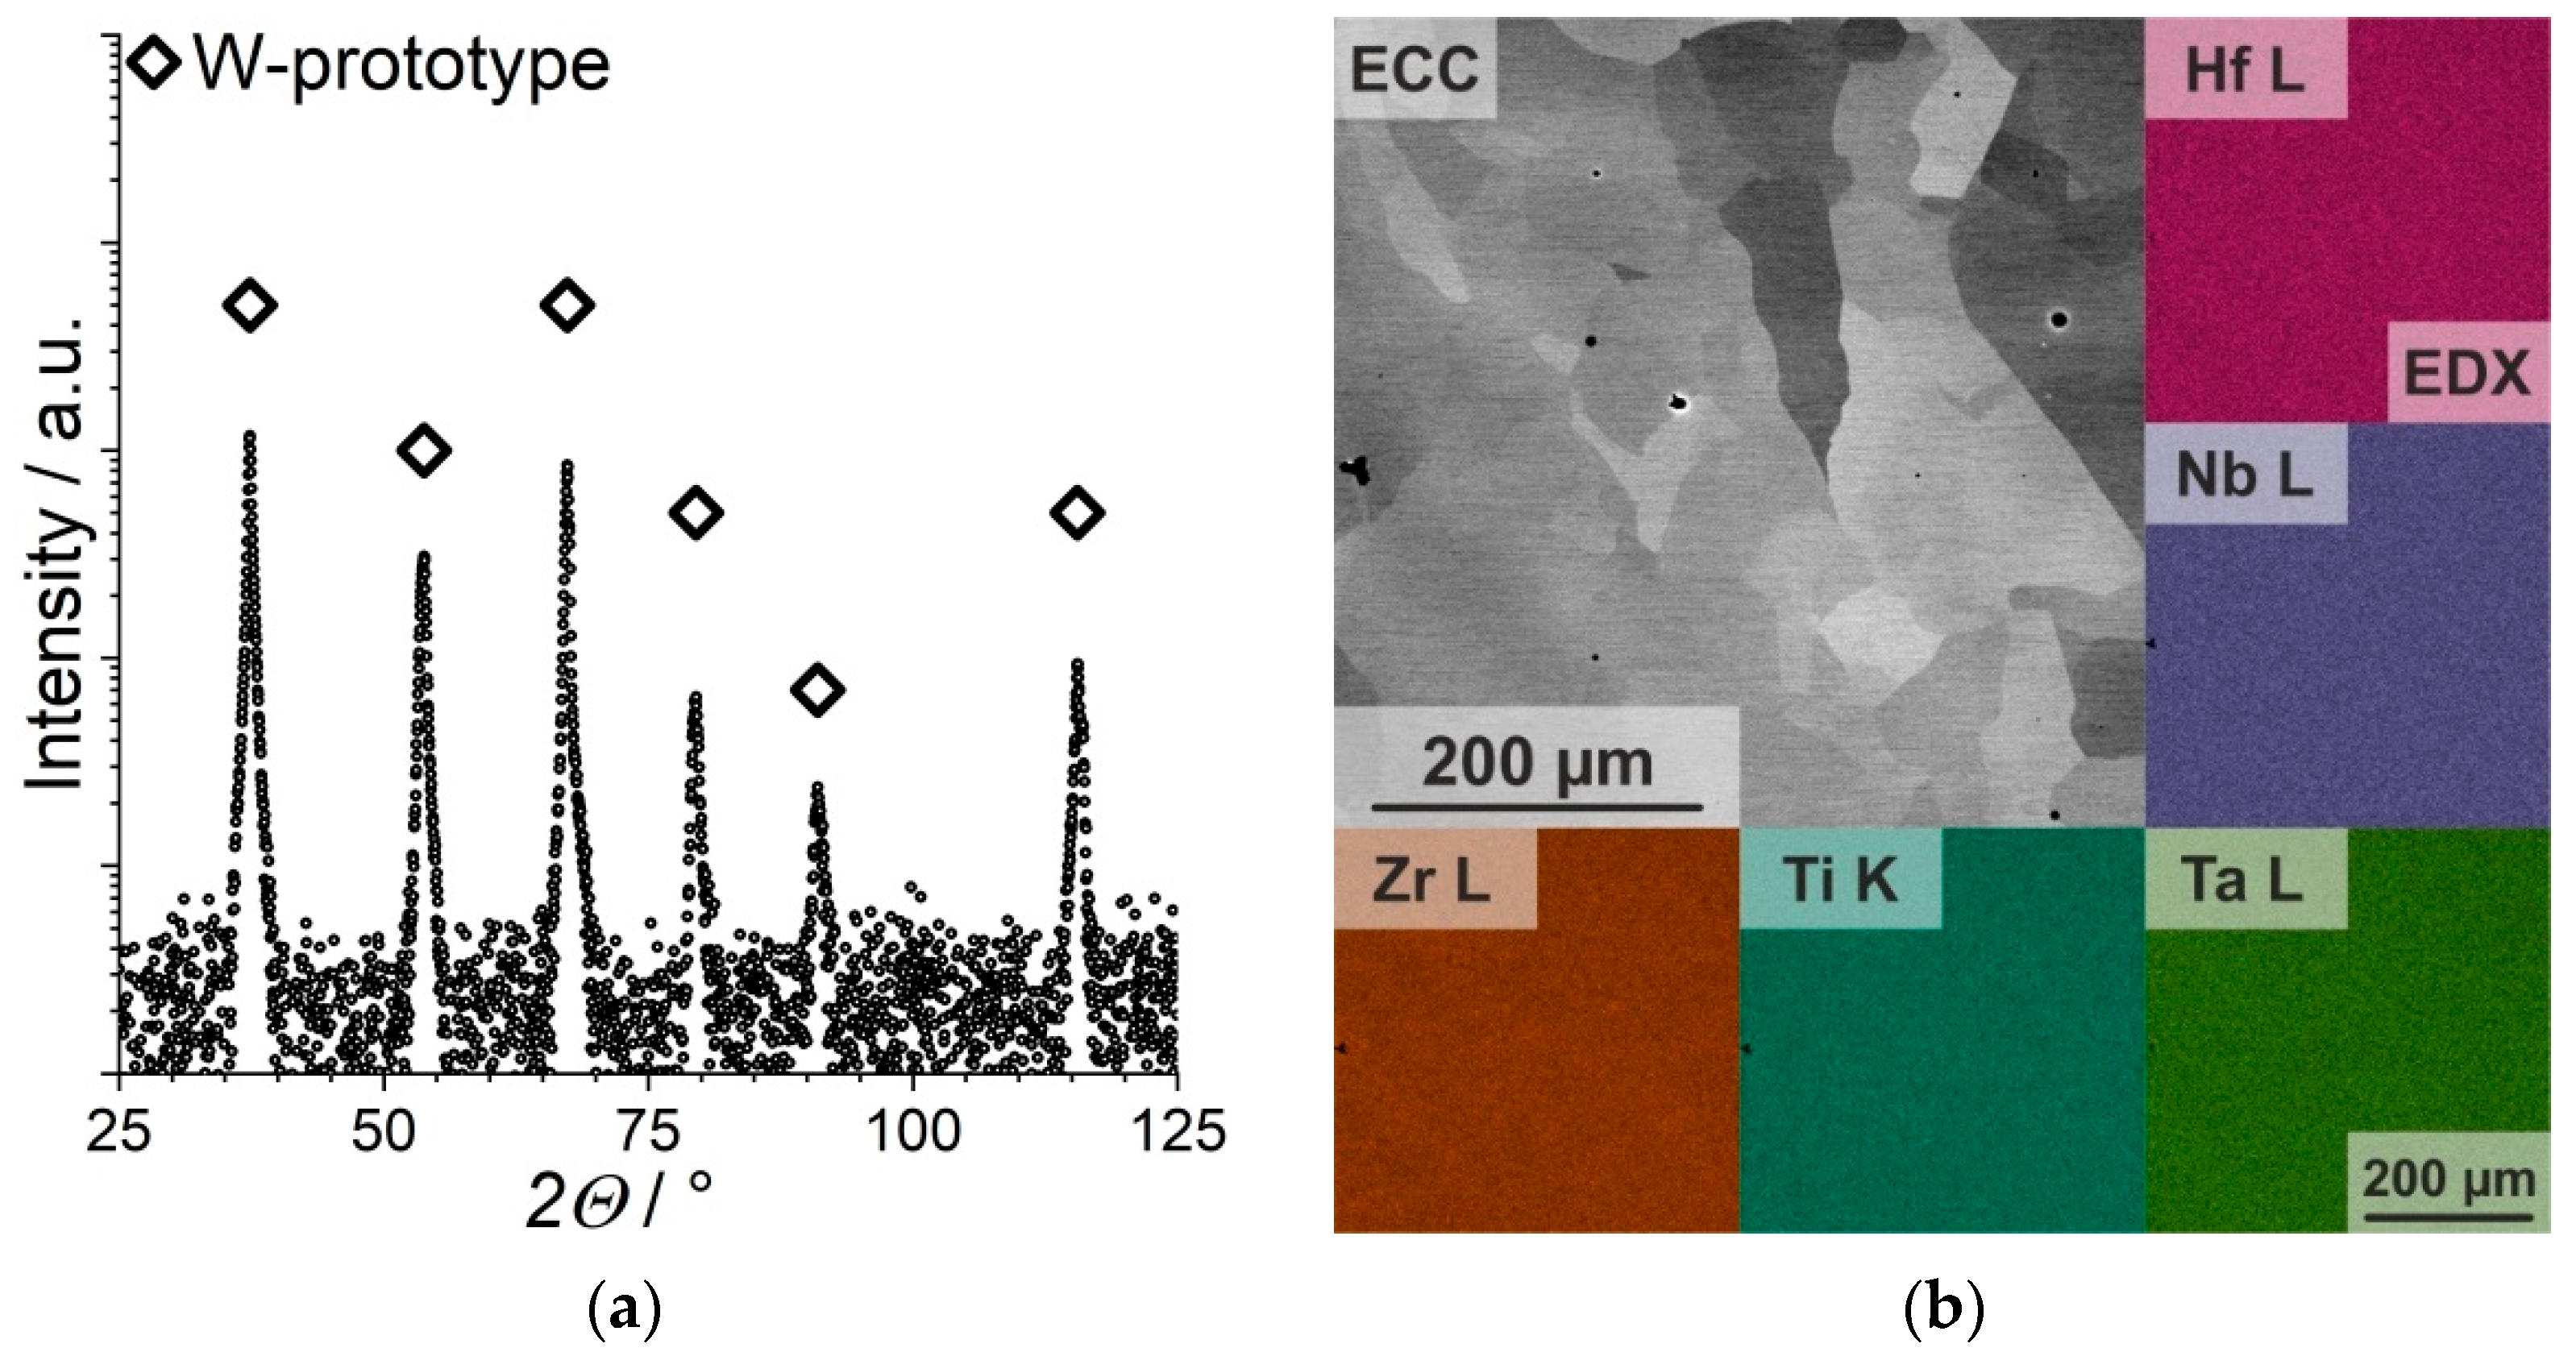
3.1. Microstructural and Chemical Analysis

The chemical homogeneity of homogenized HfNbTaTiZr was evaluated by XRD, ECC imaging, EDX mapping, and APT on different length scales. The XRD pattern (Figure 1a) indicates a single-phase bcc crystal structure (W-prototype, diamond-shaped symbols). No secondary phases were found. The oxygen concentration was determined to be (5300 ± 200) at.ppm; however, additional diffraction peaks by oxide phases were not detected. Hence, it is concluded that oxygen is interstitially solved within the bcc solid solution. The contrast of the ECC micrograph (Figure 1b) can be completely assigned to the grain orientation of the bcc phase, supporting the XRD results that only one single phase is present in the homogenized state. Porosity with a volume fraction of approximately 1 vol.% due to materials synthesis is observed. The micrograph does not indicate any secondary phases of oxides, either. The corresponding elemental EDX maps that were acquired from the same area as the ECC image (insets of Figure 1b) do not show any indications for heterogeneities.
In order to evaluate elemental distribution within the bcc phase, APT was performed on the region from within a grain. The microstructure, which is shown in the tip reconstruction (Figure 2a), did not indicate any segregation or precipitation at first view. The chemical homogeneity by APT analysis could be quantified by a sample volume independent correlation factor μ which describes the deviation between the ideal, binomial, and the experimental element distribution [21]. μ values of all elements within the entire APT tip were determined (Table 2) and are in the range of 5.1 · 10−2 (Hf) up to 24.7 · 10−2 (Ta). The parameter μ has already been used for quantifying the chemical homogeneity of other HEAs, such as of non-equiatomic FeMnNiCoCr [22], quaternary NbTaTiV [23] and quinary, equiatomic AuCuNiPdPt [24]. Moody et al. [21] emphasize that μ varies with the number of elements and their concentrations. Hence, the μ values from this work were only compared with those of AuCuNiPdPt, reported by Thiel et al. [24]. μ is between 4 · 10−2 (Cu, Ni) and 7 · 10−2 (Pt) [24]. Four of five elements of the alloy from this work showed higher μ and, thus, higher tendency for clustering [21], which might arise from segregation. APT experiments of this work and of [24] were conducted on the exact same APT device. Hence, a μ-variation by differing experimental procedures can be excluded. In order to reveal slight chemical fluctuations within the tip-shaped sample caused by segregation, the isoconcentration surfaces of each element were systematically investigated. In fact, when highlighting the 14 at.% isoconcentration surfaces of Ta, it is demonstrated that Ta segregates on a nm scale (black arrows Figure 2b). In order to quantify the magnitude of the fluctuations within the segregated regions, elemental concentration profiles in a representative volume (red frame from Figure 2b) were acquired. The concentration profiles across several sequences of segregations clarify that the fluctuations are highest for Ta and Zr (Figure 2c) and remain within ±4 at.%. It can be additionally observed, that Ta enriched regions are depleted in Zr and vice versa, highlighted in Figure 2c. Nb is preferentially located in the Ta-enriched regions and Hf in the Zr-enriched regions whereas Ti does not prefer one of the two observed regions (not shown here; concentration profiles of Nb, Hf and Ti are provided in the Supplementary Materials). Segregations of a similar nature can be seen at the µm level in the as-cast state of HfNbTaTiZr [25]. The concentration profile of O did not indicate preferences of this element to be located in one of the two regions.

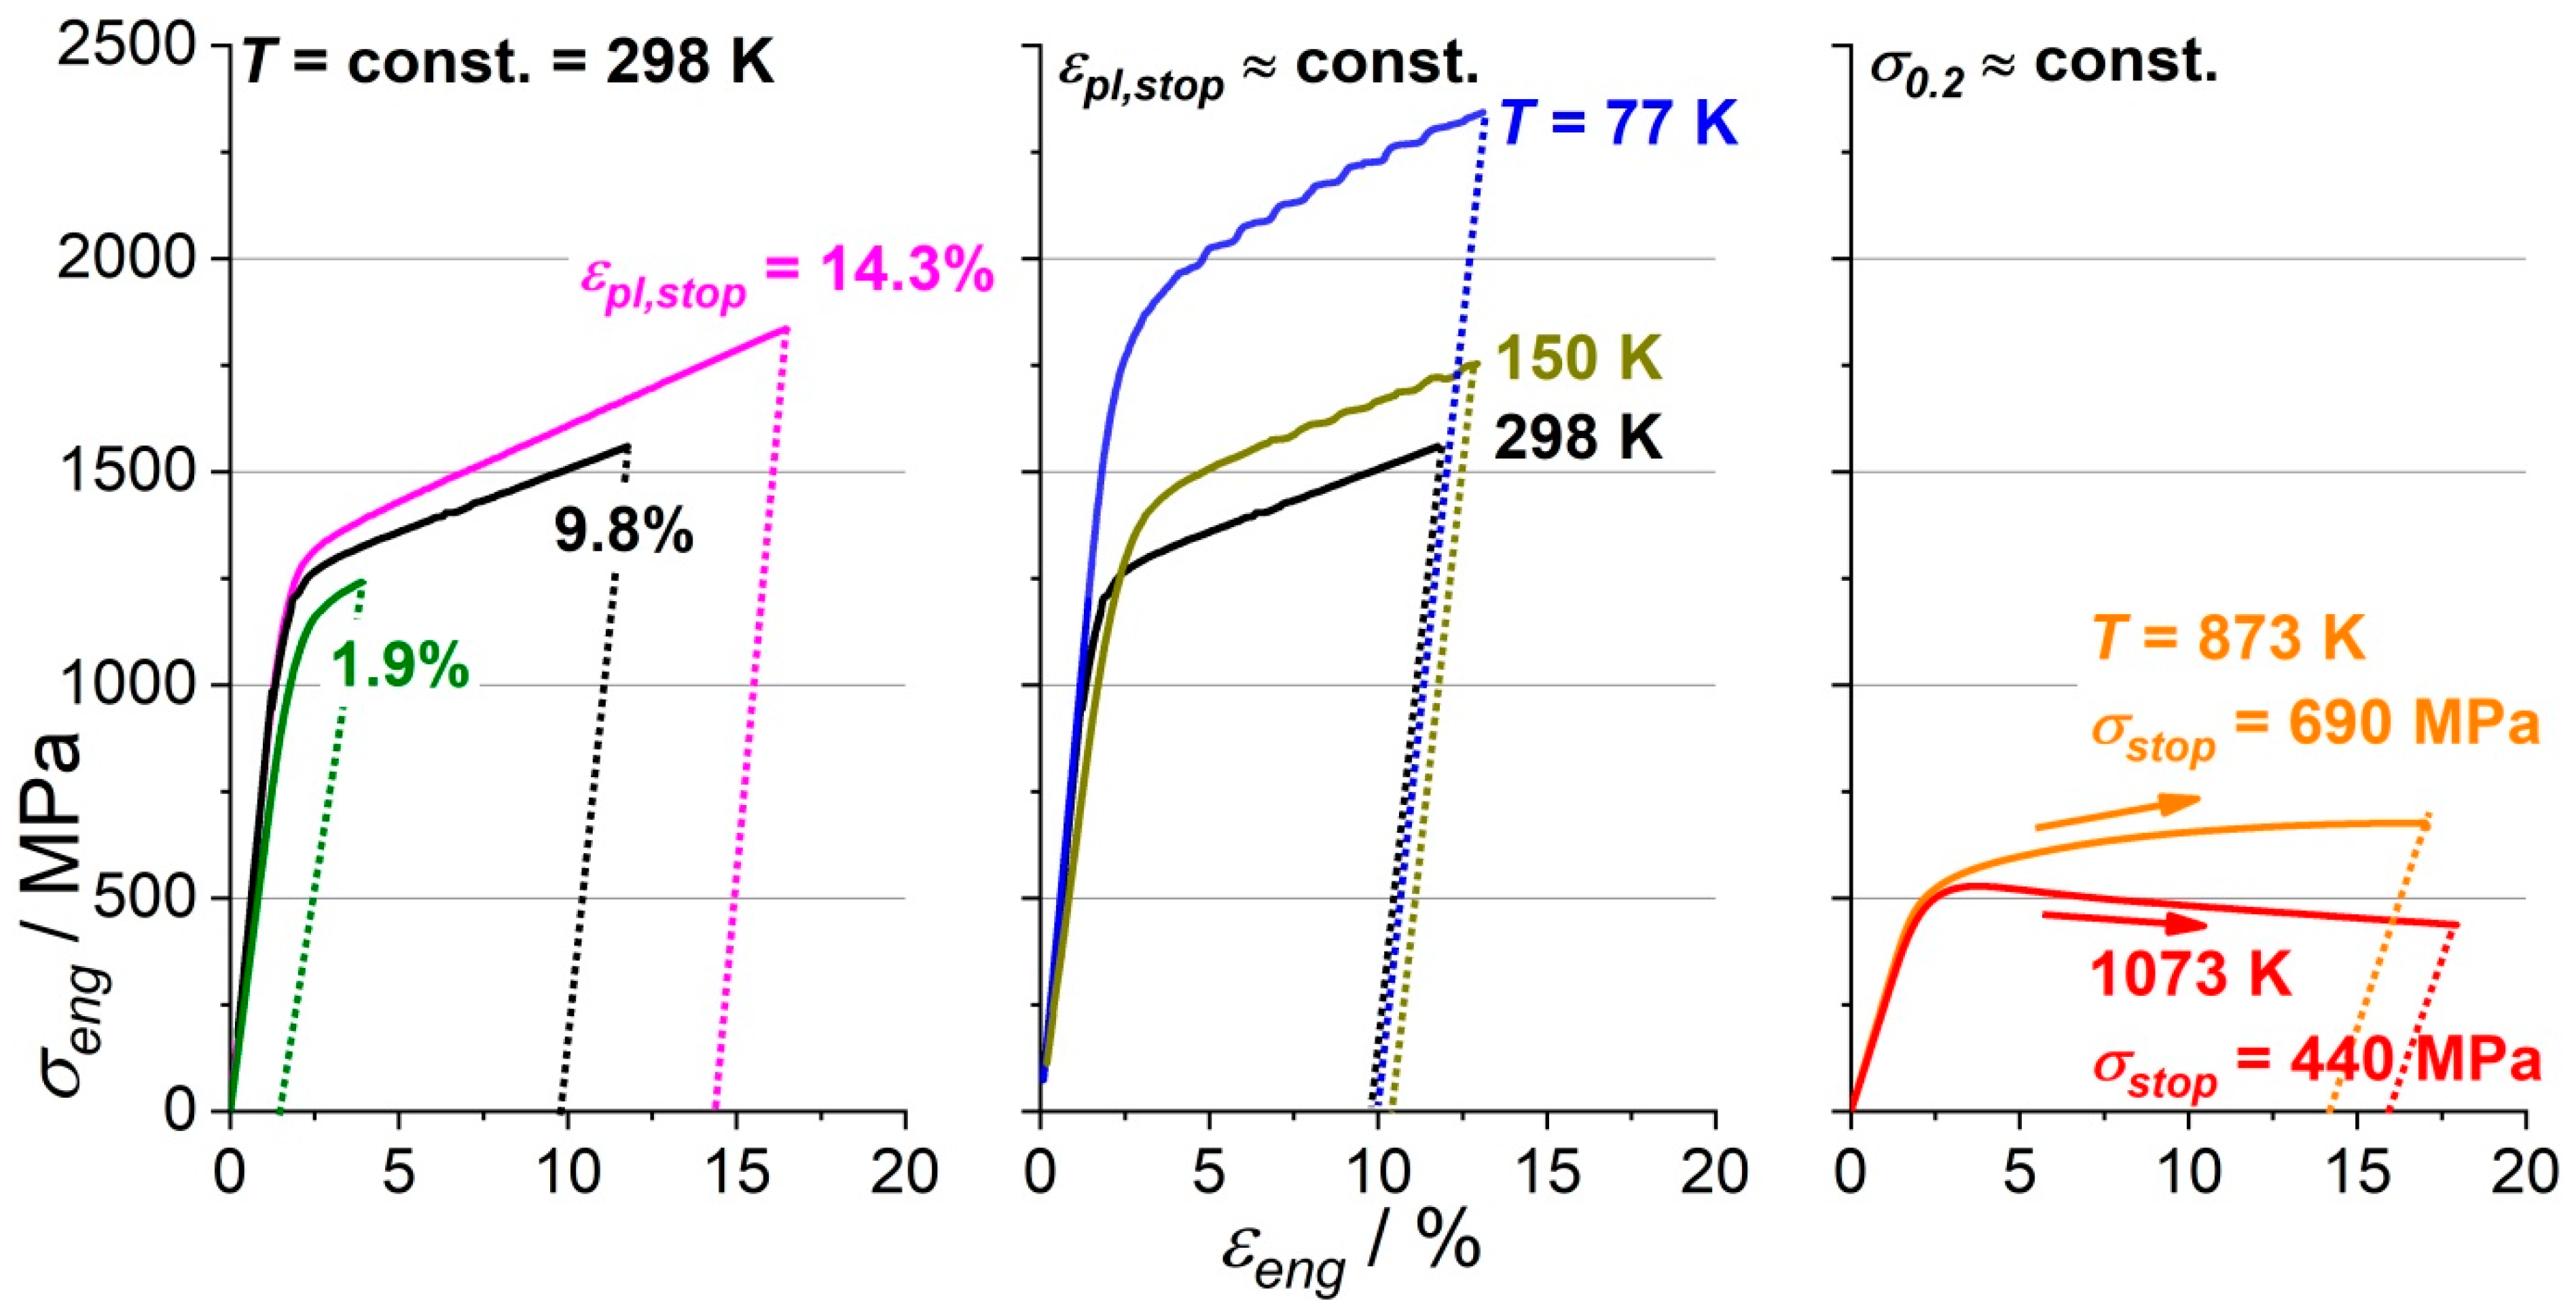
3.2. Plastic Deformation Behavior

In order to investigate plastic deformation behavior and active deformation mechanisms of homogenized HfNbTaTiZr, compression tests in a temperature range of T = 77 up to 1073 K were terminated at varying plastic strains ε p l , s t o p . The stress measured at test termination is defined as σ s t o p . The corresponding stress-strain curves and characteristic values are presented in Figure 3 and Table 3, respectively. The RT yield strength was determined from three compression tests (Figure 3 left) and was σ 0.2 = (1150 ± 40) MPa which is significantly higher than that observed by Senkov et al. [9]. It is likely, the interstitially dissolved O contributes to the additional strengthening of the bcc solid solution. Additionally, the processing routes from the work of [9] and from this work differ from each other. The hereby arising variations of microstructure and grain size might influence strength, too. In a temperature range of 77 up to 298 K, σ 0.2 significantly decreased with increasing test temperature (Figure 3 center). This behavior of σ 0.2 is typical for the temperature regime I in bcc metals and alloys [26]. This means that screw dislocation motion governing yield strength is thermally activated at these test temperatures [13]. Hence, the knee temperature of as-homogenized HfNbTaTiZr was obviously higher than 298 K. The stress-strain curves of tests at 77, 150, and 298 K all exhibited a similar work hardening rate during plastic deformation. Consequently, one may assume that the dominant, active deformation mechanisms do not change. It additionally confirms that all three test temperatures are located in temperature regime I. At 873 and 1073 K, yield strength is similar (being σ 0.2 = 481 and 461 MPa, respectively; see Figure 3 right) which might be explained by athermal strength at temperature regime II. However, at least the test temperature of 1073 K was located in temperature regime III due to following reasons: (i) At 873 K, the stress-strain curve continuously increases during plastic deformation; however, it flattens with increasing strain, whereas at 1073 K, even a strain-softening behavior was observed after reaching a stress maximum at a plastic strain ε p l = 1.6%. Taking a solidus temperature of 2155 K [27] for HbNbTaTiZr, the homologous temperatures T h o m of each of tests was T h o m 873 = 0.41 and T h o m 1073 = 0.50, respectively. At these temperatures, apart from thermally activated cross-slip of screw dislocations, climb of edge dislocations can contribute to dynamic recovery during plastic deformation which would indicate these two tests to be located in temperature regime III [28]. At high temperatures, microstructural changes as well as damage of the sample can lead to a stress decrease, too. However, microstructural analysis of the deformed sample did not indicate any of these causes (not shown here). (ii) Senkov et al. [11] revealed a significant strain rate dependence of yield strength at 1073 K, proving that at this test temperature, the region of temperature and strain rate-independent strength has already been exceeded.
The RT deformation mechanisms of HfNbTaTiZr after compression to ε p l , s t o p = 9.8% were investigated by analyzing the corresponding EBSD results. The inverse pole figure (IPF) map of the deformed microstructure, with respect to compression direction (CD), of the deformed microstructure qualitatively exhibited an above average number of grains in red and blue colors (for color code, please see IPF in the inset of Figure 4a). Uniform plastic deformation could be observed by continuously changing orientations within the individual grains and grain flattening perpendicular to the loading axis. Within some grains, abrupt orientation changes were observed in terms of needle-shaped and lenticular features. These features are known to be kink bands, as already revealed by Zherebtsov et al. [8]. A significant number of kink bands were found at angles close to 45° with respect to load direction. It is reasonable that maximum shear stress under uniaxial nominal loading conditions caused severe localization of dislocation slip necessary to form kink bands. Hence, some slip systems are preferentially activated and become kink bands. The appearance and properties of kink bands will be discussed in the subsequent section. To further analyze the present deformation mechanism, the orientation distribution of the IPF map with respect to CD is presented as a color map within an IPF in Figure 4b. The IPF revealed the presence of [001]- and [111]-fiber texture components. The [111]-texture component was not as pronounced as the [001]-component. A [001]-[111]-fiber texture is typical of pencil glide with 1 2 111 Burgers vectors in bcc metals and solid solutions [29]. The same fiber texture after plastic deformation was also found for another refractory HEA, namely the bcc concentrated solid solution NbMoCrTiAl [30].

3.3. Appearance and Properties of Kink Bands

The kink bands which form during plastic deformation at RT (298 K), Figure 4a, were analyzed in detail as follows. Firstly, a ROI that contained kink bands was chosen from the overview map, highlighted by the red rectangle in Figure 4a. The orientation map of this ROI is presented in Figure 5a (top). Needle-shaped kink bands that adjoin a grain boundary as well as lenticular bands within the adjacent grain were observed. Note that the presented orientation map only revealed a two-dimensional section of the deformed sample. Hence, the observed kink bands could possess varying morphologies if other sections or sample orientations of the deformed sample were analyzed. The local misorientation within the ROI can be visualized by the kernel average misfit (KAM) as depicted in Figure 5a (bottom). The KAM map reveals a significant misorientation at the kink band boundaries only. Hence, the crystallographic orientation within the kink bands themselves does not change significantly. These results support the misorientation line profiles across kink bands determined for the quaternary derivative HfNb0.7TiZr, provided by Wang et al. [5]. Additionally, the misorientation angles for different kink bands as well as the misorientation angle along the boundary of an individual kink varied, revealed by the varying shades of red color in the KAM map. For visualization and quantification of the misorientation angle at the boundary along with each individual kink band, the kink band with the highest KAM was selected for further analysis (red polygonal frame in Figure 5a, bottom). The color-coded misorientation angle along the kink band boundary (Figure 5b) revealed misorientation angles between 3 and 25°. The relative frequency distribution of these angles (bin size of 2°) of this kink band is plotted in Figure 5c. It exhibited a frequency maximum at 22.2° and a full width at half maximum (FWHM) of 4.6° when fitting the misorientation angles by a Bi-Gaussian fit function. Since the misorientation angle distribution is asymmetrical, a Bi-Gaussian function that allows two different values for half widths at half maximum (HWHM) was chosen. The quality of the Bi-Gaussian fit can be expressed by the adjusted R-squared R a d j 2 = 0.83. The deviation from the maximum value of unity was explained by the non-steady increase of frequency in the low misorientation angle range. The fit quality also depends significantly on the selected bin size. As an example, R a d j 2 increases to 0.96 for a bin size of 3° instead of 2°. However, for comparability of misorientation data with other deformation conditions, bin size was kept constant at 2°. The orientation distribution (Figure 5d) of rotation axes within the ROI as depicted in the IPF map of Figure 5b reveals a maximum in the [211]-direction. It was, therefore, found that a single slip for kink band formation occurred on the resulting { 011 } slip plane. This result expands experimental findings from [5,31] where 1 ¯ 01 rotation axes were experimentally observed for kink band formation on HfNbTaTiZr and HfNb0.7TiZr.
For comparing kink band properties at various deformation conditions, the following steps were carried out: first, the KAM overview map of a section with (2100 · 2100) µm2 of a deformed sample was plotted to reveal kink bands with the highest misorientation angles by systematically adjusting the threshold and upper limit of KAM. Second, a ROI was selected that comprised the kink band with the highest misorientation angles (all selected ROIs are presented in the Supplementary Materials). Third, the relative frequency distribution of misorientation angles was plotted in order to determine the frequency maximum by fitting the data by a Bi-Gaussian function. The misorientation angle at frequency maximum and the FWHM, which is the sum of both HWHM, were used as characteristic values for kink band properties. It should be emphasized that the present evaluation routine is not regarded as a standardized method. Kink band properties can vary when other sections of the deformed sample are investigated. Additionally, different characteristic values might be defined to evaluate kink band properties. The characteristic values of kink band misorientation angle distribution are presented in Table 4.
Kink band properties of RT compression tests with varying plastic strains ε p l , s t o p = 1.9%, 9.8%, and 14.3% are presented in Figure 6 (top). It is observed that the misorientation angle at frequency maximum significantly increases with increasing ε p l , s t o p . There is no overlap of frequency distribution in the range of FWHM. This result supports the findings by Zherebtsov et al. [8], who found an increase of misorientation angle for increasing plastic strains in the range of 15% to 40%. It was concluded that kink band properties qualitatively correlate with plastic strain and, thus, with strain hardening. Additionally, the maximum value of relative frequency decreased with increasing ε p l , s t o p as a result of a larger range of misorientation seen in the kink band. The influence of test temperature on misorientation angle distribution is depicted in Figure 6 (bottom). The plastic strains at test termination ε p l , s t o p (77 K) = 10.4%, ε p l , s t o p (150 K) = 10.0%, and ε p l , s t o p (298 K) = 9.8% were within a tolerance of Δ ε p l , s t o p = 0.6%. It is assumed that the plastic strain conditions should be comparable. The misorientation angle at maximum frequency for 77, 150, and 298 K were 25.8°, 24.4°, and 22.2°, respectively and, therefore, exhibited a maximum difference of 3.6°. When taking the angle range of FWHM into account, all three misorientation distributions overlapped in a range of at least 3°. Hence, it is proposed that the observed deviations of kink band misorientations are not significant. Recently, Wang et al. [31] experimentally revealed the active deformation mechanisms of HfNbTaTiZr at 77 K. At this test temperature, the alloy deforms by dislocation slip and kink band formation, alongside mechanical nano-twinning accompanied by ω phase formation [31]. They predicted deformation twinning to be active below a transition temperature in the range of 227 up to 277 K. Hence, the compression tests at 77 K and 150 K of this work are in the temperature range in which deformation twinning should already be active. At 298 K, it is proven that dislocation slip (accompanied by kink band formation) is the only active deformation mechanism [32]. However, based on the analysis of this work, the kink band properties in terms of maximum and FWHM of misorientation angle distribution did not significantly vary in this temperature range. There are several conceivable reasons for this: (i) Deformation twinning may be present at cryogenic temperatures, but dislocation slip accompanied by kink band formation is the main contribution to plastic deformation. (ii) The oxygen concentration of the HfNbTaZrTi alloy, in the work of Wang et al. [31], was 2500 at.ppm, compared to the 5300 at.ppm in this work. For β-Ti alloys, it is known that an increase of oxygen concentration can suppress deformation twinning [6]. Since the threshold concentration for the transition of deformation mechanisms is unknown, the suppression of deformation by nano-twinning in HfNbTaTiZr has to be considered as a possibility. (iii) Wang et al. [31] deformed HfNbTaTiZr up to a plastic strain of 20.8%. It was suggested that deformation twinning mainly contributes to plastic deformation at higher plastic strains as investigated in [31] whereas dislocation slip governed plastic deformation at lower plastic strains as analyzed in this work.
As observed in the previous part, work hardening behaviors at 873 and 1073 K significantly differ from each other, although their yield strengths were similar. The consequences of kink band formation are discussed in this section. A parameter that indicates dislocation-mediated plasticity is the aspect ratio, which, in this work, was defined as the ratio of the grain size parallel and the one perpendicular to CD. An aspect ratio of unity, therefore, indicated equiaxed grains. On the one hand, the sample deformed at 873 K (Figure 7a) exhibited an aspect ratio of 0.67, which was derived from grain flattening perpendicular to the loading axis, which is explained by pencil glide being the main active deformation mechanism. At this test temperature, kink bands were observed (Figure 7a). On the other hand, the aspect ratio of the grains in the sample deformed at 1073 K (Figure 7b) was 0.97. Diffusion-based grain boundary sliding might contribute to plastic deformation, as already observed by Senkov et al. [11], leading to almost equiaxed grains. Additionally, plastic deformation by the already discussed combination of favored cross-slip of screw dislocations and climb of edge dislocations is active. These thermally activated deformation mechanisms that become more dominant with increasing test temperature counteract to conventional pencil glide as observed in temperature regime I and, thus, suppress kink band formation. We, therefore, conclude that kink band formation does not depend on yield strength, but on strain hardening behavior, at these temperatures.

4. Conclusions

In equiatomic HfNbTaTiZr, kink band formation as a localized deformation mechanism was revealed in a temperature range from 77 up to 873 K. At room temperature, kink bands could already be observed at low plastic strains of 1.9%. The maximum frequency of misorientation angle distribution significantly increased with increasing plastic strain in a strain range of 1.9% up to 14.3%. Although mechanical twinning and ω phase formation were identified as deformation mechanisms in addition to pencil glide at 77 K [31], the kink band properties at this test temperature were comparable to the ones at RT determined from the same strain conditions. This leads to the conclusion that at 77 K, dislocation slip still dominates plastic deformation. At 1073 K, dislocation slip is superimposed by favored cross-slip and edge dislocation climb leading to enhanced dynamic recovery as indicated by the corresponding stress-strain curve. Accompanied by grain boundary sliding, kink band formation as the deformation mechanism was not active at this test temperature. Additional results are summarized in the following:
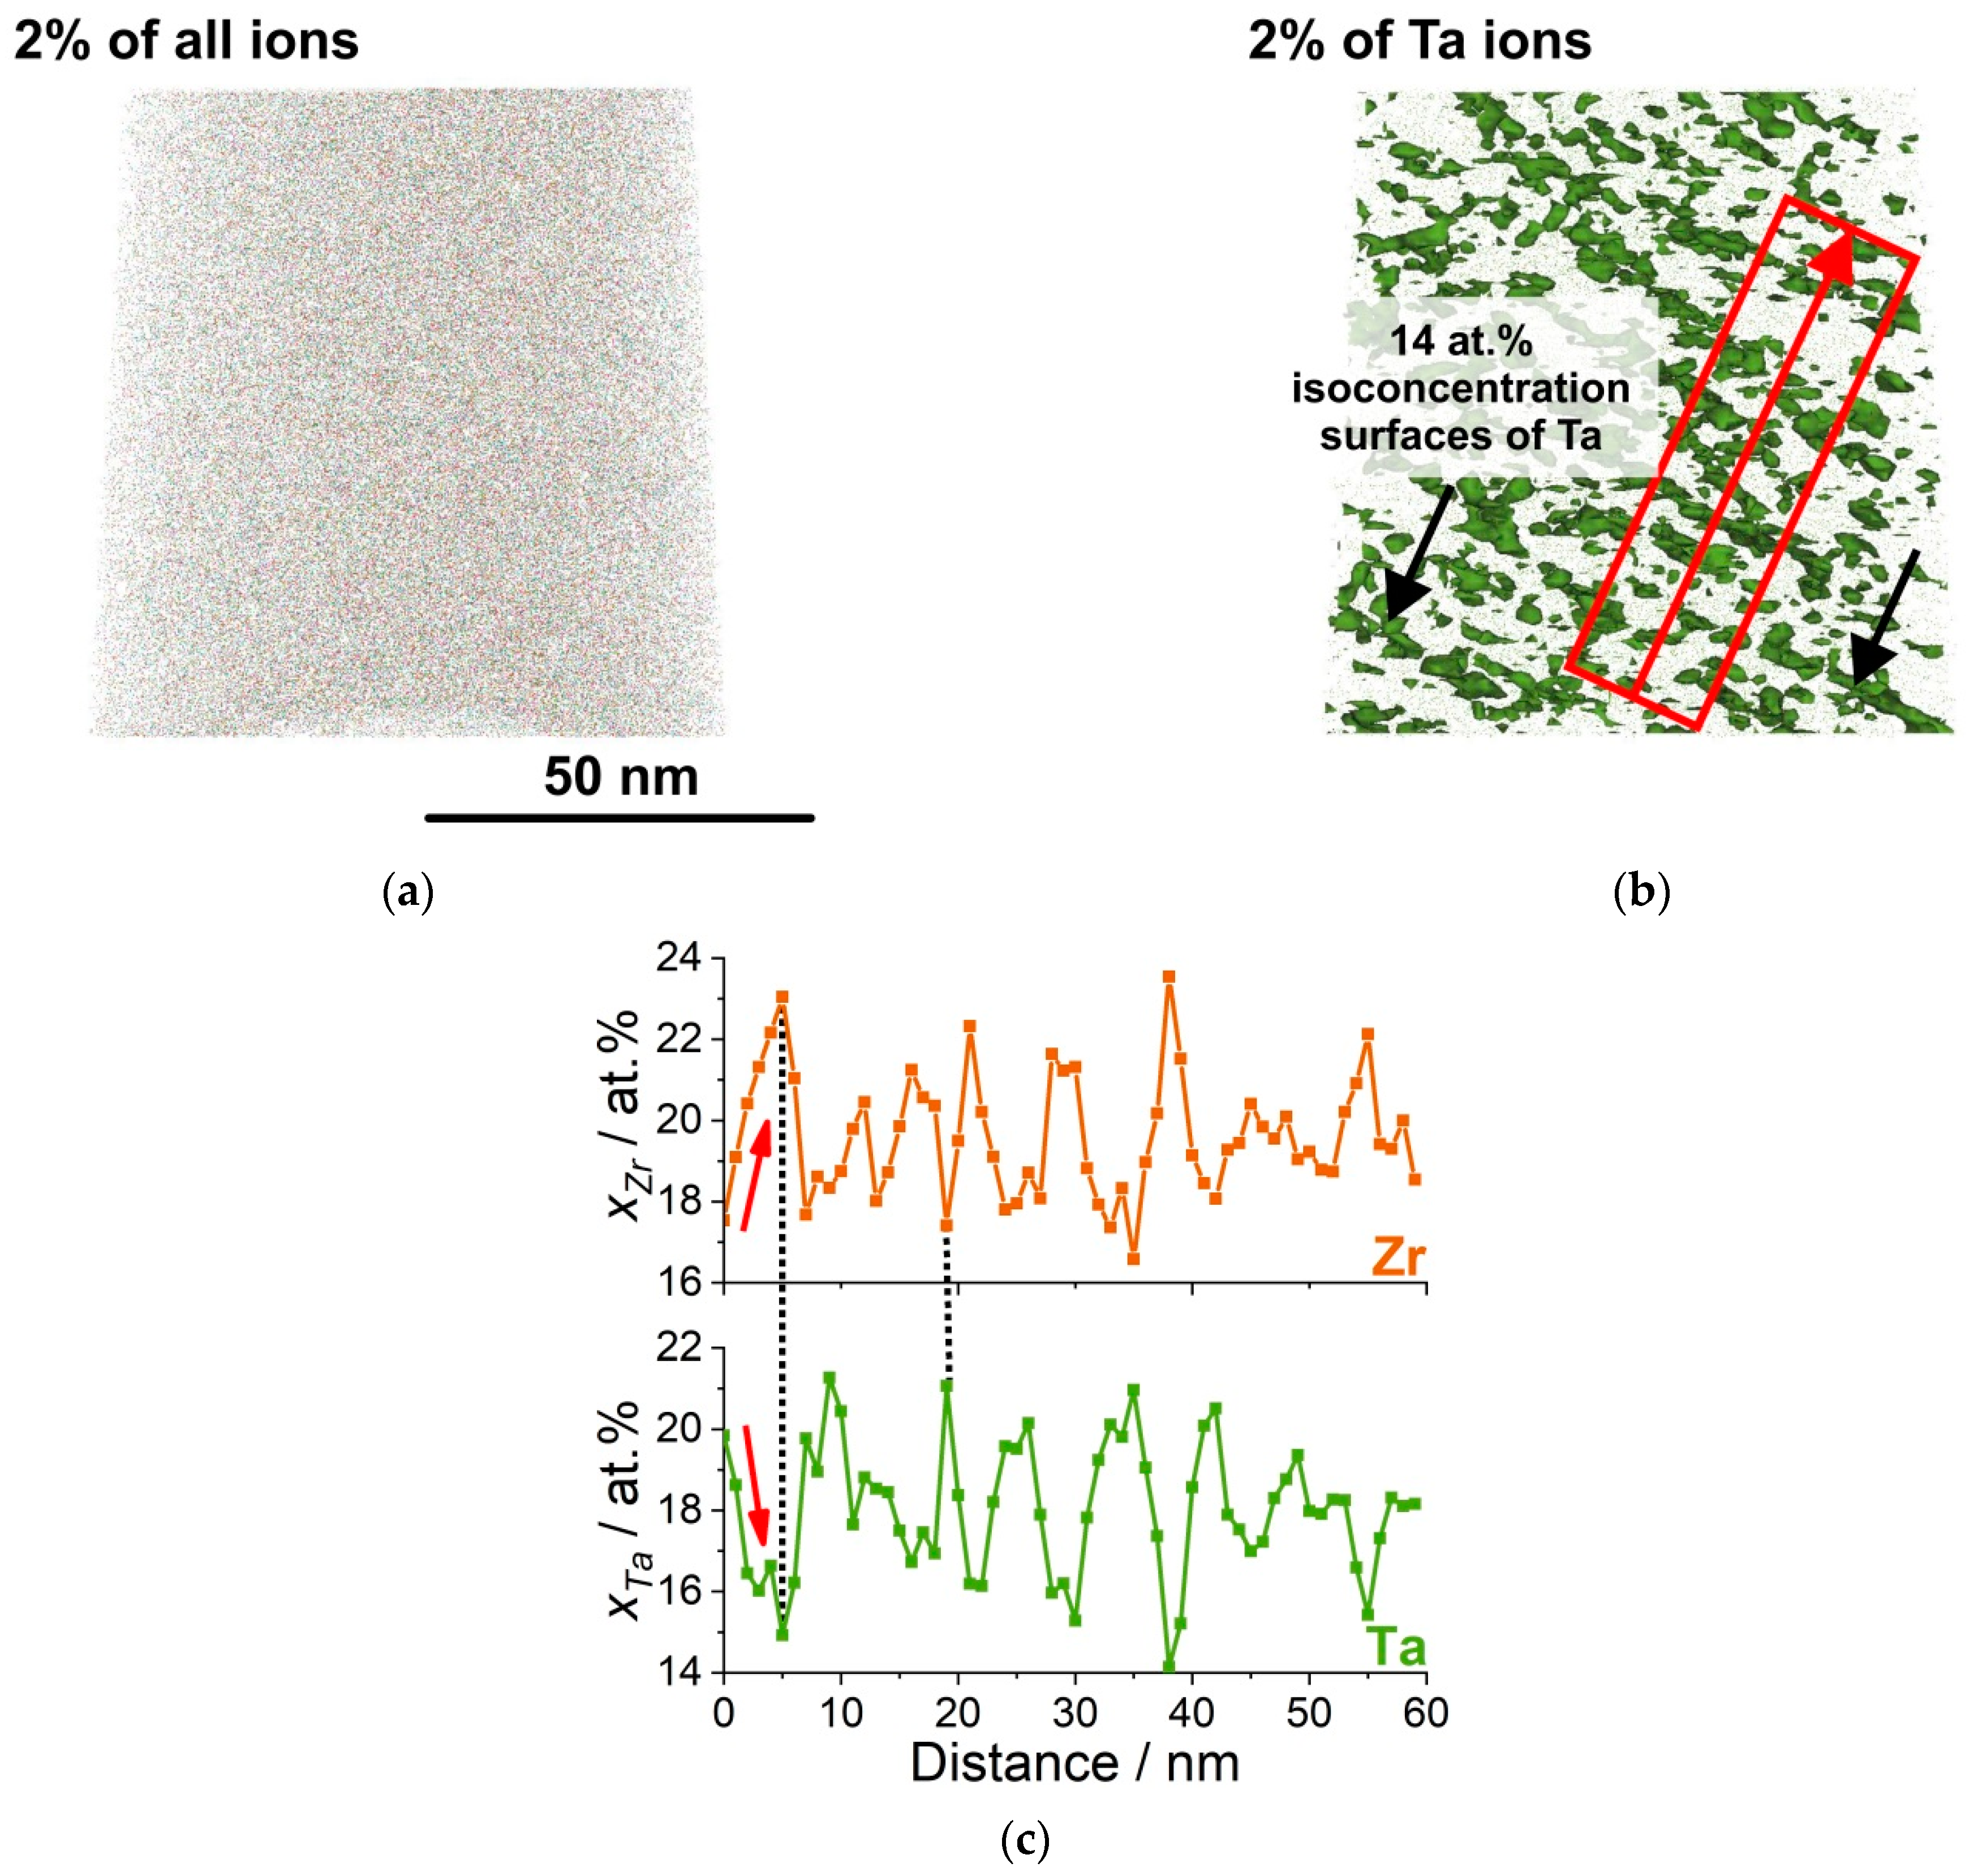
  • In the homogenized state, segregation on the nanometer scale could be revealed by an isoconcentration surface analysis of the APT tip reconstruction only. In general, it is hence recommended to apply isoconcentration surface analysis for evaluating the homogeneity of HfNbTaTiZr and concentrated solid solutions. The autocorrelation factor μ can be used as an indicator for segregation.
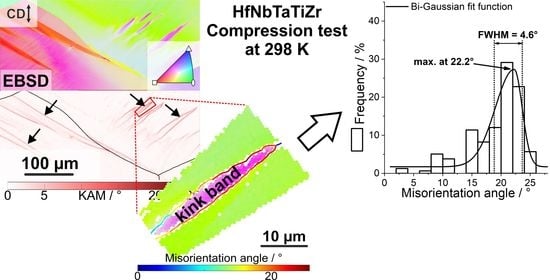
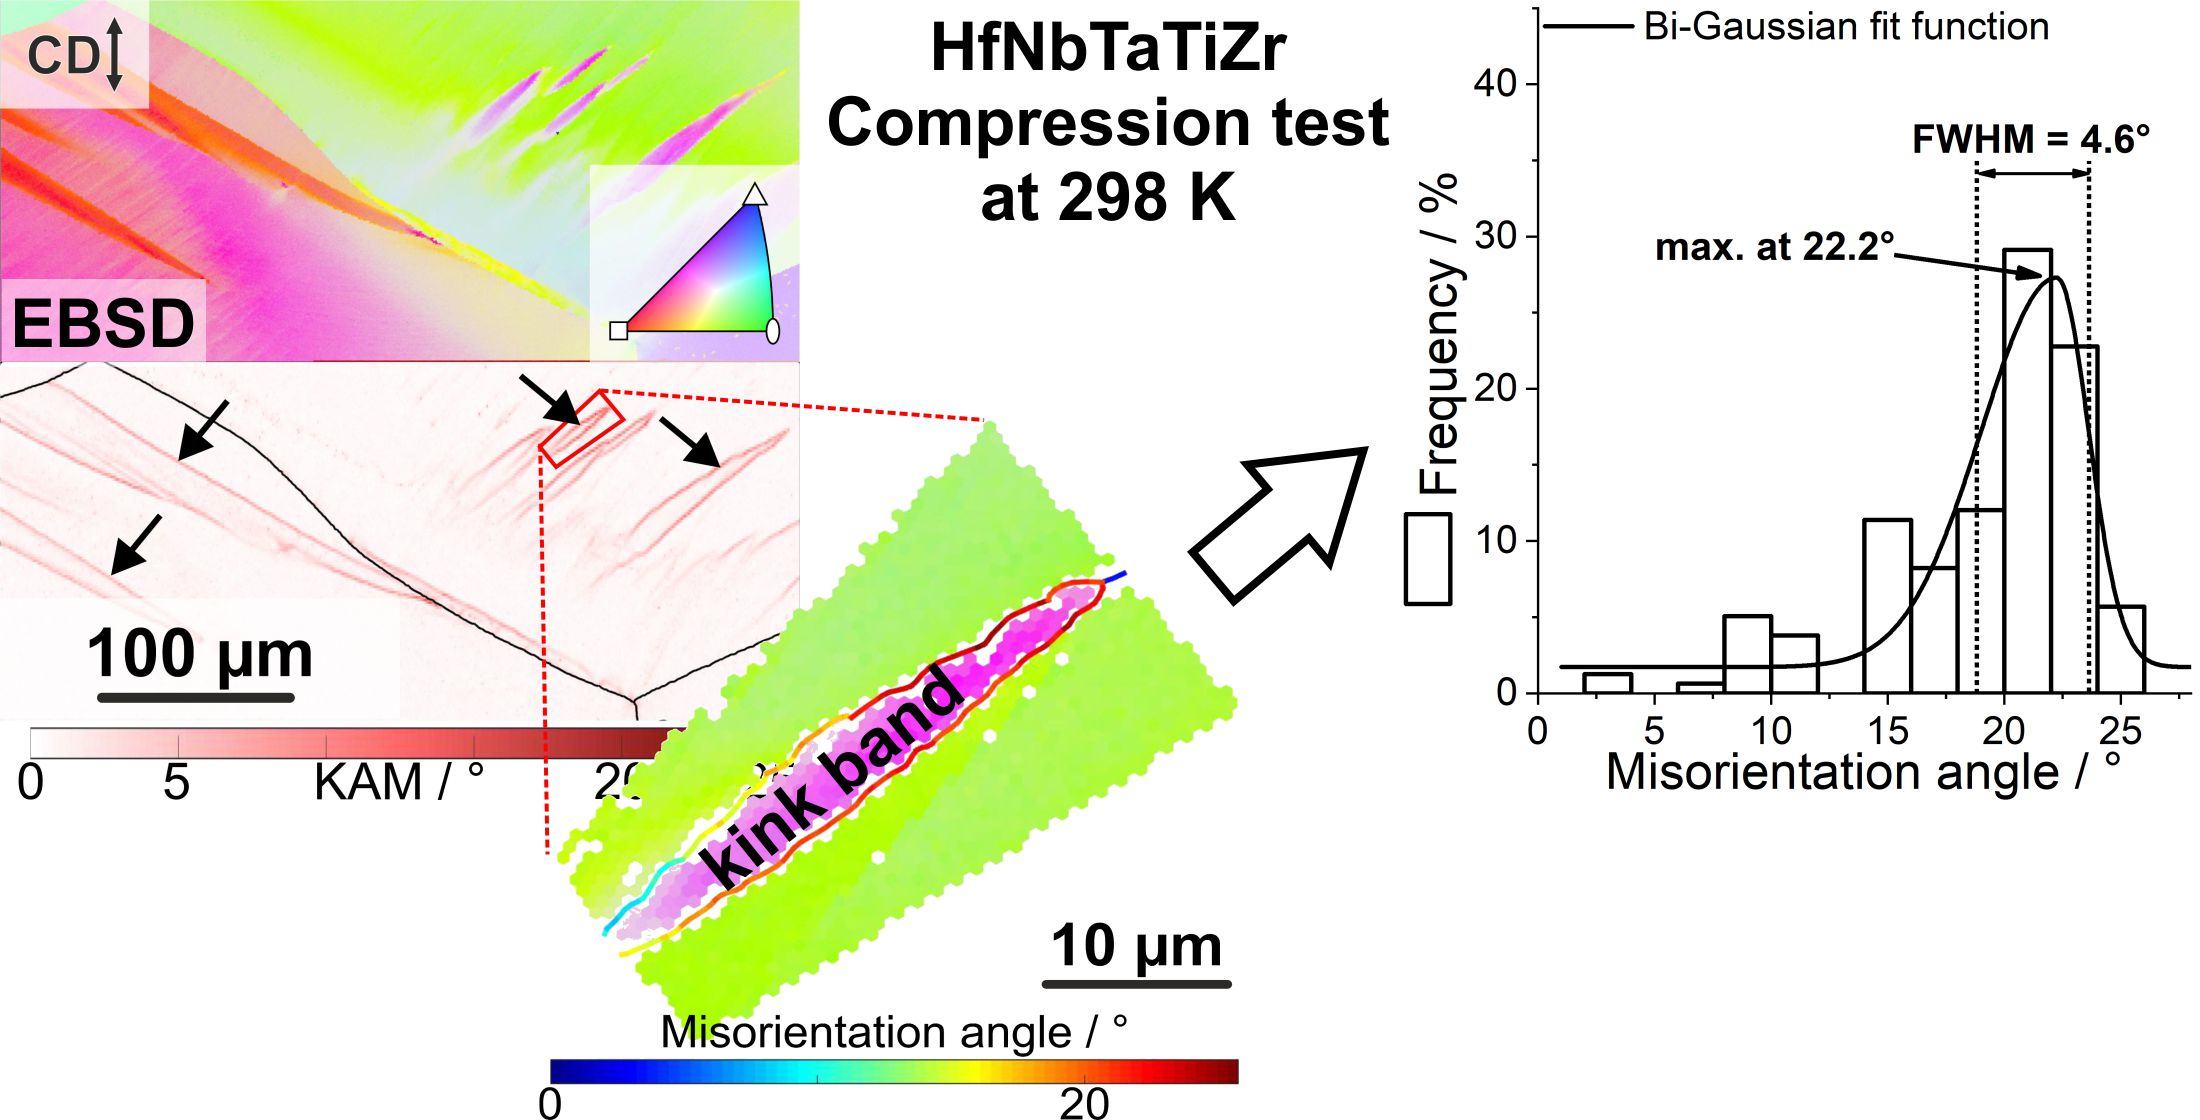
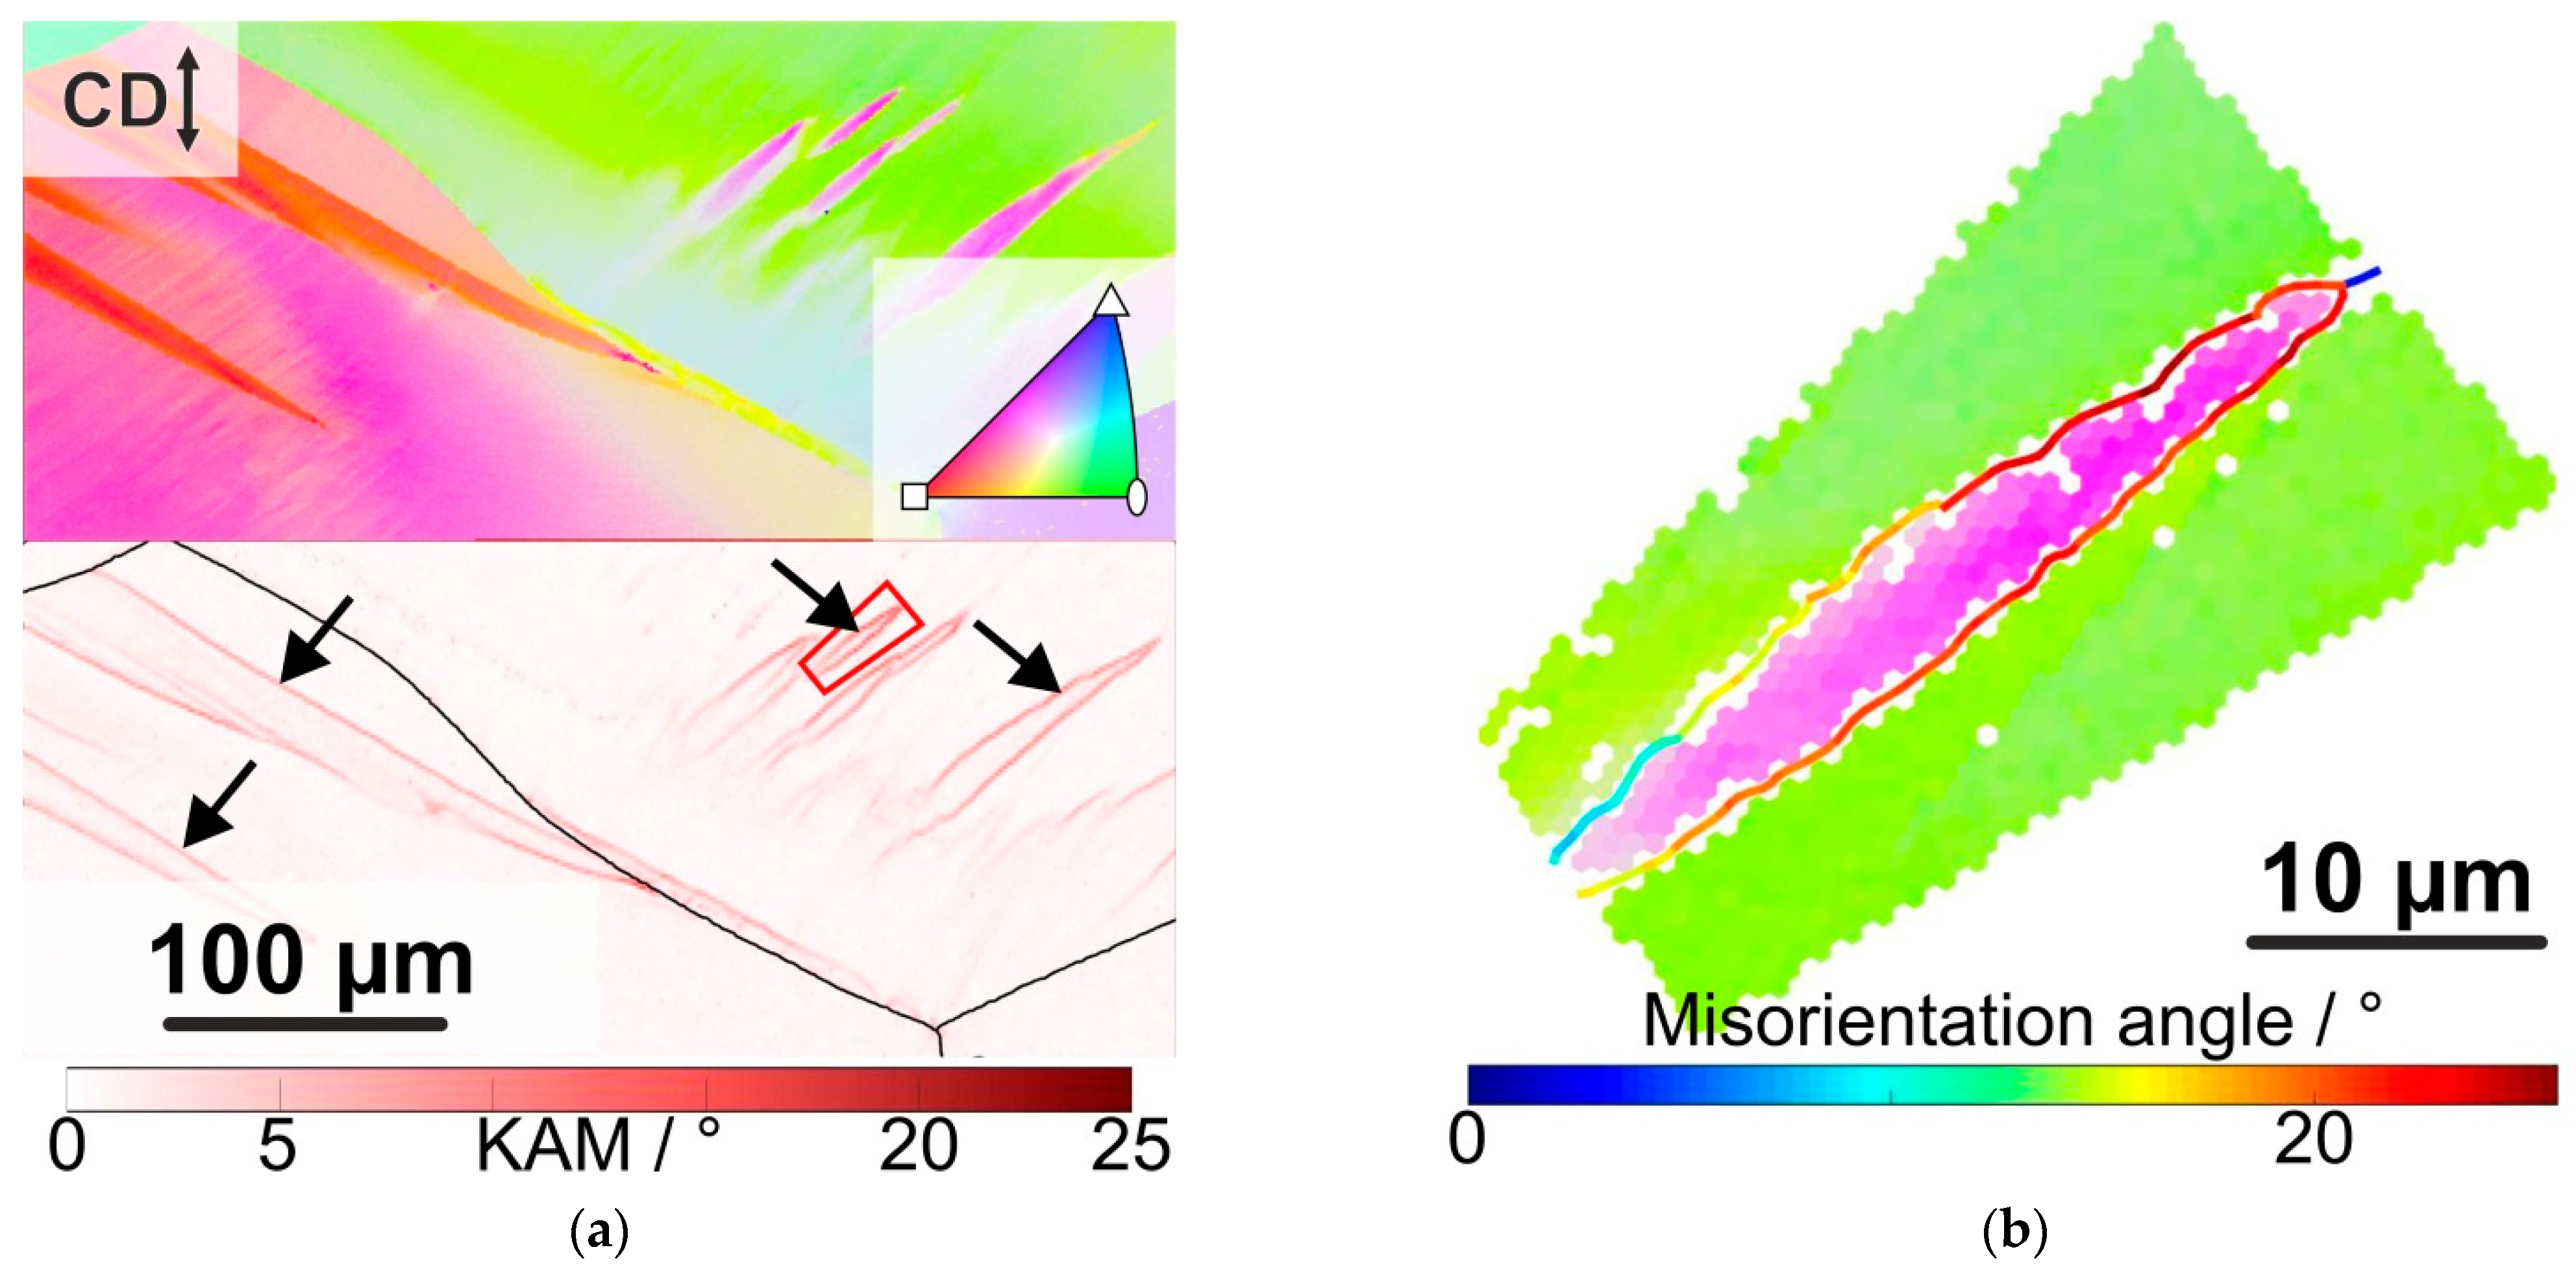
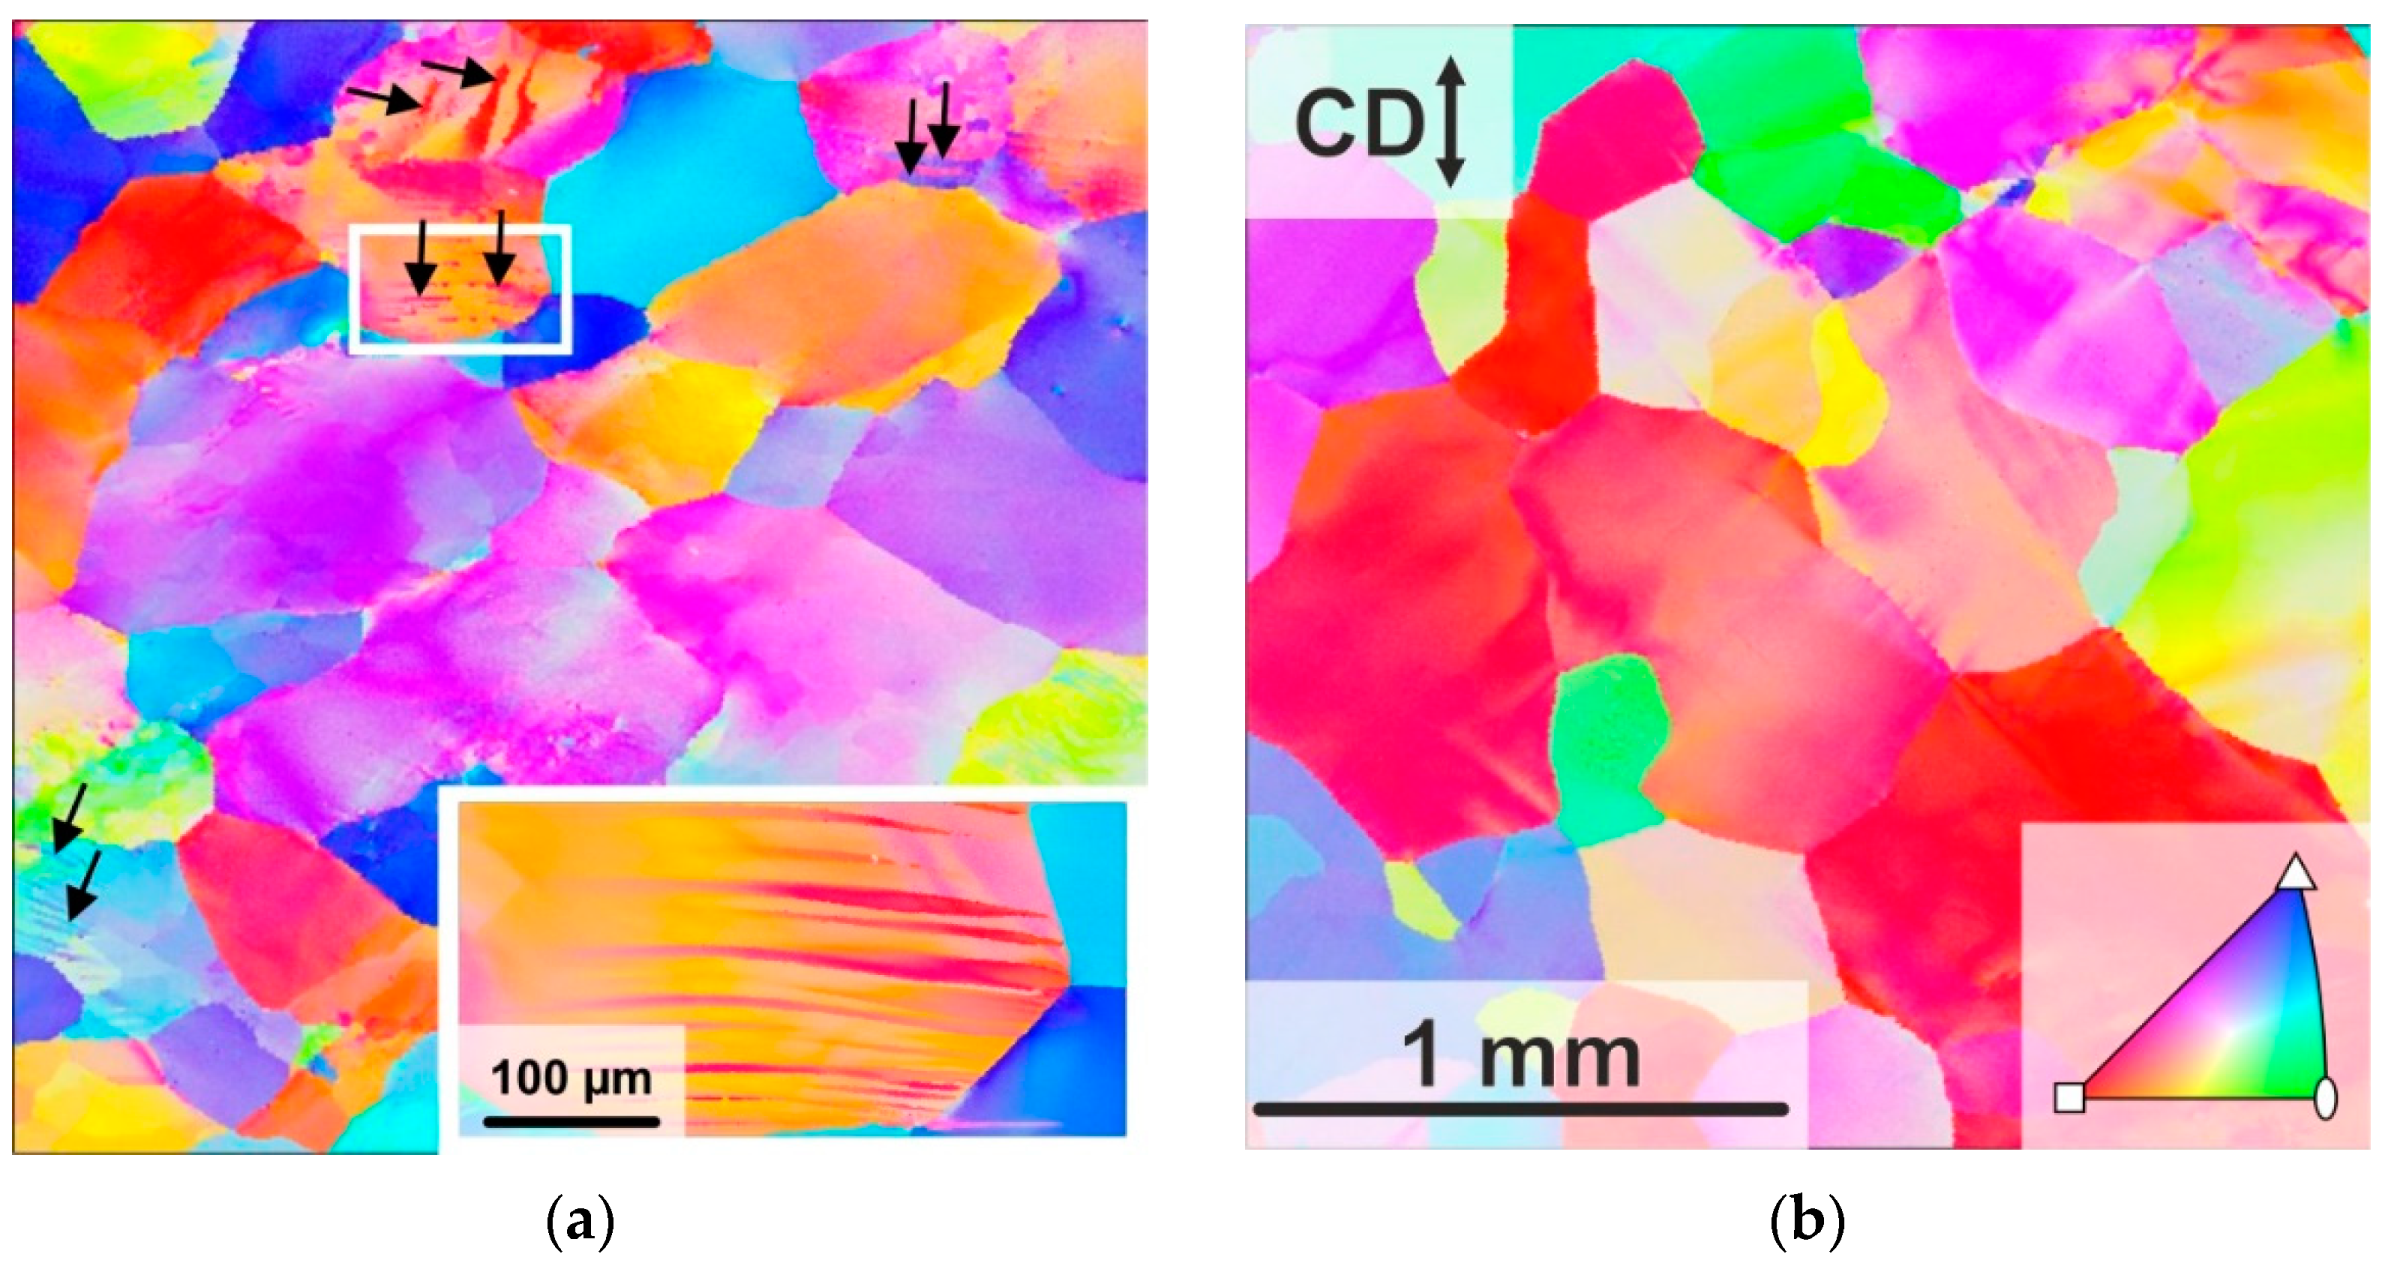
  • Kernel average misorientation analysis is suited to detect kink bands from EBSD data.
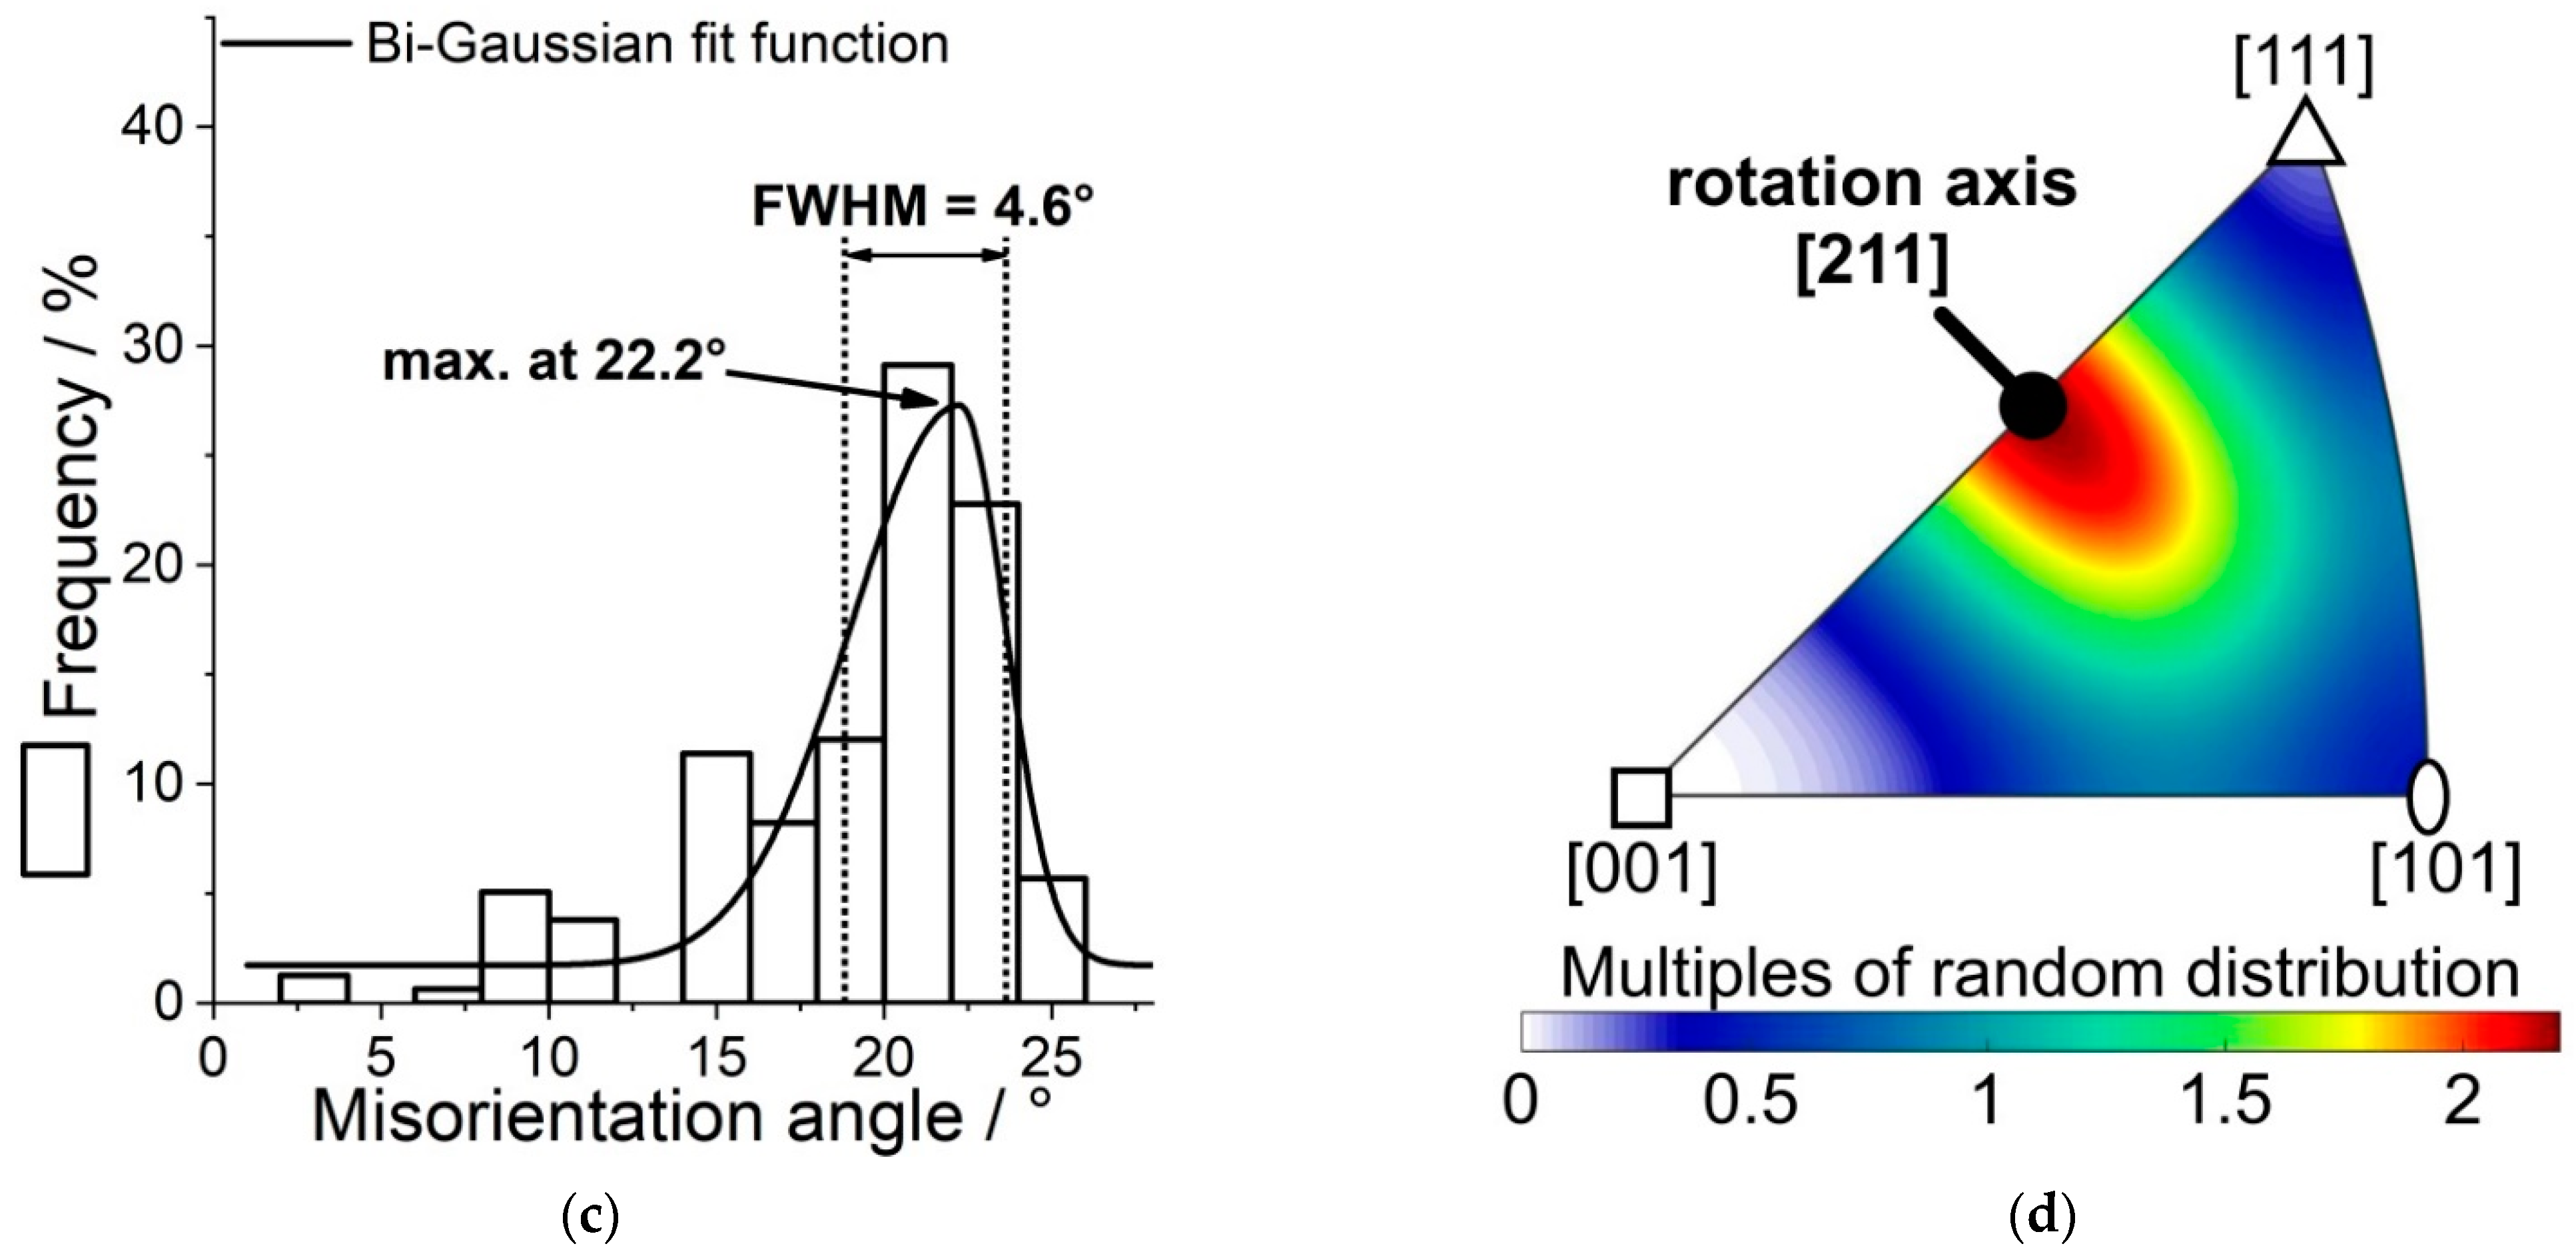
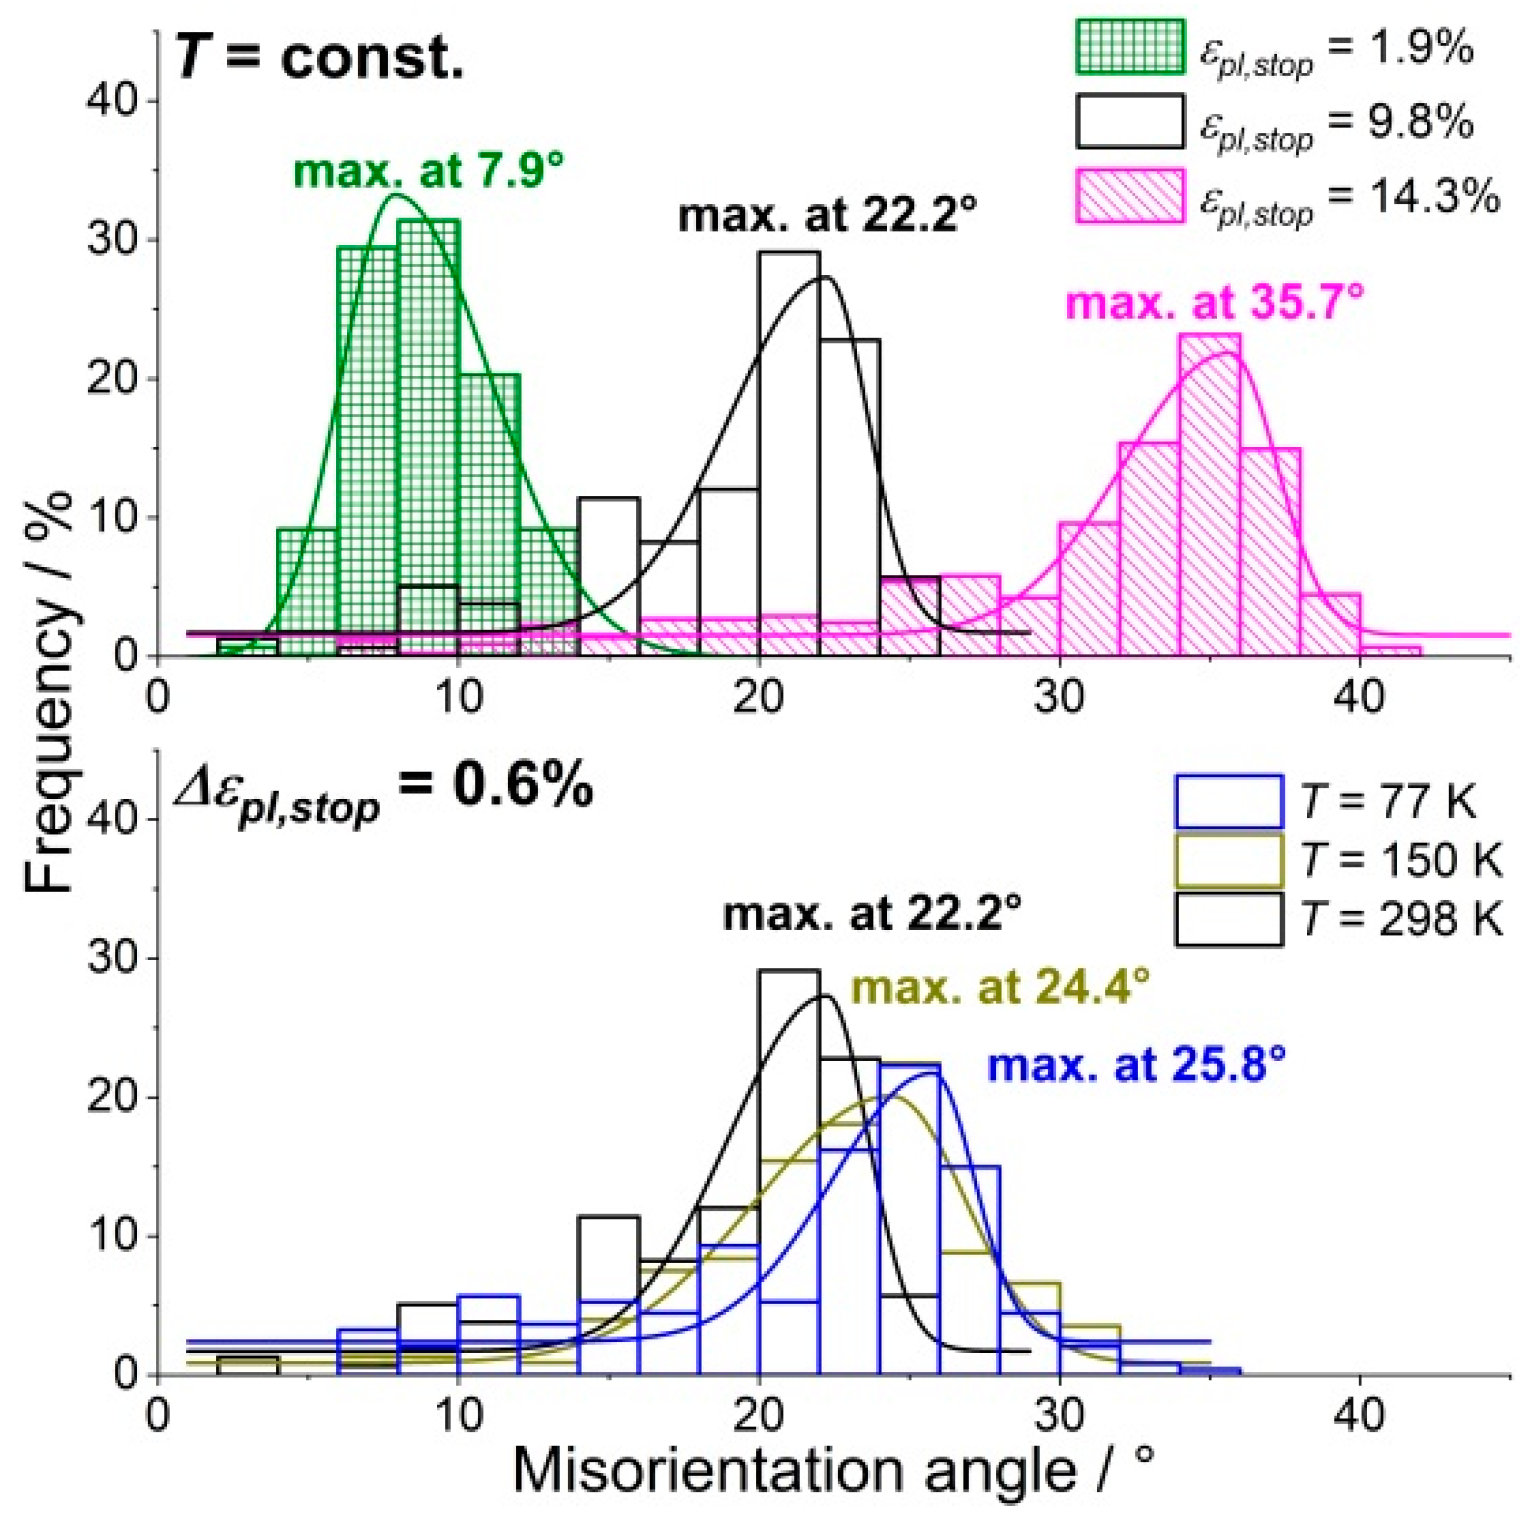
  • The misorientation angle distribution along an individual kink band was fitted by a Bi-Gaussian peak function. The angle of maximum frequency and the FWHM can be used to characterize the kink band properties.

Supplementary Materials

The following are available online at https://www.mdpi.com/2073-4352/11/2/81/s1.

Author Contributions

Conceptualization, H.C.; methodology, H.C., T.H. and A.K.; software, H.C., T.H. and A.K.; validation, H.C. and T.H.; investigation, H.C., T.H., A.K., S.S., D.S.; writing—original draft preparation, H.C.; writing—review and editing, T.H., A.K., S.S., D.S., A.S.T., M.H. and K.-P.W.; visualization, H.C., T.H. and K.-P.W.; supervision, A.K., M.H. and K.-P.W.; project administration, A.K. and K.-P.W.; funding acquisition, A.K. and K.-P.W. All authors have read and agreed to the published version of the manuscript.

Funding

This research was funded by the German Research Foundation (DFG) within the Priority Program SPP2006 “Compositionally Complex Alloys—High Entropy Alloys (CCA-HEA)” (grant numbers WE 6279/1-1, KA 4631/1-1). We acknowledge support by the KIT-Publication Fund of the Karlsruhe Institute of Technology (KIT).

Institutional Review Board Statement

Not applicable.

Informed Consent Statement

Not applicable.

Data Availability Statement

The data presented in this study are available on request from the corresponding author or [email protected] and data is contained within the article or supplementary material.

Acknowledgments

We thank Alexandra Jung, Valentin Tschan (both from Institute for Technical Physics, ITEP at Karlsruhe Institute of Technology (KIT)), Sandra Kauffmann-Weiss (Innovation Campus “Future Mobility” at KIT), Stephan Laube, Frauke Hinrichs, and Luis Wengenmayer (all from Institute for Applied Materials, IAM-WK at KIT) for experimental support. This work was partly carried out with the support of the Karlsruhe Nano Micro Facility (KNMF, www.knmf.kit.edu), a Helmholtz Research Infrastructure at Karlsruhe Institute of Technology (KIT, www.kit.edu). The authors acknowledge the chemical analysis by ICP-OES at the Institute for Applied Materials (IAM-AWP), Karlsruhe Institute of Technology (KIT).

Conflicts of Interest

The authors declare no conflict of interest.

References

  1. Hull, D.; Bacon, D.J. Introduction to Dislocations, 5th ed.; Elsevier/Butterworth-Heinemann: Amsterdam, The Netherlands, 2011; ISBN 978-0-08-096672-4. [Google Scholar]
  2. Piehler, H.R.; Backofen, W.A. A Theoretical Examination of the Plastic Properties of Bcc Crystals Deforming by 〈111〉 Pencil Glide. Metall. Trans. 1971, 2, 249–255. [Google Scholar] [CrossRef]
  3. Orowan, E. A Type of Plastic Deformation New in Metals. Nature 1942, 149, 643–644. [Google Scholar] [CrossRef]
  4. Flewitt, P.E.J.; Crocker, A.G. The Formation of Deformation Kinks in Body Centred Cubic Crystals. Philos. Mag. 1976, 34, 877–891. [Google Scholar] [CrossRef]
  5. Wang, S.; Wu, M.; Sun, B. Kinking in a Refractory TiZrHfNb0.7 Medium-Entropy Alloy. Mater. Lett. 2020, 264, 4. [Google Scholar] [CrossRef]
  6. Besse, M.; Castany, P.; Gloriant, T. Mechanisms of Deformation in Gum Metal TNTZ-O and TNTZ Titanium Alloys: A Comparative Study on the Oxygen Influence. Acta Mater. 2011, 59, 5982–5988. [Google Scholar] [CrossRef] [Green Version]
  7. Yang, Y.; Wu, S.Q.; Li, G.P.; Li, Y.L.; Lu, Y.F.; Yang, K.; Ge, P. Evolution of Deformation Mechanisms of Ti–22.4Nb–0.73Ta–2Zr–1.34O Alloy during Straining. Acta Mater. 2010, 58, 2778–2787. [Google Scholar] [CrossRef]
  8. Zherebtsov, S.; Yurchenko, N.; Shaysultanov, D.; Tikhonovsky, M.; Salishchev, G.; Stepanov, N. Microstructure and Mechanical Properties Evolution in HfNbTaTiZr Refractory High-Entropy Alloy During Cold Rolling. Adv. Eng. Mater. 2020, 2000105. [Google Scholar] [CrossRef]
  9. Senkov, O.N.; Scott, J.M.; Senkova, S.V.; Miracle, D.B.; Woodward, C.F. Microstructure and Room Temperature Properties of a High-Entropy TaNbHfZrTi Alloy. J. Alloys Compd. 2011, 509, 6043–6048. [Google Scholar] [CrossRef]
  10. Eleti, R.R.; Stepanov, N.; Zherebtsov, S. Mechanical Behavior and Thermal Activation Analysis of HfNbTaTiZr Body-Centered Cubic High-Entropy Alloy during Tensile Deformation at 77 K. Scr. Mater. 2020, 188, 118–123. [Google Scholar] [CrossRef]
  11. Senkov, O.N.; Scott, J.M.; Senkova, S.V.; Meisenkothen, F.; Miracle, D.B.; Woodward, C.F. Microstructure and Elevated Temperature Properties of a Refractory TaNbHfZrTi Alloy. J. Mater. Sci. 2012, 47, 4062–4074. [Google Scholar] [CrossRef]
  12. Yeh, J.-W.; Chen, S.-K.; Lin, S.-J.; Gan, J.-Y.; Chin, T.-S.; Shun, T.-T.; Tsau, C.-H.; Chang, S.-Y. Nanostructured High-Entropy Alloys with Multiple Principal Elements: Novel Alloy Design Concepts and Outcomes. Adv. Eng. Mater. 2004, 6, 299–303. [Google Scholar] [CrossRef]
  13. Chen, S.Y.; Tong, Y.; Tseng, K.-K.; Yeh, J.-W.; Poplawsky, J.D.; Wen, J.G.; Gao, M.C.; Kim, G.; Chen, W.; Ren, Y.; et al. Phase Transformations of HfNbTaTiZr High-Entropy Alloy at Intermediate Temperatures. Scr. Mater. 2019, 158, 50–56. [Google Scholar] [CrossRef]
  14. Sestak, B.; Seeger, A. Gleitung Und Verfestigung in Kubisch-Raumzentrierten Metallen Und Legierungen (III). Z. Met. 1978, 69, 425–432. [Google Scholar]
  15. Caillard, D. Geometry and Kinetics of Glide of Screw Dislocations in Tungsten between 95K and 573K. Acta Mater. 2018, 161, 21–34. [Google Scholar] [CrossRef]
  16. Šesták, B.; Seeger, A. The Relationship between the Work-Hardening of B.C.C. and F.C.C. Metals. Phys. Stat. Solidi 1971, 43, 433–444. [Google Scholar] [CrossRef]
  17. Sestak, B.; Seeger, A. Gleitung und Verfestigung in kubisch-raumzentrierten Metallen und Legierungen (I). Z. Met. 1978, 69, 195–202. [Google Scholar]
  18. Conrad, H. Thermally Activated Deformation of Metals. JOM 1964, 16, 582–588. [Google Scholar] [CrossRef]
  19. Chen, H.; Kauffmann, A.; Laube, S.; Choi, I.-C.; Schwaiger, R.; Huang, Y.; Lichtenberg, K.; Müller, F.; Gorr, B.; Christ, H.-J.; et al. Contribution of Lattice Distortion to Solid Solution Strengthening in a Series of Refractory High Entropy Alloys. Metall. Mater. Trans. A 2018, 49, 772–781. [Google Scholar] [CrossRef] [Green Version]
  20. Bachmann, F.; Hielscher, R.; Schaeben, H. Texture Analysis with MTEX—Free and Open Source Software Toolbox. In Solid State Phenomena; Trans Tech Publications Ltd.: Stafa-Zurich, Switzerland, 2010; Volume 160, pp. 63–68. [Google Scholar] [CrossRef] [Green Version]
  21. Moody, M.P.; Stephenson, L.T.; Ceguerra, A.V.; Ringer, S.P. Quantitative Binomial Distribution Analyses of Nanoscale Like-solute Atom Clustering and Segregation in Atom Probe Tomography Data. Microsc. Res. Tech. 2008, 71, 542–550. [Google Scholar] [CrossRef]
  22. Yao, M.J.; Pradeep, K.G.; Tasan, C.C.; Raabe, D. A Novel, Single Phase, Non-Equiatomic FeMnNiCoCr High-Entropy Alloy with Exceptional Phase Stability and Tensile Ductility. Scr. Mater. 2014, 72–73, 5–8. [Google Scholar] [CrossRef]
  23. Lee, C.; Song, G.; Gao, M.C.; Feng, R.; Chen, P.; Brechtl, J.; Chen, Y.; An, K.; Guo, W.; Poplawsky, J.D.; et al. Lattice Distortion in a Strong and Ductile Refractory High-Entropy Alloy. Acta Mater. 2018, 160, 158–172. [Google Scholar] [CrossRef]
  24. Thiel, F.; Geissler, D.; Nielsch, K.; Kauffmann, A.; Seils, S.; Heilmaier, M.; Utt, D.; Albe, K.; Motylenko, M.; Rafaja, D.; et al. Origins of Strength and Plasticity in the Precious Metal Based High-Entropy Alloy AuCuNiPdPt. Acta Mater. 2020, 185, 400–411. [Google Scholar] [CrossRef]
  25. Couzinié, J.P.; Dirras, G.; Perrière, L.; Chauveau, T.; Leroy, E.; Champion, Y.; Guillot, I. Microstructure of a Near-Equimolar Refractory High-Entropy Alloy. Mater. Lett. 2014, 126, 285–287. [Google Scholar] [CrossRef]
  26. Argon, A.S. The lattice resistance. In Strengthening Mechanisms in Crystal Plasticity; Oxford Series on Materials Modelling; Oxford University Press: Oxford, UK, 2008; pp. 78–135. [Google Scholar]
  27. Senkov, O.N.; Gorsse, S.; Miracle, D.B. High Temperature Strength of Refractory Complex Concentrated Alloys. Acta Mater. 2019, 175, 394–405. [Google Scholar] [CrossRef]
  28. Galindo-Nava, E.I.; Rivera-Díaz-del-Castillo, P.E.J. Modelling Plastic Deformation in BCC Metals: Dynamic Recovery and Cell Formation Effects. Mater. Sci. Eng. A 2012, 558, 641–648. [Google Scholar] [CrossRef]
  29. Cai, Y.; Zhong, Z.Y.; Tang, M.X.; Zhu, X.R.; Wang, L.; Luo, S.N. Texture of Nanocrystalline Solids: Atomic Scale Characterization and Applications. J. Appl. Cryst. 2018, 51, 124–132. [Google Scholar] [CrossRef]
  30. Chen, H.; Kauffmann, A.; Gorr, B.; Schliephake, D.; Seemüller, C.; Wagner, J.N.; Christ, H.-J.; Heilmaier, M. Microstructure and Mechanical Properties at Elevated Temperatures of a New Al-Containing Refractory High-Entropy Alloy Nb-Mo-Cr-Ti-Al. J. Alloys Compd. 2016, 661, 206–215. [Google Scholar] [CrossRef] [Green Version]
  31. Wang, S.; Wu, M.; Shu, D.; Zhu, G.; Wang, D.; Sun, B. Mechanical Instability and Tensile Properties of TiZrHfNbTa High Entropy Alloy at Cryogenic Temperatures. Acta Mater. 2020, 201, 517–527. [Google Scholar] [CrossRef]
  32. Couzinié, J.-P.; Lilensten, L.; Champion, Y.; Dirras, G.; Perrière, L.; Guillot, I. On the Room Temperature Deformation Mechanisms of a TiZrHfNbTa Refractory High-Entropy Alloy. Mater. Sci. Eng. A 2015, 645, 255–263. [Google Scholar] [CrossRef]
Figure 1. Microstructural investigations of HfNbTaTiZr: (a) X-ray diffraction (XRD) pattern; diamond-shaped symbols highlight peaks of the body centered cubic (bcc) phase (W prototype). Intensity is plotted in a logarithmic scale for better visibility of low-intensity peaks. (b) electron channeling contrast imaging (ECC) micrograph and elemental energy-dispersive X-ray spectroscopy (EDX) maps of the same area.
Crystals 11 00081 g001
Figure 2. APT analysis of homogenized HfNbTaTiZr: (a) Reconstruction of an atom probe tomography (APT) tip showing 2% of all ions. (b) Same sample volume showing 2% of all Ta ions as well as the 14 at.% isoconcentration surfaces of Ta. Ta-enriched regions are highlighted by arrows. Both reconstructions are displayed at the same magnification. Red-colored frame highlights region for concentration profile evaluation. (c) Concentration profiles x T a and x Z r of Ta and Zr. Red arrows as well as two vertical, dotted lines that connect element concentrations at the same distance indicating the opposite concentration trends of both elements.
Crystals 11 00081 g002
Figure 3. Mechanical properties of as-homogenized HfNbTaTiZr under compression at an initial strain rate of 10 3   s 1 : Stress-strain curves of terminated compression tests at constant test temperature (left), comparable plastic strain ε p l , s t o p (center) and comparable yield strength σ 0.2 (right). Yield strength σ 0.2 , plastic strain ε p l , s t o p and stress σ s t o p at test termination are pointed out in Table 3.
Crystals 11 00081 g003
Figure 4. Microstructural analysis of compression deformed HfNbTaTiZr ( T = 298 K, ε p l , s t o p = 9.8%): (a) Color-coded orientation map on a longitudinal section shows grains of the bcc solid solution phase; compression direction (CD) is vertical, and the color code corresponds to the inverse pole figure (IPF) in the inset. Black arrows highlight kink bands. Microstructural details within the red rectangle are analyzed in an enlarged view in Figure 5. (b) Color-coded orientation distribution of the CD in an IPF determined from the orientations as shown in the map of (a).
Crystals 11 00081 g004
Figure 5. Properties of kink bands: (a) regions of interest (ROI) as an orientation map (top) with respect to CD (color code of orientations corresponds to the IPF of the inset) and kernel average misfit (KAM) map of the identical area (bottom). High angle grain boundaries are depicted as black lines. (b) Misorientation angle distribution along the boundary of one individual kink band highlighted by the red polygon in (a). (c) Relative frequency distribution of misorientation angles (histogram) from (b). Bin size is 2°. Bi-Gaussian fit is plotted as a line diagram. (d) Orientation distribution of rotation axes determined from the ROI of (b) presented as a color map in an IPF.
Crystals 11 00081 g005aCrystals 11 00081 g005b
Figure 6. Relative frequency distribution of misorientation angles (2° bins, presented by histograms) and Bi-Gaussian fit (line diagrams) of respective data set. Influence of plastic strain ε p l , s t o p on kink band properties in HfNbTaTiZr, deformed at 298 K: 1.9% vs. 9.8% vs. 14.3% (top) and influence of test temperature T on misorientation angle distribution at comparable plastic strains ε p l , s t o p : 77 vs. 150 vs. 298 K (bottom).
Crystals 11 00081 g006
Figure 7. IPF maps of the longitudinal section of deformed HfNbTaTiZr: (a) Tested at 873 K ( ε p l , s t o p = 13.9%). Arrows indicate kink bands. Detail within the white frame is shown at a higher magnification in the inset to highlight kink bands. (b) Tested at 1073 K ( ε p l , s t o p = 16.2%). Both IPF maps have the same size. For magnification, color codes, and CD of both maps, please see labels and inset of Figure 7b.
Crystals 11 00081 g007
Table 1. Composition of a HfNbTaTiZr alloy determined by inductively coupled plasma optical emission spectrometry (ICP-OES). The standard deviation of the element concentration x i was below 0.2 at.%, respectively.
i HfNbTaTiZr
x i /at.%19.320.320.620.119.7
Table 2. Autocorrelation factor μ for all elements determined from the entire sample volume, as shown in Figure 2a.
HfNbTaTiZr
μ / 10 2 5.110.224.714.114.0
Table 3. Test parameters and characteristic values of HfNbTaTiZr determined by terminated compression tests; initial strain rate was 10−3 s−1. σ s t o p : stress at test termination; RT: room temperature.
T /K σ 0.2 /MPa ε p l , s t o p /% σ s t o p /MPa
77167010.42340
150121010.01750
298 (RT)10401.91240
11109.81560
119014.31830
87348013.9690
107346016.2440
Table 4. Characteristic values of kink band misorientation angles determined by Bi-Gaussian fit function to characterize kink band properties at varying deformation conditions. FWHM: full width at half maximum.
T /K ε p l , s t o p /%Misorientation Angle at Frequency Maximum/°FWHM/° R a d j 2
2981.97.95.00.99
2989.822.24.60.83
29814.335.75.10.92
7710.425.84.70.83
15010.024.47.00.93
Publisher’s Note: MDPI stays neutral with regard to jurisdictional claims in published maps and institutional affiliations.

