Article

Calculation for High Pressure Behaviour of Potential Solar Cell Materials Cu2FeSnS4 and Cu2MnSnS4

1
Institut für Chemie und Biochemie, Freie Universität Berlin, Arnimallee 22, 14195 Berlin, Germany
2
Institut für Chemie, Technische Universität Berlin, Strasse des 17. Juni 135, 10623 Berlin, Germany
*
Author to whom correspondence should be addressed.
Crystals 2021, 11(2), 151; https://doi.org/10.3390/cryst11020151
Submission received: 8 January 2021 / Revised: 26 January 2021 / Accepted: 27 January 2021 / Published: 2 February 2021
(This article belongs to the Special Issue Molecular Modeling in Crystals)

Abstract

:
Exploring alternatives to the Cu2ZnSnS4 kesterite solar cell absorber, we have calculated first principle enthalpies of different plausible structural models (kesterite, stannite, P 4 ¯ and GeSb type) for Cu2FeSnS4 and Cu2MnSnS4 to identify low and high pressure phases. Due to the magnetic nature of Fe and Mn atoms we included a ferromagnetic (FM) and anti-ferromagnetic (AM) phase for each structural model. For Cu2FeSnS4 we predict the following transitions: P 4 ¯ (AM) 16.3 GPa GeSb type (AM) 23.0 GPa GeSb type (FM). At the first transition the electronic structure changes from semi-conducting to metallic and remains metallic throughout the second transition. For Cu2MnSnS4, we predict a direct AM (kesterite) to FM (GeSb-type) transitions at somewhat lower pressure (12.1 GPa). The GeSb-type structure also shows metallic behaviour.

Graphical Abstract

1. Introduction

The impending exhaustion of fossil fuel has prompted the exploration and exploitation of alternative energy resources, with the solar energy harvesting through photovoltaic devices spearheading these efforts. In an attempt to overcome the restraints of Si-based materials, the direct optical band gap of chalcogenide-based solar cells offers the benefit of higher absorption in comparison to silicon. Given that the employed chalcogenides are composed of multiple elements, one can additionally optimise the photovoltaic properties of the respective material by appropriate metal or chalcogenide substitution. Among the various chalcogenides investigated for this purpose, the quaternary semiconductor Cu2ZnSnS4 has attracted considerable attention [1,2]. The suitability of this material for solar cell applications stems from its almost optimal band gap ( E g ≈ 1.5 eV), its high absorption coefficient in the visible range, and its earth-abundant, low-cost, and non-toxic constituents [3,4,5]. In a previous experimental and theoretical study on Cu2ZnSnS4 we have investigated the high pressure behaviour to probe its reaction to tensile stress [6]. One of the biggest issues with Cu2ZnSnS4 is that it suffers from Cu-Zn cationic disorder [7]. The main reason why Cu and Zn can be interchanged easily is their similar ionic radius. The analogues Cu2FeSnS4 and Cu2MnSnS4 have similarly favourable properties for use as a solar cell absorber. We expect cationic disorder to be less present due to the bigger difference in size of Fe and Mn in comparison to Cu. In this work, we want use density functional-based (DFT) first principle methods to investigate how Cu2FeSnS4 and Cu2MnSnS4 behave under tensile stress to understand the physical limitation of those materials.

2. Materials and Methods

2.1. Calculation Set-Up

The periodic density functional theory (DFT) calculations were performed with VASP 5.4.4 [8,9,10,11]. A plane wave basis set with an energy cutoff of 550 eV with the projector augmented (PAW) potentials [12,13] was used, whereby the 5s, 5p and 4d electrons of Sn, 3s, 3p electrons of S, and 4s, 3d electrons of Cu, Fe and Mn were explicitly considered. The electronic convergence criteria was set at least to 10 5 eV, whereby the Blocked-Davidson algorithm was applied as implemented in VASP. The structural relaxation of internal and external lattice parameters was set to a force convergence of 10 2 eV/Å 2 while the conjugate-gradient algorithm implemented in VASP was used [14]. The freedom of spin polarisation was enabled and a Gaussian smearing approach with a smearing factor σ of 0.01 eV was utilised. For all structures we simulated 16 atoms which corresponds to the number of atoms in the kesterite unit cell. The cells were fully optimised with a 8 × 8 × 4 k-grid constructed via the Monkhorst-Pack scheme [15] and centered at the Γ -point with the PBE functional [16]. The cells include two magnetic ions (Fe or Mn) which can be arranged in two different magnetic phases, ferromagnetic (FM) with parallel magnetic moments and anti-ferromagnetic (AM) with antiparallel ones. On top of the PBE-optimised structures, single point calculations for the band gap and DOS with the HSE06-functional [17,18,19,20] were performed with a 4 × 4 × 2 k-grid to account for an accurate electronic structure. The tetrahedron method with Blöchl corrections [21] was applied for band structure evaluation.
The pressure dependence was determined by selecting volume points in a range of about 50 Å 3 below the minima. This corresponds to a pressure range of 0–30 GPa. We used a step size of 8 Å 3 which lead to at least 10 volume points for each structural model. At each point we optimised the ionic positions and cell shape, while keeping the volume constant. We fitted the total energy versus volume to a Birch-Murnaghan Equation of State (B-M EoS) [22]. Then the pressure at each volume was obtained from the P(V) formulation of the same EoS (for details see Appendix A.3). Using the pressure we calculated the enthalpies ( H ( P ) = E + P V ) for each structural model and compared them over the investigated pressure range to identify the most stable structures.
All energy and enthalpy differences between different structural models in the following refer to the KS unit cell size, hence to two formula units.

2.2. Structural Models

In quaternary chalcogenide semiconductors the equilibrium structure at ambient pressures in most cases are kesterite (KS, Figure 1a) or stannite (ST, Figure 1b) structures [23,24]. We include both structures as potential low pressure phases for Cu2FeSnS4 and Cu2MnSnS4. Please note that in the cited work by Schorr et al. [23] besides KS and ST also three disordered structures are suggested which are very unlikely to occur in our systems due to the different ionic radii of the involved elements. In our high pressure study on Cu2ZnSnS4 we found the distorted rocksalt structure (GeSb, Figure 1c) to be the most stable phase beyond 16 GPa [6]. Therefore we include GeSb as a high pressure phase in this study. We also include a tetragonal P 4 ¯ structure (Figure 1d), which is discussed in literature as the thermodynamically most stable structure for Cu2FeSnS4 [25,26,27].
KS, ST and P 4 ¯ have a coordination number of 4, due to the same structural motif, they are close in formation energy and which structure forms depends on the crystallisation conditions. Unless the crystallisation is done carefully to enable the formation of the thermodynamic equilibrium the crystallisation process is kinetically driven, which we can not simulate in our DFT calculations. The high pressure phase GeSb has a coordination number of 6. Transitioning from a four to a six-fold coordination is a massive structural change associated with a large difference in the energy of formation. Due to the large energy difference, we can describe the pressure induced transition well in DFT.

3. Results and Discussion

3.1. Equilibrium Structures

Before discussing the enthalpies we will review the equilibrium structures at zero pressure of Cu2FeSnS4 and Cu2MnSnS4, obtained at the PBE level (Table 1) and compare to published crystal structures. XRD (X-ray diffraction) analysis by Brockway dating back to 1934 revealed that natural Cu2FeSnS4 samples crystallise in ST structure [28]. Those results where subsequently confirmed in the 1970s by Ganiel et al., they furthermore studied the magnetic ordering via Mössbauer spectroscopy and found that it was anti-ferromagnetic [29]. In 1972 Springer studied the solution series Cu 2 Fe 1 x Zn x SnS 4 . Beyond x = 0.4 and above 680 ° C he observed an ST crystal structure he labeled β -Cu 2 (Fe/Zn)SnS 4 . Below x = 0.4 and 680 ° C he found another tetragonal phase he labeled α -Cu 2 (Fe/Zn)SnS 4 [25,30]. In 2000 pure α -Cu 2 FeSnS 4 was synthesised [26]. After the solid state reaction of CuFeS2 on SnS at 1323 K in sealed graphite crucible for 24 h the product was cooled slowly over 50 h. Through the slow cooling they obtained the thermodynamically most stable α -phase. Through XRD measurements the space group of the sample was determined to be P 4 ¯ [26]. Those results where confirmed by Rincon et al. who furthermore studied the magnetic susceptibility and revealed that also α -Cu 2 FeSnS 4 exhibits an anti-ferromagnetic ordering [27].
Our PBE results for Cu2FeSnS4 agree very well with the experiments. We found the anti-ferromagnetic P 4 ¯ (corresponding to α -Cu 2 FeSnS 4 ) structure to be most stable (Table 1). But it is only 22 meV more stable than the naturally occurring anti-ferromagnetic ST structure. The anti-ferromagnetic KS structure is another 100 meV above the anti-ferromagnetic ST structure. The small energy difference between ST and P 4 ¯ may give an explanation why the P 4 ¯ phase is hard to obtain in pure form. From the experimental results we conclude that the formation of the ST phase has to be kinetically favoured. This aspect dominates the crystallisation process if the samples are rapidly cooled. We expect the thermodynamic equilibrium to build up slowly based on the small energy difference between the P 4 ¯ and ST structures, hence slow cooling is crucial to obtain α -Cu 2 FeSnS 4 . In agreement with the experimental data we find the anti-ferromagnetic ordering favoured over the ferromagnetic ordering by 82 meV and 152 meV, for ST and P 4 ¯ , respectively. The PBE lattice parameter for both Cu2FeSnS4 phases agree reasonably well with the XRD experiments. The lattice parameters change only slightly between the magnetic phases and are within the error bars of the functional applied.
Our PBE prediction for the most stable structure for Cu2MnSnS4 does not agree with experimental results. Magnetisation and neutron-diffraction measurements have shown that Cu2MnSnS4 has an anti-ferromagnetic ST structure [31]. We predict the anti-ferromagnetic KS structure to be 35 meV more stable (Table 2). We also tested the P 4 ¯ structure and found it to be the least stable anti-ferromagnetic and ferromagnetic structure. The anti-ferromagnetic P 4 ¯ structure is 17 meV less stable than the anti-ferromagnetic ST phase at the PBE level. Our results on the relative KS and ST stability agree closely with PBEsol calculations by Scragg et al [32]. The same group has also carried out HSE06 calculations and found the ST structure to be more stable than the KS structure. The difference is only 15 meV per unit cell. The error in the lattice constants of the PBE calculations is in the range of the differences between the structures and magnetic phases. The PBE lattice constants for Cu2MnSnS4 show subtle interplay between magnetism and structure but all of them are close to the experimental lattice parameter of ST (AM).
In contrast to the KS equilibrium structure of Cu2ZnSnS4, the compounds Cu2FeSnS4 and Cu2MnSnS4 experimentally favour a ST and/or P 4 ¯ structure. The ST and P 4 ¯ structures are group theoretically related, both structures exhibit similar cationic layers. We can rationalise the formation of ST and or P 4 ¯ structures over KS by comparing the ionic crystal radii (defined according to Fumi and Tosi [33]) of the substituted bivalent elements (Zn, Fe and Mn) in chalcogenides determinded by Shannon [34].
Cu2ZnSnS4 in the KS structure consists of Cu+-Zn2+ layers and Cu+-Sn4+ layers. The crystal radius of Zn2+ (rc = 0.60 Å) is identical to the crystal radius of Cu+ (rc = 0.60 Å), which allows them to fit in the same layer. If we replace Zn2+ with the larger Fe2+ (rc = 0.63 Å) or Mn2+ (rc = 0.66 Å), a ST or P 4 ¯ structure is formed. In those structures pure Cu+ layers alternate with Sn4+-Fe2+/Mn2+ layers. Like this the largest and the smallest ion (Sn4+, r c = 0.55 Å) are paired in one layer. In a KS structure the large bivalent cation would have to be in the same layer as the second largest Cu+ ion. We suspect that this is the main reason which drives the formation of the ST and/or P 4 ¯ structures for the magnetic derivates.
In contrast to Cu2FeSnS4, we do not find the ST structure to be more stable than KS in our calculations for Cu2MnSnS4, although Mn2+ has an even larger ionic crystal radius than Fe2+. We found that PBE fails do describe the electron density around Mn2+, the charge is more smeared out than for Fe2+ which leads to larger positive charge at Mn (for details see Table A3 in Appendix A.1).
The PBE lattice parameter a and c of the ST and P 4 ¯ structure (2c for the P 4 ¯ structure) for Cu2FeSnS4 differ by less than 0.1%. The differences in Cu2MnSnS4 of a and c between ST and KS are larger, particularly in c where the difference is 2%. We think that the reason must be the different composition of the cationic layers. If we compare the ST structures of both materials, we find that the size of the lattice parameters corresponds to the crystal radius of the bivalent cation. All presented structures for Cu2FeSnS4 and Cu2MnSnS4 have lattice parameter within 2% of the values for the Cu2MnSnS4 KS (5.485 Å and 10.94 Å [23]).

3.2. Pressure-Dependent Enthalpies

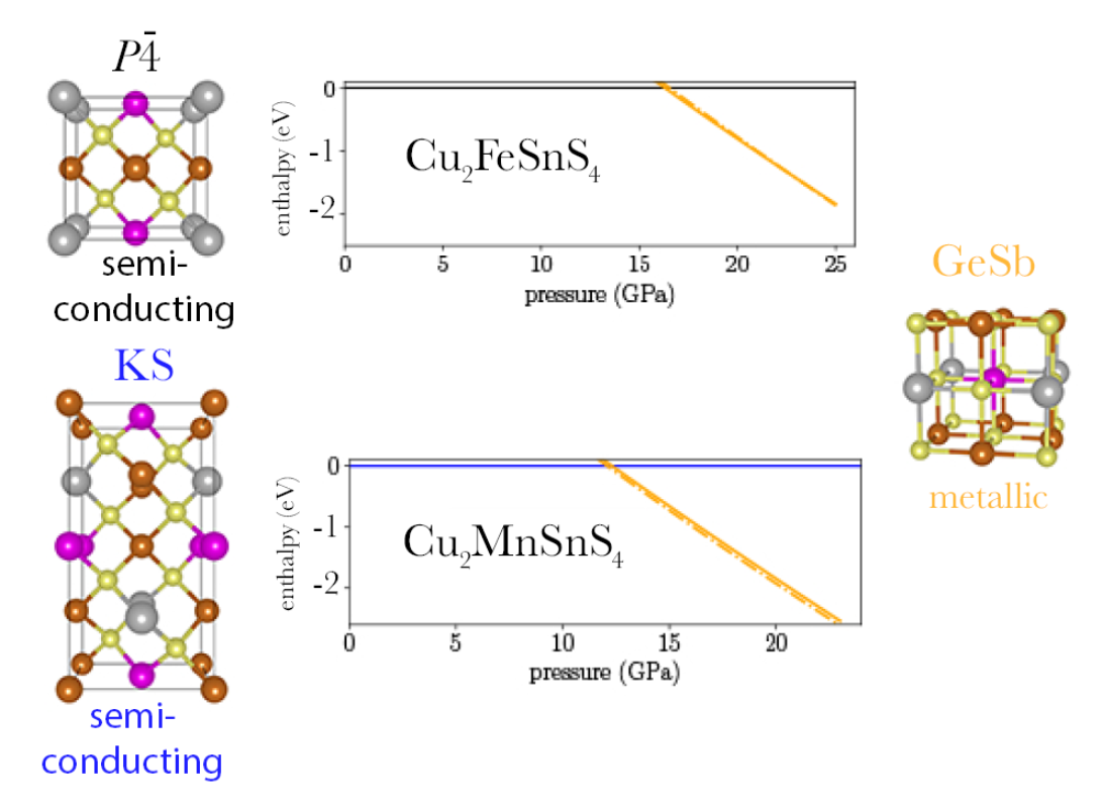
If we plot and compare the enthalpies for Cu2FeSnS4 (Figure 2a,b) we find the anti-ferromagentic P 4 ¯ structure to be most stable up to 16.3 GPa. Throughout this pressure range the anti-ferromagentic ST structures is only 22 to 40 meV less stable. The anti-ferromagentic KS structure is even less stable than the ferromagnetic ST structure which is about 100 meV above the P 4 ¯ structure. The energy splitting between AM and FM increases from the KS over the ST to the P 4 ¯ structure. As a consequence the ferromagnetic P 4 ¯ structure is as unstable as the ferromagnetic KS structure in the investigated pressure range. At 16.3 GPa, we find a transition from the P 4 ¯ structure to the GeSb structure. Its purely a structural transition, the magnetic phase remains anti-ferromagnetic. The cell volume decreases by 13% (Table 3) through the transition. At 23.0 GPa we predict a magnetic phase transition of GeSb to ferromagnetic. The energy difference between the two different magnetic phases is very small, at the structural transition pressure it is 15 meV and decreases up to the magnetic transition pressure. Afterwards it increases again, but the difference remains small, at 25 GPa it amounts to 75 meV. The anti-ferromagnetic modification for KS and ST is more stable than the ferromagnetic modification over the whole pressure range. As pointed out for the equilibrium structures, the anti-ferromagnetic P 4 ¯ structure and the ST structure can be observed experimentally, depending on the preparation method. Due to the small energy difference between both structures also at the transition pressure, we predict that an ST-to-GeSb transition would also appear at a very similar pressure as the P 4 ¯ -to-GeSb transition.
The enthalpy for Cu2MnSnS4 (Figure 3a,b) indicates that anti-ferromagnetic KS is most stable at ambient conditions and up to 12.1 GPa, where we predict a KS-to-GeSb phase transition. The structural phase transition is accompanied by a magnetic phase transition from anti-ferromagnetic to ferromagnetic. The cell volume decreases by 14% (Table 3) through the transition. At the transition pressure the ferromagnetic GeSb modification is 66 meV more stable than the anti-ferromagnetic modification. With increasing pressure the difference is nearly constant, at 20 GPa it amounts to 73 meV. For the KS structure the anti-ferromagnetic modification remains more stable than the ferromagnetic modification by over 40 meV throughout the whole pressure range. For the ST structure the ferromagnetic modification becomes more stable around 12 GPa. The difference between both magnetic phases is much lower than for KS and remains below 20 meV throughout the whole pressure range. The anti-ferromagnetic P 4 ¯ has a very similar stability as the ferromagnetic ST structure. The splitting between AM and FM is the largest, rendering the ferromagnetic P 4 ¯ structure the least stable through the whole pressure range. As pointed out above, the relative stability of KS and ST is wrong at the PBE level. Over the whole pressure range the difference in energy between KS and ST stays below 50 meV. In comparison to the energy change induced by the structural phase transition (already 1 eV at 5 GPa above phase transition), this energy difference is small. That is why we think we can still predict a phase transition around 12 GPa. But experimentally we expect a ST(AM)-to-GeSb(FM) transition instead of the KS-to-GeSb phase transition our calculations suggest.

3.3. Electronic Structure

We investigated the electronic band structure for equilibrium and high-pressure structures for both compounds at the equilibrium and at the transition pressure with the HSE06 hybrid functional [17].
For Cu2FeSnS4, we predicted the band gap of the anti-ferromagnetic ST structure to be 1.3 eV (Table 4). Based on absorption spectra, the band gap was determined to be 1.6 eV [35]. We think that the difference from our prediction is largely due to the fact that we only optimised our structures at the PBE level but also partly due to the error of the HSE06 functional in reproducing band gaps. In an earlier study within our group we obtained similar results for Cu2ZnSnS4 KS. Experimentally the Cu2ZnSnS4 KS band gap is determined to be 1.5 eV [6]. The HSE06 band gap for the PBE optimised structure is 1.2 eV. Only if the structure is also optimised at the HSE06 level, we obtain the experimental band gap [36]. The HSE06 band gap deviation for Cu2ZnSnS4 of the PBE structure is −0.3 eV. We expect it to have similar magnitude for Cu2FeSnS4 and Cu2MnSnS4.
The HSE06 band gap for the most stable anti-ferromagnetic P 4 ¯ structure of Cu2FeSnS4 is 1 eV. For P 4 ¯ and ST Cu2FeSnS4 the anti-ferromagnetic modification has an 0.2 and 0.3 eV larger band gap than the ferromagnetic modification.
For Cu2MnSnS4 we predicted an equilibrium band gap for ST of 1.1 eV (Table 4). Experimental measurements by Raudsich et al. of Cu2MnSnS4 indicate a band gap of 1.42 to 1.79 eV. All measured samples contained Cu2MnSn3S8 as a secondary phase. They also calculated the band gap at the HSE06 level which they reported to be 1.5 eV. Again the deviation to our result must be due to the fact that they also carried out the optimisation at the HSE06 level while we restricted ourselves to PBE optimisations.
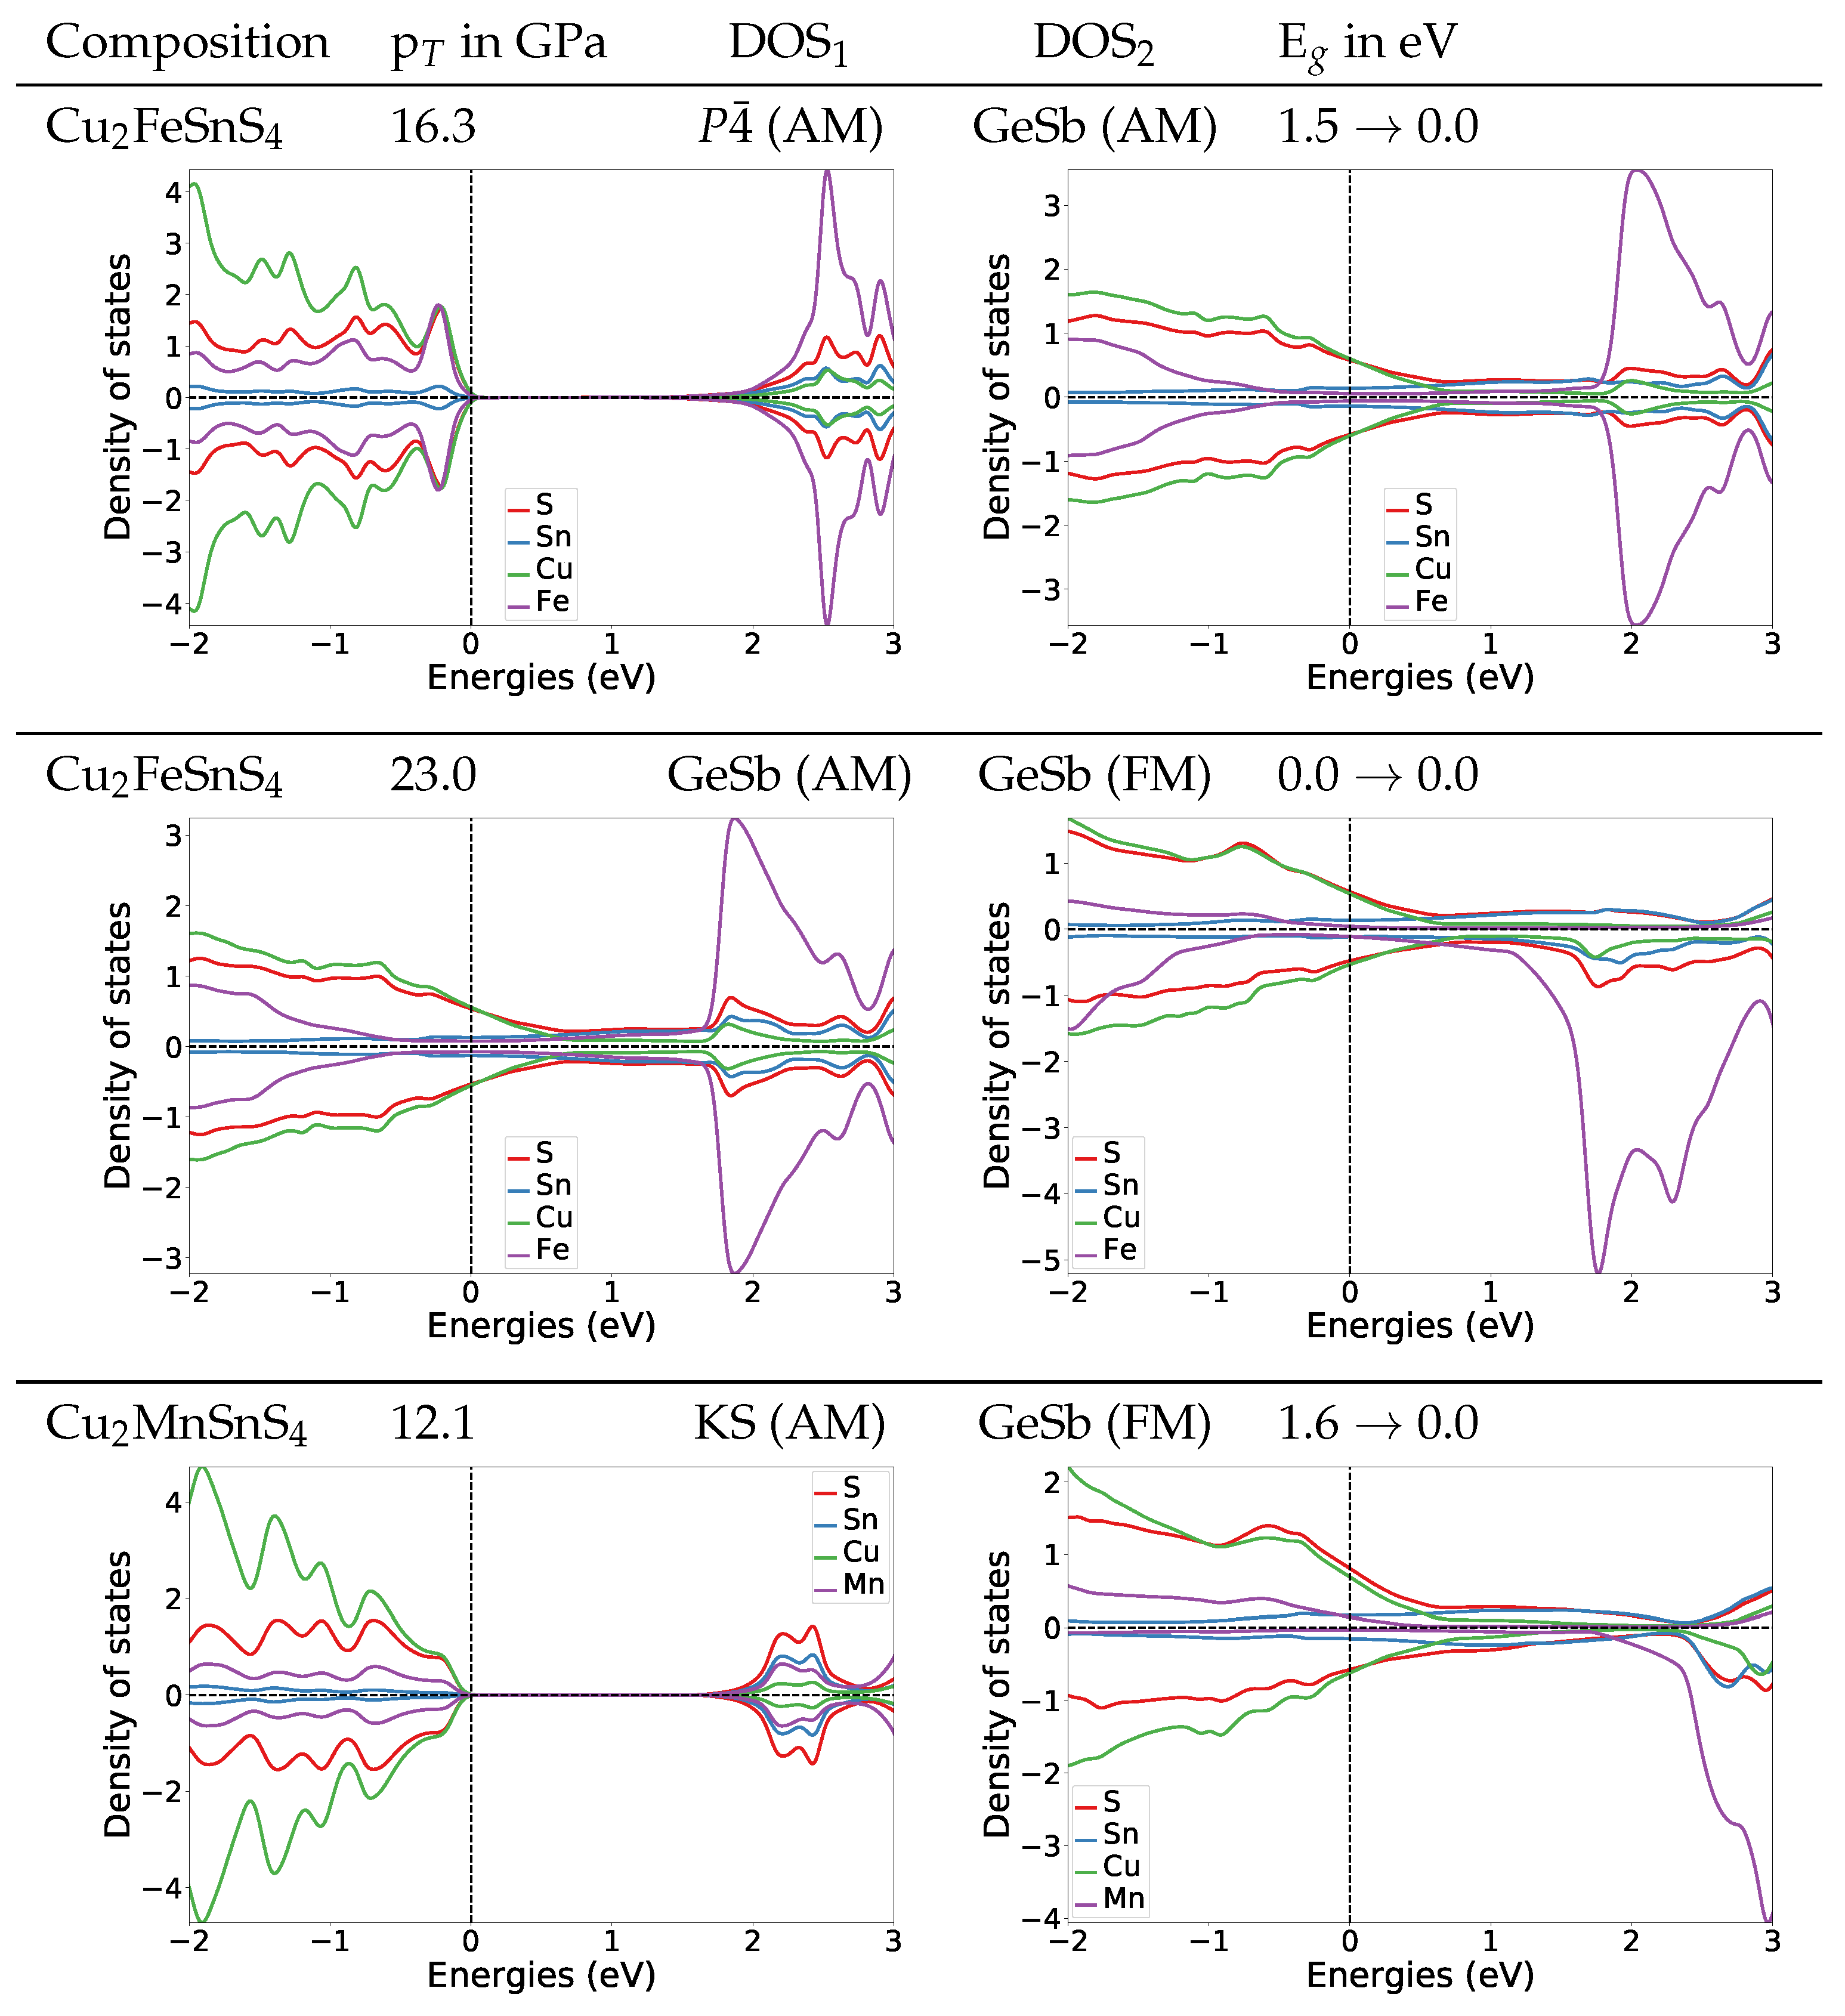
To understand the change of the electronic structures under pressure, we also calculated the DOS at the transition pressures for both systems. For the P 4 ¯ structure of Cu2FeSnS4 at the transition pressure the band gap is widened to 1.4 eV (Figure 4). For the naturally occurring ST structure (AM) the band gap is widened to 1.5 eV (for DOS see Appendix A.4.2). After the transition to the anti-ferromagnetic GeSb structure the band gap closes completely. In the DOS plot for anti-ferromagnetic GeSb at the transition pressure we can see that all bands from the valence band now extend in the region from 0 eV to 1.5 eV which is the band gap region for the P 4 ¯ structure. Thus we predict a change from semi-conducting to metallic behaviour. The band gap stays zero with the second magnetic transition from anti-ferromagnetic to ferromagnetic.
For Cu2MnSnS4 we find the same behaviour concerning the electronic structure at the transition pressure, a closing of the gap and a metallic character above the transition pressure (Figure 4). During the structural transition, the magnetic structure changes from AM to FM. We are confident that this also holds for the ST (AM) to GeSb (FM) transition we expect based on the observation that the experimental equilibrium structure for Cu2MnSnS4 is the anti-ferromagnetic ST structure. To verify this assumption we also calculated the DOS for ST at the transition pressure, its band gap is 1.2 eV (for DOS see Appendix A.4.2). This confirms that also for the ST (AM) to GeSb (FM) transition the electronic structure would change from semi-conducting to metallic.
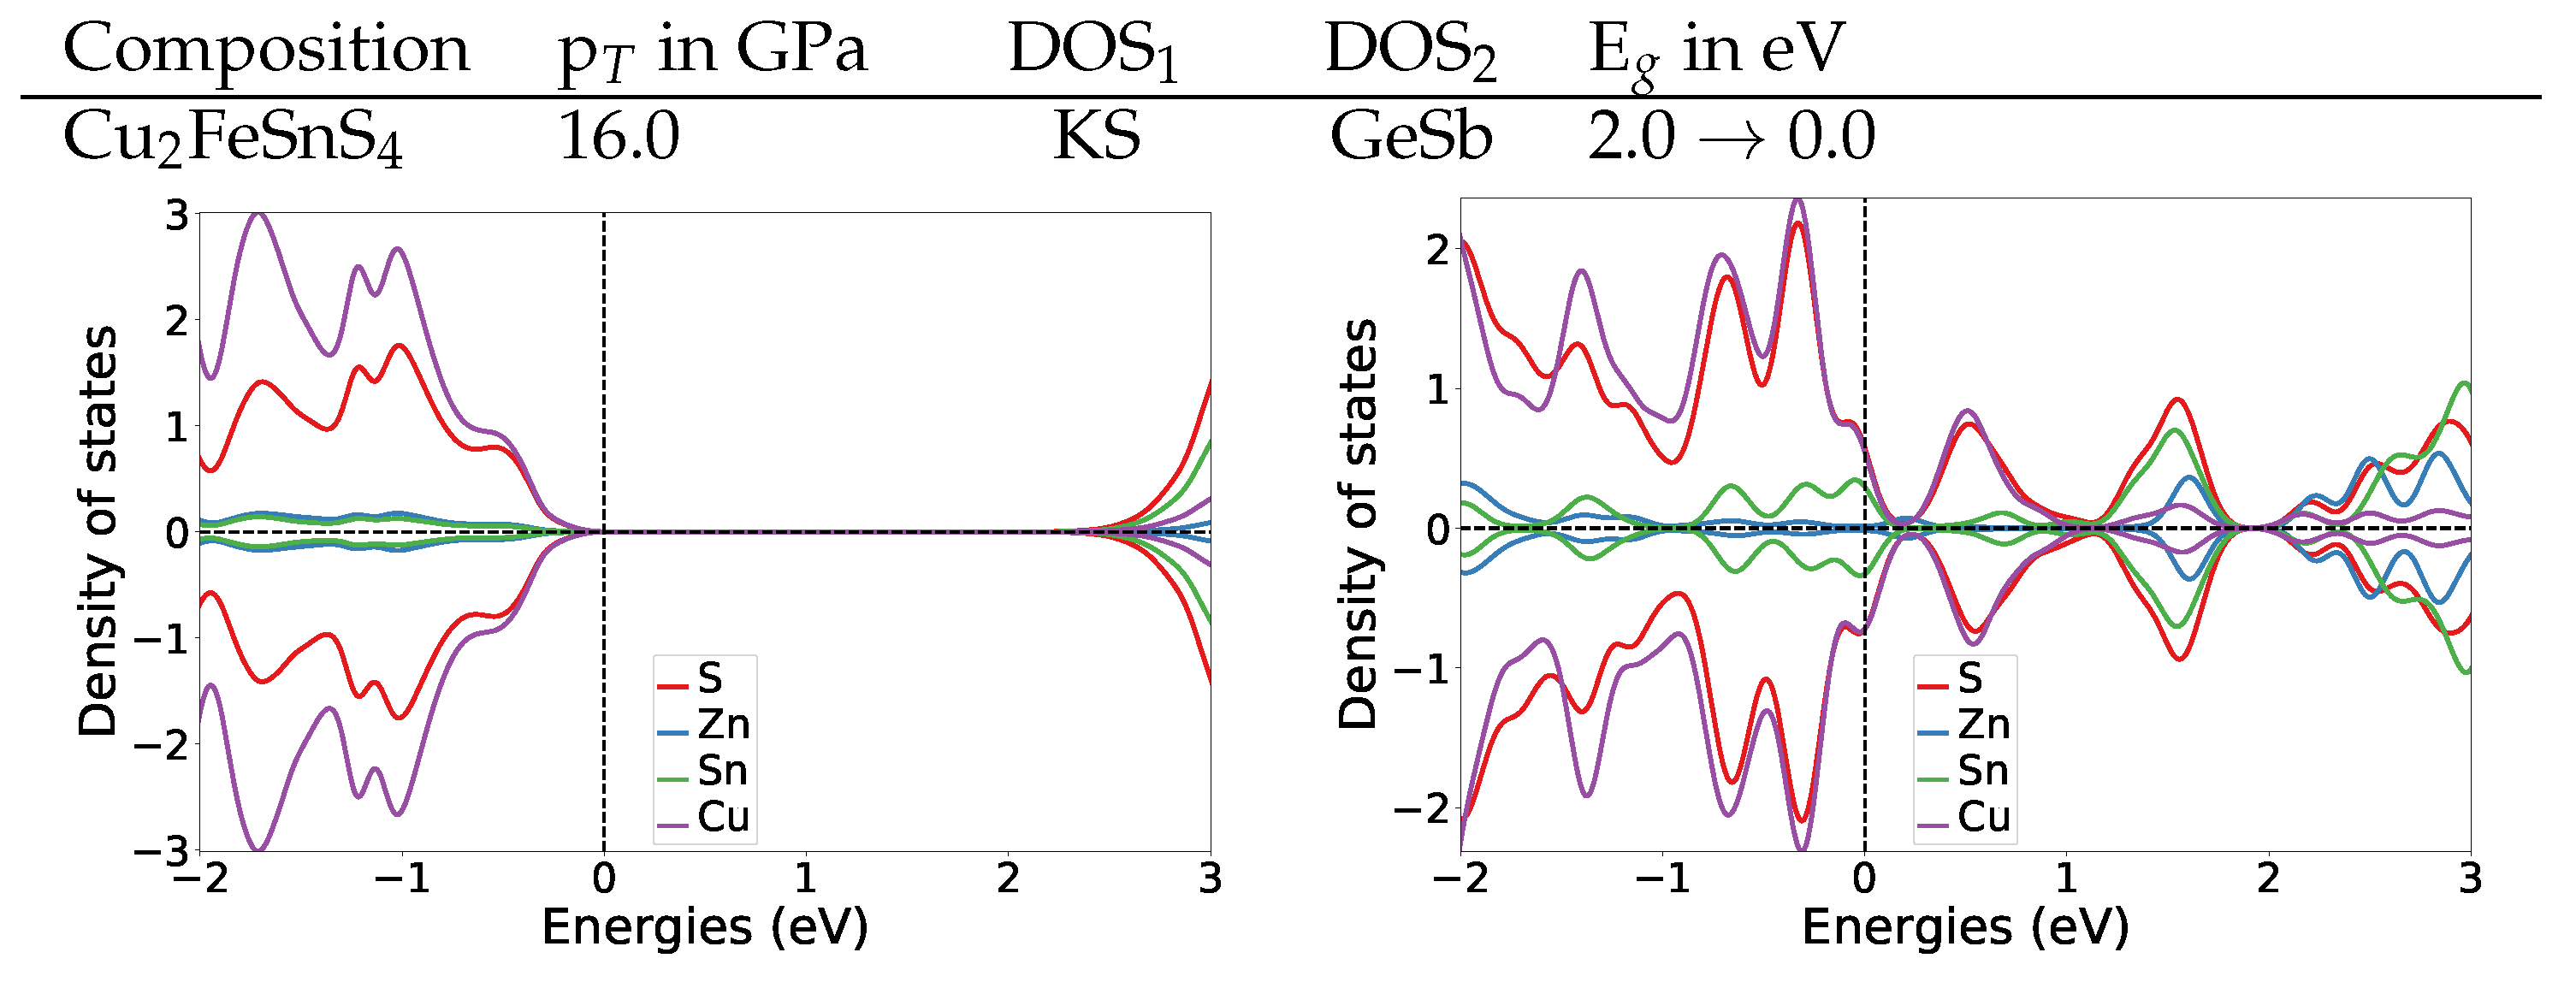
Both materials show similar electronic structure changes at the transition pressure as Cu2ZnSnS4, which changes from semi-conducting to metallic at 16 GPa (for details see Appendix A.4.2).

3.4. Mechanical Properties

Finally we want to analyse how the bulk modulus changes due to the phase transitions in the magnetic materials Cu2FeSnS4 and Cu2MnSnS4 and compare to Cu2ZnSnS4. In the used equation of states the equilibrium volume, the bulk modulus and its pressure dependence are fit parameters.
First of all it strikes that regardless of the composition all tetragonal anti-ferromagnetic structures (KS, ST or P 4 ¯ ) have very similar bulk moduli ranging within 2 GPa around the value for Cu2ZnSnS4 KS (Table 5). The first derivative B 0 shows larger differences, the values for Cu2FeSnS4 and Cu2MnSnS4 are 7% and 10% lower than for the KS Cu2ZnSnS4 material. Without an error analysis we can not determine whether the differences in B 0 are significant. At zero pressure the P 4 ¯ (AM) structure of Cu2FeSnS4 has a higher bulk modulus than the ST (AM) structure, but at higher pressures eventually it flips due to the larger first derivative for the ST (AM) structure. If we compare the same structure ST(AM) for all three materials, the bulk modulus of Mn over Zn to Fe are slightly increasing, but only in a range where it would not be measurable experimentally.
All bulk moduli for the anti-ferromagnetic GeSb structures are in the range of 77.8–85.8 GPa, thus each about 15% larger than their tetragonal counterparts. In all cases the phase transition leads to stiffer materials. The bulk modulus of GeSb is smallest for Cu2MnSnS4 (AM), followed by Cu2ZnSnS4 and largest for Cu2FeSnS4 (AM). This is the same ordering we observe for the ST (AM) phases.

4. Conclusions

We calculated first principle enthalpies with PBE for different structural models for Cu2FeSnS4 and Cu2MnSnS4 to identify low and high-pressure modifications. Thereby, we probed ferromagnetic and anti-ferromagnetic phases.
In agreement with experimental findings, we found the anti-ferromagnetic P 4 ¯ structure to be the most stable for Cu2FeSnS4 at ambient pressure. We additionally confirmed that the naturally occurring ST (AM) is nearly as stable until the following transition. At 16.3 GPa, we predict a structural transition to the anti-ferromagnetic GeSb structure, thereby, the coordination number of the metal ions changes from 4 to 6. The structural transition is accompanied by a change of the electronic structure from semi-conducting to metallic. At 23.0 GPa, we found a magnetic phase transition from anti-ferromagnetic to ferromagnetic, the electronic structure remains metallic.
Due to the deficits of the used density functional, we failed to identify the correct equilibrium structure for Cu2MnSnS4. All possible low pressure phases are in a small energy window, and PBE predicts the KS (AM) structure as most stable. Experimental data and HSE06 optimisations indicate that anti-ferromagnetic ST structure is present under ambient conditions. At the HS06 level the difference is only 15 meV per unit cell [32], and also at the PBE level the difference is small (under 50 meV over the whole pressure range). All four-fold coordinated anti-ferromagnetic structures show a structural and magnetic phase transition to GeSb (FM) around 12 GPa. This transition also leads to a change of the electronic structure from semi-conducting to metallic.
The results for both materials are similar to our findings for Cu2ZnSnS4, where we observe a KS-to-GeSb transition around 16 GPa [6]. Also in Cu2ZnSnS4 this transition leads to a change of the electronic structure from semi-conducting to metallic. Only taking into account the band gaps and the predicted transition pressures, we conclude that the magnetic material Cu2FeSnS4 is similarly suited for the use in thin film solar cells as Cu2ZnSnS4. Cu2MnSnS4 also has a band gap in the desired range for a solar cell absorber but is less resistant against tensile stress than Cu2ZnSnS4 and Cu2FeSnS4.

Author Contributions

Conceptualization, E.M.H., B.P. and T.K.; methodology, T.K.; investigation, M.G. and T.K.; writing—original draft preparation, T.K.; writing—review and editing, E.M.H., B.P. and T.K.; supervision, B.P. All authors have read and agreed to the published version of the manuscript.

Funding

This research was funded by Deutsche Forschungsgemeinschaft (DFG) grant number PA1360/14-1 (Beate Paulus) and LE781/19-1 (Martin Lerch, TU Berlin).

Acknowledgments

The authors acknowledge the North-German Supercomputing Alliance (HLRN) for providing HPC (high performance computing) resources that have contributed to the research results reported in this paper. Financial support from International MaxPlanck Research School (IMPRS) Functional Interfaces in Physics and Chemistry is gratefully acknowledged. We thank Martin Lerch (TU Berlin) and Ilias Efthymiopoulos (GFZ Potsdam) for useful discussion.

Conflicts of Interest

The authors declare no conflict of interest.

Abbreviations

The following abbreviations are used in this manuscript:
DFTdensity functional theory
KSkesterite
STstannite
AManti-ferromagnetic
FMferromagnetic
XRDx-ray diffraction
DOSdensity of states

Appendix A.

Appendix A.1. Equilibrium Optimisations

To understand why PBE predicts the correct stability of the equilibrium structures for Cu2FeSnS4 but not for Cu2MnSnS4 we calculated the Bader charges [37] at the PBE (fully optimised) and HSE06 level (only single point calculation on top of PBE structure) for anti-ferromagnetic KS and ST (Table A3).
We can see that for both materials and structures PBE assigns about 0.2 e less electron density than HSE06 to Fe or Mn ions. If we look closer we can see that the difference for Mn is slightly smaller than for Fe. It is −0.16 and −0.17 e for KS and ST respectively, while it is −0.19 e for Fe in KS and ST. That means that in PBE the charge is a little more smeared out with reference to the HSE06 charge in Cu2MnSnS4 compared to Cu2FeSnS4. We suspect that this is the reason for the stabilisation of KS over ST at the PBE level.
Table A1. Optimized lattice parameter a and c (in Å) for Cu2FeSnS4 for the listed structural (Struc.) models and magnetic (Mag.) phases at the PBE level of theory. μ Fe refers to the magnitude of the magnetic moment at Fe (in μ B ) and E tot denotes the total energy (in eV). For GeSb and P 4 ¯ the lenght of 2c is listed for better comparison.
Struc.Mag.ac μ Fe E tot
KSAM5.41710.9433.1−77.507740
KSFM5.42410.9303.1−77.490464
STAM5.47110.6953.1−77.607942
STFM5.46710.7243.1−77.547627
GeSbAM5.16010.2203.3−73.495692
GeSbFM5.15210.2143.3−73.336453
P 4 ¯ AM5.4695.3463.1−77.629895
P 4 ¯ FM5.4695.3653.1−77.478290
Table A2. Optimized lattice parameter a and c (in Å) for Cu2MnSnS4 for the listed structural (Struc.) models and magnetic (Mag.) phases at the PBE level of theory. μ Mn refers to the magnitude of the magnetic moment at Mn (in μ B ) and E tot denotes the total energy (in eV). For GeSb and P 4 ¯ the lenght of 2c is listed for better comparison.
Struc.Mag.ac μ Mn E tot
KSAM5.46811.0204.1−80.227182
KSFM5.47711.0004.2−80.188168
STAM5.49810.8954.1−80.192347
STFM5.50410.8804.1−80.178549
GeSbAM5.21210.2574.2−76.819659
GeSbFM5.21910.2334.2−76.844830
P 4 ¯ AM5.50410.8754.1−80.175182
P 4 ¯ FM5.50910.8694.1−80.139990
Table A3. Bader charges for B = Fe or Mn (in e ) the listed anti-ferromagnetic Cu2BSnS4 structures at the PBE and HSE06 level.
StrucQ PBE (Fe)Q HSE 06 (Fe)Q PBE (Mn)Q HSE 06 (Mn)
KS0.861.051.021.18
ST0.861.051.021.19

Appendix A.2. Volume Scan Data

Table A4. Optimized lattice parameter a and c (in Å) for Cu2FeSnS4 for the listed structural (Struc.) models and magnetic (Mag.) phases with the given volume V (in Å 3 ) at the PBE level of theory. μ Fe refers to the magnitude of the magnetic moment at Fe (in μ B ) and E tot denotes the total energy (in eV). For GeSb and P 4 ¯ the lenght of 2c is listed for better comparison.
Struc.Mag.Vac μ Fe E tot
KSFM2524.96210.2362.1−72.500085
KSFM2564.98710.2922.3−73.162308
KSFM2645.07410.2532.6−74.310555
KSFM2725.13010.3352.7−75.241648
KSFM2805.18010.4352.8−75.971945
KSFM2885.22910.5322.9−76.533331
KSFM2965.27810.6243.0−76.951155
KSFM3045.32310.7283.0−77.238280
KSFM3125.37010.8203.1−77.411308
KSFM3205.41510.9133.1−77.485911
KSFM3285.45911.0073.2−77.474309
KSAM2524.83510.7802.1−72.534384
KSAM2564.92210.5682.4−73.180529
KSAM2645.04110.3912.6−74.330969
KSAM2725.09710.4692.7−75.270313
KSAM2805.14910.5602.8−76.010711
KSAM2885.20510.6292.9−76.576505
KSAM2965.26010.6992.9−76.990092
KSAM3045.31310.7683.0−77.271416
KSAM3125.36310.8493.0−77.438253
KSAM3205.40910.9363.1−77.506327
KSAM3285.45111.0413.1−77.488117
STFM2525.2419.1732.3−72.677371
STFM2565.2159.4142.4−73.327281
STFM2645.1999.7672.6−74.465043
STFM2725.2229.9752.6−75.378350
STFM2805.26610.0992.7−76.096158
STFM2885.29810.2602.8−76.646269
STFM2965.34410.3662.9−77.050457
STFM3045.38210.4943.0−77.323902
STFM3125.42010.6213.0−77.484475
STFM3205.46510.7163.1−77.547280
STFM3285.50610.8183.1−77.524008
STAM2525.2349.1992.5−72.705087
STAM2565.1759.5582.5−73.368579
STAM2645.1949.7872.6−74.519354
STAM2725.2209.9832.7−75.443729
STAM2805.26610.0982.8−76.170060
STAM2885.30210.2452.9−76.722183
STAM2965.34310.3702.9−77.123752
STAM3045.38310.4933.0−77.394100
STAM3125.42610.5963.0−77.551400
STAM3205.47010.6953.1−77.608948
STAM3285.51110.8003.1−77.581690
GeSbFM1844.5149.0291.1−59.042973
GeSbFM1924.5809.1531.4−62.359016
GeSbFM2004.6429.2801.9−65.031484
GeSbFM2084.7029.4082.2−67.212811
GeSbFM2164.7609.5342.4−68.932449
GeSbFM2244.8209.6442.6−70.279432
GeSbFM2324.8849.7272.8−71.334858
GeSbFM2404.9429.8272.9−72.126728
GeSbFM2484.9989.9283.0−72.691063
GeSbFM2565.05010.0393.1−73.063012
GeSbFM2645.10610.1283.2−73.270306
GeSbFM2725.15810.2223.3−73.338263
GeSbFM2805.21110.3133.3−73.289486
GeSbAM1844.5119.0410.8−58.970006
GeSbAM1924.5719.1881.3−62.263692
GeSbAM2004.6339.3171.9−64.937380
GeSbAM2084.6939.4442.2−67.109096
GeSbAM2164.7569.5502.6−68.847037
GeSbAM2244.8199.6442.8−70.264357
GeSbAM2324.8799.7453.0−71.369644
GeSbAM2404.9349.8573.0−72.199768
GeSbAM2484.9919.9573.1−72.793709
GeSbAM2565.04510.0573.2−73.188975
GeSbAM2645.10210.1423.2−73.414898
GeSbAM2725.16010.2143.3−73.497756
GeSbAM2805.21710.2873.3−73.458151
P 4 ¯ FM2565.1709.5762.5−73.146081
P 4 ¯ FM2645.1749.8632.6−74.308897
P 4 ¯ FM2725.20810.0292.7−75.241113
P 4 ¯ FM2805.24610.1742.8−75.976529
P 4 ¯ FM2885.29910.2562.9−76.542992
P 4 ¯ FM2965.33710.3903.0−76.958577
P 4 ¯ FM3045.37910.5083.0−77.240473
P 4 ¯ FM3125.41910.6253.1−77.408891
P 4 ¯ FM3205.46410.7203.1−77.476946
P 4 ¯ FM3285.50010.8453.2−77.458815
P 4 ¯ AM2565.1809.5412.5−73.413979
P 4 ¯ AM2645.1959.7812.6−74.558793
P 4 ¯ AM2725.2329.9352.7−75.479036
P 4 ¯ AM2805.26810.0892.8−76.200728
P 4 ¯ AM2885.30810.2222.8−76.750054
P 4 ¯ AM2965.34610.3562.9−77.149666
P 4 ¯ AM3045.38710.4753.0−77.417917
P 4 ¯ AM3125.42810.5893.0−77.573576
P 4 ¯ AM3205.47110.6923.1−77.630834
P 4 ¯ AM3285.51310.7933.1−77.602124
Table A5. Optimized lattice parameter a and c (in Å) for Cu2MnSnS4 for the listed structural (Struc.) models and magnetic (Mag.) phases with the given volume V (in Å 3 ) at the PBE level of theory. μ Mn refers to the magnitude of the magnetic moment at Mn (in μ B ) and E tot denotes the total energy (in eV). For GeSb and P 4 ¯ the lenght of 2c is listed for better comparison.
Struc.Mag.Vac μ Fe E tot
KSFM2645.03810.4013.7−75.971271
KSFM2725.10510.4363.8−77.081763
KSFM2805.16410.4993.9−77.981251
KSFM2885.23010.5293.9−78.694907
KSFM2965.26910.6604.0−79.244321
KSFM3045.32410.7244.0−79.651541
KSFM3125.37310.8074.1−79.933439
KSFM3205.41910.8964.1−80.106005
KSFM3285.46410.9844.2−80.182458
KSFM3365.50711.0784.2−80.175399
KSFM3445.55211.1614.2−80.094993
KSAM2645.07410.2533.7−76.056793
KSAM2725.11610.3913.8−77.168405
KSAM2805.16410.5013.8−78.063375
KSAM2885.22210.5603.9−78.770453
KSAM2965.27310.6454.0−79.313325
KSAM3045.32110.7374.0−79.712814
KSAM3125.36810.8274.0−79.987024
KSAM3205.41410.9164.1−80.152623
KSAM3285.46011.0044.1−80.223251
KSAM3365.50411.0924.2−80.211358
KSAM3445.54811.1764.2−80.127053
STFM2645.2219.6863.5−76.055292
STFM2725.2379.9193.6−77.136314
STFM2805.25510.1413.8−78.020462
STFM2885.27610.3463.8−78.723375
STFM2965.32010.4593.9−79.262214
STFM3045.36510.5634.0−79.659735
STFM3125.40910.6624.0−79.933493
STFM3205.45110.7684.1−80.100813
STFM3285.49510.8624.1−80.174170
STFM3365.53910.9534.2−80.164939
STFM3445.58211.0424.2−80.082896
STAM2645.2149.7103.6−76.028974
STAM2725.20510.0393.7−77.121388
STAM2805.21610.2923.8−78.012122
STAM2885.26410.3943.9−78.721774
STAM2965.31210.4914.0−79.267491
STAM3045.35910.5864.0−79.669937
STAM3125.40410.6844.1−79.947016
STAM3205.44910.7794.1−80.115031
STAM3285.49110.8804.1−80.187778
STAM3365.53610.9634.2−80.177580
STAM3445.57911.0534.2−80.094369
GeSbFM2164.7679.5043.4−71.302760
GeSbFM2244.8269.6173.6−72.849469
GeSbFM2324.8859.7233.8−74.086520
GeSbFM2404.9439.8233.9−75.037627
GeSbFM2485.0019.9154.0−75.752127
GeSbFM2565.05810.0074.1−76.266470
GeSbFM2645.11910.0764.2−76.604701
GeSbFM2725.17710.1504.2−76.791058
GeSbFM2805.23210.2304.2−76.845649
GeSbFM2885.28710.3044.3−76.787515
GeSbFM2965.34810.3504.3−76.637821
GeSbAM2164.7719.4913.4−71.231957
GeSbAM2244.8299.6073.6−72.776707
GeSbAM2324.8879.7163.8−74.008456
GeSbAM2404.9469.8103.9−74.965658
GeSbAM2485.0049.9024.0−75.695172
GeSbAM2565.0619.9944.1−76.222902
GeSbAM2645.11410.0954.2−76.569615
GeSbAM2725.17010.1764.2−76.761513
GeSbAM2805.22710.2464.2−76.821969
GeSbAM2885.28010.3324.3−76.771277
GeSbAM2965.33510.3984.3−76.624795
P 4 ¯ FM2645.2879.4453.6−75.981567
P 4 ¯ FM2725.2639.8213.7−77.068527
P 4 ¯ FM2805.26510.1033.8−77.962110
P 4 ¯ FM2885.29210.2853.9−78.671028
P 4 ¯ FM2965.32210.4523.9−79.215593
P 4 ¯ FM3045.36510.5614.0−79.617279
P 4 ¯ FM3125.41010.6614.0−79.894688
P 4 ¯ FM3205.45510.7554.1−80.062845
P 4 ¯ FM3285.49810.8494.1−80.135739
P 4 ¯ FM3365.54310.9384.2−80.126035
P 4 ¯ FM3445.58411.0324.2−80.043805
P 4 ¯ AM2645.2399.6193.6−76.054431
P 4 ¯ AM2725.20310.0463.7−77.135339
P 4 ¯ AM2805.24310.1883.8−78.020440
P 4 ¯ AM2885.27310.3603.9−78.724283
P 4 ¯ AM2965.33210.4114.0−79.265565
P 4 ¯ AM3045.36310.5684.0−79.664384
P 4 ¯ AM3125.40810.6684.0−79.937791
P 4 ¯ AM3205.45410.7584.1−80.102366
P 4 ¯ AM3285.49710.8544.1−80.171729
P 4 ¯ AM3365.54010.9474.2−80.158528
P 4 ¯ AM3445.58311.0354.2−80.072614

Appendix A.3. Birch–Murnaghan EoS (Equation of State) Fits

Third-order Birch–Murnaghan isothermal equation of state: [22]
E ( V ) = E 0 + 9 V 0 B 0 16 V 0 V 2 3 1 3 B 0 + V 0 V 2 3 1 2 6 4 V 0 V 2 3 .
E 0 denotes the energy per unit cell at zero pressure, B 0 the bulk modulus at zero pressure, V 0 the reference volume at zero pressure; B 0 , pressure derivative of the bulk modulus at zero pressure. The corresponding Birch–Murnaghan pressure function can be calculated as follows:
P ( V ) = δ E δ V S P ( V ) = 3 B 0 2 V 0 V 7 3 V 0 V 5 3 1 + 3 4 ( B 0 4 ) V 0 V 2 3 1 .
Table A6. Fitted parameter for the Birch–Murnaghan EoS for Cu2FeSnS4 for the listed structural models (Struc.) with the given magentic phase (Mag.). E 0 (in eV): energy per unit cell at zero pressure, B 0 (in GPa): bulk modulus at zero pressure, V 0 / Z (in Å 3 ): reference volume per f.u. at equilibrium and B 0 (in GPa/m 3 ): pressure derivative of the bulk modulus at zero pressure. The fit data refers to two formula units.
Struc.Mag. E 0 V 0 / Z B 0 B 0
KSFM−77.491344322.7267.4564.185
KSAM−77.510909321.5971.8263.847
STFM−77.549611321.5568.4904.149
STAM−77.611052321.0669.2444.275
GeSbFM−73.339910272.5180.3844.250
GeSbAM−73.502836273.0185.7723.838
P 4 ¯ FM−77.480718322.0868.5114.269
P 4 ¯ AM−77.632049321.0868.3214.379
Table A7. Fitted parameter for the Birch–Murnaghan EoS for Cu2MnSnS4 for the listed structural models (Struc.) with the given magentic phase (Mag.). E 0 (in eV): energy per unit cell at zero pressure, B 0 (in GPa): bulk modulus at zero pressure, V 0 / Z (in Å 3 ): reference volume per f.u. at equilibrium and B 0 (in GPa/m 3 ): pressure derivative of the bulk modulus at zero pressure. The fit data refers to two formula units.
Struc.Mag. E 0 V 0 / Z B 0 B 0
KSFM−80.189890331.2166.3944.314
KSAM−80.228539330.7165.7674.498
STFM−80.181139330.9166.0904.222
STAM−80.195264330.8167.2474.162
P 4 ¯ FM−80.143613330.8567.1364.158
P 4 ¯ AM−80.178661330.5067.6424.090
GeSbFM−76.846699279.7979.1784.059
GeSbAM−76.825978280.2180.4913.832

Appendix A.4. Electronic Structures

Appendix A.4.1. Equilibrium DOS

If we compare the equilibrium DOS plots for anti-ferromagnetic ST Cu2FeSnS4 and anti-ferromagnetic KS Cu2MnSnS4 to their Cu2ZnSnS4 counterparts (Figure A1) we can see that the differences are small in the total DOS. In all three materials the valence band is dominated by the Cu 3d and S 3p bands. In the magnetic materials additionally the 3d bands of Fe and Mn contribute significantly to the valence band, but their DOS is much smaller than for Cu and S bands. The conduction band for Cu2ZnSnS4 KS and ST is dominated by the Sn 5s and the S 3p bands. In Cu2FeSnS4 and Cu2MnSnS4 this also holds true. In the magnetic materials additionally the 3d bands of Fe and Mn contribute significantly to the conduction band. The DOS of the P 4 ¯ symmetric structure for Cu2FeSnS4 looks nearly identical to the ST (AM) DOS, which is not surprising because they have a very similar structure (same cationic layers).
Figure A1. DOS plots at zero pressure at the HSE06 level for the most stable Cu2FeSnS4 and Cu2MnSnS4 structures in comparison to Cu2ZnSnS4 [6] counterparts.
Crystals 11 00151 g0a1

Appendix A.4.2. Transition Pressure DOS

Comparing the DOS of both magnetic materials to their parent Cu2ZnSnS4 KS material DOS (Figure A3), we find that also in Cu2ZnSnS4 the former band gap region (0 to 2 eV) in GeSb consist of the same bands as the valence band. The most striking difference is that in Cu2ZnSnS4 GeSb the former band gap region has two dedicated peaks at 0.6 and 1.6 eV, while in the magnetic cases the DOS amplitude stays relatively constant throughout the whole band gap region.
Figure A2. DOS plots at the transition pressure at the HSE06 level for ST Cu2FeSnS4 and Cu2FeSnS4.
Crystals 11 00151 g0a2
Figure A3. DOS plots at the transition pressure at the HSE06 level for the listed pressure induced transitions for Cu2ZnSnS4 [6].
Crystals 11 00151 g0a3

Appendix A.4.3. Band Gaps

Table A8. Band gaps (E g in eV) for Cu2FeSnS4 for the listed structural (Struc.) models and magnetic (Mag.) phases with the given volume V (in Å 3 ) at the HSE06 level of theory. μ Fe refers to the magnitude of the magnetic moment at Fe (in μ B ) and E tot denotes the total energy (in eV).
Struc.Mag.VE g μ Fe E tot
KSFM3220.93.4−97.133326
KSAM3211.23.4−97.141564
STFM3210.93.4−97.167788
STAM3201.33.4−97.059621
GeSbFM2710.03.6−93.312877
GeSbAM2720.03.6−93.393502
P 4 ¯ FM3210.83.5−97.258338
P 4 ¯ AM3201.03.4−97.168055
P 4 ¯ AM2721.43.2−94.755077
GeSbAM2370.03.5−91.816612
GeSbAM2260.03.5−90.500725
GeSbFM2250.03.5−90.160584
Table A9. Band gaps (E g in eV) for Cu2MnSnS4 for the listed structural (Struc.) models and magnetic (Mag.) phases with the given volume V (in Å 3 ) at the HSE06 level of theory. μ Mn refers to the magnitude of the magnetic moment at Mn (in μ B ) and E tot denotes the total energy (in eV).
Struc.Mag.VE g μ Mn E tot
KSFM3301.04.4−101.542001
KSAM3291.34.4−101.528785
STFM3301.04.4−101.518509
STAM3291.14.4−101.529370
P 4 ¯ FM3300.84.4−101.449803
P 4 ¯ AM3291.04.4−101.490508
GeSbFM2790.04.6−97.670815
GeSbAM2790.04.5−97.702174
KSAM2881.64.3−99.895633
GeSbFM2480.04.5−96.648114
STAM2891.24.3−99.919608

References

  1. Katagiri, H.; Jimbo, K.; Maw, W.S.; Oishi, K.; Yamazaki, M.; Araki, H.; Takeuchi, A. Development of CZTS-based thin film solar cells. Thin Solid Films 2009, 517, 2455–2460. [Google Scholar] [CrossRef]
  2. Liu, X.; Feng, Y.; Cui, H.; Liu, F.; Hao, X.; Conibeer, G.; Mitzi, D.B.; Green, M. The current status and future prospects of kesterite solar cells: A brief review. Prog. Photovolt. Res. Appl. 2016, 24, 879–898. [Google Scholar] [CrossRef]
  3. Scragg, J.J.; Dale, P.J.; Peter, L.M.; Zoppi, G.; Forbes, I. New routes to sustainable photovoltaics: Evaluation of Cu2ZnSnS4 as an alternative absorber material. Phys. Stat. Sol. 2008, 245, 1772–1778. [Google Scholar] [CrossRef]
  4. Siebentritt, S.; Schorr, S. Kesterites-a challenging material for solar cells. Prog. Photovolt. Res. Appl. 2012, 20, 512–519. [Google Scholar] [CrossRef]
  5. Chen, S.; Gong, X.; Walsh, A.; Wei, S.H. Crystal and electronic band structure of Cu2ZnSnX4 (X = S and Se) photovoltaic absorbers: First-principles insights. Appl. Phys. Lett. 2009, 94, 041903. [Google Scholar] [CrossRef] [Green Version]
  6. Efthimiopoulos, I.; Küllmey, T.; Speziale, S.; Pakhomova, A.S.; Quennet, M.; Paulus, B.; Ritscher, A.; Lerch, M.; Koch-Müller, M. Pressure-induced structural and electronic transitions in kesterite-type Cu2ZnSnS4. J. Appl. Phys. 2018, 124, 085905. [Google Scholar] [CrossRef] [Green Version]
  7. Quennet, M.; Ritscher, A.; Lerch, M.; Paulus, B. The order-disorder transition in Cu2ZnSnS4: A theoretical and experimental study. J. Solid State Chem. 2017, 250, 140–144. [Google Scholar] [CrossRef]
  8. Kresse, G.; Hafner, J. Ab initiomolecular dynamics for liquid metals. Phys. Rev. B 1993, 47, 558–561. [Google Scholar] [CrossRef]
  9. Kresse, G.; Hafner, J. Ab initiomolecular-dynamics simulation of the Liquid–Metal—Amorphous—Semiconductor transition in germanium. Phys. Rev. B 1994, 49, 14251–14269. [Google Scholar] [CrossRef]
  10. Kresse, G.; Furthmüller, J. Efficient iterative schemes forab initiototal-energy calculations using a plane-wave basis set. Phys. Rev. B 1996, 54, 11169–11186. [Google Scholar] [CrossRef]
  11. Kresse, G.; Furthmüller, J. Efficiency of ab-initio total energy calculations for metals and semiconductors using a plane-wave basis set. Comput. Mater. Sci. 1996, 6, 15–50. [Google Scholar] [CrossRef]
  12. Blöchl, P. Projector augmented-wave method. Phys. Rev. B 1994, 50, 17953–17979. [Google Scholar] [CrossRef] [Green Version]
  13. Kresse, G.; Joubert, D. From ultrasoft pseudopotentials to the projector augmented-wave method. Phys. Rev. B 1999, 59, 1758–1775. [Google Scholar] [CrossRef]
  14. Press, W.H.; Flannery, B.P.; Teukolsky, S.A.; Vetterling, W.T.; Kramer, P.B. Numerical Recipes: The Art of Scientific Computing. Phys. Today 1987, 40, 120–122. [Google Scholar] [CrossRef]
  15. Monkhorst, H.J.; Pack, J.D. Special points for Brillouin-zone integrations. Phys. Rev. B 1976, 13, 5188–5192. [Google Scholar] [CrossRef]
  16. Perdew, J.P.; Burke, K.; Ernzerhof, M. Generalized Gradient Approximation Made Simple. Phys. Rev. Lett. 1996, 77, 3865–3868. [Google Scholar] [CrossRef] [Green Version]
  17. Heyd, J.; Scuseria, G.E.; Ernzerhof, M. Hybrid functionals based on a screened Coulomb potential. J. Chem. Phys. 2003, 118, 8207–8215. [Google Scholar] [CrossRef] [Green Version]
  18. Heyd, J.; Scuseria, G.E. Efficient hybrid density functional calculations in solids: Assessment of the Heyd–Scuseria–Ernzerhof screened Coulomb hybrid functional. J. Chem. Phys. 2004, 121, 1187–1192. [Google Scholar] [CrossRef] [Green Version]
  19. Heyd, J.; Scuseria, G.E.; Ernzerhof, M. Erratum: “Hybrid functionals based on a screened Coulomb potential” [J. Chem. Phys. 118, 8207 (2003)]. J. Chem. Phys. 2006, 124, 219906. [Google Scholar] [CrossRef] [Green Version]
  20. Krukau, A.V.; Vydrov, O.A.; Izmaylov, A.F.; Scuseria, G.E. Influence of the exchange screening parameter on the performance of screened hybrid functionals. J. Chem. Phys. 2006, 125, 224106. [Google Scholar] [CrossRef]
  21. Blöchl, P.E.; Jepsen, O.; Andersen, O. Improved tetrahedron method for Brillouin-zone integrations. Phys. Rev. B 1994, 49, 16223–16233. [Google Scholar] [CrossRef] [PubMed]
  22. Birch, F. Finite Elastic Strain of Cubic Crystals. Phys. Rev. 1947, 71, 809–824. [Google Scholar] [CrossRef]
  23. Schorr, S. The crystal structure of kesterite type compounds: A neutron and X-ray diffraction study. Sol. Energy Mater. Sol. Cells 2011, 95, 1482–1488. [Google Scholar] [CrossRef]
  24. Chen, S.; Walsh, A.; Luo, Y.; Yang, J.H.; Gong, X.G.; Wei, S.H. Wurtzite-derived polytypes of kesterite and stannite quaternary chalcogenide semiconductors. Phys. Rev. B Condens. Matter Mater. Phys. 2010, 82, 1–8. [Google Scholar] [CrossRef] [Green Version]
  25. Kissin, S.A. Reinvestigation of the stannite (Cu2FeSnS4)—Kesterite (Cu2ZnSnS4) pseudobinary system. Can. Mineral. 1989, 27 Pt 4, 689–697. [Google Scholar]
  26. Llanos, J.; Tapia, M.; Mujica, C.; Oró-Sole, J.; Gómez-Romero, P. A New Structural Modification of Stannite. Boletín la Soc. Chil. Química 2000, 45, 5–11. [Google Scholar] [CrossRef] [Green Version]
  27. Rincón, C.; Quintero, M.; Moreno, E.; Power, C.; Quintero, E.; Henao, J.A.; MacÍas, M.A.; Delgado, G.E.; Tovar, R.; Morocoima, M. X-ray diffraction, Raman spectrum and magnetic susceptibility of the magnetic semiconductor Cu2FeSnS4. Solid State Commun. 2011, 151, 947–951. [Google Scholar] [CrossRef]
  28. Brockway, L.O. The Crystal Structure of Stannite, Cu2FeSnS4. Z. Krist. Cryst. Mater. 1934, 89, 434–441. [Google Scholar] [CrossRef]
  29. Ganiel, U.; Hermon, E.; Shtrikman, S. Studies of magnetic ordering in Cu2FeSnS4 by Mössbauer spectroscopy. J. Phys. Chem. Solids 1972, 33, 1873–1878. [Google Scholar] [CrossRef]
  30. Springer, G. The pseudobinary system Cu2FeSnS4 -Cu2ZnSnS4 and its mineralogical significance. Can. Mineral. 1972, 11, 535–541. [Google Scholar]
  31. Fries, T.; Shapira, Y.; Palacio, F.; Morón, M.C. Magnetic ordering of the antiferromagnet from magnetization and neutron-scattering measurements. Phys. Rev. B Condens. Matter Mater. Phys. 1997, 56, 5424–5431. [Google Scholar] [CrossRef] [Green Version]
  32. Rudisch, K.; Espinosa-García, W.F.; Osorio-Guillén, J.M.; Araujo, C.M.; Platzer-Björkman, C.; Scragg, J.J. Structural and Electronic Properties of Cu2MnSnS4 from Experiment and First-Principles Calculations. Phys. Status Solidi Basic Res. 2019, 256, 1–10. [Google Scholar] [CrossRef]
  33. Fumi, F.G.; Tosi, M.P. Ionic sizes and born repulsive parameters in the NaCl-type alkali halides-I. The Huggins-Mayer and Pauling forms. J. Phys. Chem. Solids 1964, 25, 31–43. [Google Scholar] [CrossRef]
  34. Shannon, R.D. Revised effective ionic radii and systematic studies of interatomic distances in halides and chalcogenides. Acta Crystallogr. Sect. A 1976, 32, 751–767. [Google Scholar] [CrossRef]
  35. Prabhakar, R.R.; Zhenghua, S.; Xin, Z.; Baikie, T.; Woei, L.S.; Shukla, S.; Batabyal, S.K.; Gunawan, O.; Wong, L.H. Photovoltaic effect in earth abundant solution processed Cu2MnSnS4 and Cu2MnSn(S,Se)4 thin films. Sol. Energy Mater. Sol. Cells 2016, 157, 867–873. [Google Scholar] [CrossRef]
  36. Quennet, M. First Principles Calculations for the Semiconductor Material Kesterite Cu2ZnSnS4 and Se-containing Derivatives. Ph.D. Thesis, Freie Universität Berlin, Berlin, Germany, 2016. [Google Scholar]
  37. Tang, W.; Sanville, E.; Henkelman, G. A grid-based Bader analysis algorithm without lattice bias. J. Phys. Condens. Matter 2009, 21. [Google Scholar] [CrossRef]
Figure 1. Structural models for the unit cell of (a) Kesterite (KS, I 4 ¯ ), (b) Stannite (ST, I 4 ¯ 2 m ), (c) GeSb ( P 4 / m m m ) and (d) P 4 ¯ structure. Bronze: Cu, pink: Fe/Mn, grey: Sn and yellow: S. For the GeSb and the P 4 ¯ structure we utilise two unit cells (stacked along the c axis), so that the number of atoms matches the KS/ST unit cell we use in the calculation.
Crystals 11 00151 g001
Figure 2. (a) The calculated enthalpies of Cu2FeSnS4 P 4 ¯ , ST, KS and GeSb structural models as a function of pressure. Because the enthalpy differences are very small we plot the (b) relative enthalpy with reference to most stable low pressure structure P 4 ¯ on the right. The top plot shows all low pressure structures, the bottom plot the high pressure GeSb structure. The insert in the bottom shows the energy difference of the FM to the AM structure for GeSb. For the anti-ferromagnetic structures, we use solid lines and for the ferromagnetic structures we us dash dotted lines.
Crystals 11 00151 g002
Figure 3. (a) The calculated enthalpies of Cu2MnSnS4 KS, ST, P 4 ¯ and GeSb structural models as a function of pressure. Because the enthalpy differences are very small we plot the (b) relative enthalpy with reference to most stable low pressure KS structure on the right. The top plot shows all low pressure structures, the bottom plot the high pressure GeSb structure. The insert in the bottom shows the energy difference of the FM to the AM structure for GeSb. For the anti-ferromagnetic structures we use solid lines and for the ferromagnetic structures we use dash dotted lines.
Crystals 11 00151 g003
Figure 4. DOS plots at the transition pressure at the HSE06 level for the listed pressure induced transitions for Cu2FeSnS4 and Cu2MnSnS4.
Crystals 11 00151 g004
Table 1. Optimized lattice parameter a and c (in Å) for Cu2FeSnS4 ST P 4 ¯ and KS at the PBE level of theory in comparison to experimental (exp.) lattice parameter. The first column refers to the magnetic phase, Δ E denotes the energy difference to the most stable phase (in meV) and μ Fe refers to the magnitude of the magnetic moment at Fe (in  μ B ).
Mag.ST P 4 ¯ KSMethod
a c μ Fe Δ E a c μ Fe Δ E Δ E
AM5.47110.6953.1225.4695.3463.10122PBE
FM5.46710.7243.1825.4695.3653.1152139PBE
AM5.46010.742 5.4335.410 Exp. [27,29]
Table 2. Optimized lattice parameter a and c (in Å) for Cu2MnSnS4 KS, ST and P 4 ¯ at the PBE level of theory in comparison to other simulated and experimental (exp.) lattice parameter. The first column refers to the magnetic phase, Δ E denotes the energy difference to the most stable phase (in meV) and μ Mn refers to the magnitude of the magnetic moment at Mn (in μ B ).
Mag.STKS P 4 ¯ Method
a c μ Mn Δ E a c μ Mn Δ E Δ E
AM5.49810.8954.1355.46811.0204.1052PBE
FM5.50410.8804.1495.47711.0004.23987PBE
AM5.40710.6784.0375.36910.8324.00 PBEsol [32]
AM5.51910.7954.505.46811.0384.415 HSE06 [32]
AM5.51710.806 Exp. [31]
Table 3. Predicted transitions for Cu2FeSnS4 and Cu2MnSnS4 in comparison to experimental transition for Cu2ZnSnS4. The table contains the transition pressure ( p T in GPa) with the corresponding cell volumina before ( V 1 in Å 3 ) and after ( V 2 in Å 3 ) the transition, Δ V denotes the relative volume change. All volumina refer to two formula units.
Composition p T Transition V 1 V 2 Δ V
Cu2FeSnS416.3 P 4 ¯ (AM) → GeSb(AM)272236−13.1%
Cu2FeSnS423.0GeSb(AM) → GeSb(FM)226225−0.6%
Cu2MnSnS412.1KS(AM) → GeSb(FM)289248−14.0%
Cu2ZnSnS4 [6]16.0KS → GeSb280240−15.2%
Table 4. Calculated HSE06 band gaps (in eV) for Cu2FeSnS4 and Cu2MnSnS4 for KS and ST strucutral models (struc.) in comparison to experimental (exp.) results. For DOS plots please refer to Appendix A.4.1.
CompositionStruc.AMFMExp. (AM)
Cu2FeSnS4 P 4 ¯ 1.00.8-
Cu2FeSnS4ST1.30.91.6 eV [35]
Cu2MnSnS4KS1.31.0-
Cu2MnSnS4ST1.11.01.42–1.79 eV [32]
Table 5. PBE bulk modulus ( B 0 in GPa) and first derivative ( B 0 in GPa/m 3 ) for the listed structural models (Struc.) with the given magentic phase (Mag.) for the listed compositions. Derived from the Birch–Murnaghan EoS fit. For all fit paramters please refer to Appendix A.3.
CompositionStruc. (Mag.) B 0 B 0
Cu2FeSnS4 P 4 ¯ (AM)68.324.38
Cu2FeSnS4ST (AM)69.244.27
Cu2FeSnS4GeSb (AM)85.773.84
Cu2FeSnS4GeSb (FM)80.384.25
Cu2MnSnS4ST (AM)67.254.16
Cu2MnSnS4GeSb (AM)80.493.83
Cu2ZnSnS4 [6]KS68.634.64
Cu2ZnSnS4 [6]ST68.774.64
Cu2ZnSnS4 [6]GeSb82.164.57
Publisher’s Note: MDPI stays neutral with regard to jurisdictional claims in published maps and institutional affiliations.

