Article

Transformation of SnS Nanocompisites to Sn and S Nanoparticles during Lithiation

1
EVE Energy Co., Ltd., Huizhou 516006, China
2
Department of Chemistry, Chiang Mai University, Chiang Mai 50200, Thailand
3
Institute of New Energy, Fudan University, Shanghai 200438, China
4
Mechanical and Aerospace Engineering, University of Florida, Gainesville, FL 36211, USA
*
Author to whom correspondence should be addressed.
Crystals 2021, 11(2), 145; https://doi.org/10.3390/cryst11020145
Submission received: 27 December 2020 / Revised: 21 January 2021 / Accepted: 23 January 2021 / Published: 29 January 2021
(This article belongs to the Special Issue Crystal Plasticity at Micro- and Nano-scale Dimensions)

Abstract

:
SnS nanomaterials have a high initial capacity of 1000 mAh g−1; however, this cannot be retained throughout electrochemical cycling. The present study provides insight into this capacity decay by examining the effect that Li intercalation has on SnS “nanoflowers” attached on carbon substrates’ such as artificial graphite. Scanning and transmission electron microscopy reveal that lithiation of such materials disrupts their initial morphology and produces free-standing Sn and SnS nanoparticles that dissolve in the electrolyte and disperse uniformly over the entire electrode surface. As a result, the SnS is rendered inactive after initial cycling and contributes to the formation of the solid electrolyte interface layer, resulting in continuous capacity decay during long term cycling. This is the first study that illustrates the morphological effects that the conversion mechanism has on SnS anodes. In order to fully utilize SnS materials, it is necessary to isolate them from the electrolyte by fully encapsulating them in a matrix.

1. Introduction

The present study aims to understand the capacity degradation that occurs in SnS nanomaterials in terms of the morphological changes they undergo during Li-ion insertion. Sn has attracted significant attention for its use as an anode in Li-ion batteries, since it allows for a theoretical specific capacity that is over 990 mAh g−1 [1]. This is approximately three times the capacity of commercially used graphitic anodes (372 mAh g−1) [2]. Despite its promising electrochemical performance, upon the formation of Li alloys, Sn suffers from severe volume expansions as high as 298%, which result in fracture of the Sn and delamination from the electrode. This leads to a loss of material that can host Li, and a rapid capacity decay occurs after several charge–discharge cycles. In order to alleviate high volume expansions, Sn is rarely used in its pure form, but is rather used as an oxide (SnO2) or as an alloy (such as SnSb and SnS) [1,3,4,5]. To further increase mechanical stability, the size of the Sn-based particles is reduced to the nanoscale [6,7] and they are embedded or attached on a carbon-based matrix, since it can buffer and constrain the volume expansion.
The maximum initial capacity of Sn or SnO2 cannot exceed 990 mAh g−1; however, that of SnS anodes is greater than 1000 mAh g−1. Despite this, the initial capacity of SnS anodes significantly decreases during cycling, as is the case for all Sn-based materials. For example, SnS nanoparticles (5–6 nm) embedded in a carbon matrix [5] experienced a capacity loss of ~500 mAh g−1 after 40 cycles, while SnS single phase alloy anodes in the form of microflakes showed an initial capacity of 1085 mAh g−1, which dropped to ~550 mAh g−1 after 45 cycles [8].
The capacity drop observed during the first cycle has been attributed to the conversion reaction that gives rise to the formation of Li2S [5,9], which forms irreversibly upon initial lithiation. The resulting microstructure is, therefore, Sn particles in a Li2S matrix, and with continuous lithiation/delithiation, LixSn alloys form reversibly. The mechanisms that give rise to the continuous capacity fade over long term cycling have not been explored.
A detailed examination of the microstructural changes that occur during the conversion and alloying reactions of SnS electrodes has not been performed. However, based on the severe fracture observed for Sn/C and SnO2/C nanocomposites during cycling [10], it is of interest to examine whether mechanical instability can be correlated to the capacity decay of SnS. Hence, the present article focuses on the long term cycling performance of SnS/C nanomaterials and captures the effect that conversion and alloying reactions have on the microstructure by performing transmission and scanning electron microscopy before and after cycling. The particular microstructure considered is that of a flower-like nanoscale SnS alloy attached to graphite. The motivation for using such structures is that their thin petal structure is not dense and could accommodate the volume expansion of Sn. Such flower-type active materials have not been cycled before, and although similar SnS microstructures have recently been fabricated [11], they were significantly larger and their “flower petals” were much denser.
In order to examine the effect of the carbon substrate in SnS/C, both artificial graphite and microcarbon microbeads were used as the matrix, while the SnS content was varied by allowing the precursor compounds in solution to be either 10% or 20% by weight. Although the nanoflower-like SnS materials used here have not been examined as electrodes before, the purpose of this article is not to propose a promising SnS/C electrode (since SnS cannot compare to the promising high-capacity Si-based anodes), but to provide insight as to why SnS materials cannot retain their initial high capacity of over 1000 mAh g−1, and interpret their capacity fade in terms of their microstructural changes.

2. Materials and Methods

2.1. Fabrication

The SnS/C nanopowders were fabricated using either artificial graphite (AG) or microcarbon microbeads (MCMB) as the matrix, as both have very good electrochemical properties [12]. Both MCMB and AG were purchased, rather than being synthesized in the lab.
The synthesis of the composite SnS/C materials was carried out using electroless deposition, similar to the processes reported in [13]. SnCl2∙2H2O (99.9%, Fluka, Charlotte, NC, USA) and NH2CSNH2 (99.0%, Merck, Kenilworth, NJ, USA) were used as the metal ion precursors, while AG or MCMB were used as the carbon precursors. The metal ion precursors were refluxed with the carbon in 100mL ethylene glycol (99.9%, J.T. Baker, Radnor, PA, USA) at 200 °C for 8 h. The precipitate obtained was collected by centrifugation and washed using ethanol. Finally, the product was dried at 70 °C for 2 h to obtain the final powders.
In order to evaluate the effect of SnS content on the electrochemical performance, two different amounts (10% or 20%) of SnS were considered. For the case of 10%Sn10%S/C (abbreviated as 10SnS/C), the solution contained the inorganic materials in the proportion of 0.1 g Sn atoms and 0.1 g S atoms for every 0.8 g C atoms. Similarly, for the 20%Sn20%S/C (abbreviated as 20SnS/C), the solution contained 0.2 g Sn atoms and 0.2 g S atoms for every 0.6 g C atoms.

2.2. Electrochemical Cycling

Electrochemical tests were performed using a CR2016-type coin cell that employed lithium foil as the counter electrode. The working electrode was fabricated by creating a slurry from 85% active material (which was the newly fabricated SnS/C), 5% super P carbon black, and 10% polyvinylidene fluoride (PVDF), and then coating it on a copper foil, which was the current collector.
The coin cells were assembled in an argon-filled glove box (Mikarouna, Superstar 1220/750/900) with 1 M LiPF6 solution with ethylene carbonate–diethyl carbonate (EC–DEC = 1:1, v/v) as the electrolyte and Celgard 2300 as the separator. The galvanostatic charge–discharge tests were performed in a battery test system (Land CT2001A, Wuhan Jinnuo Electronic Co., Ltd., China) at a constant current density of 50 mA g−1 in the potential range from 0 to 2.5 V. Finally, electrochemical impedance spectroscopy (EIS) of the Sn/C anodes was conducted through a potentiostat/galvanostat system (Autolab PGSTAT302N, Riverview, FL, USA).

2.3. Microstructure Analysis

The morphology and element analysis of the SnS/C materials before and after cycling was examined using a Hitachi S-4800 (Hitachi, Chiyoda City, Japan) field emission scanning electron microscope (FESEM) and a Philips CM200-FEG (Philips, Amsterdam, The Netherland) transmission electron microscope (TEM); both were equipped with electron dispersive spectroscopy (EDS). After cycling, the cells were opened in a fume hood and the working electrode was dipped in a 1:1 by volume mixture of ethylene carbonate (EC) and dimethyl carbonate (DMC) for 30 s to remove electrolyte residue, and was then dried using argon. Powders were then scraped onto (i) a piece of conductive carbon tape that was placed on a standard FESEM sample holder, and (ii) a TEM carbon lacy grid, which was then placed in the TEM. X-ray diffraction (XRD) was performed using a Philips X’Pert MPD diffractometer (Philips, Amsterdam, The Netherland).

3. Results and Discussion

In this section, we present the microstructure and electrochemical performance of the SnS/C nanocomposites with two different SnS contents: 10SnS/C and 20SnS/C. Two C matrices were used, either artificial graphite (AG) or multicarbon–microbeats (MCMB). Both of these C matrices are considered promising for use in Li-ion batteries, and, thus, both were examined. A total of four samples were fabricated and tested: 10SnS/AG, 10SnS/MCMB, 20SnS/AG, and 20SnS/MCMB. First, the morphology of the new SnS/C nanocomposites is presented using FESEM and TEM, while the phases present are identified by employing selected area electron diffraction (SAED) and X-ray diffraction patterns. Then, long-term electrochemical cycling results are shown and the morphology is re-examined.

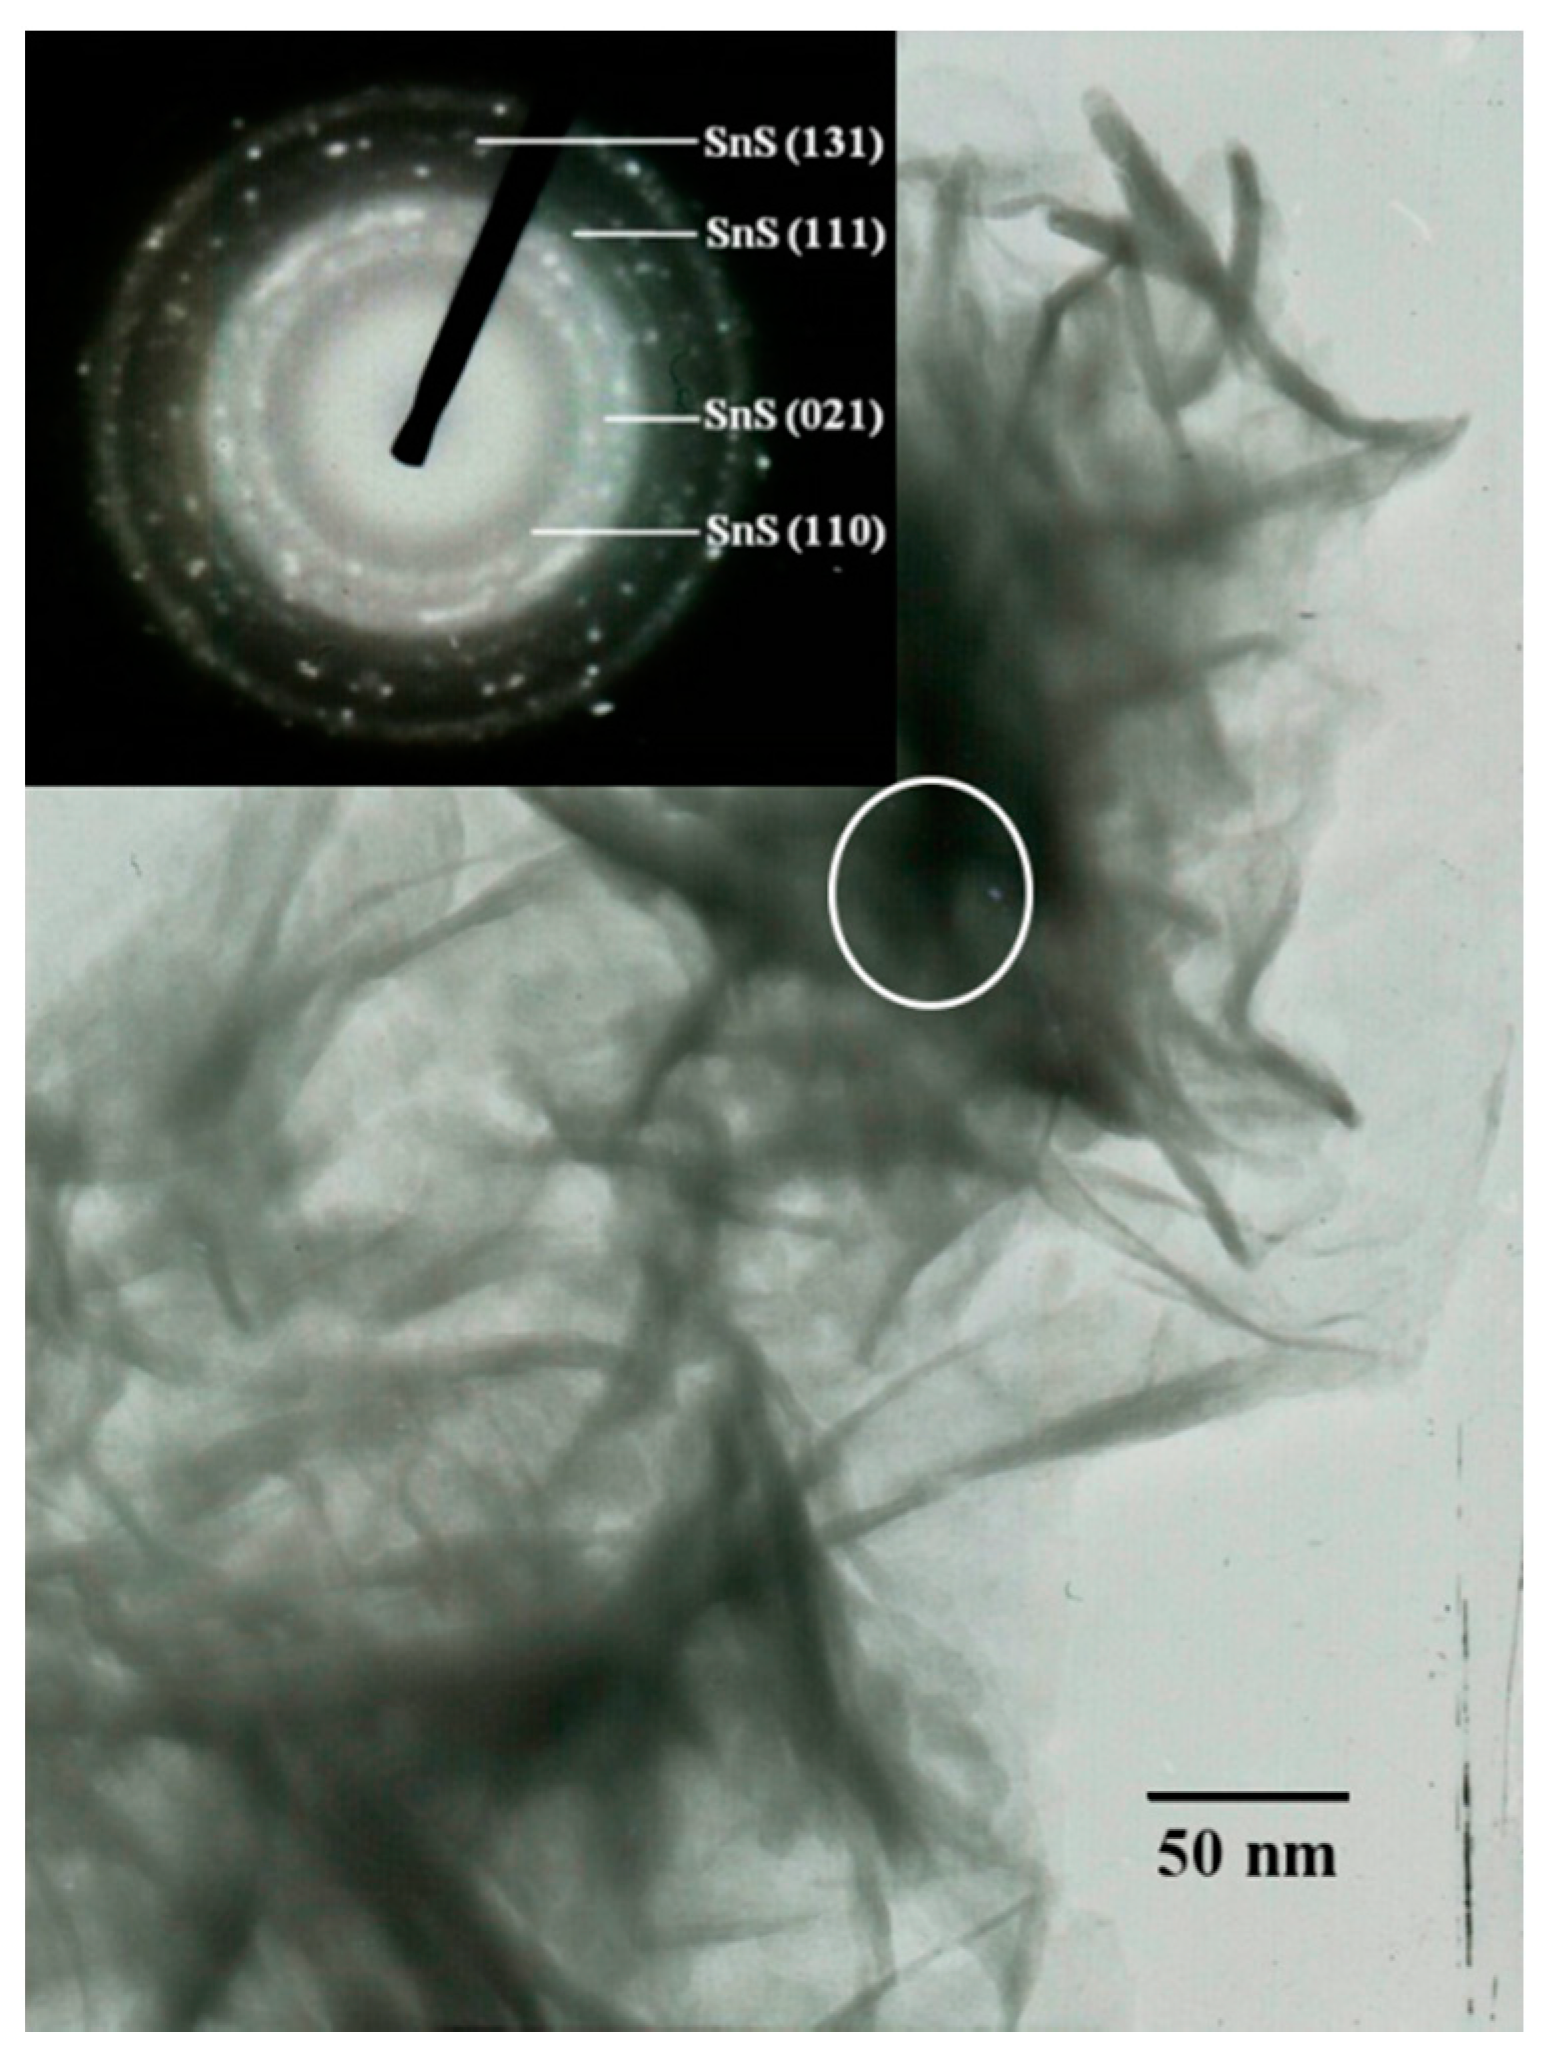
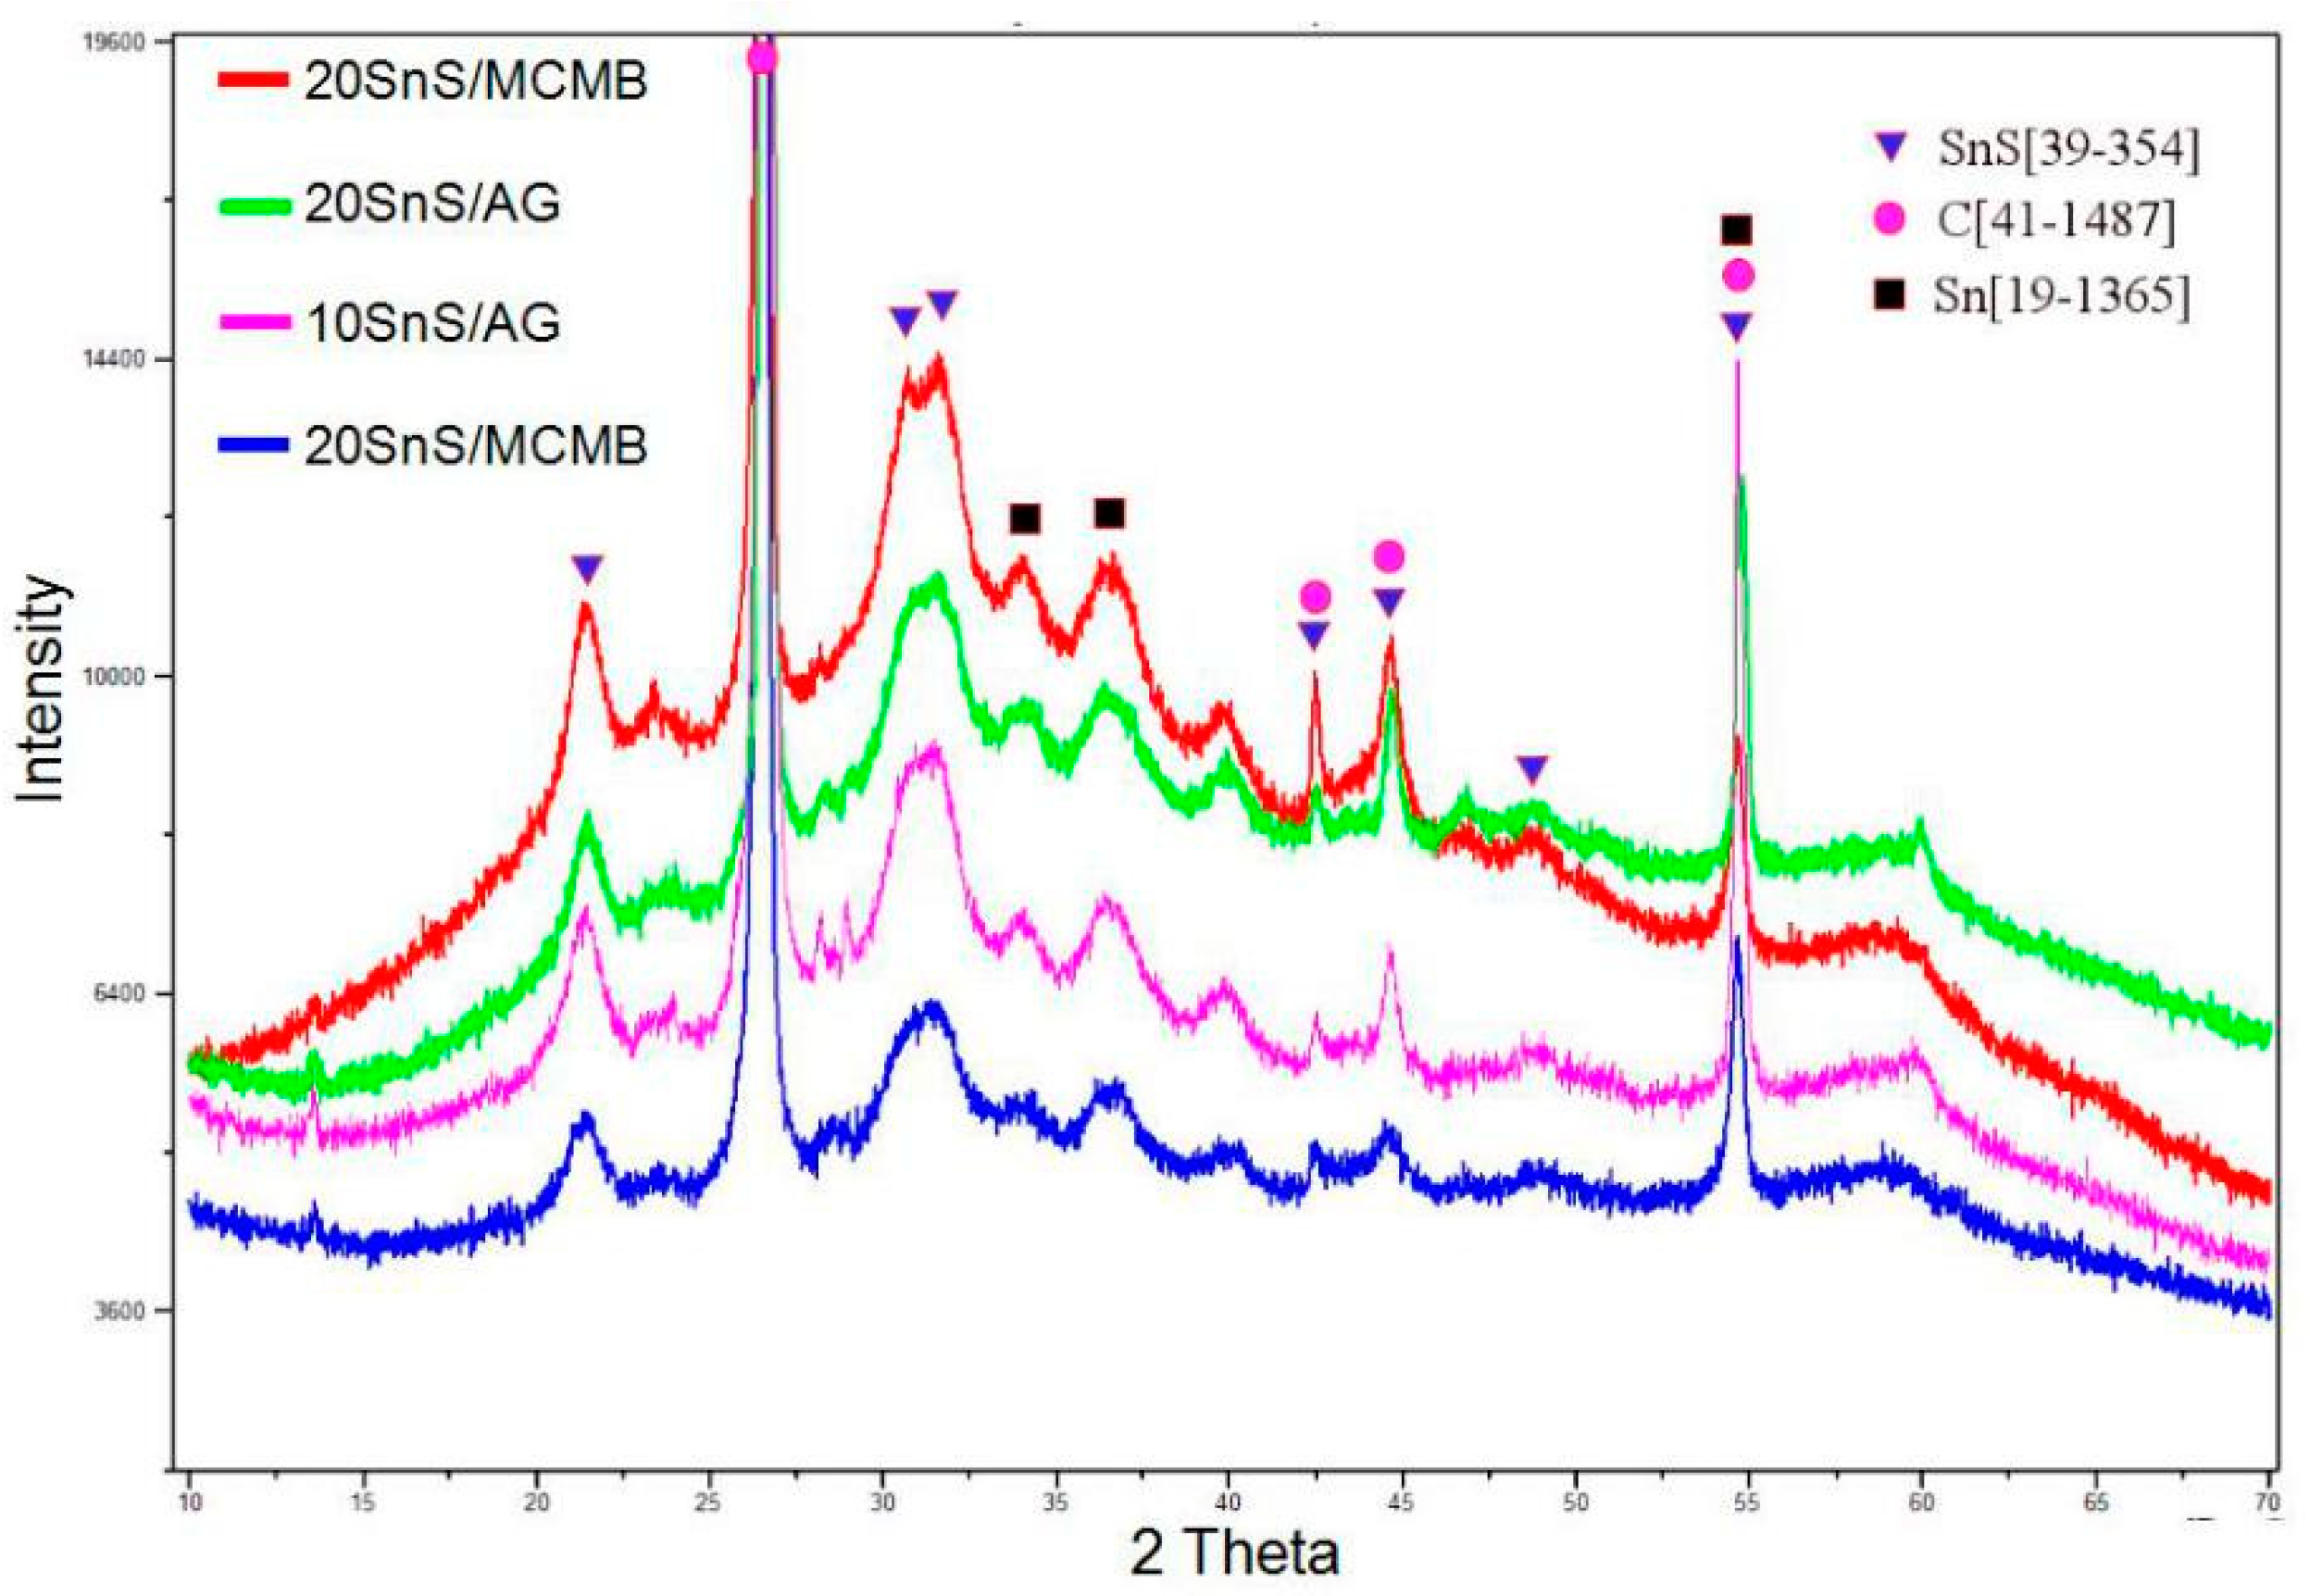
3.1. Microstructure Prior Electrochemical Cycling

In Figure 1 the FESEM images show that for all nanocomposites fabricated, the SnS particles had an open (flower-like) structure and were attached on the carbon powder (AG or MCMB) surfaces.
To determine the average particle size, 50 areas were imaged for each sample. In addition, EDS was also performed in order to determine the at% of the Sn and S. Table 1 presents the averaged semiquantitative EDS analysis, which indicates that the Sn and S at% was higher when MCMB was used as the precursor. The 10SnS/AG sample contained the lowest at% of active SnS material, as well as the smallest average particle size.
Performing TEM on the as prepared powders, as seen in Figure 2, indicated that the SnS particles consisted of multiple nanofiber/nanorod-like petals. Selected-area electron diffraction (SAED) conducted on the nanofibers indicated the presence of an SnS phase (JCPDS card #39-354 for SnS).
The formation of the SnS alloy was further verified by X-ray diffraction (XRD). In Figure 3, it is illustrated that all as prepared samples contained only C (JCPDS card #41-1487 for C) and SnS, while pure Sn or S phases were not present, which is consistent with the SAED results of Figure 2. Furthermore, using the Panalytical X’ Pert Plus software, the crystal size within the SnS flower-like particles before cycling was found to be ~10 nm.

3.2. Electrochemical Performance

Figure 4a presents the capacity of all samples when cycled against Li for 200 cycles. It is seen that in all cases the capacity faded continuously with cycling. The lower SnS content electrodes (10SnS/AG and 10SnS/MCMB) had an initial capacity of ~630 mAh g−1 that reduced to ~260 mAh g−1 after 120 cycles. This is approximately the capacity of the carbon bases (AG and MCMB) used to support the SnS. The higher SnS content samples (20SnS/AG and 20SnS/MCMB) showed a higher initial capacity of over 700 mAh g−1, but a greater capacity decrease during cycling, which reached 100 mAh g−1 after 120 cycles.
The capacity fade shown in Figure 4a is consistent with the decay observed in [5,8], where after 45–50 cycles the initial capacity (~1000 mAh g−1) of SnS/C materials had decreased to half its original value. However, this study goes beyond previous studies, as it is the first to perform long term cycling for SnS/C materials. Particularly, Figure 4a indicates that, for low SnS contents (10%), the capacity drops to that of the graphite base, indicating that SnS may not be playing the role of an active material after initial cycling, while for higher SnS contents (20%), the capacity is much lower than that of both AG and MCMB after 200 cycles.
To better illustrate that, after long term cycling, the capacity of the SnS/C drops to that of pure carbon, the discharge curves at the 100th cycle for pure AG, 10SnS/AG, and 20SnS/AG are plotted together in Figure 4b. It can be observed that all three curves are in close proximity, indicating that the SnS ceased to partake in the reaction with continuous cycling. For comparison purposes, the 2nd discharge curves for the 10SnS/AG and pure AG anodes are also shown in Figure 4b, where it is clear that SnS contributes to the voltage capacity, as it is above the curves obtained after 100 cycles. It should be noted that the 2nd and 100th discharge curves coincide for pure AG and no distinction can be made between them in Figure 4b, which is consistent with the long term electrochemical stability of graphite. Further examination of Figure 4b indicates that the degradation of the voltage capacity curve during the 100th cycle is more severe for the 20SnS/AG material than for the 10SnS/AG material, which is consistent with the capacity fade seen in Figure 4a.

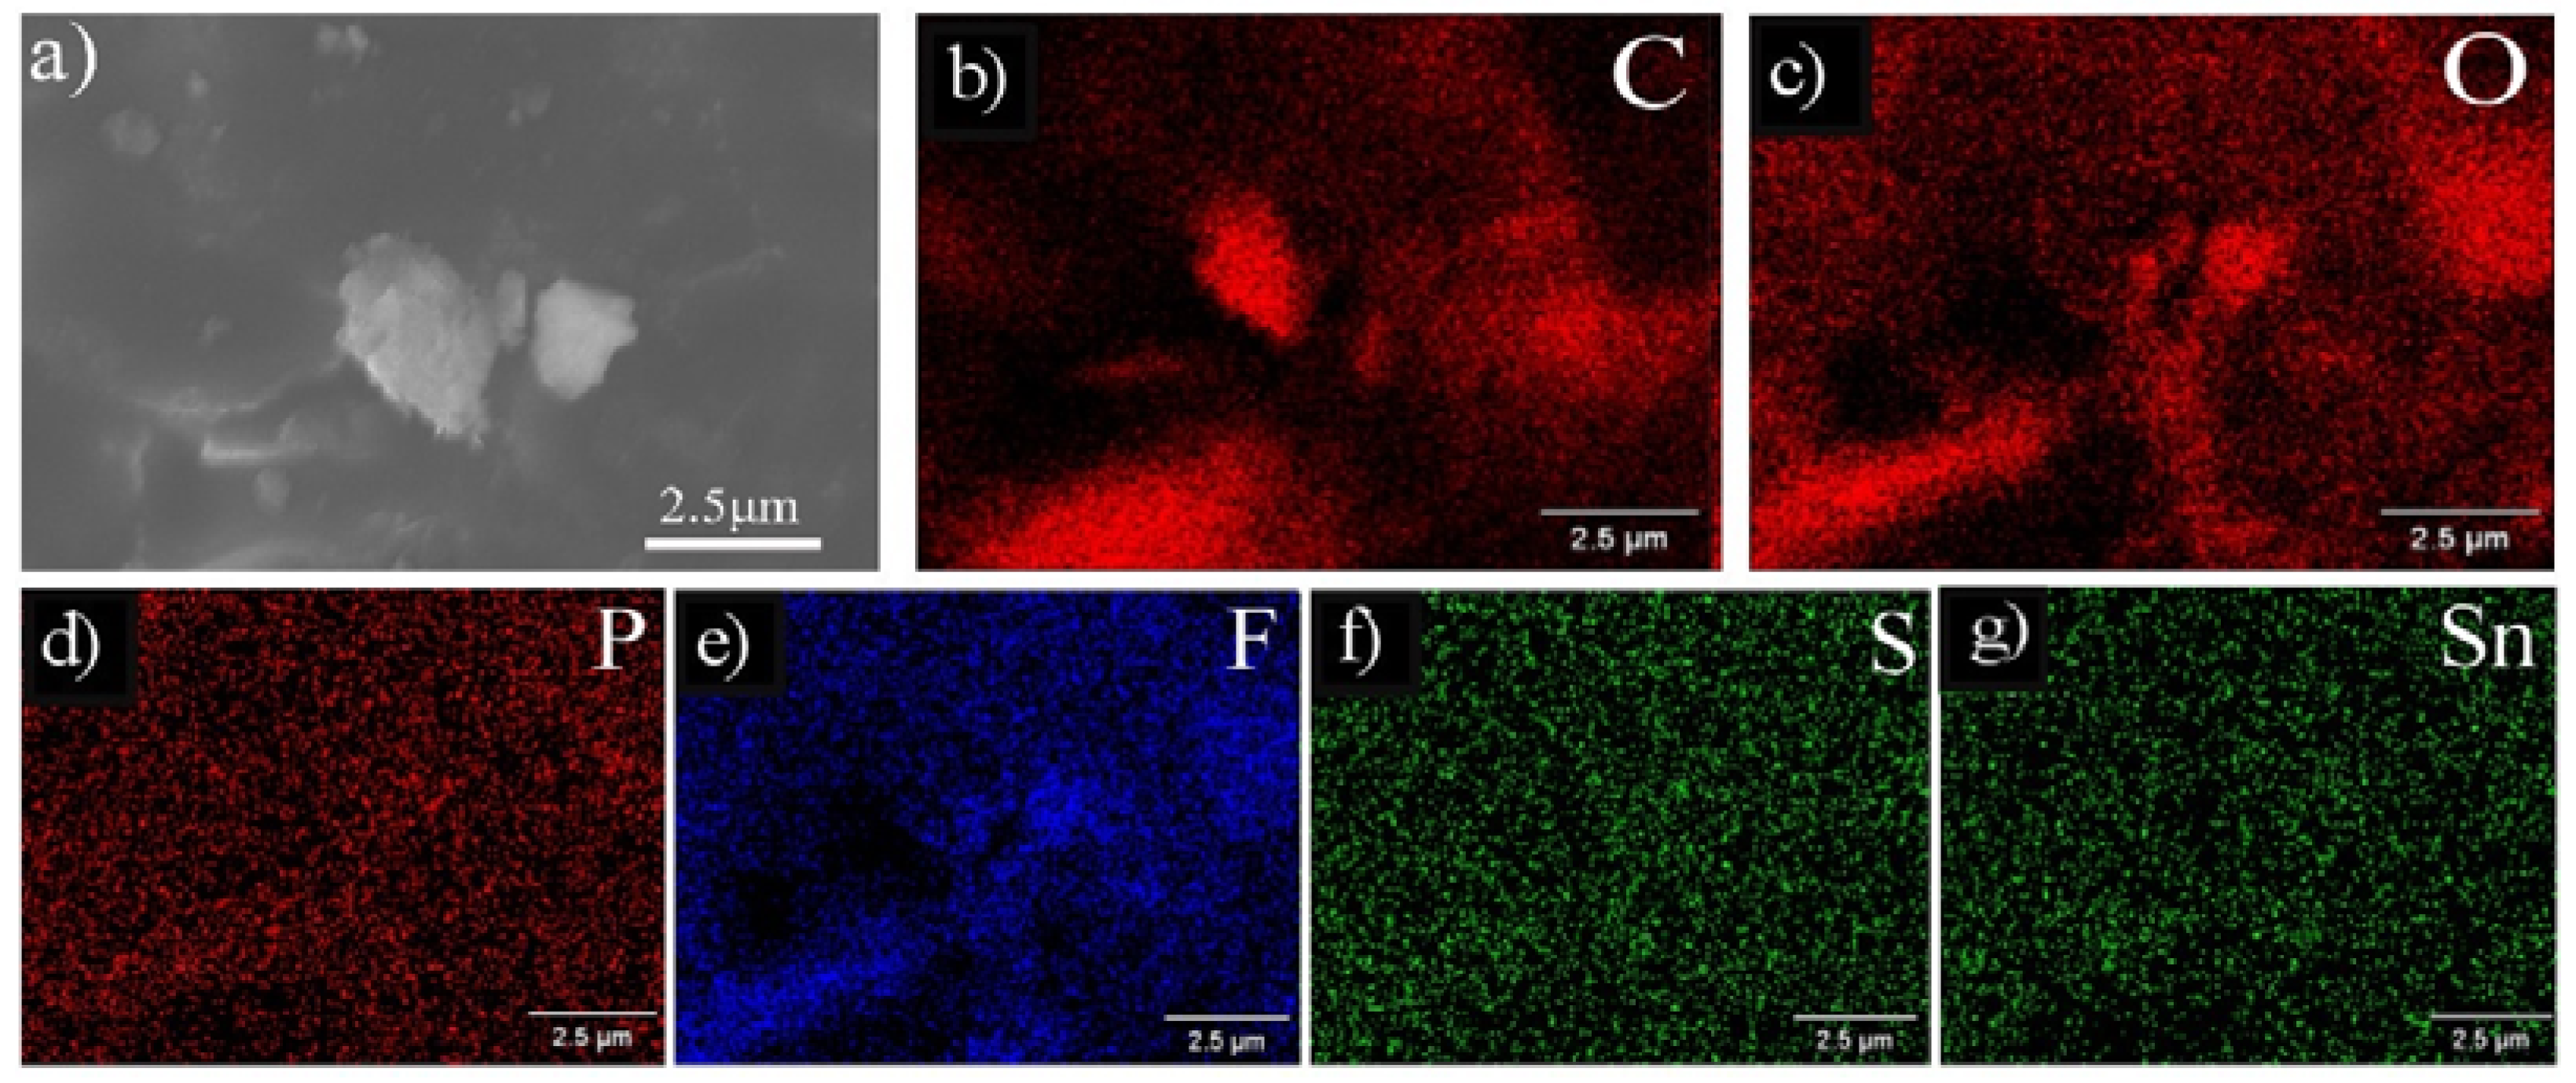
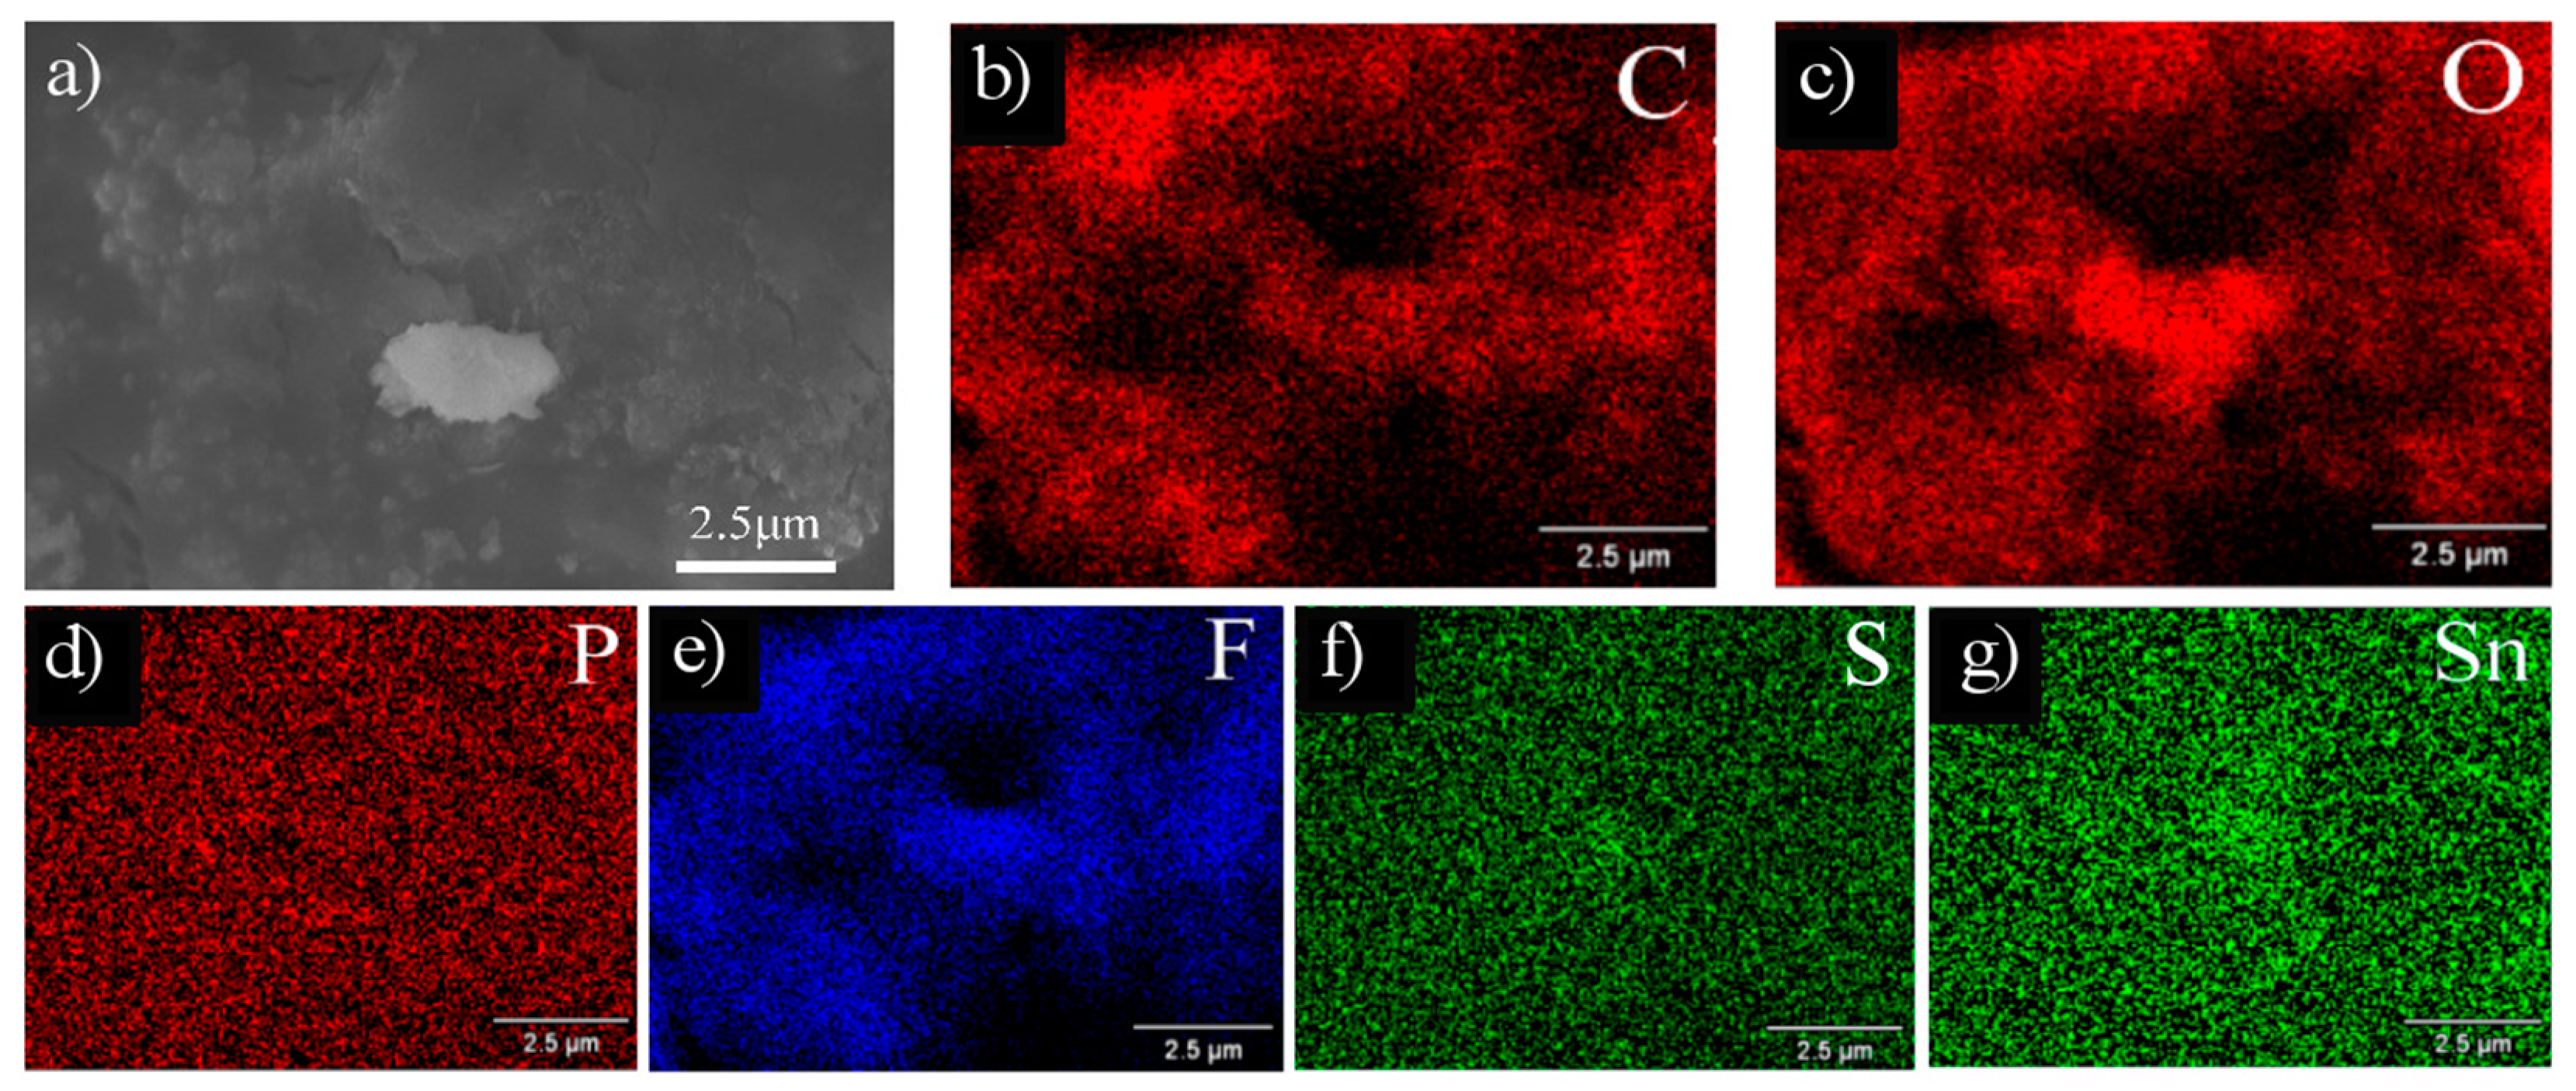
3.3. Microstructure after Cycling

To interpret the capacity fading observed in Figure 4, XRD and electron microscopy were performed on the anodes after the 200 cycles were completed. The XRD characterization of the SnS/C anodes after 200 cycles is shown in Figure 5, indicating that the Sn phase, in addition to SnS, was present, after cycling. Using the Panalytical X’ Pert Plus software, the grain size of the SnS alloy was estimated to be ~10 nm, which is the same as that of prior cycling, suggesting that crystal size was not affected by lithiation.
Figure 5 illustrates that pure Sn metal formed during the lithiation and delithiation process. This can occur because initial lithiation gives rise to the irreversible conversion reaction SnS + 2Li+ 2e→Sn + Li2S, by which Sn is dispersed in a Li2S matrix. Further lithiation forms Li–Sn alloys, which is a reversible process during the charge/discharge cycle. The lack of the Li2S phase in the XRD of Figure 5 may be explained by the following three possibilities: (i) Li2S is soluble in the electrolyte [14], (ii) it may be amorphous, or (iii) the crystal size is too small to be detected by XRD.
Although XRD has not been performed on cycled SnS anodes, these observations are consistent with those of XRD studies of SnS2 anodes [15], which reported the formation of metallic Sn during lithiation, as both conversion and alloying mechanisms occurred during the lithiation of SnS2. Furthermore, our conclusions are in accordance with detailed XRD studies for the first Li-ion insertion (but not deinsertion) in Sb2S3 electrodes [16], which showed that Sb2S3 underwent both a conversion reaction (forming a pure Sb phase) and an alloying reaction; however, neither Li–Sb nor Li–S was observed in XRD, which was attributed to them either being amorphous or having a very small crystal size.
As no other studies have examined the phases present upon complete Li deinsertion of SnS electrodes, high resolution TEM (HRTEM) was conducted on the cycled materials, as shown in Figure 6.
Comparing Figure 6 with the initial microstructure depicted in Figure 2 reveals that after cycling, the flower-like structure of the SnS particles was “destroyed”. The initial SnS nanofibers decomposed into nanoparticles that were 2–10 nm. Similarly, as the XRD indicated, the SAED patterns in Figure 6 documented the existence of pure Sn and SnS phases; however, no C rings were observed, even though the area considered contained a lighter phase region. This indicated that the light contrast region surrounding the nanoparticles (in Figure 6) was not the initial carbon particle substrate, but solid electrolyte interface (SEI) or electrolyte residue. This is verified by the representative EDS spectrum in Figure 6c that illustrates that the light shaded area of Figure 6a contained high contents of F, O, C, and P. This C would be from the binder and carbon additive of the electrode.
The TEM analysis thus illustrates that, during the Li insertion and deinsertion process, the SnS detached from the C substrate and dissolved into the electrolyte, getting dispersed within the inactive SEI layer. This is consistent with the continuous capacity fade, as the SnS that detached from the carbon could not store Li ions. Therefore, even though the addition of SnS seemed to benefit the performance of the AG and MCMB (as the initial capacity was high), it was actually a drawback, as with continuous cycling it dissolved in the electrolyte and resulted in a lower capacity than carbon materials.
To examine the extent by which this inactive SnS/Sn SEI layer formed, FESEM was performed on the cycled electrodes, as this method could depict a wider area than TEM. For all samples, the same microstructure was observed. Representative images are shown in Figure 7 for the 10SnS/AG and in Figure 8 for the 20SnS/MCMB. It can be seen that the initial flower-like structure was disrupted and large solid particles were present on the carbon surfaces. To better understand the composition throughout the anode, EDS mapping (Figure 7b–g and Figure 8b–g) was also performed. It is of particular interest to see that the micron size particles in Figure 7a and Figure 8a were not comprised of SnS, but had a high C and F content, indicating that it was part of the SEI. These results are in accordance with the TEM images, since the EDS mapping illustrated that, during Li insertion and deinsertion, the flower-like SnS particles reduced into nanoparticles covering the anode surface, as Figure 7g–f and Figure 8g–f illustrates.
Table 2 summarizes the EDS semiquantitative element analysis inside the micron particle of Figure 7a and outside the adjacent matrix, which again supports the conclusion that the SnS was distributed throughout the anode surface.
The high concentrations of F, O, C, and P (as seen in the EDS of Figure 7 and Figure 8), together with the observed free-standing SnS particles (as seen in the TEM images of Figure 6), suggest that the electrode surface was coated by an electrochemically inactive layer, which was comprised of Sn and SnS nanoparticles distributed throughout the SEI layer. Such an electrochemically inactive coating increases internal resistance, and the Sn trapped within could not host Li ions, explaining the capacity and voltage loss seen in Figure 4.
The anodes that contained higher contents of Sn and S (20SnS/AG and 20SnS/MCMB) would have a higher Sn and S content in the inactive layer, which would result in a higher internal resistance and greater capacity loss (as seen in Figure 4), as compared to that in the lower content SnS samples. Therefore, even though the addition of SnS on the C resulted in an initial increase in the capacity, the Sn and S dispersed into the electrolyte over continuous cycling, becoming part of the SEI layer and increasing the internal resistance of the cell. This conjecture was tested by comparing the impedance spectroscopy before and after 20 cycles for the 10SnS/AG and 20SnS/AG electrodes. In Figure 9 it can be seen that the impedance (i.e., interface/internal resistance) was higher for the 20SnS/AG sample, which supports the concept that SnS becomes chemically inactive, and the greater its content, the more negative its effects on electrochemical performance (as seen in Figure 4).
Hence, the better performance noted for the 10SnS/AG materials was due to the lower Sn and S content that could dissolve into the solid electrolyte interface layer and increase internal resistance. These results show that the conversion reaction and alloying that SnS undergoes during cycling result in the dispersion of Sn particles within the electrolyte and SEI layer. Therefore, even though the capacity is initially higher, in the long term, the addition of SnS nanoflowers on graphite increases the internal resistance and results in a capacity that is even lower than that of the carbon substrate. In order to produce efficient SnS/C nanocomposites, the SnS must be fully isolated from the electrolyte using a protective coating.

4. Conclusions

The present article provided significant insight into the underlying mechanisms that give rise to the capacity fade of SnS materials during cycling. Although it has been suggested that SnS undergoes a conversion mechanism upon lithiation, its morphological consequences have not been examined. The microscopy observations herein indicate that lithiation of SnS/C leads to the formation of free-standing Sn and SnS nanoparticles that are dispersed throughout the electrolyte/SEI layer on the electrode surface. As a result, the Sn and SnS become inactive and isolated from the current collector, leading to continuous capacity fade. The microstructural observations are in accordance with the electrochemical cycling results, which indicate that, after 120 cycles, the capacity had dropped to that of the pure carbon matrices, suggesting the SnS was not participating in the reactions. Furthermore, EIS showed that increasing the SnS content increased the interface resistance, as the content of Sn and SnS in the inactive layer increased. Hence, in order to commercialize SnS electrodes, which have the ability to offer a capacity greater than other Sn-based anodes, it is necessary to inhibit such dissolution of Sn and SnS into the electrolyte. Approaches similar to those followed for S–C electrodes (for Li–S batteries), which “trap” S in highly porous carbon substrates, may be appropriate [1]. However, the goal of the present study was to provide insight into the capacity fade of SnS, not fabricate a promising new anode.

Author Contributions

Conceptualization: K.A., T.S. and H.D.; methodology, K.A., T.S., A.Y. and H.D.; validation, K.A., H.D., T.S., A.Y. and T.H.; data curation, K.A., H.D., A.Y., T.S. and T.H.; writing—review and editing, K.A, H.D., A.Y. and T.S.; All authors have read and agreed to the published version of the manuscript.

Funding

This research was initially funded by K.A., A.Y., T.S., T.H., grant number ERC-MINATRAN 211166.

Institutional Review Board Statement

Not applicable.

Informed Consent Statement

Not applicable.

Acknowledgments

This work began with the support of ERC-MINATRAN 211166 (K.A., A.Y., T.S., T.H.). Many of the present results were included in the PhD thesis of H.D.

Conflicts of Interest

The authors declare no conflict of interest.

References

  1. Wang, Z.; Tian, W.; Li, X. Synthesis and Electrochemistry Properties of Sn-Sb Ultrafine Particles as Anode of Lithium-ion Batteries. J. Alloys Compd. 2007, 439, 350–354. [Google Scholar] [CrossRef]
  2. Fong, R.; von Sacken, U.; Dahn, J.R. Studies of Lithium Intercalation into Carbons Using Nonaqueous Electrochemical Cells. J. Electrochem. Soc. 1990, 137, 2009–2013. [Google Scholar] [CrossRef]
  3. Wang, K.; He, X.; Ren, J.; Wang, L.; Jiang, C.; Wan, C. Preparation of Sn2Sb alloy encapsulated carbon microsphere anode materials for Li-ion batteries by carbothermal reduction of the oxides. Electrochim. Acta 2006, 52, 1221–1225. [Google Scholar] [CrossRef]
  4. Li, Y.; Tu, J.P.; Huang, X.H.; Wu, H.M.; Yuan, Y.F. Nanoscale SnS with and without carbon-coating as an anode material for lithium ion batteries. Electrochim. Acta 2006, 52, 1383–1389. [Google Scholar] [CrossRef]
  5. Li, Y.; Tu, J.P.; Huang, X.H.; Wu, H.M.; Yuan, Y.F. Net-like SnS/carbon nanocomposite film anode material for lithium ion batteries. Electrochem. Commun. 2007, 9, 49–53. [Google Scholar] [CrossRef]
  6. Besenhard, J.O.; Yang, J.; Winter, M. Will advanced lithium-alloy anodes have a chance in lithium-ion batteries? J. Power Sources 1997, 68, 87–90. [Google Scholar] [CrossRef]
  7. Armstrong, R.W. Crystal Engineering for Mechanical Strength at Nano-Scale Dimensions. Crystals 2017, 7, 315. [Google Scholar] [CrossRef] [Green Version]
  8. Kumar, G.G.; Reddy, K.; Nahm, K.S.; Angulakshmi, N.; Stephan, A.M. Manuel Stephan, Synthesis and electrochemical properties of SnS as possible anode material for lithium batteries. J. Phys. Chem. Solids 2012, 73, 1187–1190. [Google Scholar] [CrossRef]
  9. Gou, X.; Chen, J.; Shen, P.W. Synthesis, characterization and application of SnSx (x = 1, 2) nanoparticles. Mat. Chem. Phys. 2005, 93, 557–566. [Google Scholar] [CrossRef]
  10. Aifantis, K.E.; Haycock, M.; Sanders, P.; Hackney, S.A. Fracture of nanostructured Sn/C anodes during Li-insertion. Mat. Sci. Eng. A 2011, 529, 55–61. [Google Scholar] [CrossRef]
  11. Cai, W.; Hu, J.; Zhao, T.; Yang, H.; Wang, J.; Xiang, W. Synthesis and characterization of nanoplate-based SnS microflowers via a simple solvothermal process with biomolecule assistance. Adv. Powder Technol. 2012, 23, 850–854. [Google Scholar] [CrossRef]
  12. Aifantis, K.E.; Huang, T.; Hackney, S.A.; Sarakonsri, T.; Yu, A. Capacity fade in Sn-C nanopowder anodes due to fracture. J. Power Sources 2012, 197, 246–252. [Google Scholar] [CrossRef] [PubMed] [Green Version]
  13. Adpakpang, K.; Sarakonsri, T.; Aifantis, K.E.; Hackney, S.A. Morphological study of SnSb/graphitecomposites influenced by different ratio of Sn:Sb. Rev. Adv. Mater. Sci. 2012, 32, 12–18. [Google Scholar]
  14. Liang, C.; Dudney, N.J.; Howe, J.Y. Hierarchically structured sulfur/carbon nanocomposite material for high-energy lithium battery. Chem. Mater. 2009, 21, 4724–4730. [Google Scholar] [CrossRef]
  15. Brousse, T.; Lee, S.M.; Pasquereau, L.; Defives, D.; Schleich, D.M. Composite negative electrodes for lithium ion cells. Solid State Ionics 1998, 115, 51–56. [Google Scholar] [CrossRef]
  16. Denis, Y.W.Y.; Hoster, H.E.; Batabyal, S.K. Bulk antimony sulfide with excellent cycle stability as next-generation anode for lithium-ion batteries. Sci. Rep. 2014, 4, 4562–4567. [Google Scholar]
Figure 1. The field emission scanning electron microscope (FESEM) images of the new as prepared samples, before lithiation: (a) the 10SnS/artificial graphite (AG) composite; (b) the 10SnS/multicarbon–microbeats (MCMB) composite; (c) the 20SnS/AG composite; (d) the 20SnS/MCMB composite.
Crystals 11 00145 g001
Figure 2. Transmission electron microscope (TEM) image and selected-area electron diffraction (SAED) pattern of the SnS structure of the as prepared 10SnS/AG sample. In all prepared nanocomposites, the SnS particles had this microstructure.
Crystals 11 00145 g002
Figure 3. X-ray diffraction (XRD) of the SnS/carbon composites before cycling. Green: 20SnS/AG, purple: 20SnS/AG, red: 20SnS/MCMB, black: 10SnS/MCMB.
Crystals 11 00145 g003
Figure 4. (a) Cycling performance of the different SnS/C samples; (b) discharge voltage capacity profiles for the 100th discharge of the 10SnS/AG, 20SnS/AG, and AG, and for the 2nd discharge of the 10SnS/AG.
Crystals 11 00145 g004
Figure 5. XRD of the SnS/C composites after 200 cycles.
Crystals 11 00145 g005
Figure 6. High resolution TEM (HRTEM) images with SAED and EDS results of the SnS/C composite anodes after 200 cycles. (a) 10SnS/AG, (b) 10SnS/MCMB, and (c) the results of EDS on 10SnS/AG.
Crystals 11 00145 g006
Figure 7. FESEM images of (a) 10SnS/AG, (bg) EDS mapping of the area in (a). The element being mapped is indicated in each image.
Crystals 11 00145 g007
Figure 8. FESEM images of (a) 20SnS/AG, (bg) EDS mapping of the area in (a). The element being mapped is indicated in each image.
Crystals 11 00145 g008
Figure 9. Electron impedance spectroscopy (EIS) diagrams for (a) 10SnS/AG and (b) 20SnS/AG, before and after 20 cycles.
Crystals 11 00145 g009
Table 1. FESEM–electron dispersive spectroscopy (EDS) analysis conducted before cycling to determine the content and particle size of Sn and S.
SampleParticle Size (nm)Elements (% atom)
SnCS
10SnS/AG254.333.0495.481.48
10SnS/MCMB494.353.594.172.34
20SnS/AG411.343.7192.164.13
20SnS/MCMB559.915.3489.095.57
Table 2. EDS analysis after cycling of the area inside the particles and outside the adjacent matrix.
SampleArea% Elements (% atom)
SnSCOFP
10SnS/AGInside particle1.250.6637.7937.7322.070.50
Adjacent matrix1.751.5245.4529.6019.402.28
Publisher’s Note: MDPI stays neutral with regard to jurisdictional claims in published maps and institutional affiliations.

