Article

Hot Electron Plasmon-Resonant Grating Structures for Enhanced Photochemistry: A Theoretical Study

1
Department of Physics and Astronomy, University of Southern California, Los Angeles, CA 90089, USA
2
Mork Family Department of Chemical Engineering and Materials Science, University of Southern California, Los Angeles, CA 90089, USA
3
Ming Hsieh Department of Electrical Engineering, University of Southern California, Los Angeles, CA 90089, USA
4
Department of Chemistry, University of Southern California, Los Angeles, CA 90089, USA
5
Department of Physics, University of Connecticut, Storrs, CT 06269, USA
6
Ciencia Inc., East Hartford, CT 06108, USA
7
Colleges of Nanoscale Science and Engineering, SUNY Polytechnic Institute, Albany, NY 12203, USA
*
Author to whom correspondence should be addressed.
Crystals 2021, 11(2), 118; https://doi.org/10.3390/cryst11020118
Submission received: 1 January 2021 / Revised: 22 January 2021 / Accepted: 23 January 2021 / Published: 26 January 2021
(This article belongs to the Special Issue Directed Surface Plasmon Resonance for Hot-Carrier Applications)

Abstract

:
Metallic grating structures have been shown to provide an effective platform for generating hot electrons and driving electrochemical reactions. Here, we present a systematic theoretical study of the surface plasmon resonance in different corrugated metallic grating structures using computational electromagnetic tools (i.e., the finite difference time domain (FDTD) method). We identify the corrugation parameters that produce maximum resonant field enhancement at commonly used wavelengths for photocatalytic applications (633 nm and 785 nm) in different material systems, including Ag, Au, Cu, Al, and Pt. The absorption spectra of each grating structure have been fitted with the analytical equation obtained from Coupled Mode Theory. We then extracted the absorptive and radiative loss rates. The field enhancement can be maximized by matching the absorption and radiation losses via tuning the geometric parameters. We could improve the average field enhancement of 633 nm and 785 nm modes by a factor of 1.8× and 3.8× for Ag, 1.4× and 3.6× for Au, and 1.2× and 2.6× for Cu. The optimum structures are found to be shallower for Ag, Au, and Cu; deeper for Pt; and to almost remain the same for Al. The gratings become flat for all the metals for increasing the average field enhancement. Overall, Ag and Au were found to be the best in terms of overall field enhancement while Pt had the worst performance.

Graphical Abstract

1. Introduction

Hot electrons photoexcited in plasmon-resonant metal nanostructures have been studied extensively over the past decade in the context of novel chemistry, as well as solid state devices [1,2,3,4,5]. The electromagnetic decay of surface plasmons generates hot carriers with energies much larger than that of carriers in thermal equilibrium with the lattice [2]. They offer an efficient pathway for driving high-barrier chemical reactions, which are not possible with thermalized carriers [1]. For example, enhanced photocatalytic water splitting has been reported on TiO2 films by plasmonic near-field coupling from Au nanoparticles [6,7]. Hot electrons generated by the surface plasmon decay from Au nanoparticles were used to drive H2 and D2 dissociation at room temperature [8,9]. Theoretical studies have revealed that hot carriers are generated via direct transitions above the interband transition threshold in commonly used plasmonic materials gold, silver, copper, and aluminum [10,11]. The lifetime of these carriers was measured as a few picoseconds by ultra-fast, pump-probe spectroscopy measurements [12].
More recently, corrugated metallic grating nanostructures have emerged as an effective platform for generating plasmon-enhanced hot carriers in the visible range [13,14,15]. These gratings are fabricated by depositing a plasmonic metal on a corrugated silicon substrate. This templated fabrication offers a simple and convenient method to create grating structures with a preferred material system for a given application. The gratings have been used for enhancing the efficiency of photodetectors based on metal/oxide/metal (Au/Al2O3/graphene) heterostructures [15]. Corrugated Au gratings have also been used to inject photoexcited hot electrons into an aqueous solution and to drive water splitting reactions [7,15]. Photocurrent enhancement has been demonstrated with hot electrons generated in corrugated Ag grating structures [13]. These measurements use a fixed wavelength and scan the incident angle, which enables tuning through the plasmon resonance. In these grating structures, the plasmon-resonant excitation can be distinguished from bulk interband transition simply by rotating the polarization of the incident light.
Previous studies have shown strong geometry and wavelength dependences for hot electron generation in plasmonic structures. However, no systematic studies have been carried out as a function of geometric parameters for these gratings. In the work presented here, we systematically study the geometric effects in these corrugated structures on the generation of surface plasmon polaritons and resulting hot carrier generation in commonly used plasmonic metals Ag, Au, Al, Cu, and Pt. Based on the material choice, the optimum geometry can be chosen to maximize the field enhancement and thereby the hot carrier generation rate.

2. Methods

We investigated the surface plasmon resonance in corrugated grating structures using the finite difference time domain (FDTD) method in the Lumerical FDTD solutions package. The geometry of the corrugated grating surface can be specified by the following equation:
y ( x ) = A   [ e 2 ( x x 0 σ ) 2 + e 2 ( x x 0 σ ) 2 ]
where A is the height difference between the peaks and valleys of the corrugation, herein referred to as the corrugation amplitude, and σ specifies the length over which the corrugation amplitude goes down by 1/e2, referred to as the steepness factor.
From the SEM image shown in Figure 1a, we obtained the geometric factors of A = 58.9 nm and σ = 125 nm. The gratings had a corrugation pitch (a) of 500 nm and metal thickness (t) of 50 nm. Figure 1b shows the index profile of the geometry used in the numerical simulation. Water was considered the surrounding medium for the calculations with an index of refraction of n = 1.33.
A 2D simulation was carried out with a fine mesh of 1 nm × 1 nm and an oblique excitation with a plane wave source. Bloch boundaries were used along the x-direction (in plane of the grating), and perfectly matched layer (PML) boundaries were used in y-direction (perpendicular to the grating) for single wavelength simulations. For broadband simulations at a fixed incident angle, broadband fixed-angle source technique (BFAST) was used within Lumerical FDTD solutions. The polarization of the incident light was set to p-polarization with respect to the gratings. A power monitor was placed behind the source to record the reflected power (Pref). Absorbed power (Pabs) was calculated as Pabs = 1 − Pref. The electric field intensity was monitored with a 2D field monitor. The broadband absorption spectra were calculated for different incident angles for each metal, as shown in Figure 2 (top row).
In order to excite the surface plasmon polaritons (SPPs) in the grating structure, the momentum and energy of the incident photons had to match those of the SPPs (i.e., wavevector matching). The incident angles that satisfied this condition at each wavelength were found by solving the following equation [13]:
2 π n d λ sin θ + m 2 π a = Re { ω c ϵ d ϵ m ϵ d + ϵ m }
where a is the periodicity of the grating, m is the order of the surface plasmon mode, θ is the incidence angle, and ϵ m and ϵ d are the dielectric functions of the metal and surrounding medium, respectively. By solving Equation (2) for different metals, the spectral position of the plasmon-resonant modes for each incident angle could be calculated. Figure 2 (bottom row) shows the analytical band structures of different metallic gratings calculated using Equation (2).
It is evident from Figure 2 that the absorption is at a maximum at the resonance conditions obtained from Equation (2), reaffirming that the absorption enhancement is due to the surface plasmon polaritons. The resonant absorption is different for each material system. Metals like Ag, Au, Al, and Cu have close to zero nonresonant absorption above 600 nm while Pt has significant background absorption throughout the visible range. We are interested in establishing whether the performance of these gratings is materially limited or geometrically limited and determining how much of an improvement is possible by adjusting the structural parameters.

3. Theory

Hot carriers are generated by the nonradiative decay of the surface plasmon polaritons. Hot electron generation rate is, therefore, proportional to the electric field intensity in the metallic structure [16]. Even though Equation (2) provides a convenient analytical method to determine the excitation condition for SPPs in a plasmonic structure, it is not adequate to determine the magnitude of plasmonic enhancement in the structure. Field enhancement in plasmonic structures has been modelled and studied using coupled mode theory (CMT) [17,18]. Using CMT, the following relation connecting the field enhancement in plasmonic structures and the quality factor of the resonant optical modes can be derived as [19,20]
| E loc | max 2 | E 0 | 2 = 2 A c λ r π V eff Q abs 2 Q rad ( Q rad + Q abs ) 2
where | E loc | max and | E 0 | are the maximum value of electric field intensity and the incident field amplitude, respectively; λr is the resonance wavelength; and Veff is the effective mode volume. Ac is the effective aperture of the microstructure, which is determined by the radiation pattern of the whole grating array [20,21]. The total radiation pattern of the large area grating structure can be regarded as a plane wave, and therefore Ac is equal to incident planewave cross section. Qrad and Qabs are the radiation and absorption quality factors of the structure, respectively, and are related to the resonant wavelength and loss rates in the structure as follows [20]:
Q abs = ω 0 Γ abs ,   Q rad = ω 0 Γ rad   and   1 Q total = 1 Q abs + 1 Q rad
where ω 0 is the resonance frequency, and Γ rad and Γ abs are the radiative and absorptive losses in the metallic structure. Equation (3) can be modified to express the field enhancement in terms of loss rates
| E loc | m a x 2 | E 0 | 2 ω 0 V eff Γ rad ( Γ rad + Γ abs ) 2
Equation (5) signifies that the field enhancement of the grating structure can be modified by engineering the radiation and absorption loss rates. Radiation loss from the structure is a strong function of its geometric parameters while absorption losses mainly depend on the material type and wavelength [22]. The mode volume is proportional to the propagating length of the surface plasmon polaritons and the field decay constant in the direction normal to metal surface. Veff is not expected to depend strongly on the geometry when the dimensions are small compared to wavelength [22]. The field enhancement increases with Γ rad , reaches maximum when Γ rad = Γ abs , and then decreases with further increase in Γ rad . This condition ( Γ rad = Γ abs ) is called the critical coupling. The critical coupling could be understood as analogous to the impedance matching principle. When an electromagnetic wave couples with the resonant structure, the maximum energy is stored in the resonator when the loss rates are matched [19]. The maximum field enhancement at critical coupling varies inversely proportional to the absorption losses ( Γ abs ). Therefore, the maximum field enhancement is obtained when Γ rad = Γ abs and Γ tot = Γ rad + Γ abs = 2 Γ abs is as close to minimum as possible.
For a given structure, we can extract the loss rates from the spectra and tune them to improve the field enhancement. Using CMT, the absorption spectra of these plasmonic gratings can be expressed as [22,23,24]
A ( ω ) = 1 | r p + Γ rad e i ϕ i ( ω ω 0 ) + Γ rad + Γ abs 2 | 2
where r p is the nonresonant background reflection from the structure and ϕ is the phase factor of the surface plasmon mode. The loss rates can be extracted by fitting the absorption spectra of the structure to the analytical expression obtained from CMT.

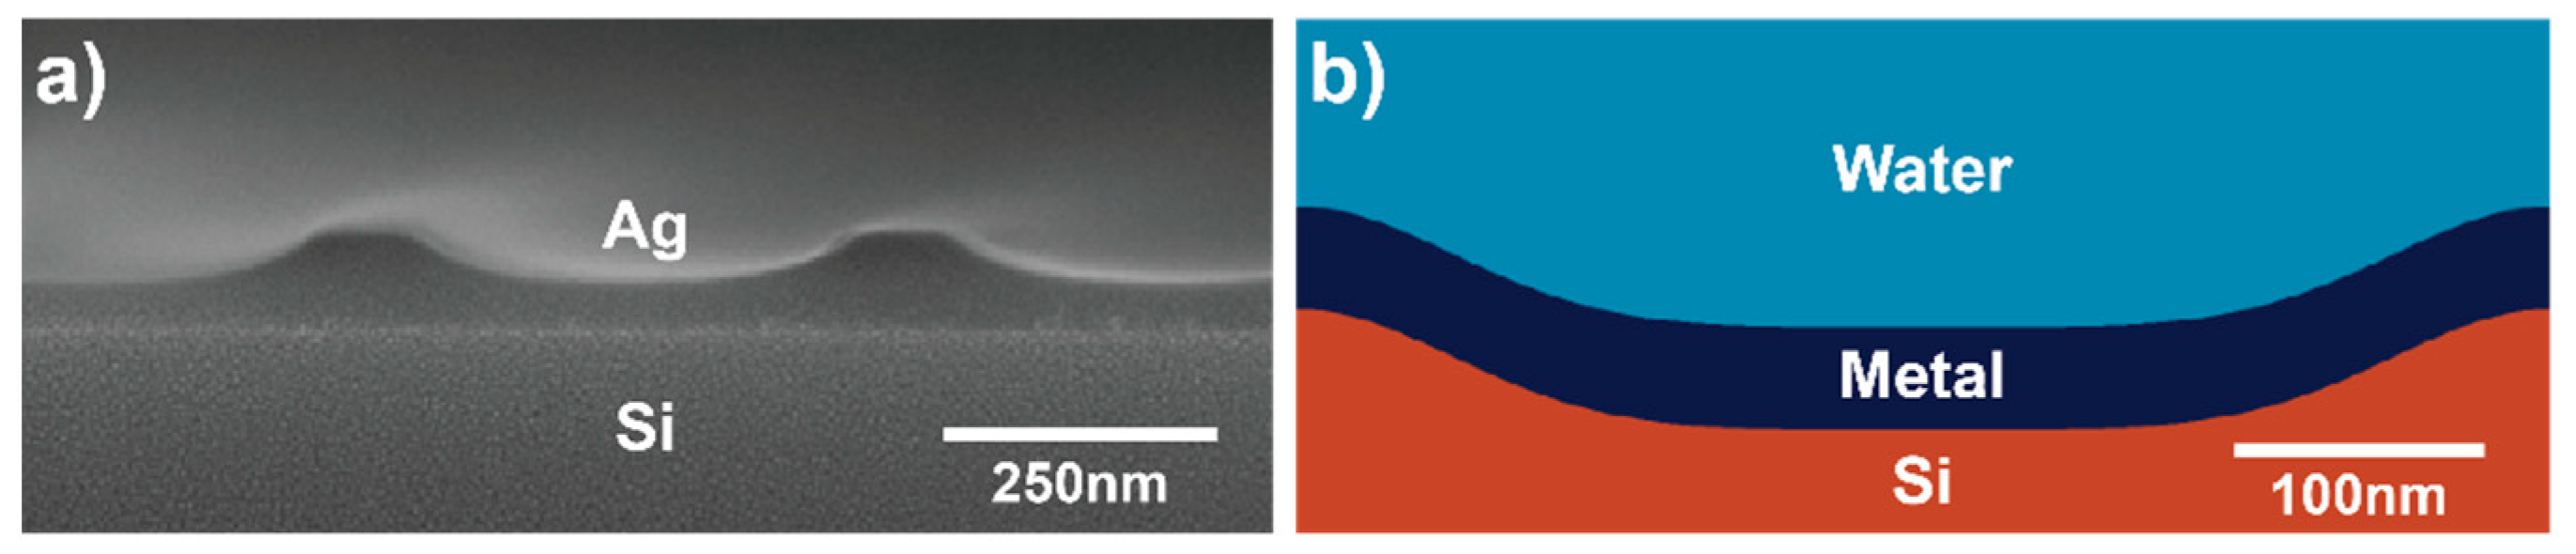
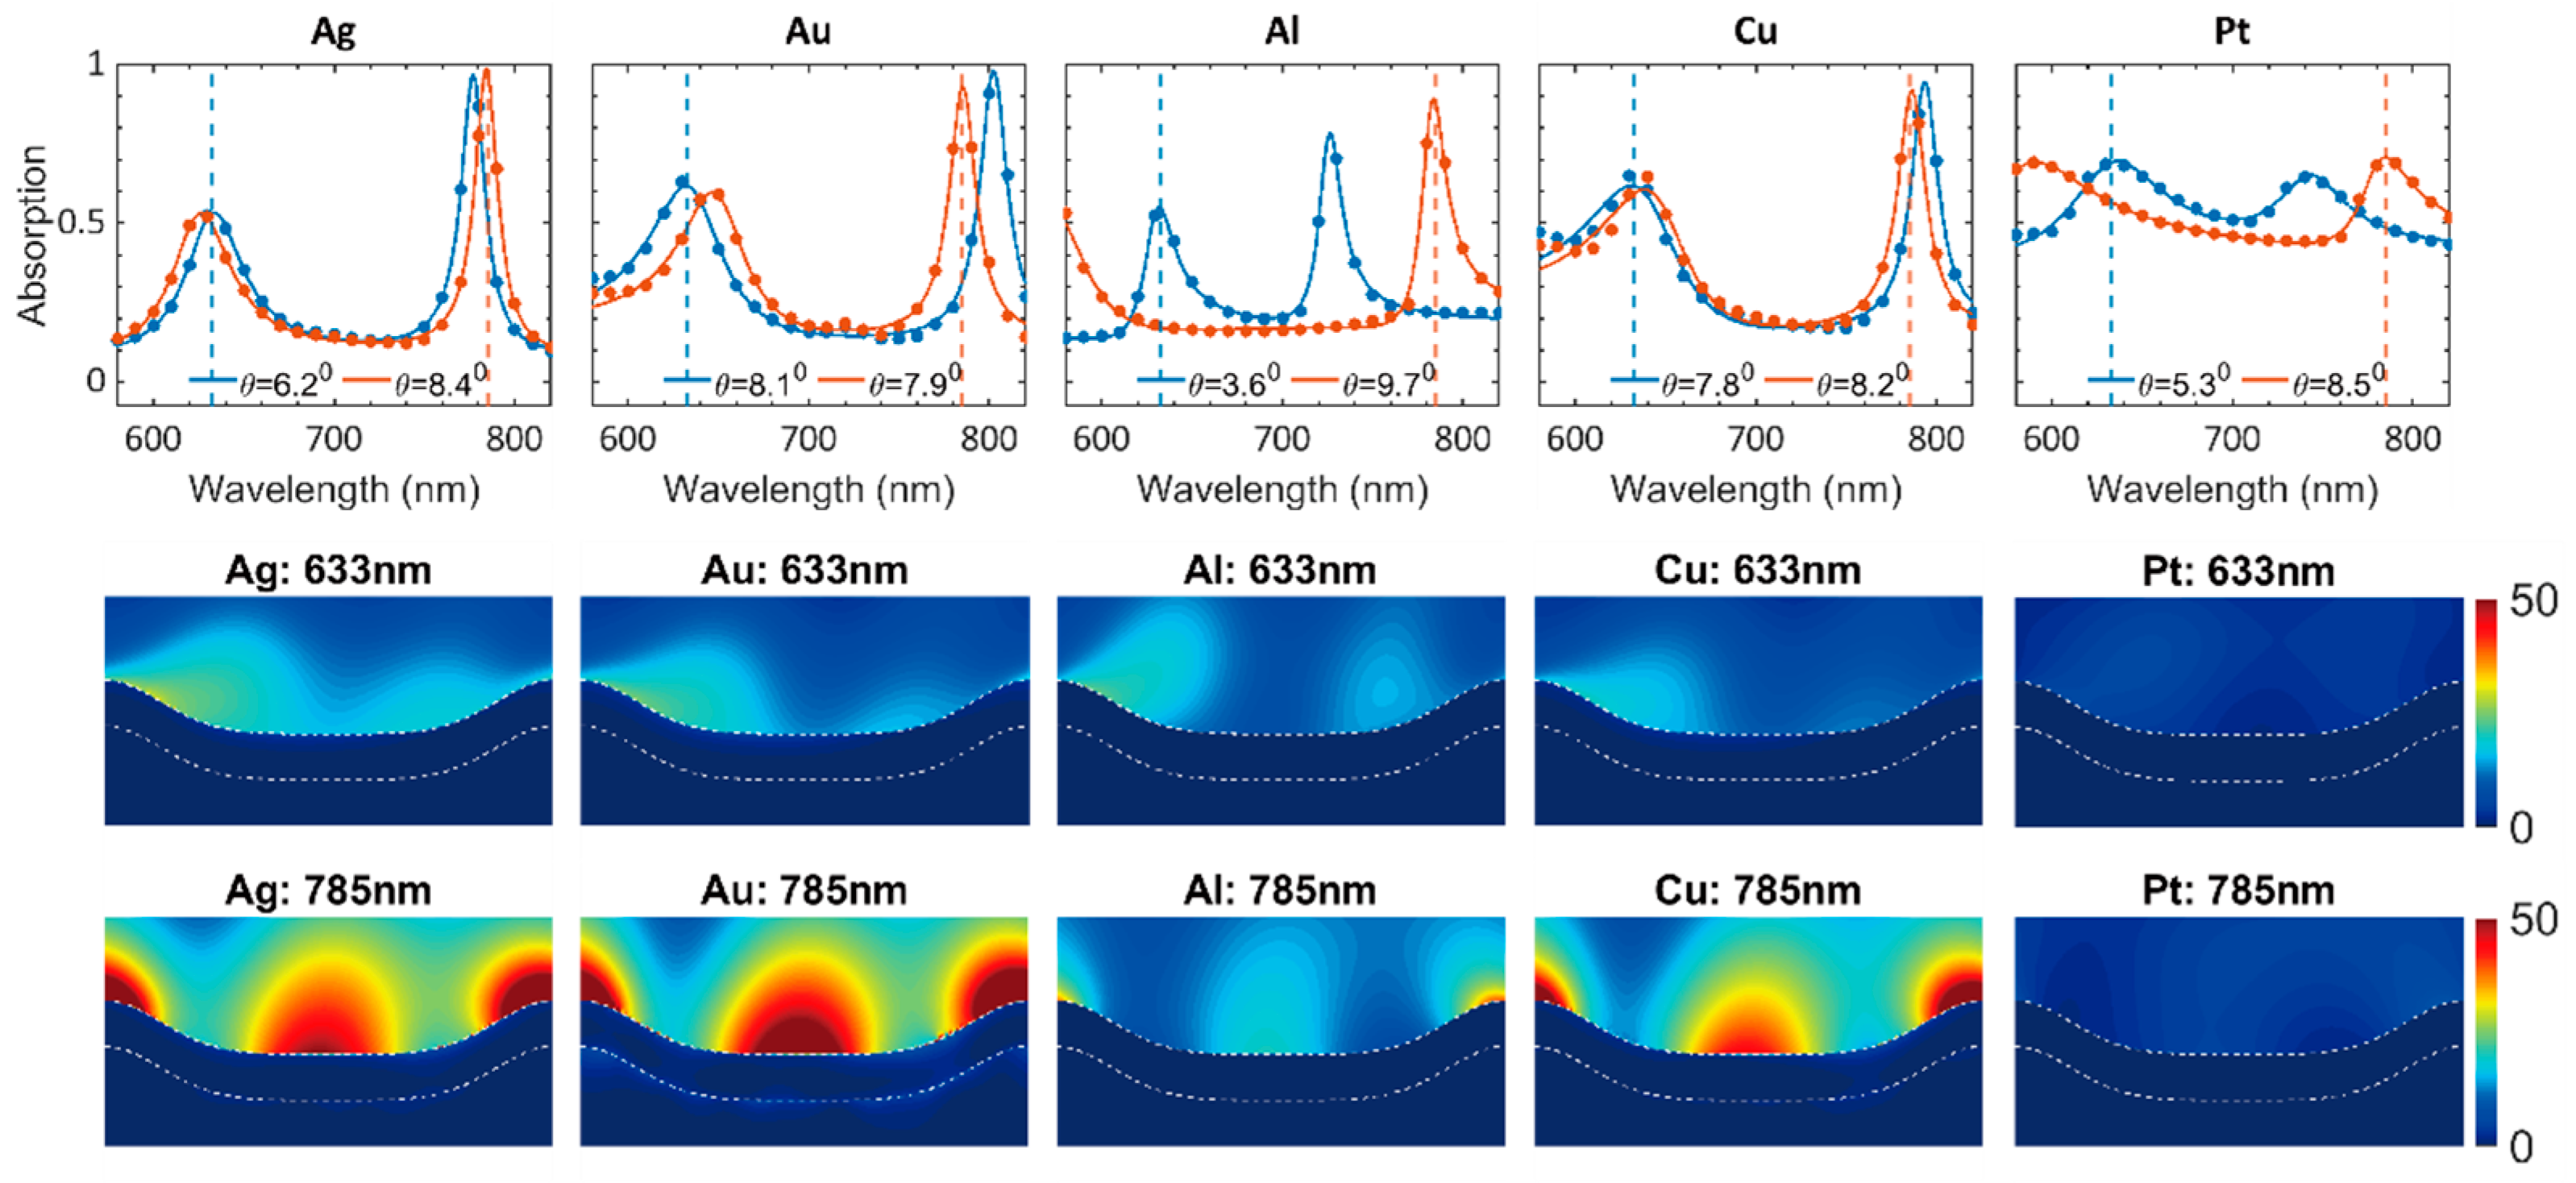
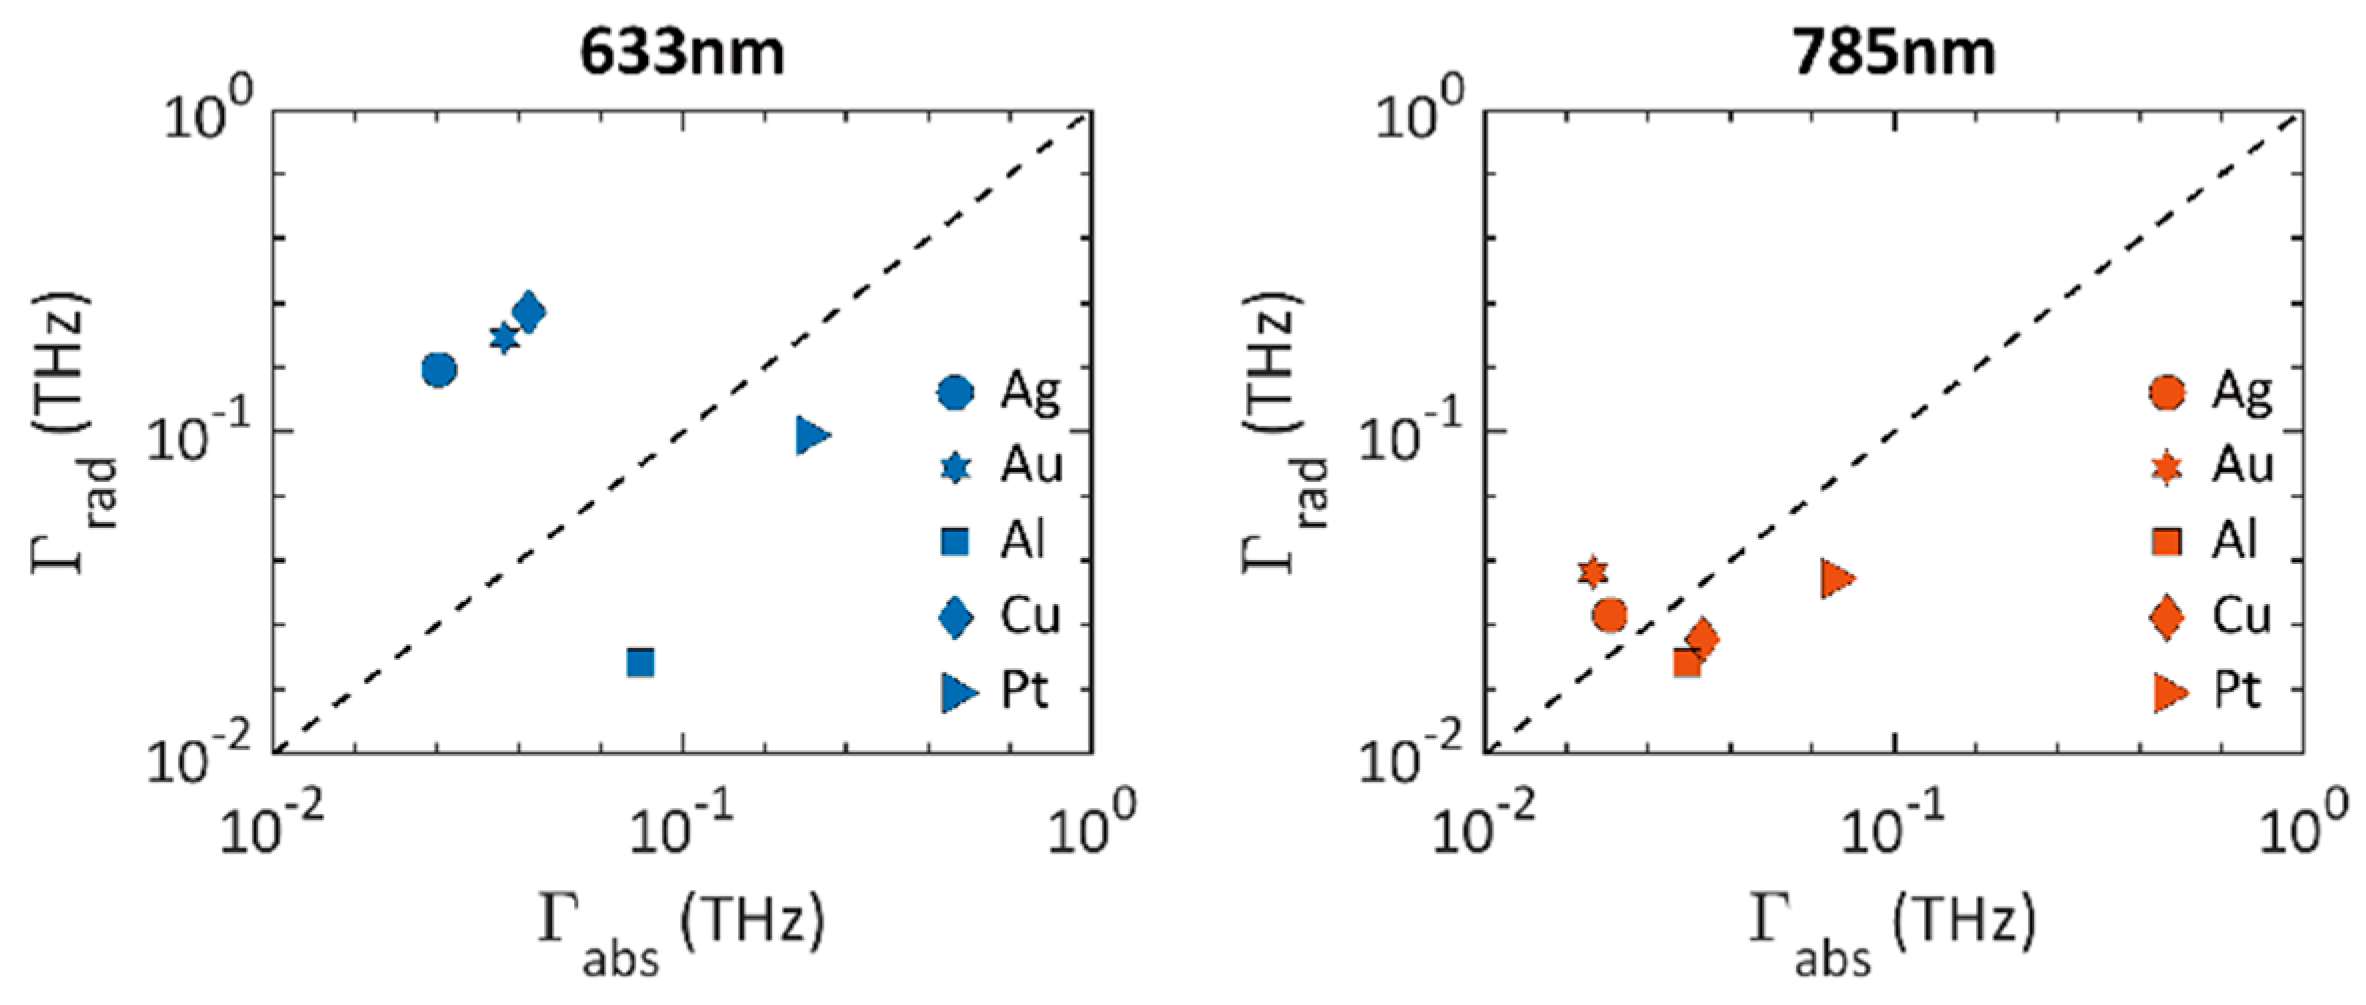
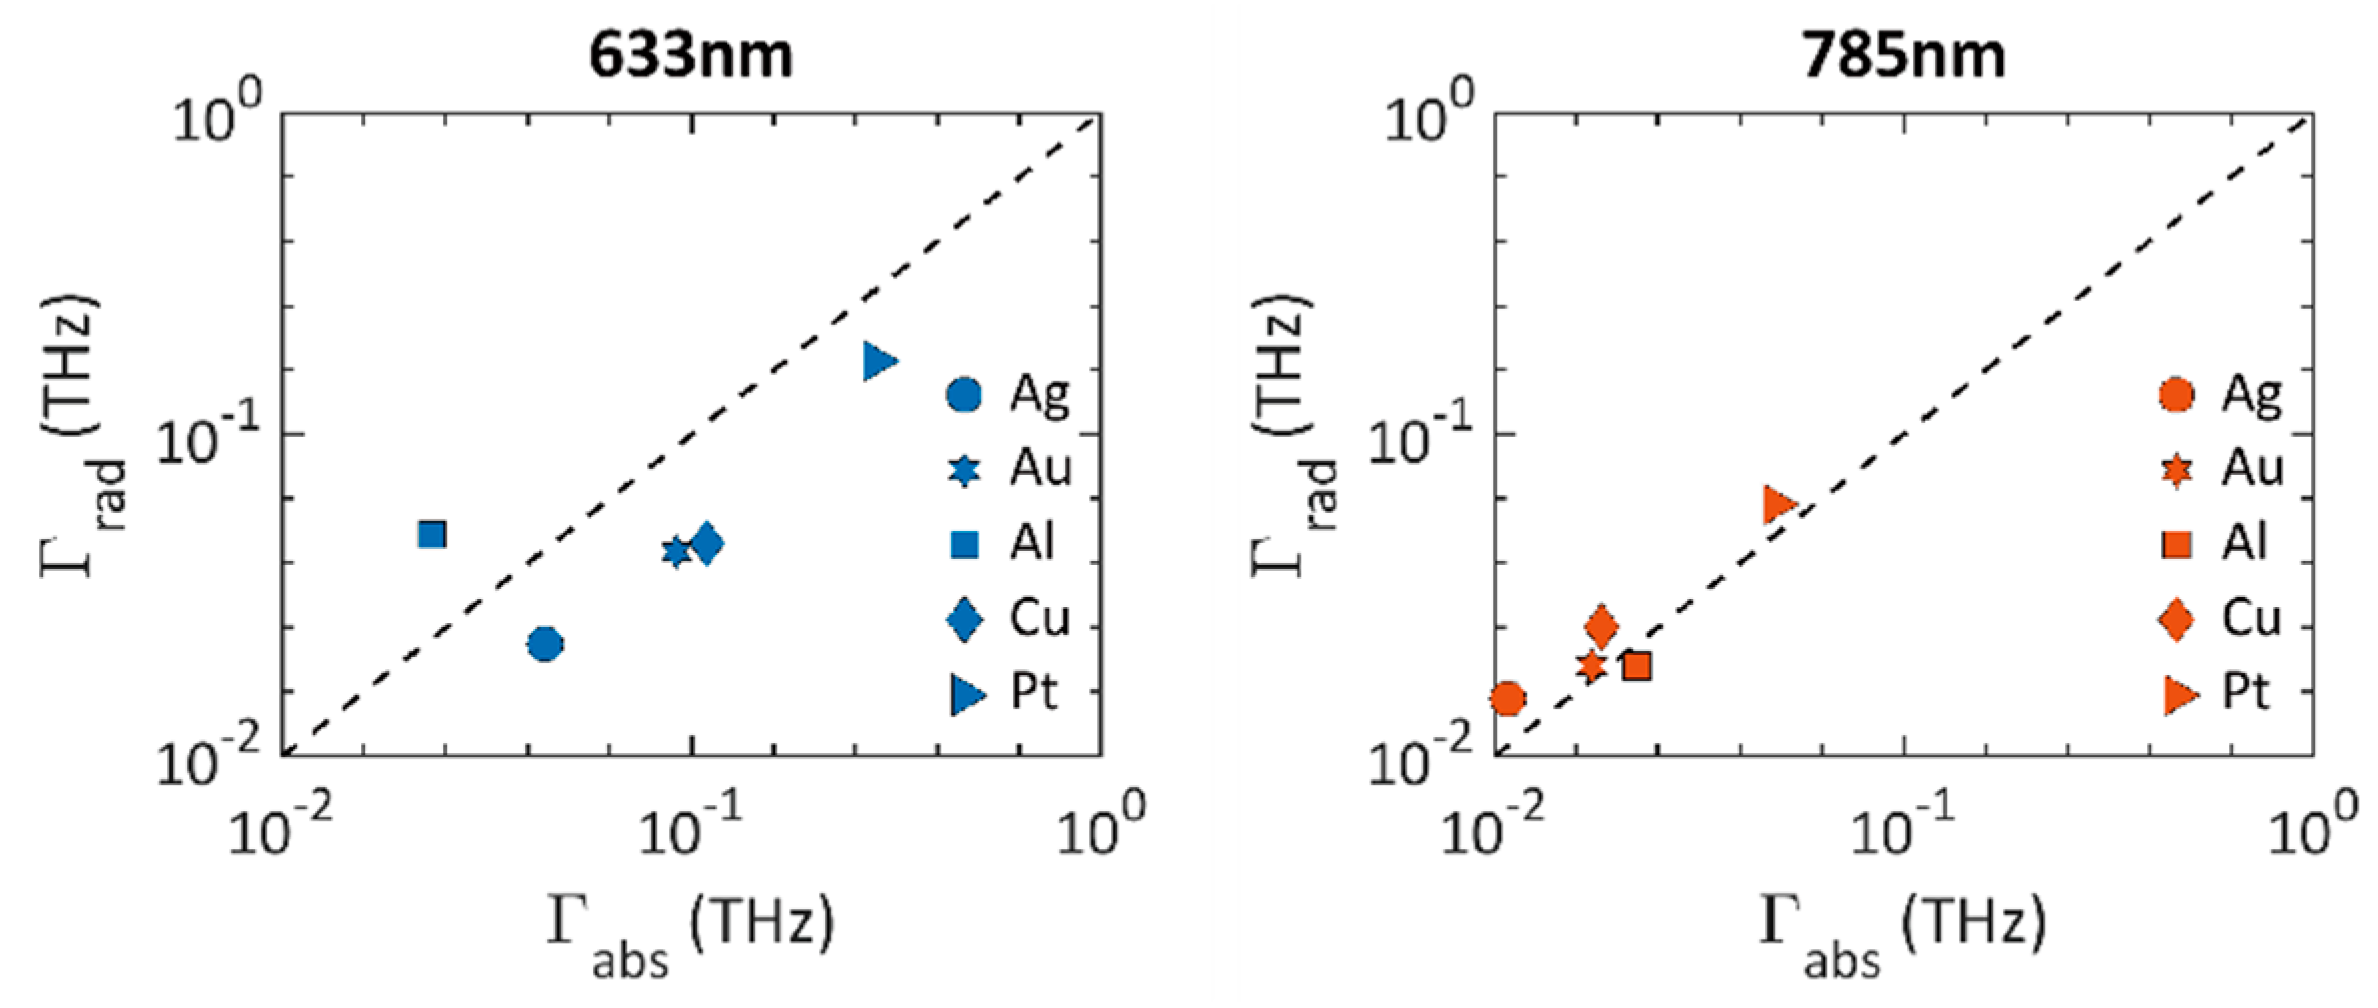
4. Corrugated Grating Structure

We considered two incident wavelengths, 632 nm and 785 nm, at which the metals supported a well-defined resonant mode for incident angles ranging from 40 to 100. The absorption spectra obtained from the FDTD simulations for each metallic grating were then fitted to the analytical equation (6) using non-linear curve fitting with the NLopt library [25] in MATLAB to deduce the fitting coefficients ( Γ rad ,   Γ abs , ω 0 , r p , ϕ ). Figure 3 shows the simulated absorption spectra (markers) and fitted absorption spectra using the analytical equation (solid lines). The field profile corresponding to the resonant angles at wavelengths 633 nm and 785 nm is also plotted. For fitting the spectra with multiple resonant modes, the linear superposition of Lorentzian-like coupled surface plasmon polariton modes are considered [26]. It can be seen from Figure 3 that the analytical equation agrees well with the simulated spectra.
The corrugated structure for each metal was analyzed within the CMT framework to see whether the structure was optimal for the specific material system. Figure 4 shows the radiative and absorptive loss rates obtained from the fit for different metals at their resonant modes for 633 nm (blue) and 785 nm (red), respectively. The black dashed line represents the critical coupling condition ( Γ rad = Γ abs ) . The points that lie close to the center line towards the origin in the Gamma plots will have maximum field enhancement as it satisfies Γ rad = Γ abs and Γ tot = Γ rad + Γ abs is minimum. We found that the initial structure depicted in Figure 1 was far from optimum for all the metals at 633 nm. At 785 nm, the structure was close to critical coupling for all the metals except Pt.

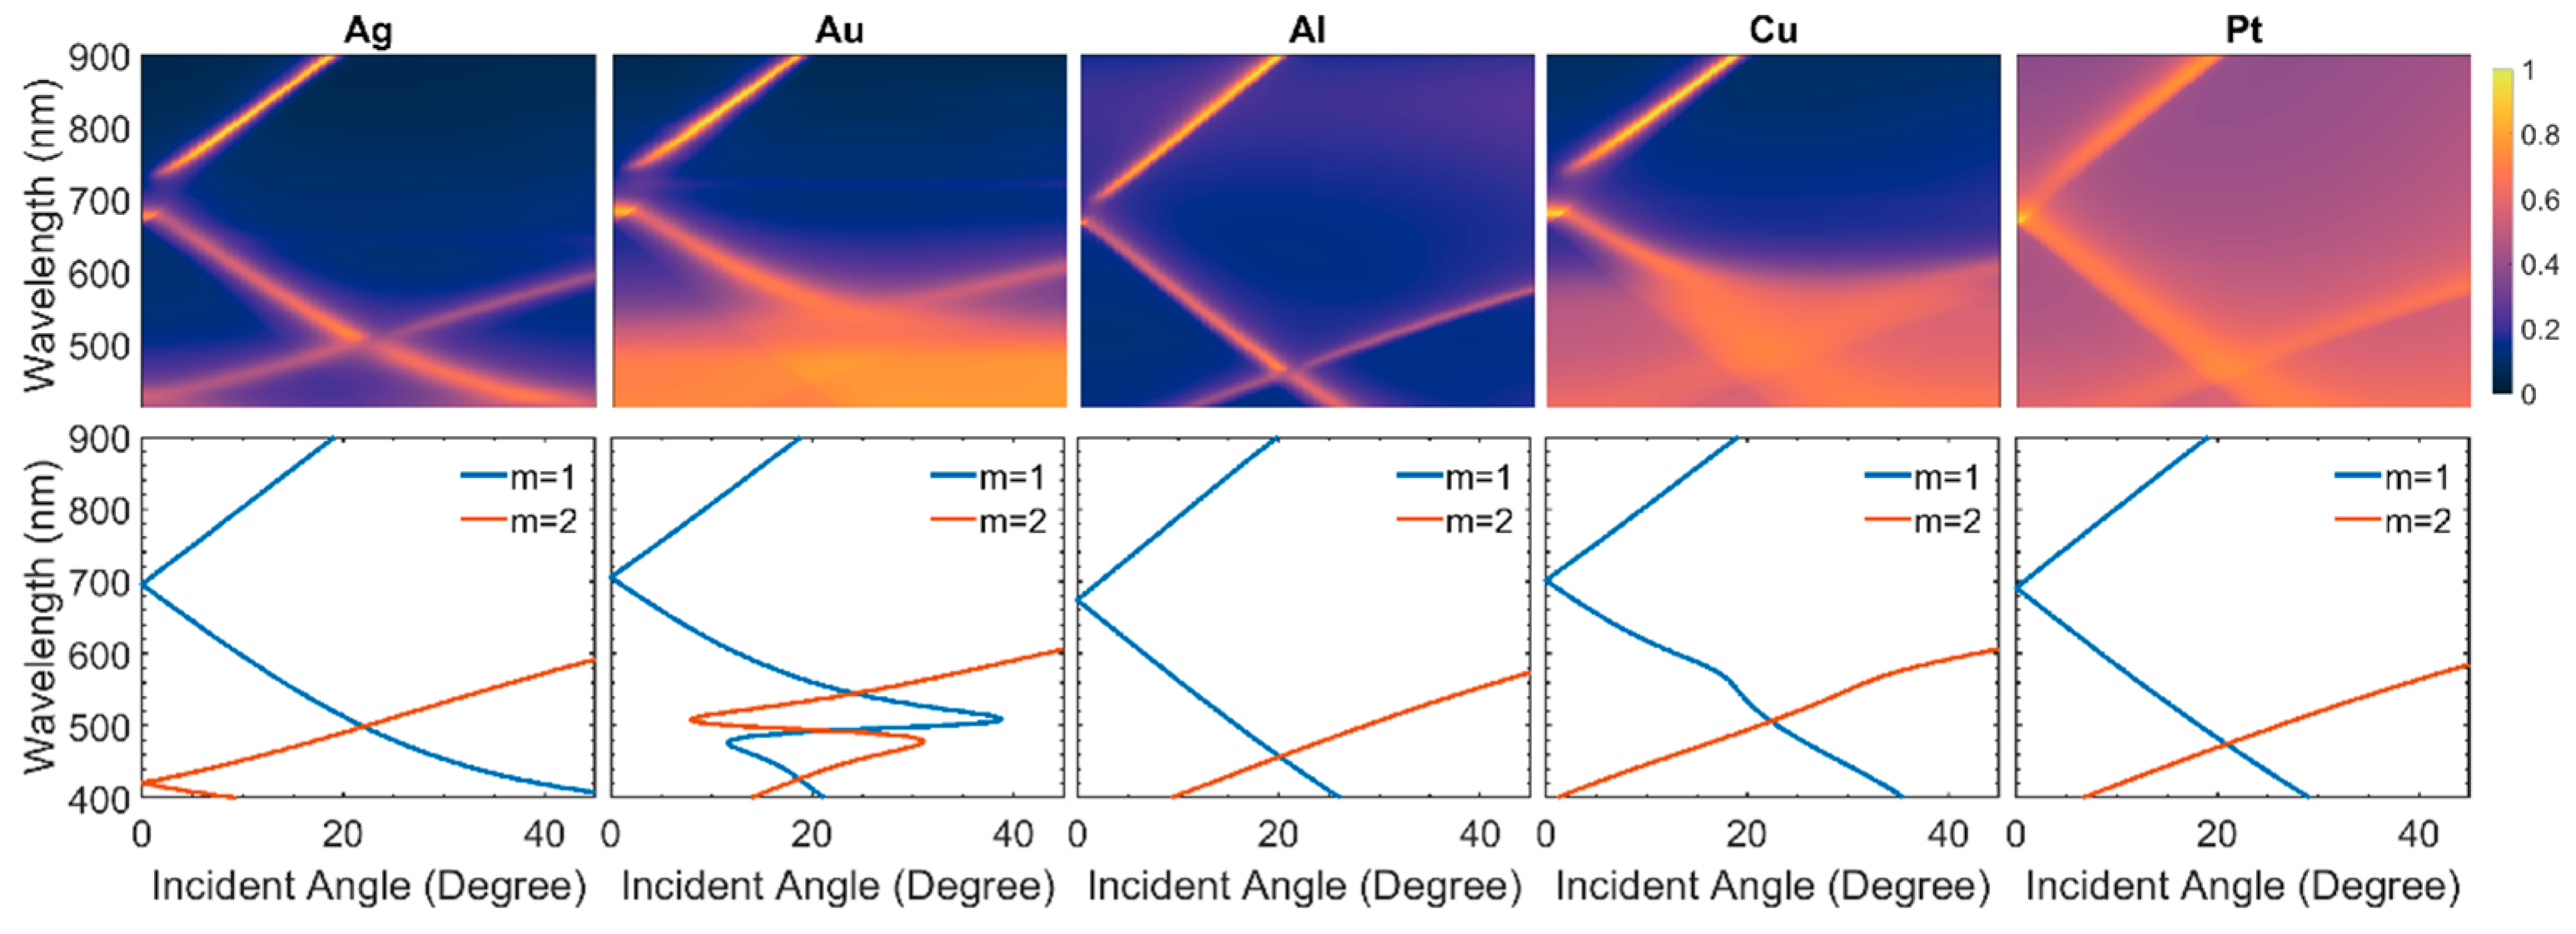
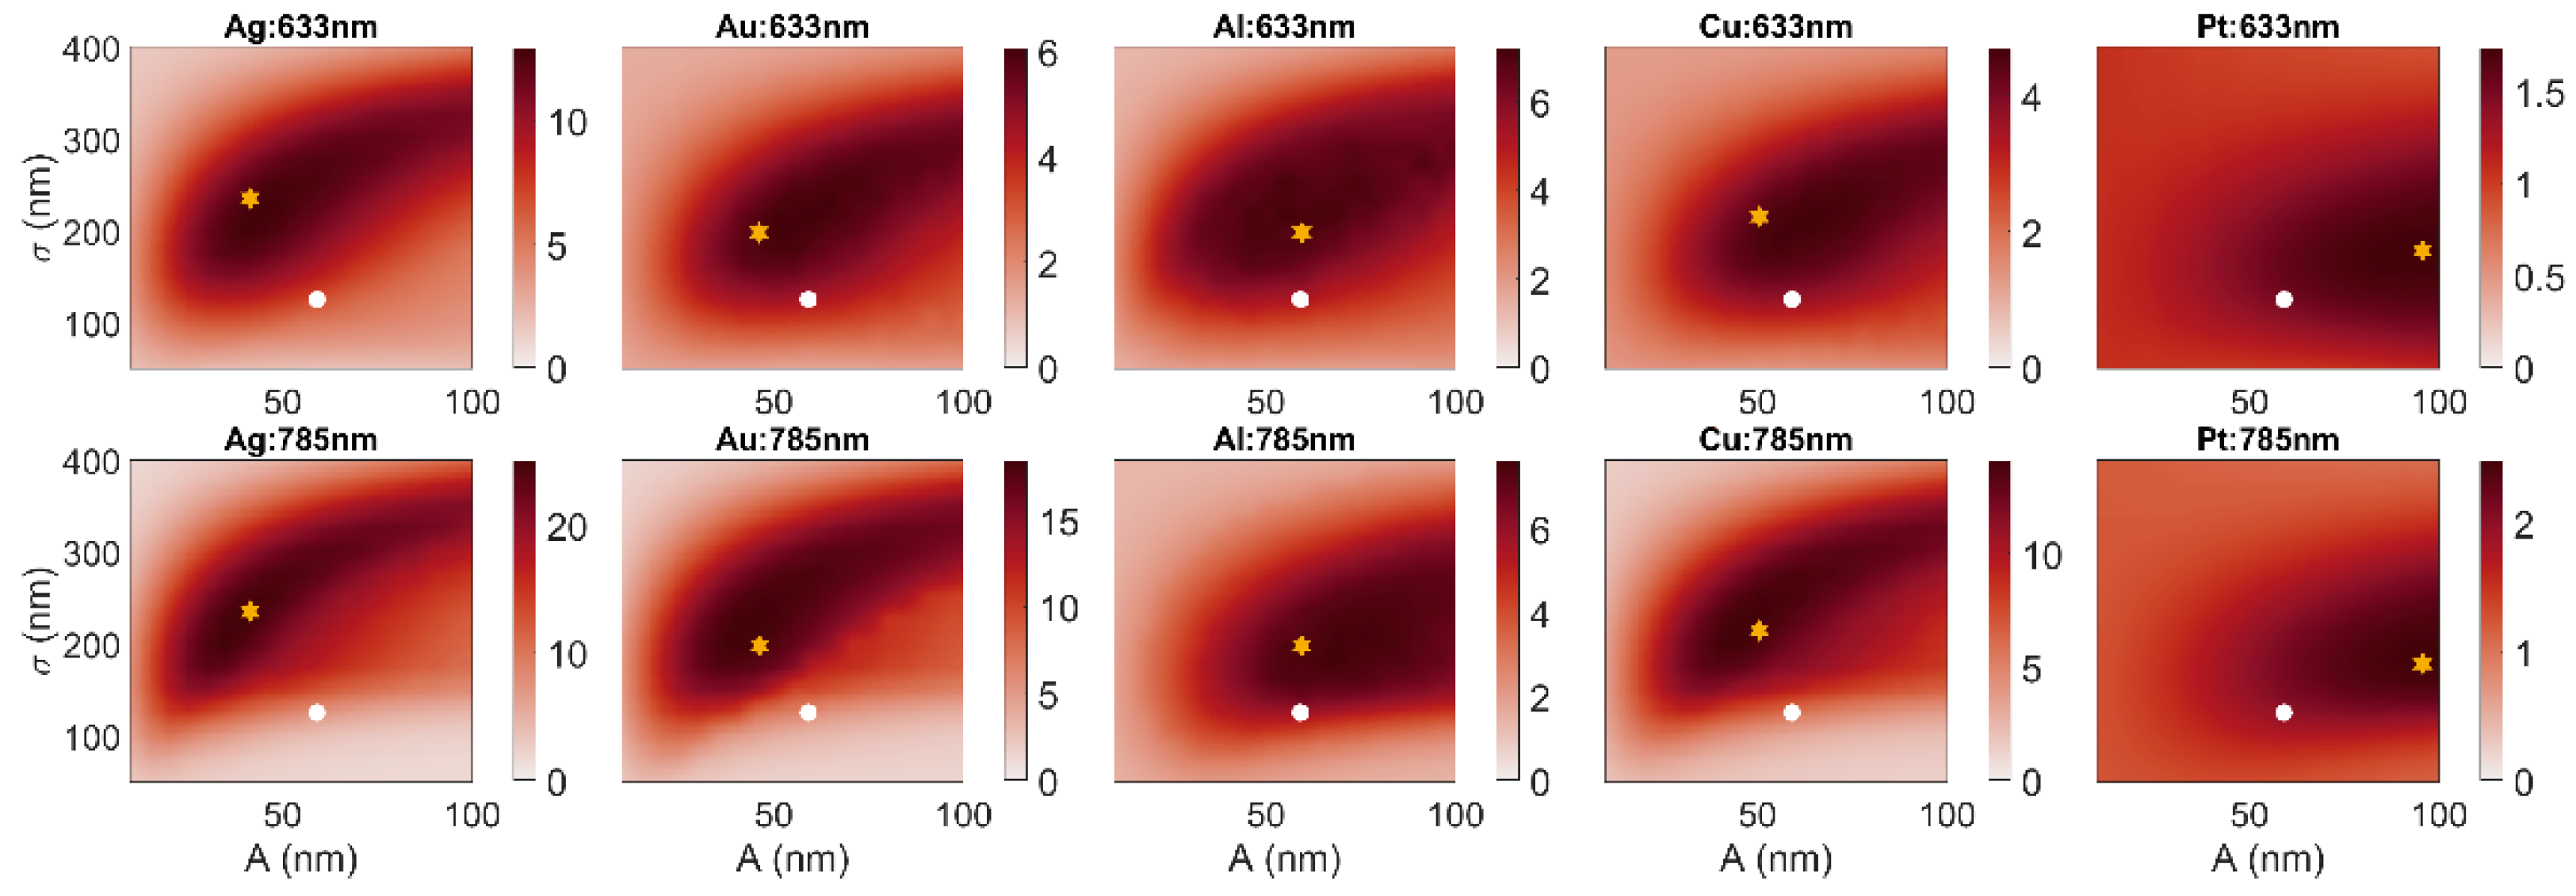
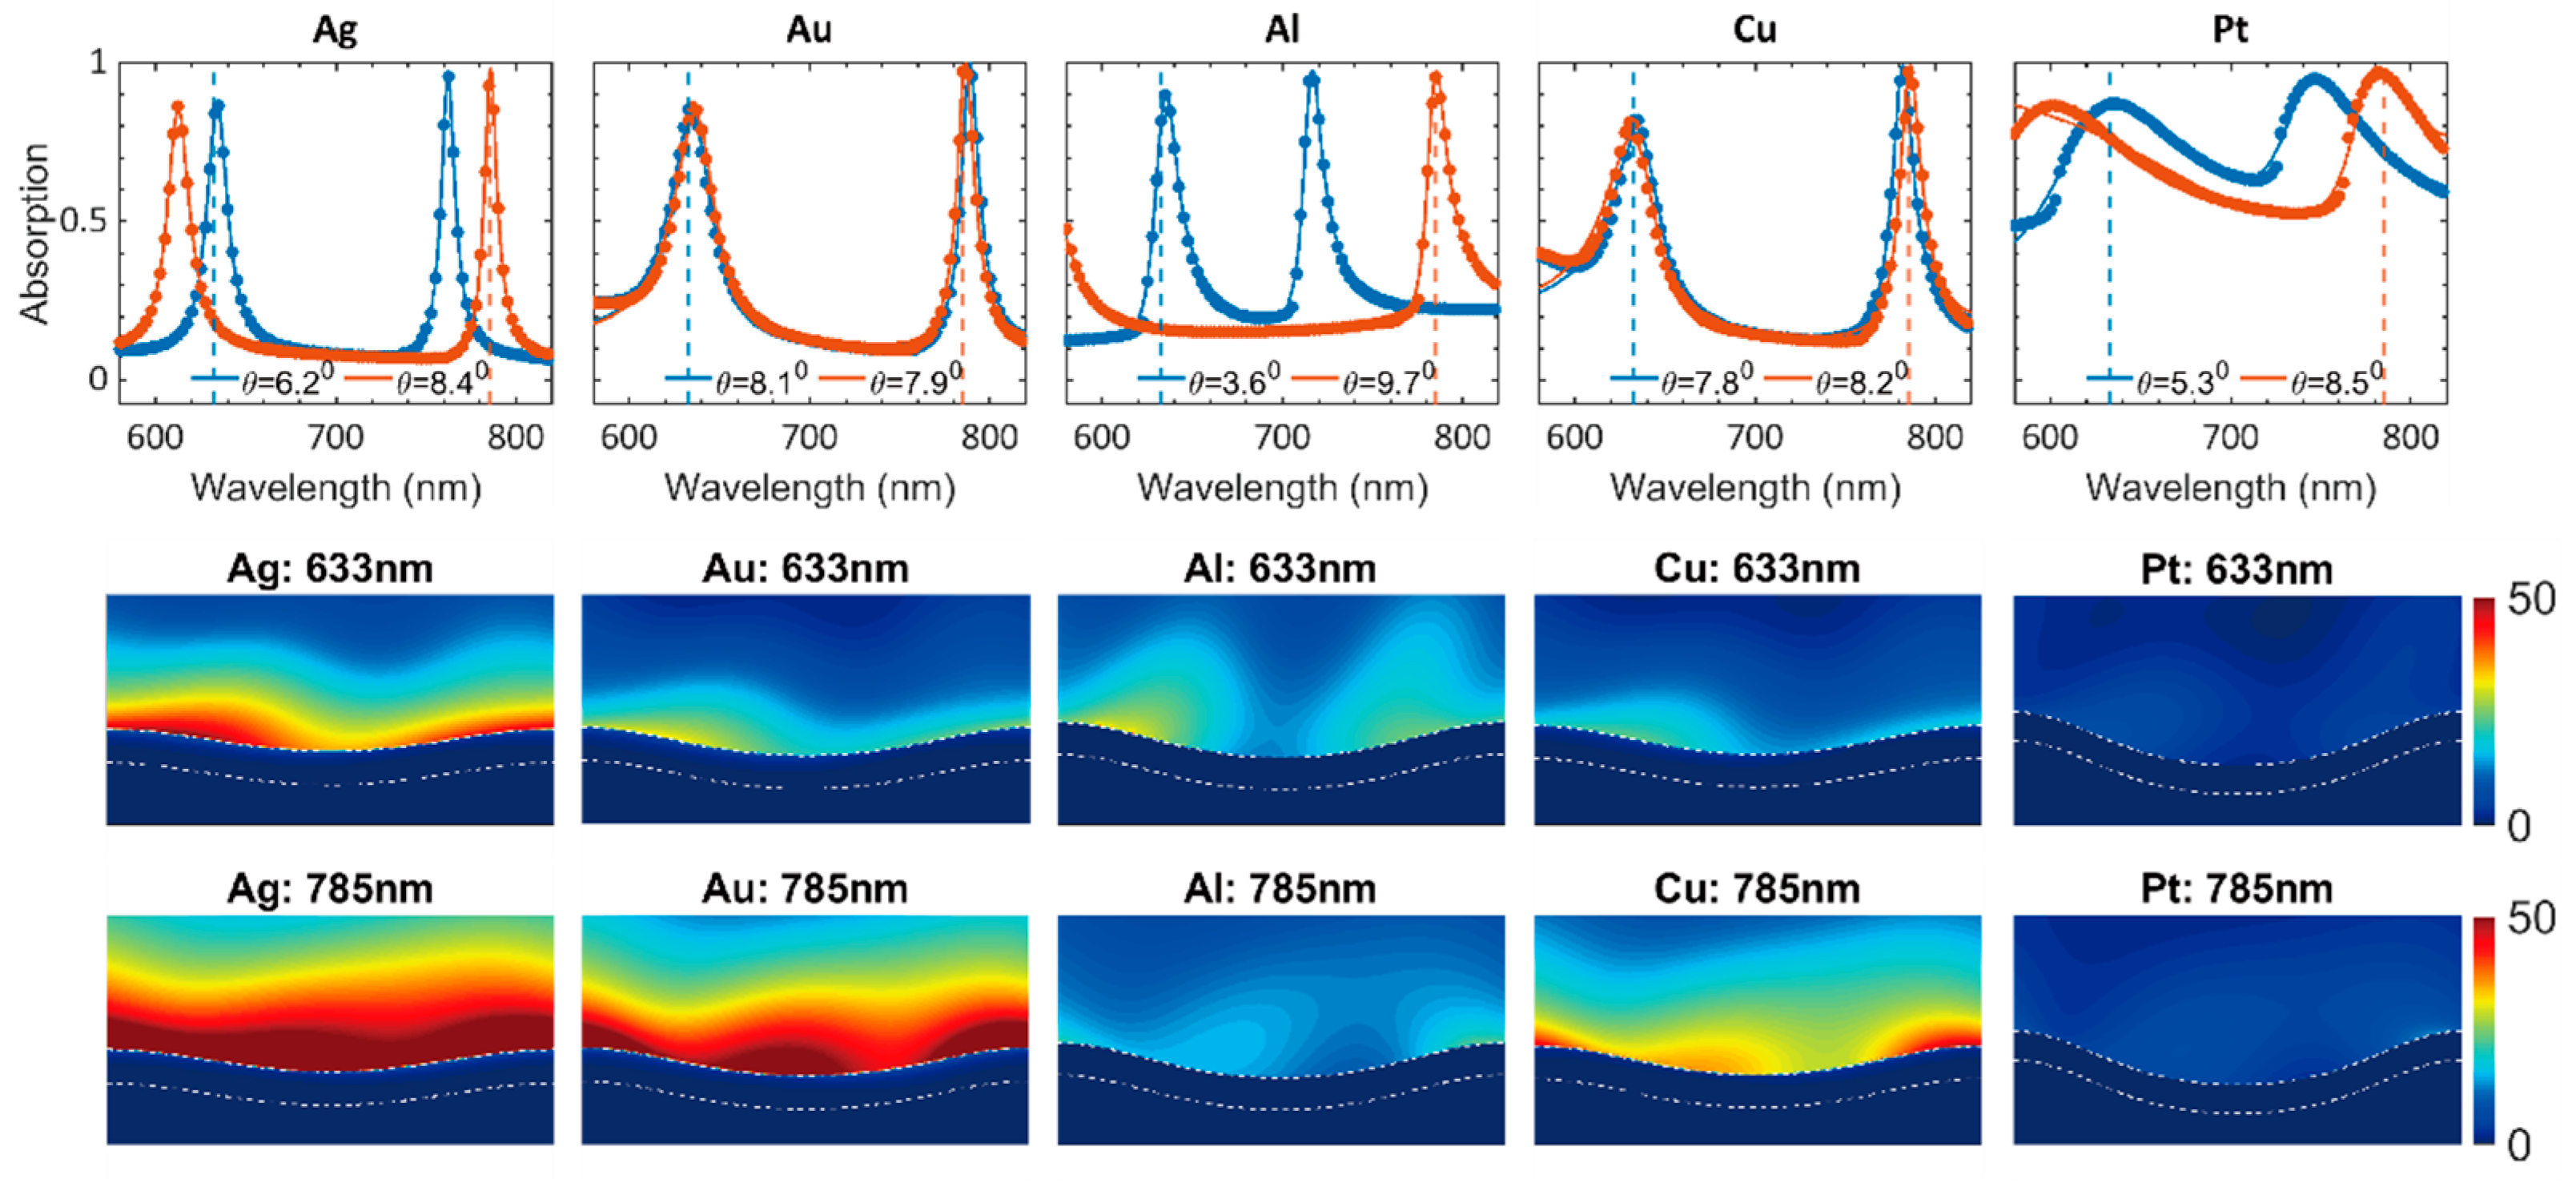
5. Tuning the Corrugation for Each Material

Absorptive and radiative decay rates of different metallic gratings depend on the geometric parameters of the corrugation. Here, we varied the corrugation amplitude ( A ) and the steepness factor ( σ ) to determine the changes in field enhancement and peak absorption at 633 nm and 785 nm, respectively, for each metal. The average field enhancement was calculated by
I avg = | E ( x , y ) | 2 dxdy | E 0 | 2 dxdy
Figure 5 shows the field enhancement at 633 nm and 785 nm for different metal gratings under consideration as a function of A and σ . We used the resonant angles obtained from the analytical expression in Equation (2) to excite the surface plasmons in each metal at both wavelengths. A was varied from 10 nm to 100 nm while σ was varied from 50 to 400 nm. These parameters ranges were chosen to represent fabrication feasible corrugation gratings.
Within this parameter space, Ag shows the highest field enhancement among the metals while Pt has the least. The 785 nm modes were found to have higher field enhancement than 633 nm modes for all the metals. Table 1 lists the A and σ values of the optimum structure that maximizes the field enhancement at 633 nm and 785 nm, as compared to that of the original grating geometry. The optimum structures are shallower than the original gratings for all the metals except Al and Pt. For Pt, the corrugation amplitude has to increase to get the maximum field enhancement, whereas the initial grating amplitude was closer to optimum for Al. For all metals, the steepness (1/σ) was reduced by almost 1.5 times the original gratings to increase the field. The resulting average field enhancements for 633nm and 785nm are 1.8× and 3.8× for Ag, 1.4× and 3.6× for Au, 1.4× and 1.3× for Al, 1.2× and 2.6× for Cu, and 1.2× and 1.3× for Pt.
Figure 6 shows the absorption spectra corresponding to resonant angles at 633 nm (blue) and 785 nm (red) for the optimum structures for each metal. The resonant field profiles corresponding to the two wavelengths are also shown. The resonant field enhancement and resonant absorption improved in these structures compared to the initial geometry. The field enhancement for 633 nm modes was lower than that of 785 nm. Ag showed maximum field enhancement compared to other metals considered. The field was found to be more uniformly distributed along the corrugated surface in the final structures.
To compare the loss rates of the optimized structures with those of the initial gratings, we fitted the absorption spectra with Equation (6). Figure 7 shows the radiative and absorptive losses at resonant angles corresponding to 633 nm and 785 nm for the above-mentioned gratings. Compared with Figure 4, we can see that tuning the geometrical parameters will alter the losses, which subsequently influences the field enhancement. The optimum structures have similar absorption and radiation loss rates and, thus, lie closer to the critical coupling condition (dashed center line). However, this alone does not determine the maximum field enhancement condition. The sum of these loss rates should be as low as possible as well. The geometrical optimization tends to match the radiation losses with absorptive losses. The maximum field enhancement these corrugated gratings can achieve is found to be limited by the metal type. The gamma values for 785 nm modes are closer to the optimum conditions required for field enhancement than the 633 nm modes, likely due to fewer interband transitions at 785 nm. Overall, Ag works the best in terms of plasmonic field enhancement while Pt is found to be the least optimal.

6. Conclusions

In conclusion, we have studied the surface plasmon resonance in corrugated gratings of different metals at 633 nm and 785 nm. Strong material and geometry dependences have been observed in the field enhancement of these corrugated grating modes. The corrugation depth and steepness were tuned to find the maximum field enhancement possible by geometry optimization for each material system. The absorption spectra of each grating structure have been fitted with the analytical equation obtained from CMT. We then extracted the absorptive and radiative loss rates. The maximum field enhancement for a metallic grating is achieved by matching the radiation losses with its absorptive loss by tuning the geometric parameters. The optimum structures are found to be shallower for Ag, Au, and Cu; deeper for Pt; and to almost remain the same for Al. The gratings become flat for all the metals when increasing the average field enhancement. By tuning the geometric factors, the average field enhancement could be improved by 1.8× and 3.8× for Ag, 1.4× and 3.6× for Au, 1.4× and 1.3× for Al, 1.2× and 2.6× for Cu, and 1.2× and 1.3× for Pt for 633 nm and 785 nm modes, respectively. Ag and Au were found to be the best in terms of overall field enhancement, while Pt had the worst performance.

Author Contributions

Conceptualization, I.A. and S.B.C.; Data curation, I.A.; Formal analysis, I.A.; Funding acquisition, S.B.C.; Investigation, I.A.; Methodology, I.A.; Project administration, S.B.C.; Resources, Y.W. (Yu Wang), Z.C., L.S., B.Z., S.Y., Y.W. (Yi Wang), J.M.D., G.N.G., E.G., N.C.C., W.D.P. and A.P.; Supervision, S.B.C.; Validation, S.B.C.; Writing—original draft, I.A.; Writing—review & editing, S.B.C. All authors have read and agreed to the published version of the manuscript.

Funding

This research was supported by the Army Research Office (ARO) Award No. W911NF-17-1-0325 (Y.W.), National Science Foundation (NSF) Award No. CBET-1512505 (L.S.), Air Force Office of Scientific Research (AFOSR) Grant No. FA9550-19-1-0115 (I.A.), and ACS-PRF Grant #55993-ND5 (B.Z.).

Data Availability Statement

Not applicable.

Acknowledgments

The authors acknowledge the Center for Advanced Research Computing (CARC) at the University of Southern California for providing computing resources that have contributed to the research results reported within this publication. URL: https://carc.usc.edu.

Conflicts of Interest

The authors declare no conflict of interest.

References

  1. Brongersma, M.L.; Halas, N.J.; Nordlander, P. Plasmon-induced hot carrier science and technology. Nat. Nanotechnol. 2015, 10, 25–34. [Google Scholar] [CrossRef] [PubMed]
  2. Narang, P.; Sundararaman, R.; Atwater, H.A. Plasmonic hot carrier dynamics in solid-state and chemical systems for energy conversion. Nanophotonics 2016, 5, 96–111. [Google Scholar] [CrossRef]
  3. Chalabi, H.; Schoen, D.; Brongersma, M.L. Hot-Electron Photodetection with a Plasmonic Nanostripe Antenna. Nano Lett. 2014, 14, 1374–1380. [Google Scholar] [CrossRef] [PubMed]
  4. Li, W.; Valentine, J. Harvesting the loss: Surface plasmon-based hot electron photodetection. Nanophotonics 2016, 6, 177–191. [Google Scholar] [CrossRef]
  5. Zhang, Y.; He, S.; Guo, W.; Hu, Y.; Huang, J.; Mulcahy, J.R.; Wei, W.D. Surface-Plasmon-Driven Hot Electron Pho-tochemistry. Chem. Rev. 2018, 118, 2927–2954. [Google Scholar] [CrossRef]
  6. Liu, Z.; Hou, W.; Pavaskar, P.; Aykol, M.; Cronin, S.B. Plasmon Resonant Enhancement of Photocatalytic Water Splitting Under Visible Illumination. Nano Lett. 2011, 11, 1111–1116. [Google Scholar] [CrossRef]
  7. Hou, B.; Shen, L.; Shi, H.; Kapadia, R.; Wang, B. Hot electron-driven photocatalytic water splitting. Phys. Chem. Chem. Phys. 2017, 19, 2877–2881. [Google Scholar] [CrossRef]
  8. Mukherjee, S.; Libisch, F.; Large, N.; Neumann, O.; Brown, L.V.; Cheng, J.; Lassiter, J.B.; Carter, E.A.; Nordlander, P.; Halas, N.J. Hot Electrons Do the Impossible: Plasmon-Induced Dissociation of H2on Au. Nano Lett. 2013, 13, 240–247. [Google Scholar] [CrossRef] [PubMed]
  9. Mukherjee, S.; Zhou, L.; Goodman, A.M.; Large, N.; Ayala-Orozco, C.; Zhang, Y.; Nordlander, P.; Halas, N.J. Hot-Electron-Induced Dissociation of H2on Gold Nanoparticles Supported on SiO2. J. Am. Chem. Soc. 2014, 136, 64–67. [Google Scholar] [CrossRef] [PubMed]
  10. Brown, A.M.; Sundararaman, R.; Narang, P.; Goddard, I.W.A.; Atwater, H.A. Nonradiative Plasmon Decay and Hot Carrier Dynamics: Effects of Phonons, Surfaces, and Geometry. ACS Nano 2016, 10, 957–966. [Google Scholar] [CrossRef] [PubMed]
  11. Sundararaman, R.; Narang, P.; Jermyn, A.S.; Iii, W.A.G.; Atwater, H.A. Theoretical predictions for hot-carrier generation from surface plasmon decay. Nat. Commun. 2014, 5, 5788. [Google Scholar] [CrossRef] [PubMed]
  12. Wang, Y.; Shi, H.; Shen, L.; Wang, Y.; Cronin, S.B.; Dawlaty, J.M. Ultrafast Dynamics of Hot Electrons in Nanostructures: Distinguishing the Influence on Interband and Plasmon Resonances. ACS Photonics 2019, 6, 2295–2302. [Google Scholar] [CrossRef]
  13. Wang, Y.; Aravind, I.; Cai, Z.; Shen, L.; Gibson, G.N.; Chen, J.; Wang, B.; Shi, H.; Song, B.; Guignon, E.F.; et al. Hot Electron Driven Photocatalysis on Plasmon-Resonant Grating Nanostructures. ACS Appl. Mater. Interfaces 2020, 12, 17459–17465. [Google Scholar] [CrossRef] [PubMed]
  14. Wang, Y.; Shen, L.; Wang, Y.; Hou, B.; Gibson, G.N.; Poudel, N.; Chen, J.; Shi, H.; Guignon, E.; Cady, N.C.; et al. Hot electron-driven photocatalysis and transient absorption spectroscopy in plasmon resonant grating structures. Faraday Discuss. 2019, 214, 325–339. [Google Scholar] [CrossRef] [PubMed]
  15. Shen, L.; Poudel, N.; Gibson, G.N.; Hou, B.; Chen, J.; Shi, H.; Guignon, E.; Page, W.D.; Pilar, A.; Cronin, S.B. Plas-mon resonant amplification of a hot electron-driven photodiode. Nano Res. 2018, 11, 2310–2314. [Google Scholar] [CrossRef]
  16. Shen, L.; Gibson, G.N.; Poudel, N.; Hou, B.; Chen, J.; Shi, H.; Guignon, E.; Cady, N.C.; Page, W.D.; Pilar, A.; et al. Plasmon resonant amplification of hot electron-driven photocatalysis. Appl. Phys. Lett. 2018, 113, 113104. [Google Scholar] [CrossRef] [Green Version]
  17. Lo, H.Y.; Chan, C.Y.; Ong, H.C. Direct measurement of radiative scattering of surface plasmon polariton reso-nance from metallic arrays by polarization-resolved reflectivity spectroscopy. Appl. Phys. Lett. 2012, 101, 223108. [Google Scholar] [CrossRef]
  18. Wonjoo, S.; Zheng, W.; Shanhui, F. Temporal coupled-mode theory and the presence of non-orthogonal modes in lossless multimode cavities. IEEE J. Quantum Electron. 2004, 40, 1511–1518. [Google Scholar] [CrossRef] [Green Version]
  19. Seok, T.J.; Jamshidi, A.; Kim, M.; Dhuey, S.; Lakhani, A.; Choo, H.; Schuck, P.J.; Cabrini, S.; Schwartzberg, A.M.; Bokor, J.; et al. Radiation Engineering of Optical Antennas for Maximum Field Enhancement. Nano Lett. 2011, 11, 2606–2610. [Google Scholar] [CrossRef] [Green Version]
  20. Liu, X.; Gao, J.; Wang, Y.; Wang, X.; Yang, H.; Hu, H.; Gao, J.; Bourouina, T.; Cui, T. Simultaneous field enhancement and loss inhibition based on surface plasmon polariton mode hybridization. Nanophotonics 2020, 9, 2809–2816. [Google Scholar] [CrossRef]
  21. Maier, S.A. Plasmonic field enhancement and SERS in the effective mode volume picture. Opt. Express 2006, 14, 1957–1964. [Google Scholar] [CrossRef]
  22. Cao, Z.; Zhang, L.; Chan, C.Y.; Ong, H.C. Interplay between absorption and radiative decay rates of surface plasmon polaritons for field enhancement in periodic arrays. Opt. Lett. 2014, 39, 501–504. [Google Scholar] [CrossRef]
  23. Krishnan, A.; O’Gorman, A.B.; Povinelli, M.L. Design of switchable, narrowband thermal absorption peaks in met-al-vanadium-dioxide gratings. J. Opt. 2020, 22, 094002. [Google Scholar] [CrossRef]
  24. Cao, Z.; Lo, H.-Y.; Ong, H.-C. Determination of absorption and radiative decay rates of surface plasmon polaritons from nanohole array. Opt. Lett. 2012, 37, 5166–5168. [Google Scholar] [CrossRef]
  25. Johnson, S.G. The NLopt Nonlinear-Optimization Package. Available online: http://github.com/stevengj/nlopt (accessed on 26 January 2021).
  26. Cao, Z.L.; Ong, H.C. Determination of the absorption and radiative decay rates of dark and bright plasmonic modes. Opt. Express 2014, 22, 16112–16129. [Google Scholar] [CrossRef]
Figure 1. (a) Cross-sectional SEM image of the fabricated corrugated grating. (b) The refractive index profile of the structure modelled by Equation (1).
Crystals 11 00118 g001
Figure 2. Simulated absorption of gratings plotted as a function of incident angle and wavelength (top) and resonant wavelength for different incident angles for each mode using Equation (1) (bottom).
Crystals 11 00118 g002
Figure 3. (top row) The absorption spectra numerically obtained from finite difference time domain (FDTD) simulations (markers) and fitted spectra from Equation (6) (solid lines) (top row). Corresponding resonant field enhancements at 633 nm (middle row) and 785 nm (bottom row).
Crystals 11 00118 g003
Figure 4. Loss rates of resonant modes at 633 nm and 785 nm for the initial grating geometry of different material systems.
Crystals 11 00118 g004
Figure 5. Field enhancement at 633 nm and 785 for different metal gratings under consideration as a function of A and σ . The white dot represents the initial grating structure and yellow star represents the optimized geometry.
Crystals 11 00118 g005
Figure 6. (top row) The absorption spectra numerically obtained from FDTD simulations (dots) and fitted spectra from Equation (3) (solid lines) for the optimum structure of each metal. Corresponding resonant field enhancements at 633 nm (middle row) and 785 nm (bottom row).
Crystals 11 00118 g006
Figure 7. Loss rates of resonant modes at 633 nm and 785 nm for the optimized geometry of different material systems.
Crystals 11 00118 g007
Table 1. Values of corrugation amplitude ( A ) and steepness factor ( σ ) that yield maximum field enhancement at 633 nm and 785 nm.
Original GratingsOptimized Geometry
A (nm)σ (nm) I avg   633   nm I avg   785   nm A (nm)σ (nm) I avg   633   nm I avg   785   nm
Ag58.91257.056.0441.423513.0023.00
Au58.91254.374.8546.21985.9017.60
Al58.91255.145.8259.51987.067.44
Cu58.91253.654.7750.52154.4712.20
Pt58.91251.501.9795.71781.732.48
Publisher’s Note: MDPI stays neutral with regard to jurisdictional claims in published maps and institutional affiliations.

