Article

Simultaneous Detection of Relative Humidity and Temperature Based on Silicon On-Chip Cascaded Photonic Crystal Nanobeam Cavities

1
State Key Laboratory of Information Photonics and Optical Communications, School of Information and Communication Engineering, Beijing University of Posts and Telecommunications, Beijing 100876, China
2
International School, Beijing University of Posts and Telecommunications, Beijing 100876, China
*
Authors to whom correspondence should be addressed.
These authors contributed equally to this work and should be considered co-first authors.
Crystals 2021, 11(12), 1559; https://doi.org/10.3390/cryst11121559
Submission received: 19 September 2021 / Revised: 6 November 2021 / Accepted: 7 November 2021 / Published: 14 December 2021
(This article belongs to the Special Issue Micro and Nano Optics for Advanced Sensing Technology)

Abstract

:
In this paper, we propose and numerically demonstrate a novel cascaded silicon-on-insulator (SOI) photonic crystal nanobeam cavity (PCNC) dual-parameter sensor for the simultaneous detection of relative humidity (RH) and temperature. The structure consists of two independent PCNCs supporting two different resonant modes: a dielectric-mode and an air-mode, respectively. The dielectric-mode nanobeam cavities (cav1) are covered with SU-8 cladding to increase the sensitivity ratio contrast between RH sensing and temperature sensing. The air-mode nanobeam cavities (cav2) are coated with a water-absorbing polyvinyl-alcohol (PVA) layer that converts the change in RH into a change in refractive index (RI) under different ambient RH levels, thereby inducing a wavelength shift. Due to the positive thermo-optic (TO) coefficient of silicon and the negative TO coefficient of SU-8 cladding, the wavelength responses take the form of a red shift for cav2 and a blue shift for cav1 as the ambient temperature increases. By using 3D finite-difference time-domain (3D-FDTD) simulations, we prove the feasibility of simultaneous sensing by monitoring a single output transmission spectrum and applying the sensor matrix. For cav1, the RH and temperature sensitivities are 0 pm/%RH and −37.9 pm/K, while those of cav2 are −389.2 pm/%RH and 58.6 pm/K. The sensitivity ratios of temperature and RH are −1.5 and 0, respectively, which is the reason for designing two different resonant modes and also implies great potential for realizing dual-parameter sensing detection. In particular, it is also noteworthy that we demonstrate the ability of the dual-parameter sensor to resist external interference by using the dual wavelength matrix method. The maximum RH and temperature detection errors caused by the deviation of resonance wavelength 1 pm are only 0.006% RH and 0.026 K, which indicates that it achieves an excellent anti-interference ability. Furthermore, the structure is very compact, occupying only 32 μm × 4 μm (length × width). Hence, the proposed sensor shows promising prospects for compact lab-on-chip integrated sensor arrays and sensing with multiple parameters.

1. Introduction

Humidity sensors have attracted increasing attention due to their wide potential for application in the areas of food preservation, meteorology, chemical processing, etc. Many technologies have been developed for relative humidity (RH) sensing, such as electrical sensors, mechanical sensors, and optical sensors [1,2,3]. However, the RH sensors utilizing optical detection methods show many advantages in terms of their anti-electromagnetic interference, mechanical robustness, small size, and high sensitivity [4,5]. Over the years, optical RH sensors have been successfully developed by coating various sensitive hygroscopic materials, such as agarose [6], polyimide (PI) [7], polymethyl methacrylate (PMMA) [4], and polyvinyl-alcohol (PVA) [2,8,9,10]. In addition, different types of structures have also been designed to achieve humidity sensing, including the fiber-based Fabry–Pérot interferometer (FPI) [8,11], U-shaped microfiber [9], fiber Bragg gratings (FBG) [12], and SOI-based microcavities [2,4,10,13]. However, in the age of chip-integrated circuits, existing all-fiber-based sensors cannot meet future needs due to CMOS incompatibility and fragility [4,14].
In recent years, SOI-based microcavity has become a favorable platform due to its low packaging cost, mechanical strength, small size, and easy integration [2,15]. Nevertheless, the RH sensors mentioned above often lose sight of the influence of temperature on humidity, leading to inaccuracy in the detection results. As we all know, RH is defined as the ratio of water vapor pressure in the air to that in saturated water at an identical temperature [5], which is generally related to the temperature. Consequently, humidity sensing is meaningful only if the temperature is taken into consideration [16]. RH and temperature are two key factors that mainly affect comfort degree, which both must be measured in a variety of environments. Driven by this, there is a great demand for sensors capable of accurately detecting RH and temperature [17]. For example, Ding et al. innovatively put forward a dual-parameter sensor for the simultaneous detection of RH and temperature, which uses a dual-polarization SOI-based microring resonator with a radius of 20 microns and a PVA upper cladding layer, showing RH sensitivities of 97.0 pm/%RH and 325.1 pm/%RH and temperature sensitivities of 69.0 pm/K and 30.6 pm/K [2]. So far, this is the first lab-on-chip optical sensor which can measure RH and temperature simultaneously. While microring resonator sensors have shown good results, they may ultimately be limited to a relatively large size. There are also other types of optical sensors. For example, Abbas Madani innovatively investigated optofluidic applications of fully on-chip integrated microtubular systems both by filling the core of the microtube and by the microtube being covered by a liquid droplet [18]. Simultaneously, Ian M. White demonstrated a novel sensor architecture based on a liquid-core optical ring-resonator (LCORR) in which a fused silica capillary was utilized to carry the aqueous sample and to act as the ring resonator [19]. However, compared with on-chip resonators (e.g., microring resonator [2], 2D-PhC cavities [10]), SOI-based photonic crystal nanobeam cavities (PCNCs) are very promising in on-chip integration owing to their attractive characteristics of ultra-high Q/V, ultra-compact size, flexible structure design, and ease of integration [20,21]. Furthermore, PCNCs are suitable for dual-parameter sensing because these structures can be designed cleverly to support various resonant modes, such as waveguide side-coupled double-cavity [15] and single multimode cavity [22,23].
In this study, we first present an SOI-based cascaded PCNCs dual-parameter sensor for the simultaneous accurate detection of RH and temperature. The sensor consists of two carefully designed PCNCs, supporting dielectric-mode and air-mode, respectively. Since the optical mode distributions in the presented structures are quite different, they exhibit different sensitivities under varying external RH levels and temperatures [24,25,26], which provides the possibility to realize simultaneous detection. We also analyze the sensitivity of the sensor to humidity and temperature in a numerical simulation, verify the feasibility of dual-parameter sensing, and eventually discuss the anti-interference ability.

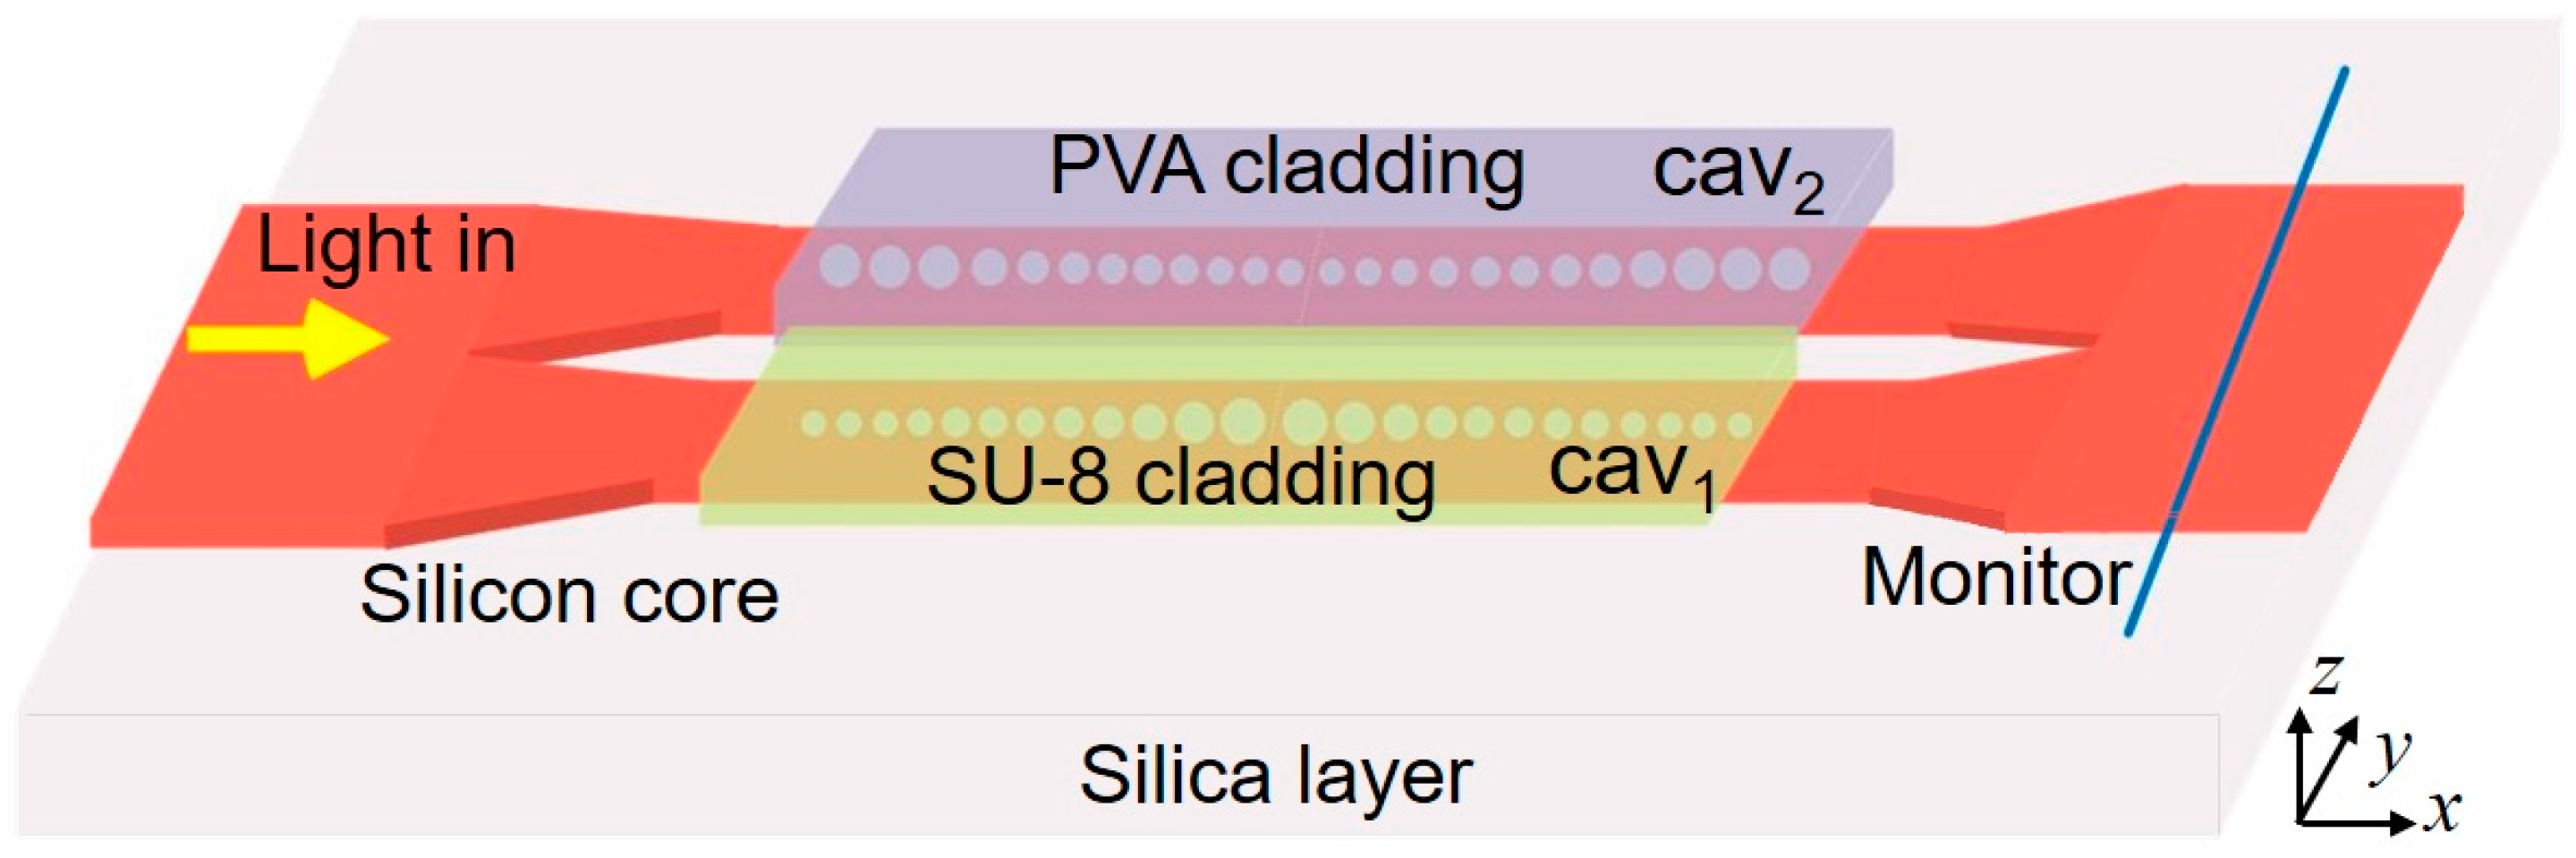
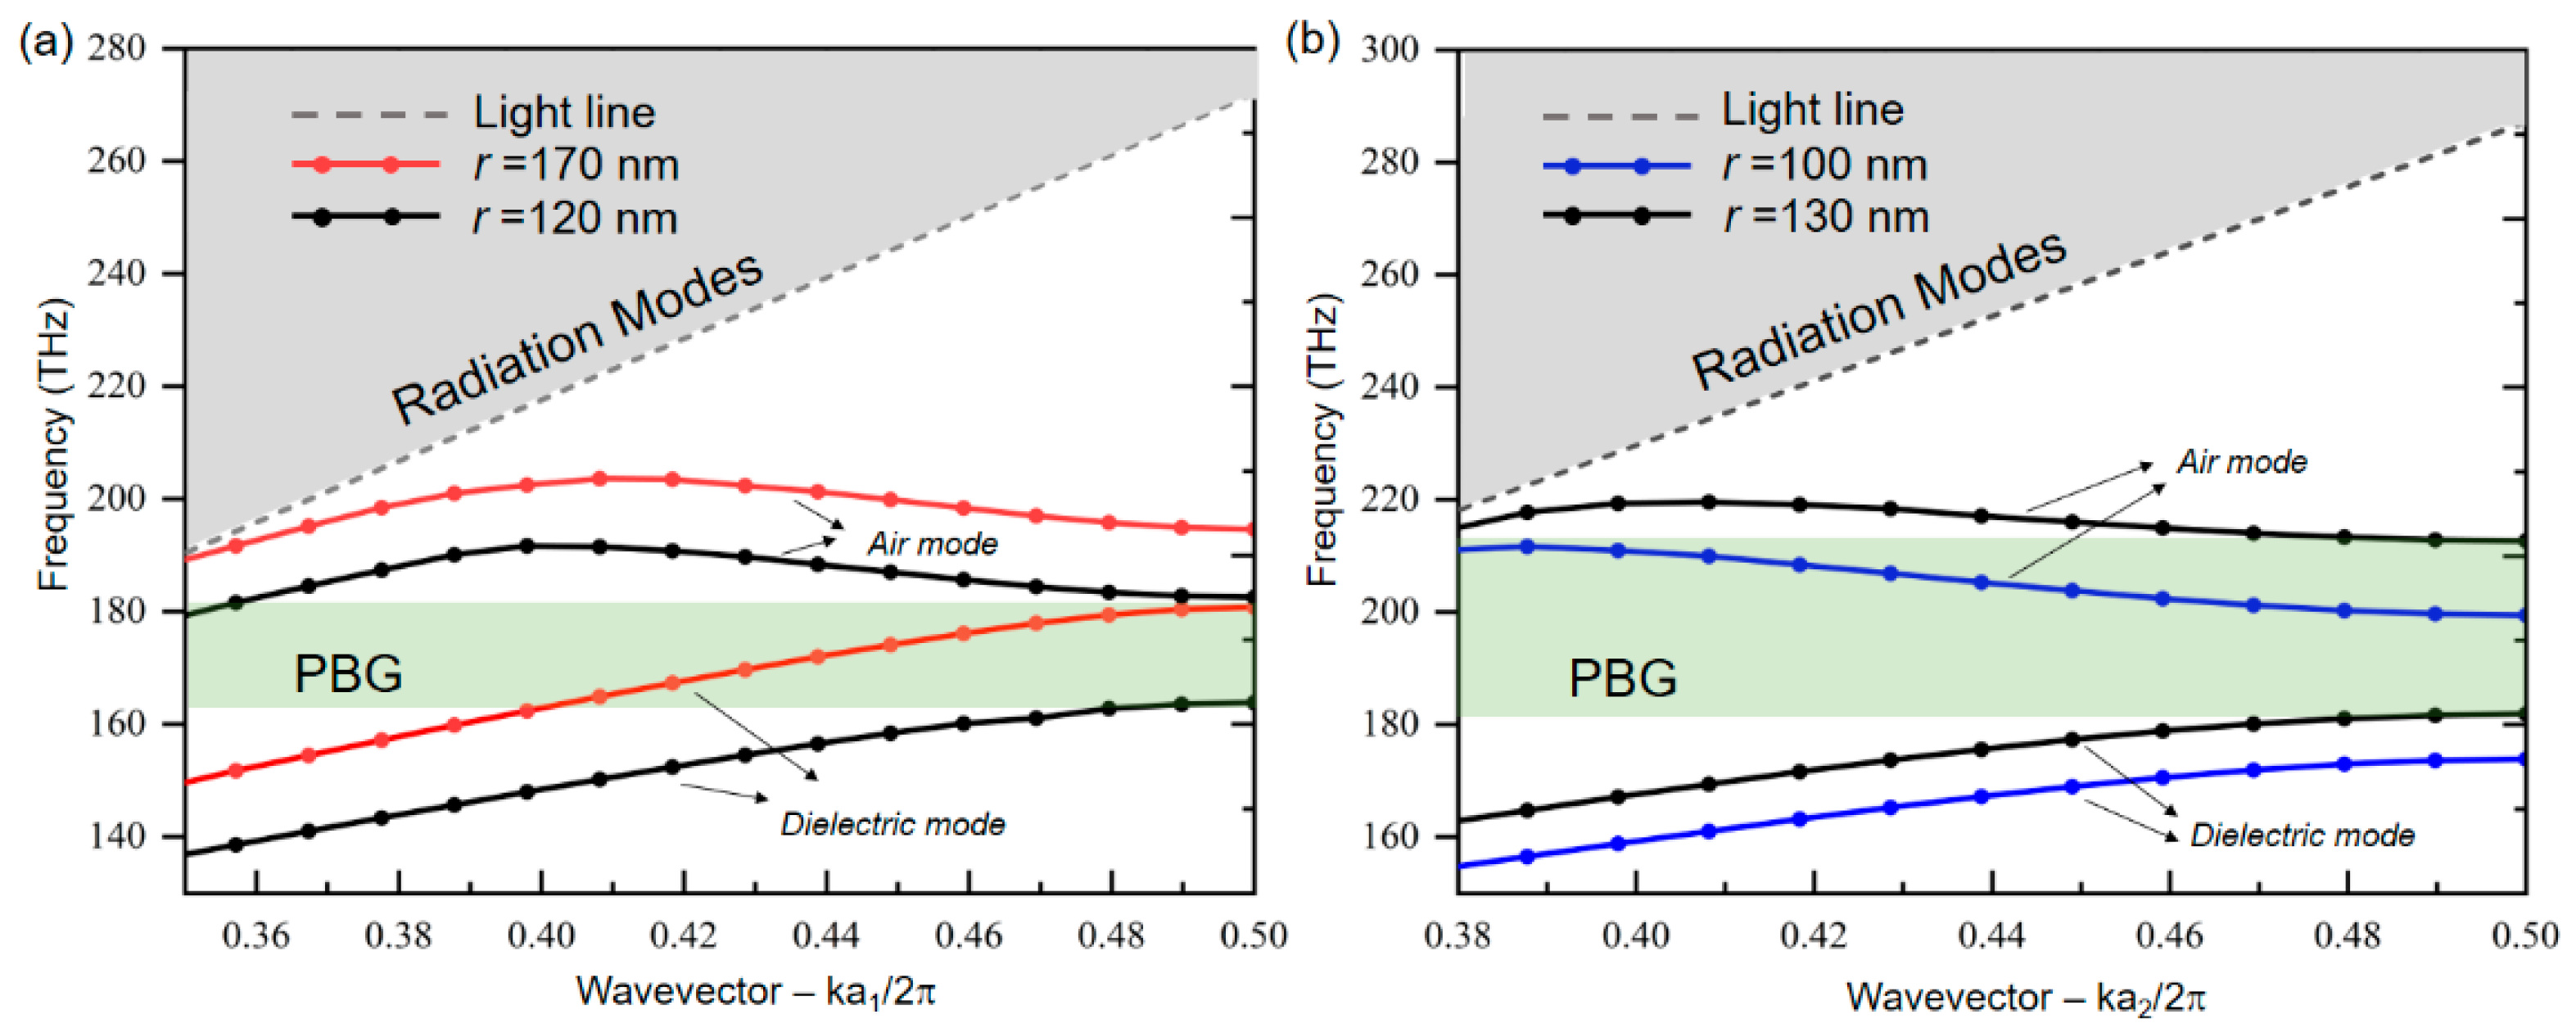
2. Design and Optimization of PCNCs

A schematic diagram of the proposed SOI-based cascaded PCNCs dual-parameter sensor is shown in Figure 1. It is composed of two independent resonant-mode nanobeam cavities, cav1 and cav2, which are placed on a buried silica layer. The cav1 and cav2 are connected by a Y-junction power splitter and a power combiner [27]. The cav1 is coated with an SU-8 cladding (light yellow region), while the cav2 is coated with a layer of PVA upper cladding (light blue region). The RIs of the silica layer (nsilica), silicon core (nsi), dry PVA cladding (nPVA), and SU-8 cladding (nSU-8) are, respectively, 1.45, 3.46, 1.49, and 1.57 [2,26]. The corresponding thickness of each layer is set to 2 μm, 220 nm, 2 μm, and 2 μm, respectively.
In terms of the cavity design, the two PCNCs were designed and optimized according to the deterministic design method of Quan et al. [28,29] and validated using commercial 3D-FDTD software simulations. During the simulations, a non-uniform mesh was used to automatically adapt to the periodicity of our simulation modes. An accuracy of 3 was selected, which is a fine compromise between accuracy, memory requirements, and simulation time. The boundary conditions were all set as perfectly matched layer (PML). TE band diagrams of the two PCNCs with Bloch boundary conditions were calculated to determine the target resonant mode where the working wavelength was around 1550 nm, as shown in Figure 2a for dielectric-mode nanobeam cavities (cav1) and Figure 2b for air-mode nanobeam cavities (cav2). When introducing the frequency defect into the photonic band gap (PBG), we chose the usual method—i.e., quadratically modulating the radius of the holes.
The top view schematics of cav1 and cav2 are given in Figure 3a,d. For cav1, the periodicity a1 = 375 nm remained unchanged. The radius of the circular hole decreased parabolically from center rcenter = 170 nm to rend = 120 nm on both sides in the taper region, ri = rcenter + (i − 1)2(rendrcenter)/(Nt − 1)2, in which i increases from 1 to Nt and Nt represents the number of taper region holes. The hole radius remains unchanged as rend = 120 nm and Nm represents the number of holes in the mirror region. For cav2, the periodicity a2 = 360 nm was kept fixed. The radius of the circular hole increased parabolically from center rcenter = 100 nm to rend = 130 nm on both sides in the taper region. The radius of the mirror region was set as rend = 130 nm. The two nanobeam widths were 700 nm. Figure 3b,e show the corresponding major electric field distribution along the PCNCs for the x–y plane when z = 0. Apparently, the optical mode was strongly confined inside the high-index silicon core (cav1) and low-index PVA cladding (cav2) area, respectively, leading to different light–matter interactions. The Ey distribution in the x-direction is shown more clearly in Figure 3c,f, and it can be found that the light field distribution of the two resonant cavities was indeed different, leading to significant differences in the wavelength shift responses to the variations in the RH and temperature of the external environment.
The Nt and Nm were investigated in detail by a series of individual 3D-FDTD simulations in the hopes of achieving a higher-quality (Q)-factor and high-transmission PCNCs. In Figure 4a, the dependence of the Q-factor and the resonant wavelength on Nt for cav1 is illustrated. As shown, with the increase in Nt, the Q-factor improved and the resonant wavelength moved to a shorter wavelength. In ure 4b, the relationship between the Q-factor and the transmission on Nm for cav1 when Nt = 12 is presented. Obviously, the Q-factor continued to increase but the transmission decreased significantly with the increase in Nm. Here, to save the simulation calculation time while keeping a reasonable footprint, we chose a high transmission of 0.62 but a relatively low Q-factor geometry with Nt = 12, Nm = 2 in the following simulation, and the Q-factor could reach 2.2 × 10⁴. For cav2, the dependence of the Q-factor and the resonant wavelength on Nt is displayed in Figure 4c. The Q-factor improved and resonant wavelength moved to a longer wavelength as Nt increased. The relationship of the Q-factor and transmission on Nm for cav2 when Nt = 12 is presented in Figure 4d. For the same reason, Nt = 12 and Nm = 2 were chosen, while the Q-factor reached 2.0 × 10⁴ and the transmission was about 0.63.

3. Dual-Parameter Sensing for RH and Temperature

3.1. Basis of Dual-Parameter Sensing

In order to restrain crosstalk between resonant modes, two independent resonant cavities were cascaded to meet the requirements of dual-parameter detection. The power splitter consisted of a 4 μm-wide silicon input waveguide and two tapered silicon waveguides. Figure 5b shows that the widths of the two waveguides gradually decreased from 2 μm to 0.7 μm. To improve the coupling efficiency, the end width of one arm equaled the nanobeam width. The combiner and power splitter were symmetrical. As shown in Figure 5a, it can be observed that the low-loss output transmission of one arm could reach over 41% (red line) and the output of the combiner could reach 82% (blue line) in the wavelength range of 1450–1650 nm. Figure 5c shows the corresponding electric field distribution of the power splitter near 1550 nm.
As exhibited in Figure 6a, the two independent resonant peaks have a wavelength window of 82.17 nm, which is sufficient for dual-parameter sensor detection. The corresponding major electromagnetic field distributions (the x–y plane with z = 0) of PCNCs are shown in Figure 6b,c. Since the influence of temperature on RH detection cannot be neglected, we theoretically conducted the simultaneous detection of RH changes and temperature variations using a series of individual 3D-FDTD simulations.
According to the data regarding the concrete RI values of PVA cladding in conditions with different RH levels provided in [25], when RH increases from 0% RH to 90% RH, the transmission spectrum at a fixed temperature of 300 K is observed as shown in Figure 7a. As captured in this diagram, the resonant wavelength responses present a blue shift for cav2, while the wavelength responses are kept fixed for cav1, since the light field is mainly localized inside the silicon. As seen in Figure 7b, by extracting the simulated data within the broad range of 40% RH~90% RH, the resonant wavelength shows an approximately linear relationship with the RH level for cav2. The slope of linear fitting represents the RH sensitivity, SRH,cav1 (defined as cav1/dRH) and SRH,cav2 (defined as cav2/dRH), which were calculated as 0 pm/%RH and −389.2 pm/%RH, respectively. Figure 7c plots the transmission spectrum with ambient temperature in the range of 300 K~340 K at a fixed RH = 40% RH. Because of the high negative thermo-optic (TO) coefficient of the SU-8 cladding (∂nsu-8/∂T = −3.5(10−4 K−1) and the positive TO coefficient of silicon (∂nsi/∂T = 1.8(10−4 K−1), the resonant wavelength responses present a blue shift for cav1 and a red shift for cav2 when the temperature rises. Figure 7d shows the fitting results of the wavelength shift. The temperature sensitivities, ST,cav1 (defined as cav1/dT) and ST,cav2 (defined as cav2/dT), were fitted as −37.9 pm/K and 58.6 pm/K, respectively. Correspondingly, the sensitivity ratios for RH and temperature were calculated to be SRH,cav2/SRH,cav1 = 0 and ST,cav2/ST,cav1 = −1.5.

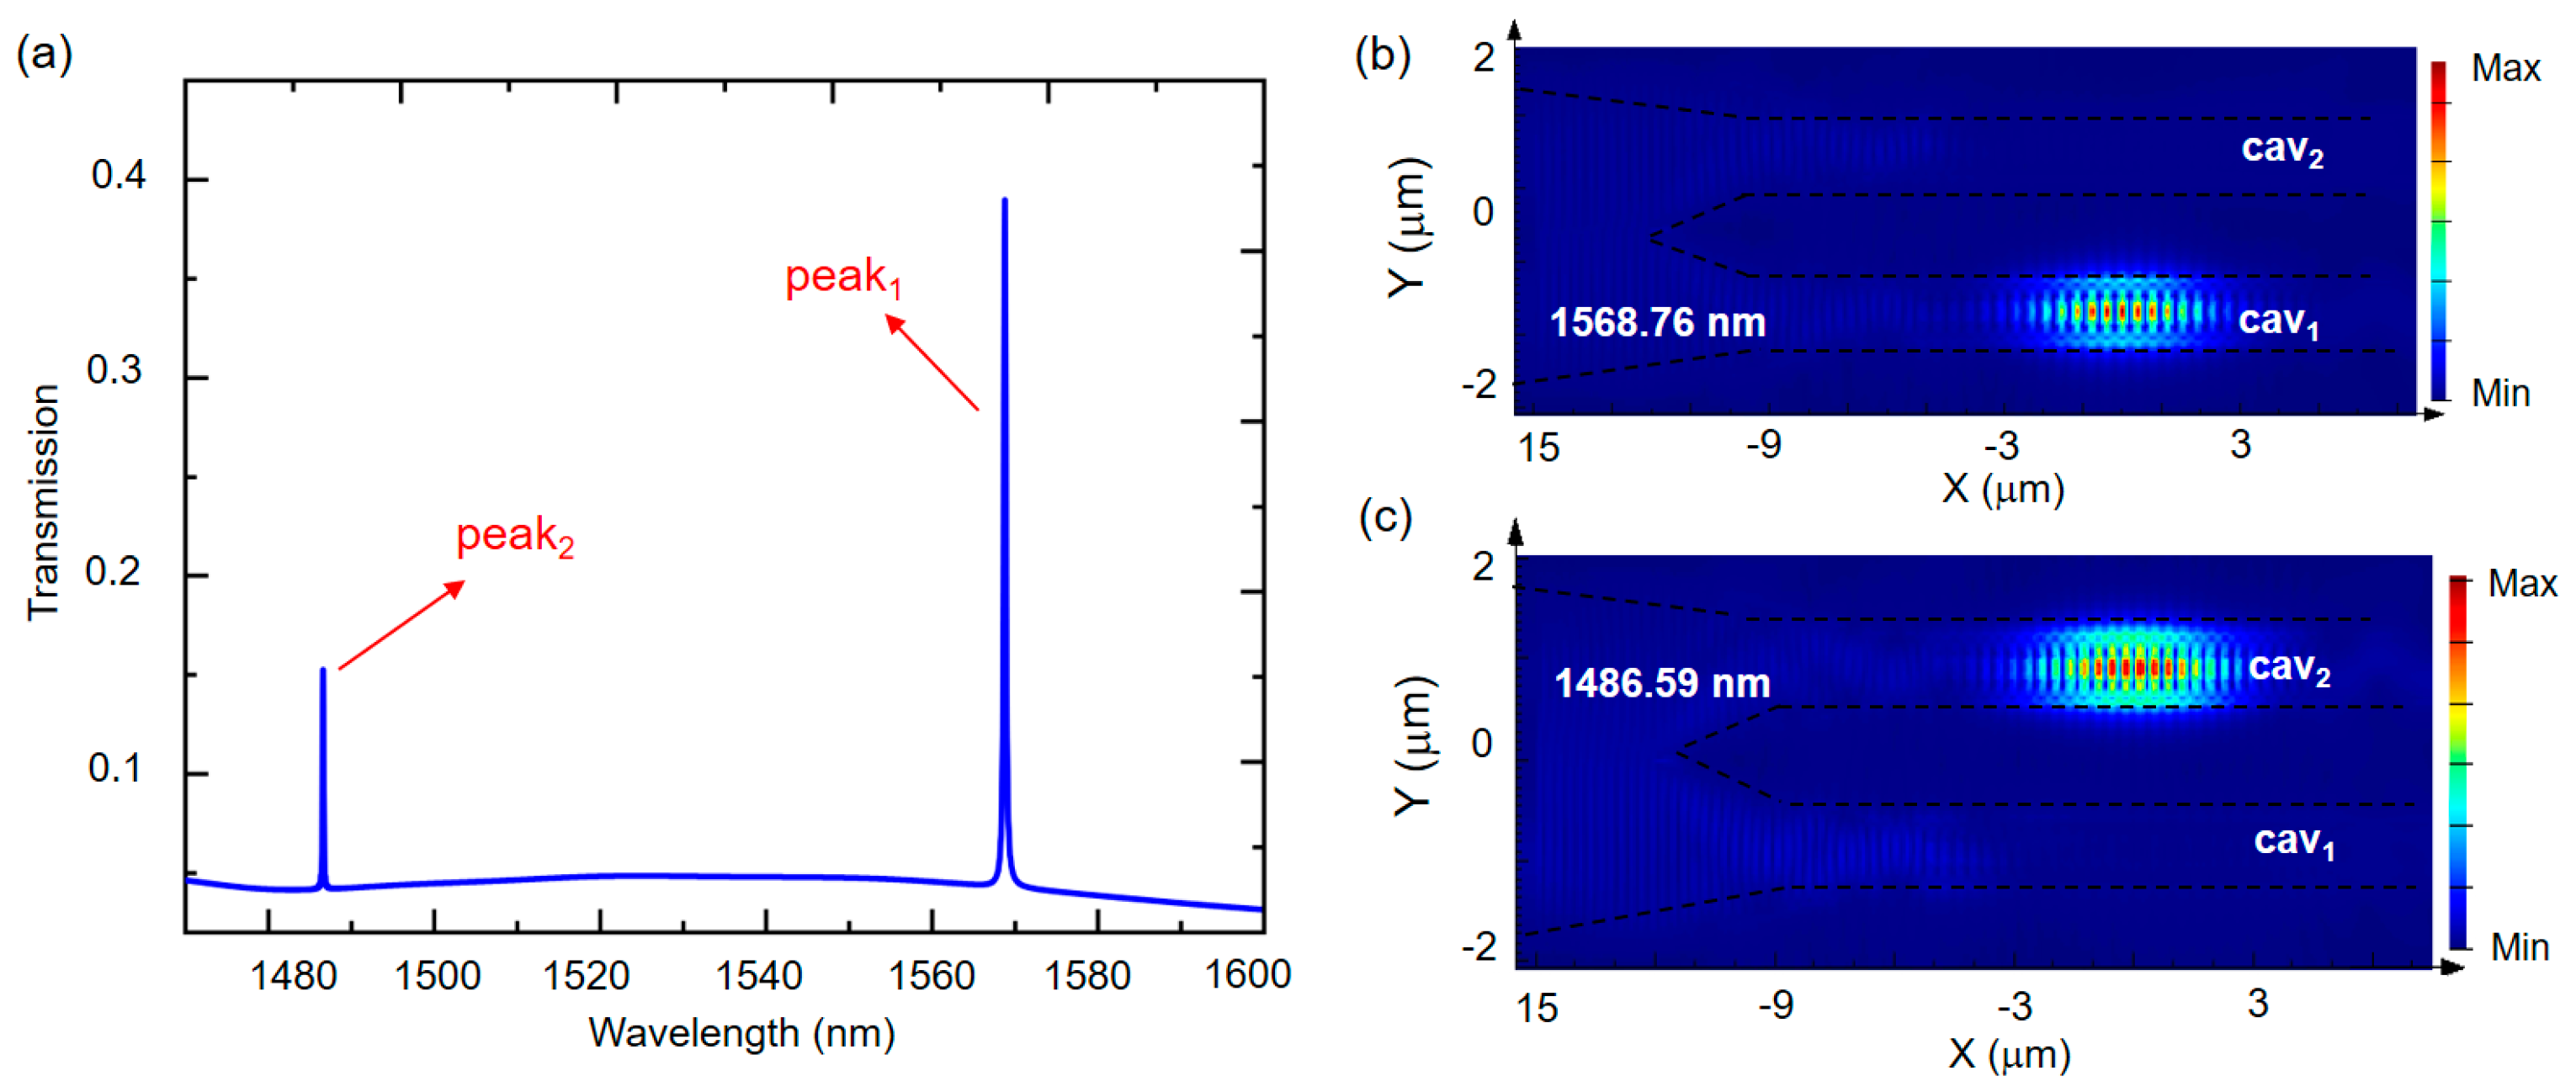
3.2. Analysis of Dual-Parameter Sensing

The proposed SOI-based cascaded PCNCs dual-parameter sensor feasibility analysis can be conducted by defining a sensitivity matrix based on the dual-wavelength matrix method [15] as follows:
M R H , T = [ S R H , c a v 1 S T , c a v 1 S R H , c a v 2 S T , c a v 2 ] = [ 0 37.9 p m K 389.2 p m % R H 58.6 p m K ]
Then, the correlations between the two detected resonant peaks shift (Δλ1, Δλ2) and the changes in RH (ΔRH) and temperature (ΔT) are described as Equation (2):
[ Δ λ 1 Δ λ 2 ] = M R H , T [ Δ R H Δ T ]
According to the different sensitivity ratios calculated before—that is, the sensitivity matrix is full rank |MRH,T| ≠ 0—Equation (3) has a unique solution, which means that the presented structure can be applied to sense RH and temperature simultaneously. Therefore, ΔRH and ΔT can be represented by Equation (3):
[ Δ R H Δ T ] = M R H , T 1 [ Δ λ 1 Δ λ 2 ]
Substituting the sensitivity value, we can obtain the following results:
[ Δ R H Δ T ] = 1 M R H , T [ S T , c a v 2 S T , c a v 1 S R H , c a v 2 S R H , c a v 1 ] [ Δ λ 1 Δ λ 2 ] = 1 14750.7 [ 58.6 % R H p m 37.9 % R H p m 389.2 K p m 0 ] [ Δ λ 1 Δ λ 2 ]
In the detection process, as long as the resonance wavelength shift of two resonance peaks is obtained, ΔRH and ΔT can be obtained by calculating Equation (4) and the current RH and temperature can be obtained by adding the initial RH and initial temperature, thus achieving the purpose of dual-parameter sensing. However, the resonance wavelength shift detection results’ accuracy may be affected by systems errors, the non-detected parameters, and the absolute accuracy of the optical spectrum analyzer (OSA) [26]. To check the anti-interference ability of the sensor, we simulated the external interference under practical conditions. Specifically, based on Equation (3), external interference was introduced into the two resonant wavelength shifts of cav1λi1) and cav2λi2), and Equation (3) could be modified as follows:
[ Δ R H Δ T ] = M R H , T 1 [ Δ λ 1 + Δ λ i 1 Δ λ 2 + Δ λ i 2 ]
According to Equation (5), the RH error (ΔRHerror) and temperature error (ΔTerror) caused by external interference can be represented by Equation (6):
[ Δ R H error   Δ T error   ] = M R H , T 1 [ Δ λ i 1 Δ λ i 2 ] = 1 M R H , T [ S T , c a v 2 S T , c a v 1 S R H , c a v 2 S R H , c a v 1 ] [ Δ λ i 1 Δ λ i 2 ]
where the determinant |MRH,T| can be calculated as: |MRH,T| = SRH,cav1 ST,cav2 − SRH,cav2 ST,cav1. Moreover, the smaller the maximum value of ΔRHerrorRHerror;max) and ΔTerrorTerror;max), the stronger the anti-interference ability, that is, the better the stability of the dual-parameter sensor. Therefore, the maximum external interference scope (ξRH, ξT) was introduced to evaluate the anti-interference ability [26], which is computable with the following equations:
{ ξ R H = | S T , c a v 2 | M R H , T | | + | S T , c a v 1 | M R H , T | | ξ T = | S R H , c a v 2 | M R H , T | | + | S R H , c a v 1 | M R H , T | |
It is accurately analyzed that the lower the ξRH and ξT, the smaller the ΔRHerror;max and ΔTerror;max, and the stronger the immunity to interference. The ξRH as well as the ξT of the dual-sensor previously proposed are 0.006 and 0.026, respectively, suggesting that the maximum RH and temperature test errors caused by the deviation of resonant wavelength 1 pm are merely 0.006% RH and 0.026 K. Therefore, the sensor proposed is expected to provide an excellent level of immunity from interference and shows a good stability. For comparison purposes, a summary of other structures based on RH and temperature sensors is given in Table 1.
In this table, we can note that the proposed sensor improves RH sensitivities and obtains competitive temperature sensitivities. In addition, by optimizing the two PCNCs structures using stack-width modulated PCNCs or replacing PVA with some other sensitive materials (e.g., graphene oxide diaphragm) [26,33], the sensitivities may be further improved.

4. Conclusions

To sum up, our study theoretically presents an SOI-based cascaded PCNCs dual-parameter sensor and demonstrates its feasibility for accurate simultaneous RH and temperature detection. The sensor structure consists of two independent PCNCs, one of which is covered in SU-8 cladding (cav1) to improve the sensitivity ratio contrast, while and the other is coated with a water-absorbing PVA layer as the sensing cladding to detect the variation in RH. For cav1, the RH and the temperature sensitivity are 0 pm/%RH and −37.9 pm/K, while those of cav2 are −389.2 pm/%RH and 58.6 pm/K. Note that the sensitivity ratios of RH and temperature are 0 and −1.5, respectively, ensuring the feasibility of achieving simultaneous detection. In addition, the anti-interference ability of the sensor is analyzed by using the dual-wavelength matrix method under external interference in the detection process. Moreover, the compact size of the structure is only 32 μm × 4 μm (length × width). With its compact size, simple design, competitive sensitivities, and excellent anti-interference ability, our proposed sensor will contribute to the future of on-chip integrated sensing systems and multifunctional detection.

Author Contributions

Conceptualization, D.Y.; methodology, K.G. and S.L.; software, X.L. (Xiao Liu) and J.P.; validation, L.Y. and D.P.; formal analysis, L.Y. and X.L. (Xiao Liu); investigation, L.Y.; writing—original draft preparation, L.Y. and X.L. (Xiao Liu); writing—review and editing, J.P.; supervision, X.Z.; project administration, X.C. and X.L. (Xiaogang Li); funding acquisition, D.Y. All authors have read and agreed to the published version of the manuscript.

Funding

This work was supported by National Natural Science Foundation of China (11974058); Beijing Nova Program (Z201100006820125) from Beijing Municipal Science and Technology Commission; Beijing Natural Science Foundation (Z210004); and State Key Laboratory of Information Photonics and Optical Communications (IPOC2021ZT01), BUPT, China.

Institutional Review Board Statement

Not applicable.

Informed Consent Statement

Not applicable.

Data Availability Statement

Not applicable.

Acknowledgments

The authors would like to thank Zhe Han, Yuanyuan Guo and Wen Chen for helpful discussions.

Conflicts of Interest

The authors declare no conflict of interest.

References

  1. Chen, Z.; Lu, C. Humidity Sensors: A Review of Materials and Mechanisms. Sens. Lett. 2005, 3, 274–295. [Google Scholar] [CrossRef] [Green Version]
  2. Ding, Z.; Liu, P.; Chen, J.; Dai, D.; Shi, Y. On-chip simultaneous sensing of humidity and temperature with a dual-polarization silicon microring resonator. Opt. Express 2019, 27, 649–28659. [Google Scholar] [CrossRef]
  3. López-Higuera, J.M.; Cobo, L.R.; Incera, A.Q.; Cobo, A. Fiber optic sensors in structural health monitoring. J. Light. Technol. 2011, 29, 587–608. [Google Scholar] [CrossRef]
  4. You, M.; Lin, Z.; Wang, F.; Bai, Y.; Li, X.; Su, Y.; Liu, J. Chip-scale humidity sensor based on a silicon nanobeam cavity. Opt. Lett. 2019, 44, 5322–5325. [Google Scholar] [CrossRef] [PubMed]
  5. Sikarwar, S.; Yadav, B.C. Opto-electronic humidity sensor: A review. Sens. Actuators A Phys. 2015, 233, 54–70. [Google Scholar] [CrossRef]
  6. Wang, C.; Zhou, B.; Jiang, H.; He, S. Agarose filled Fabry–Perot cavity for temperature self-calibration humidity sensing. IEEE Photonics Technol. Lett. 2016, 28, 2027–2030. [Google Scholar] [CrossRef]
  7. Berruti, G.; Consales, M.; Giordano, M.; Sansone, L.; Petagna, P.; Buontempo, S.; Breglio, G.; Cusano, A. Radiation hard humidity sensors for high energy physics applications using polyimide-coated fiber Bragg gratings sensors. Sens. Actuators B 2013, 177, 94–102. [Google Scholar] [CrossRef]
  8. Sun, H.; Zhang, X.; Yuan, L.; Zhou, L.; Qiao, X.; Hu, M. An optical fiber Fabry–Perot interferometer sensor for simultaneous measurement of relative humidity and temperature. IEEE Sens. J. 2015, 15, 2891–2897. [Google Scholar] [CrossRef]
  9. Zhao, Y.; Peng, Y.; Chen, M.Q.; Tong, R.J. Humidity sensor based on unsymmetrical U-shaped microfiber with a polyvinyl alcohol overlay. Sens. Actuators B 2018, 263, 312–318. [Google Scholar] [CrossRef]
  10. Zhao, C.; Yuan, Q.; Fang, L.; Gan, X.; Zhao, J. High-performance humidity sensor based on a polyvinyl alcohol-coated photonic crystal cavity. Opt. Lett. 2016, 41, 5515–5518. [Google Scholar] [CrossRef]
  11. Peng, J.; Qu, Y.; Wang, W.; Sun, T.; Yang, M. Thin-film-based optical fiber Fabry–Perot interferometer used for humidity sensing. Appl. Opt. 2018, 57, 2967–2972. [Google Scholar] [CrossRef]
  12. Woyessa, G.; Fasano, A.; Markos, C.; Rasmussen, H.K.; Bang, O. Low loss polycarbonate polymer optical fiber for high temperature FBG humidity sensing. IEEE Photonics Technol. Lett. 2017, 29, 575–578. [Google Scholar] [CrossRef] [Green Version]
  13. Gan, X.; Zhao, C.; Yuan, Q.; Fang, L.; Li, Y.; Yin, J.; Ma, X.; Zhao, J. High performance graphene oxide-based humidity sensor integrated on a photonic crystal cavity. Appl. Phys. Lett. 2017, 110, 151107. [Google Scholar] [CrossRef]
  14. Peng, Y.; Zhao, Y.; Chen, M.Q.; Xia, F. Research advances in microfiber humidity sensors. Small 2018, 14, 1800524. [Google Scholar] [CrossRef]
  15. Liu, P.; Shi, Y. Simultaneous measurement of refractive index and temperature using cascaded side-coupled photonic crystal nanobeam cavities. Opt. Express 2017, 25, 28398–28406. [Google Scholar] [CrossRef]
  16. Zhang, Y.N.; Zhao, Y.; Hu, H.F. Miniature photonic crystal cavity sensor for simultaneous measurement of liquid concentration and temperature. Sens. Actuators B 2015, 216, 563–571. [Google Scholar] [CrossRef] [Green Version]
  17. Pevec, S.; Donlagic, D. Miniature all-silica fiber-optic sensor for simultaneous measurement of relative humidity and temperature. Opt. Lett. 2015, 40, 5646–5649. [Google Scholar] [CrossRef]
  18. Abbas, M.; Stefan, M.H.; Vladimir, A.B.Q.; Moritz, K.; Andreas, F.; Ehsan, S.G.N.; Libo, M.; Oliver, G.S. Optical microtube cavities monolithically integrated on photonic chips for optofluidic sensing. Opt. Lett. 2017, 42, 486–489. [Google Scholar]
  19. Ian, M.W.; Hesam, O.; Xudong, F. Liquid-core optical ring-resonator sensors. Opt. Lett. 2006, 31, 1319–1321. [Google Scholar]
  20. Yang, D.; Liu, X.; Li, X.; Duan, B.; Wang, A.; Xiao, Y. Photoic crystal nanobeam cavity devices for on-chip integrated silicon photonics. J. Semiconduc. 2020, 41, 023103. [Google Scholar] [CrossRef]
  21. Yang, D.; Duan, B.; Liu, X.; Wang, A.Q.; Li, X.; Ji, Y. Photonic crystal nanobeam cavities for nanoscale optical sensing: A review. Micromachines 2020, 11, 72. [Google Scholar] [CrossRef] [Green Version]
  22. Wang, C.; Fu, Z.; Sun, F.; Zhou, J.; Tian, H. Large-dynamic-range dual-parameter sensor using broad FSR multimode photonic crystal nanobeam cavity. IEEE Photonics J. 2018, 10, 6900914. [Google Scholar] [CrossRef]
  23. Wang, J.; Fu, Z.; Sun, F.; Wang, Z.; Wang, C.; Tian, H. Multiplexing dual-parameter sensor using photonic crystal multimode nanobeam cavities. Opt. Commun. 2018, 427, 382–389. [Google Scholar] [CrossRef]
  24. White, I.M.; Fan, X. On the performance quantification of resonant refractive index sensors. Opt. Express 2008, 16, 1020–1028. [Google Scholar] [CrossRef] [PubMed] [Green Version]
  25. Su, D.; Qiao, X.; Rong, Q.; Sun, H.; Zhang, J.; Bai, Z.; Du, Y.; Feng, D.; Hu, M.; Feng, Z. A fiber Fabry–Perot interferometer based on a PVA coating for humidity measurement. Opt. Commun. 2013, 311, 107–110. [Google Scholar] [CrossRef]
  26. Li, X.; Wang, C.; Wang, Z.; Fu, Z.; Sun, F.; Tian, H. Anti-external interference sensor based on cascaded photonic crystal nanobeam cavities for simultaneous detection of refractive index and temperature. J. Light. Technol. 2019, 37, 2209–2216. [Google Scholar] [CrossRef]
  27. Yang, D.; Wang, C.; Ji, Y. Silicon on-chip 1D photonic crystal nanobeam bandstop filters for the parallel multiplexing of ultra-compact integrated sensor array. Opt. Express 2016, 24, 16267–16279. [Google Scholar] [CrossRef]
  28. Quan, Q.; Loncar, M. Deterministic design of wavelength scale, ultra-high Q photonic crystal nanobeam cavities. Opt. Express 2011, 19, 18529–18542. [Google Scholar] [CrossRef] [PubMed] [Green Version]
  29. Quan, Q.; Deotare, P.B.; Loncar, M. Photonic crystal nanobeam cavity strongly coupled to the feeding waveguide. Appl. Phys. Lett. 2010, 96, 203102. [Google Scholar] [CrossRef] [Green Version]
  30. Zhang, S.; Dong, X.; Li, T.; Chan, C.; Shum, P. Simultaneous measurement of relative humidity and temperature with PCF-MZI cascaded by fiber Bragg grating. Opt. Commun. 2013, 303, 42–45. [Google Scholar] [CrossRef]
  31. Oliveira, R.; Bilro, L.; Marques, T.H.; Cordeiro, C.M.; Nogueira, R. Simultaneous detection of humidity and temperature through an adhesive based Fabry–Pérot cavity combined with polymer fiber Bragg grating. Opt. Laser Eng. 2019, 114, 37–43. [Google Scholar] [CrossRef]
  32. Tong, R.J.; Zhao, Y.; Zheng, H.K.; Xia, F. Simultaneous measurement of temperature and relative humidity by compact Mach-Zehnder interferometer and Fabry-Perot interferometer. Measurement 2020, 155, 107499. [Google Scholar] [CrossRef]
  33. Li, C.; Yu, X.; Zhou, W.; Cui, Y.; Liu, J.; Fan, S. Ultrafast miniature fiber-tip Fabry–Perot humidity sensor with thin graphene oxide diaphragm. Opt. Lett. 2018, 43, 4719–4722. [Google Scholar] [CrossRef] [PubMed]
Figure 1. Schematic diagram of the proposed SOI-based cascaded photonic crystal nanobeam cavities (PCNCs) dual-parameter sensor. The dielectric-mode nanobeam cavities (cav1) are covered by SU-8 cladding (light yellow region), while the air-mode nanobeam cavities (cav2) are coated with a layer of PVA upper cladding (light blue region).
Crystals 11 01559 g001
Figure 2. TE band diagram (a) for cav1 (b) for cav2 of the two independent PCNCs. Photonic bandgaps (PGB) are represented by light green regions.
Crystals 11 01559 g002
Figure 3. (a,d) Top-view schematics of cav1 and cav2, respectively. The two PCNCs are formed by modulating the radius of the holes quadratically to introduce a frequency defect. cav1 and cav2 are both strictly symmetric about the center blue dashed line. (b,e) The major electromagnetic field distribution (x–y plane with z = 0). (c,f) Ey distribution along this cavity in the x-direction.
Crystals 11 01559 g003
Figure 4. The dependence of the Q-factor and resonant wavelength on the Nt obtained by 3D-FDTD simulations (a) for cav1 and (c) cav2. The relationship between r and transmission on Nm obtained by 3D-FDTD simulations (b) for cav1 and (d) for cav2.
Crystals 11 01559 g004
Figure 5. (a) The transmission spectra of the Y-junction power splitter and combiner. (b) The structure of the power splitter (at the incident end) and combiner (at the exit end). (c) The electric field distribution near 1550 nm at the x–y plane when z = 0.
Crystals 11 01559 g005
Figure 6. (a) Transmission spectrum of the cascaded PCNCs. Peak1 and peak2 show the basic modes of cav1 and cav2. (b,c) The corresponding major electromagnetic field distribution of PCNCs (x–y plane with z = 0).
Crystals 11 01559 g006
Figure 7. (a) Transmission spectra under various RH changes. (b) The linear fitting of corresponding resonant wavelength during the time when RH changes from 0% RH to 90% RH in 10% RH steps (T = 300 K). (c) Transmission spectra under different temperature. (d) Linear fitting of relevant resonant wavelength shift versus different temperatures, from 300–340 K with 10 K steps (RH = 40% RH).
Crystals 11 01559 g007
Table 1. The sensitivities of other structures on the basis of RH and temperature sensors.
StructurePlatformRH Sensitivity (pm/%RH)Temperature Sensitivity (pm/K)References
MZI + FBGOptical fiber−99.5; 03.1; 9.6[30]
FPC + FBGOptical fiber52; 33020; 385[31]
MZI + FPIOptical fiber−72; −132172; 37[32]
MicroringSOI97.9; 325.169.0; 30.6[2]
PCNCsSOI−389.2; 058.6; −37.9Our work
Publisher’s Note: MDPI stays neutral with regard to jurisdictional claims in published maps and institutional affiliations.

