Article

An Experimental and Theoretical Study on the Effect of Silver Nanoparticles Concentration on the Structural, Morphological, Optical, and Electronic Properties of TiO2 Nanocrystals

by
Faheem Ahmed
1,*,
Mohammed Benali Kanoun
1,
Chawki Awada
1,*,
Christian Jonin
2 and
Pierre-Francois Brevet
2
1
Department of Physics, College of Science, King Faisal University, P.O. Box 400, Al-Ahsa 31982, Saudi Arabia
2
Institut Lumière Matière, Université de Lyon, UMR 5306 CNRS, Université Claude Bernard Lyon 1, CEDEX, 69622 Villeurbanne, France
*
Authors to whom correspondence should be addressed.
Crystals 2021, 11(12), 1488; https://doi.org/10.3390/cryst11121488
Submission received: 30 October 2021 / Revised: 25 November 2021 / Accepted: 26 November 2021 / Published: 30 November 2021
(This article belongs to the Section Inorganic Crystalline Materials)

Abstract

:
In this work, pure and silver (Ag)-loaded TiO2 nanocrystals (NCs) with various concentrations of Ag were prepared by soft chemical route and the effect of Ag nanoparticles (NPs) on the functional properties of TiO2 was studied. X-ray diffraction (XRD) and Raman studies confirmed that the synthesized product had single-phase nature and high crystalline quality. The crystallite size was decreased from 18.3 nm to 13.9 nm with the increasing in concentration of Ag in TiO2 NCs. FESEM micrographs showed that the pure and AgNPs-loaded TiO2 have spherical morphology and uniform size distribution with the size ranging from 20 to 10 nm. Raman spectroscopy performed on pure and AgNPs-loaded TiO2 confirms the presence of anatase phase and AgNPs. Optical properties show the characteristics peaks of TiO2 and the shifting of the peaks position was observed by changing the concentration of Ag. The tuning of bandgap was found to be observed with the increase in Ag, which could be ascribed to the synergistic effect between silver and TiO2 NCs. Density functional theory calculations are carried out for different Ag series of doped TiO2 lattices to simulate the structural and electronic properties. The analysis of the electronic structures show that Ag loading induces new localized gap states around the Fermi level. Moreover, the introduction of dopant states in the gap region owing to Ag doping can be convenient to shift the absorption edge of pristine TiO2 through visible light.

1. Introduction

Semiconductor-based photocatalysts have attracted great attention owing to their potential applications in photocatalysts, water splitting for hydrogen production, and renewable energy by converting sunlight to electricity or fuels [1,2]. Among these materials, TiO2 is considered to be one such promising metal oxide because it possesses excellent physical and chemical properties, such as high oxidative power, long-term stability, and low cost [3,4,5]. Despite the interest of TiO2 in various applications, toxicity of TiO2 is inevitable [6,7]. TiO2 has a wide band gap [8] in which the absorption coefficient is limited in the ultraviolet light region. Furthermore, photoexcited electron–hole pairs tend to recombine relatively easily in TiO2 [9]. Both of these factors limit possible applications in photocatalytic materials’ design. Therefore, tuning the band gap of TiO2 to make it photosensitive to the visible-light region with low electron–hole recombination has become one of the most important goals in photocatalyst studies [10].
Doping TiO2 with noble metal nanoparticles, such as Pt, Ag, Pd, Au, and alloys is one of the most effective approaches to improve the photocatalytic properties by visible light harvesting and charge carrier separation simultaneously without crystal destruction in TiO2 [11,12]. When metals and semiconductors are in contact, because of the lower Fermi levels of metals, they can act as an electron reservoir suppressing the recombination rate, thus extending the lifetime of charge carriers and significantly enhancing the photocatalytic performance [13,14]. Among the noble metals, silver nanoparticles (Ag NPs) have been shown to be an active catalytic element and have been applied to various catalysts, due to its unique physical, chemical, electronic, and optical properties [15,16,17]. The presence of Ag NPs in vicinity of TiO2 NCs also increases its photocatalytic efficiency via the interfacial charge transfer (IFCT) that occurs effectively towards the Ti-Ag-O phase and the presence of oxygen vacancies [18]. The presence of surface plasmon resonance of Ag NPs during the visible irradiation drive the electron from metallic NPs to TiO2 or the reverse way and in turn improve light harvesting [19,20,21].
Various methods to fabricate Ag doped TiO2 have been reported. For example, some studies have used a chemical reduction method by doping Ag+ into TiO2 NPs [18,22]. Yang et al. used a photo reduction method of silver nitrate (AgNO3) by using TiO2 NPs under UV light [23]. Zhou et al. fabricated Ag/Ag-doped TiO2 using modified sol-hydrothermal method with the assistance of NaOH additive [24]. Al Suliman et al. synthesized Ag/TiO2 nanorods by chemical reduction route by doping Ag+ into Ti Sheet at a high temperature [25]. Although, in this work we use the chemical route to fabricate Ag doped TiO2 NCs. Theoretically, first-principles calculations based on density functional theory (DFT) have provided significant contributions towards understanding the physical and chemical processes involved in photocatalysis [9,26,27]. Numerous theoretical investigations on TiO2 photocatalysts have been performed during recent decades. Moreover, they have also been reviewed to support the experimental results [28,29,30,31,32,33,34,35,36,37]. The electronic structures of metal/TiO2 interfaces have previously been studied by DFT calculations [38]. The effect of the formation of oxygen vacancies in the TiO2 layer near the interface has also been investigated [38,39,40,41,42]. An important progress in the theory of catalysis has been made by Hammer and Norskov [43], who suggested that trends in reactivity on a metal surface can be understood in terms of the energy of hybridization between the bonding and anti-bonding adsorbate states and the metal d-bands.
In this work, we report the chemical synthesis of AgNPs-loaded TiO2 and study the effect of Ag nanoparticles on the structural, optical, and electronic structure properties of TiO2 to explore the possibility of utilizing the prepared nanomaterials for photocatalytic applications. The results showed that by simply altering the concentration AgNPs in TiO2 matrix resulted in tuning of bandgap of TiO2 which could be beneficial for the enhancement in photocatalytic activity. The theoretical studies were conducted to investigate the structural, electronic, and optical properties using the first-principles calculation method. This leads to a determination of the band gap change and allows for an investigation of the structure/property relations in this AgNPs-loaded TiO2.

2. Experimental and Computational Methods

2.1. Experimental Details

2.1.1. Synthesis of AgNPs-Loaded TiO2

For the synthesis of pure and Ag loaded (1%, 2%, 5%, 10%, and 19%) TiO2 nanocrystals (TAg 0, TAg 1, TAg 2, TAg 5, TAg 10, and TAg 19), 0.1 M TiO2 nanoparticles were dissolved in 100 mL deionized water. The amount of TiO2 as pristine sample was fixed; however, for the AgNPs-loaded TiO2, the amount of TiO2 and AgNPs was varied which resulted in 1 to 19 wt% AgNPs-loaded TiO2. The solution was then stirred with a magnetic stirrer for 1 h. Required volume of AgNO3 (0.1 M) solution was added (wt/wt% ratio with TiO2) to the existing sol. Reduction of Ag+ was carried out by drop-wise addition of 25 mL ascorbic acid (0.02 M), until a color change from colorless to brownish was noted. This solution (silver nitrate, ascorbic acid, and TiO2) was heated in microwave at a power of 450 W for a few minutes to complete the reaction which resulted in AgNPs-loaded TiO2. The samples were washed thoroughly with ethanol and DI water followed by centrifuging and drying at 80 °C for 12 h. The final product was then grinded using mortar and the product was then used for further characterizations. Pure AgNPs were synthesized by the similar procedure discussed above without using TiO2 nanoparticles and then used for characterizations.

2.1.2. Characterizations

XRD was used to determine the phases of the product. XRD measurements on different powders were performed using Philips X’pert MPD 3040 X–ray powder diffractometer operated at 40 kV and 30 mA with CuKα (1.541 Å) radiation. The UV-Visible spectrometer (Agilent (Santa Clara, CA, USA); 8453) was used to record the absorption spectrum of AgNps-loaded TiO2 nanocrystals in the range of 200 to 800 nm of wave length using the combination of Tungsten and Deuterium lamp. FTIR (Perkin Elmer (Waltham, MA, USA); Spectrum Two) was used to study the structural studies of the prepared product. Morphologies of the samples were studied using filed emission scanning electron microscopy (FESEM; JEOL JSM 7600 F). High-resolution transmission electron microscopy (HRTEM) images of the sample were obtained using a FE-TEM (JEOL/JEM-2100F version) operated at 200 kV. The structure of the prepared samples was analyzed by Raman microscope (HORIBA; LabRAM HR800, France SAS) at room temperature and an ambient atmosphere with a He-Ne wavelength laser of 633 nm and power of 20 mW.

2.2. Computational Details

All calculations were carried out using the framework of the density functional theory (DFT) within the local combination of the atomic orbitals (LCAO) approach, as implemented in the Quantum Atomistix ToolKit (quantumATK) [44] package. The Perdew–Burke–Ernzerhof (PBE) with the generalized gradient approximation (GGA) to the exchange correlation functional was employed [45]. The norm-conserving PseudoDojo [46] pseudopotential was chosen for characterizing the interaction between ion nuclei and the valence electrons. The computation of self-consistent field (SCF) was iterated until the difference of total energy less than 10−6 Ha was completed. The structures were fully optimized by using the limited-memory Broyden–Fletcher–Goldfarb–Shanno algorithm, with force on each atom site fewer than 0.05 eV/Å. For the geometry optimization, a 4 × 4 × 3 Monkhorst-Pack [47] k-grid was used; for electronic property calculations, a 10 × 10 × 8 grid was used. The electronic and optical properties were calculated using a more accurate Heyd−Scuseria−Ernzerhof hybrid functional (HSE06) [48,49].

3. Results and Discussion

3.1. Structural Properties

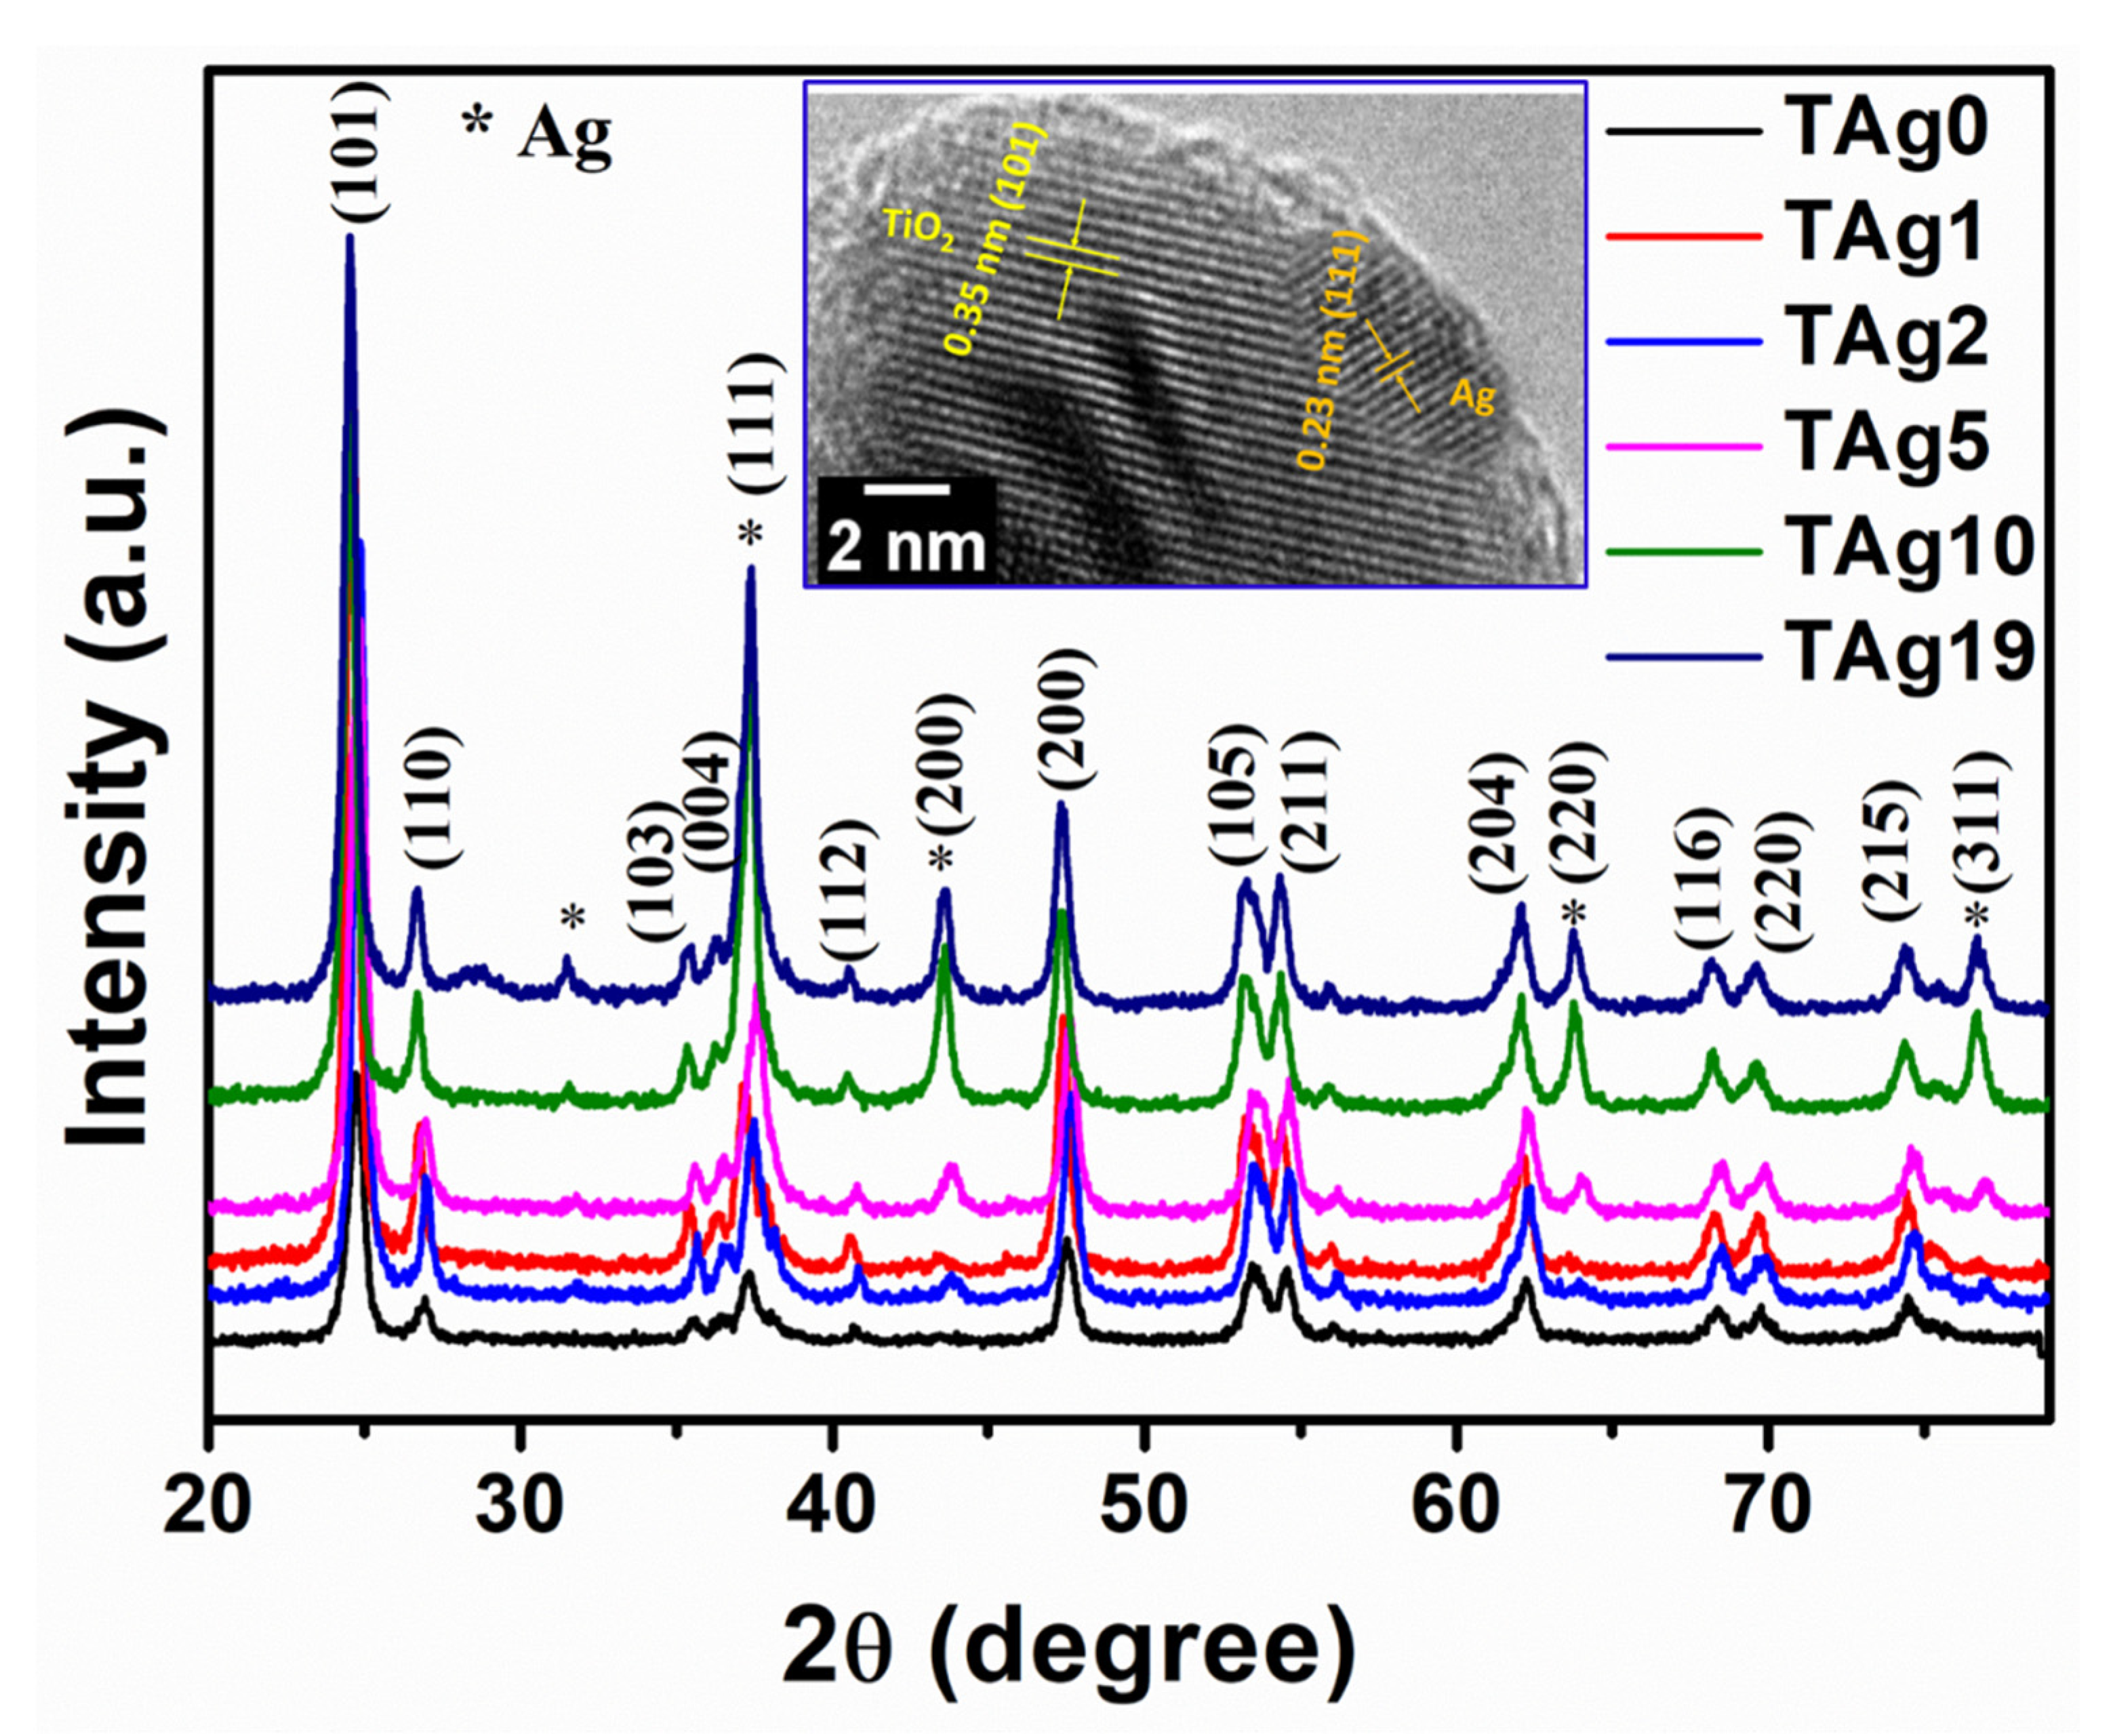
3.1.1. X-ray Diffraction Analysis

XRD patterns were studied to illustrate the structure and phase composition of as-synthesized materials. Figure 1 displays the results of XRD of pure TiO2 and AgNPs-loaded TiO2 nanocrystals synthesized by above-described method. From the XRD pattern, it is observed that the diffraction peaks at 2θ angles 25.3, 37.9, 48.05, 53.9, 55.06, 62.4, 68.76, 70.3, 75.06, and 78.67 corresponding to the crystal planes (101), (004), (105), (211), (204), (116), (215), and (206) belong to the fundamental anatase structure of TiO2 (JCPDS card no. 21-1272). Furthermore, it can be observed that the shape of the peaks appears clear and sharp, and no impurity peaks are present in these patterns which indicates pure form of TiO2. In addition, some of the peaks marked by (*) belong to the crystal planes of silver (JCPDS card no. 04-0783). The intensities of these peaks increase with the rising concentration of Ag in TiO2, except the 10% concentration of silver where the intensity is higher than 19%, this difference could be due to the slower agglomeration rate of silver nanoparticles and with the excess of silver cations. The crystallite size of all the prepared samples were calculated by using the Debye Scherrer formula which is given below [50]:
D = k λ β c o s θ
where the letters have their usual meaning, k is a constant, λ is a wavelength of x ray used, β is the FWHM parameter, and θ is the diffraction angle. It has been found that the crystallite size decreases with the increasing concentration of Ag in TiO2 nanocrystals; these results are in good agreement with the previous work [51]. The crystallite size of pure and AgNPs-loaded TiO2 nanocrystals was found in the decreasing order from 18.30 to 13.91 nm with the increase of Ag concentration from 1 to 19%, respectively. Inset of Figure 1 shows the HRTEM image of AgNPs-loaded TiO2 (2%) in which clear interplanar spacing of 0.36 nm corresponds to (101) plane of TiO2 and 0.23 nm corresponds to (111) plane of Ag, respectively, could be seen. Additionally, the attachment of AgNPs on the surface of TiO2 is also evident from the HRTEM image.

3.1.2. FTIR Analysis

Figure 2 displays the FTIR spectra of pure and AgNPs-loaded TiO2 nanocrystals. It confirms that the strong absorption peaks of pure TiO2 and AgNPs-loaded TiO2 at 3396, 1684, 1619, and 1420 cm−1 have identical behavior, which is possibly due to hydrogen bonded surface hydroxyl groups and OH of adsorbed water molecules [52]. Further, the vibration peak 1630 cm−1 can be ascribed to the O–H bond. The peak at 1411 cm−1 can be ascribed to the alcohol group, which occurs due to the addition of ethanol solution while washing the samples. The strong absorption peak around ~450 cm−1 describes the formation of pure and AgNPs-loaded TiO2 nanocrystals. Furthermore, with the increase in concentration of Ag in TiO2, there is a shift in the characteristics peak (~450 cm−1) towards higher wavenumbers as shown in the zoomed area of marked region in Figure 2, and the occurrence of new peaks corresponding to AgNPs (~1400 cm−1) were observed [53,54].

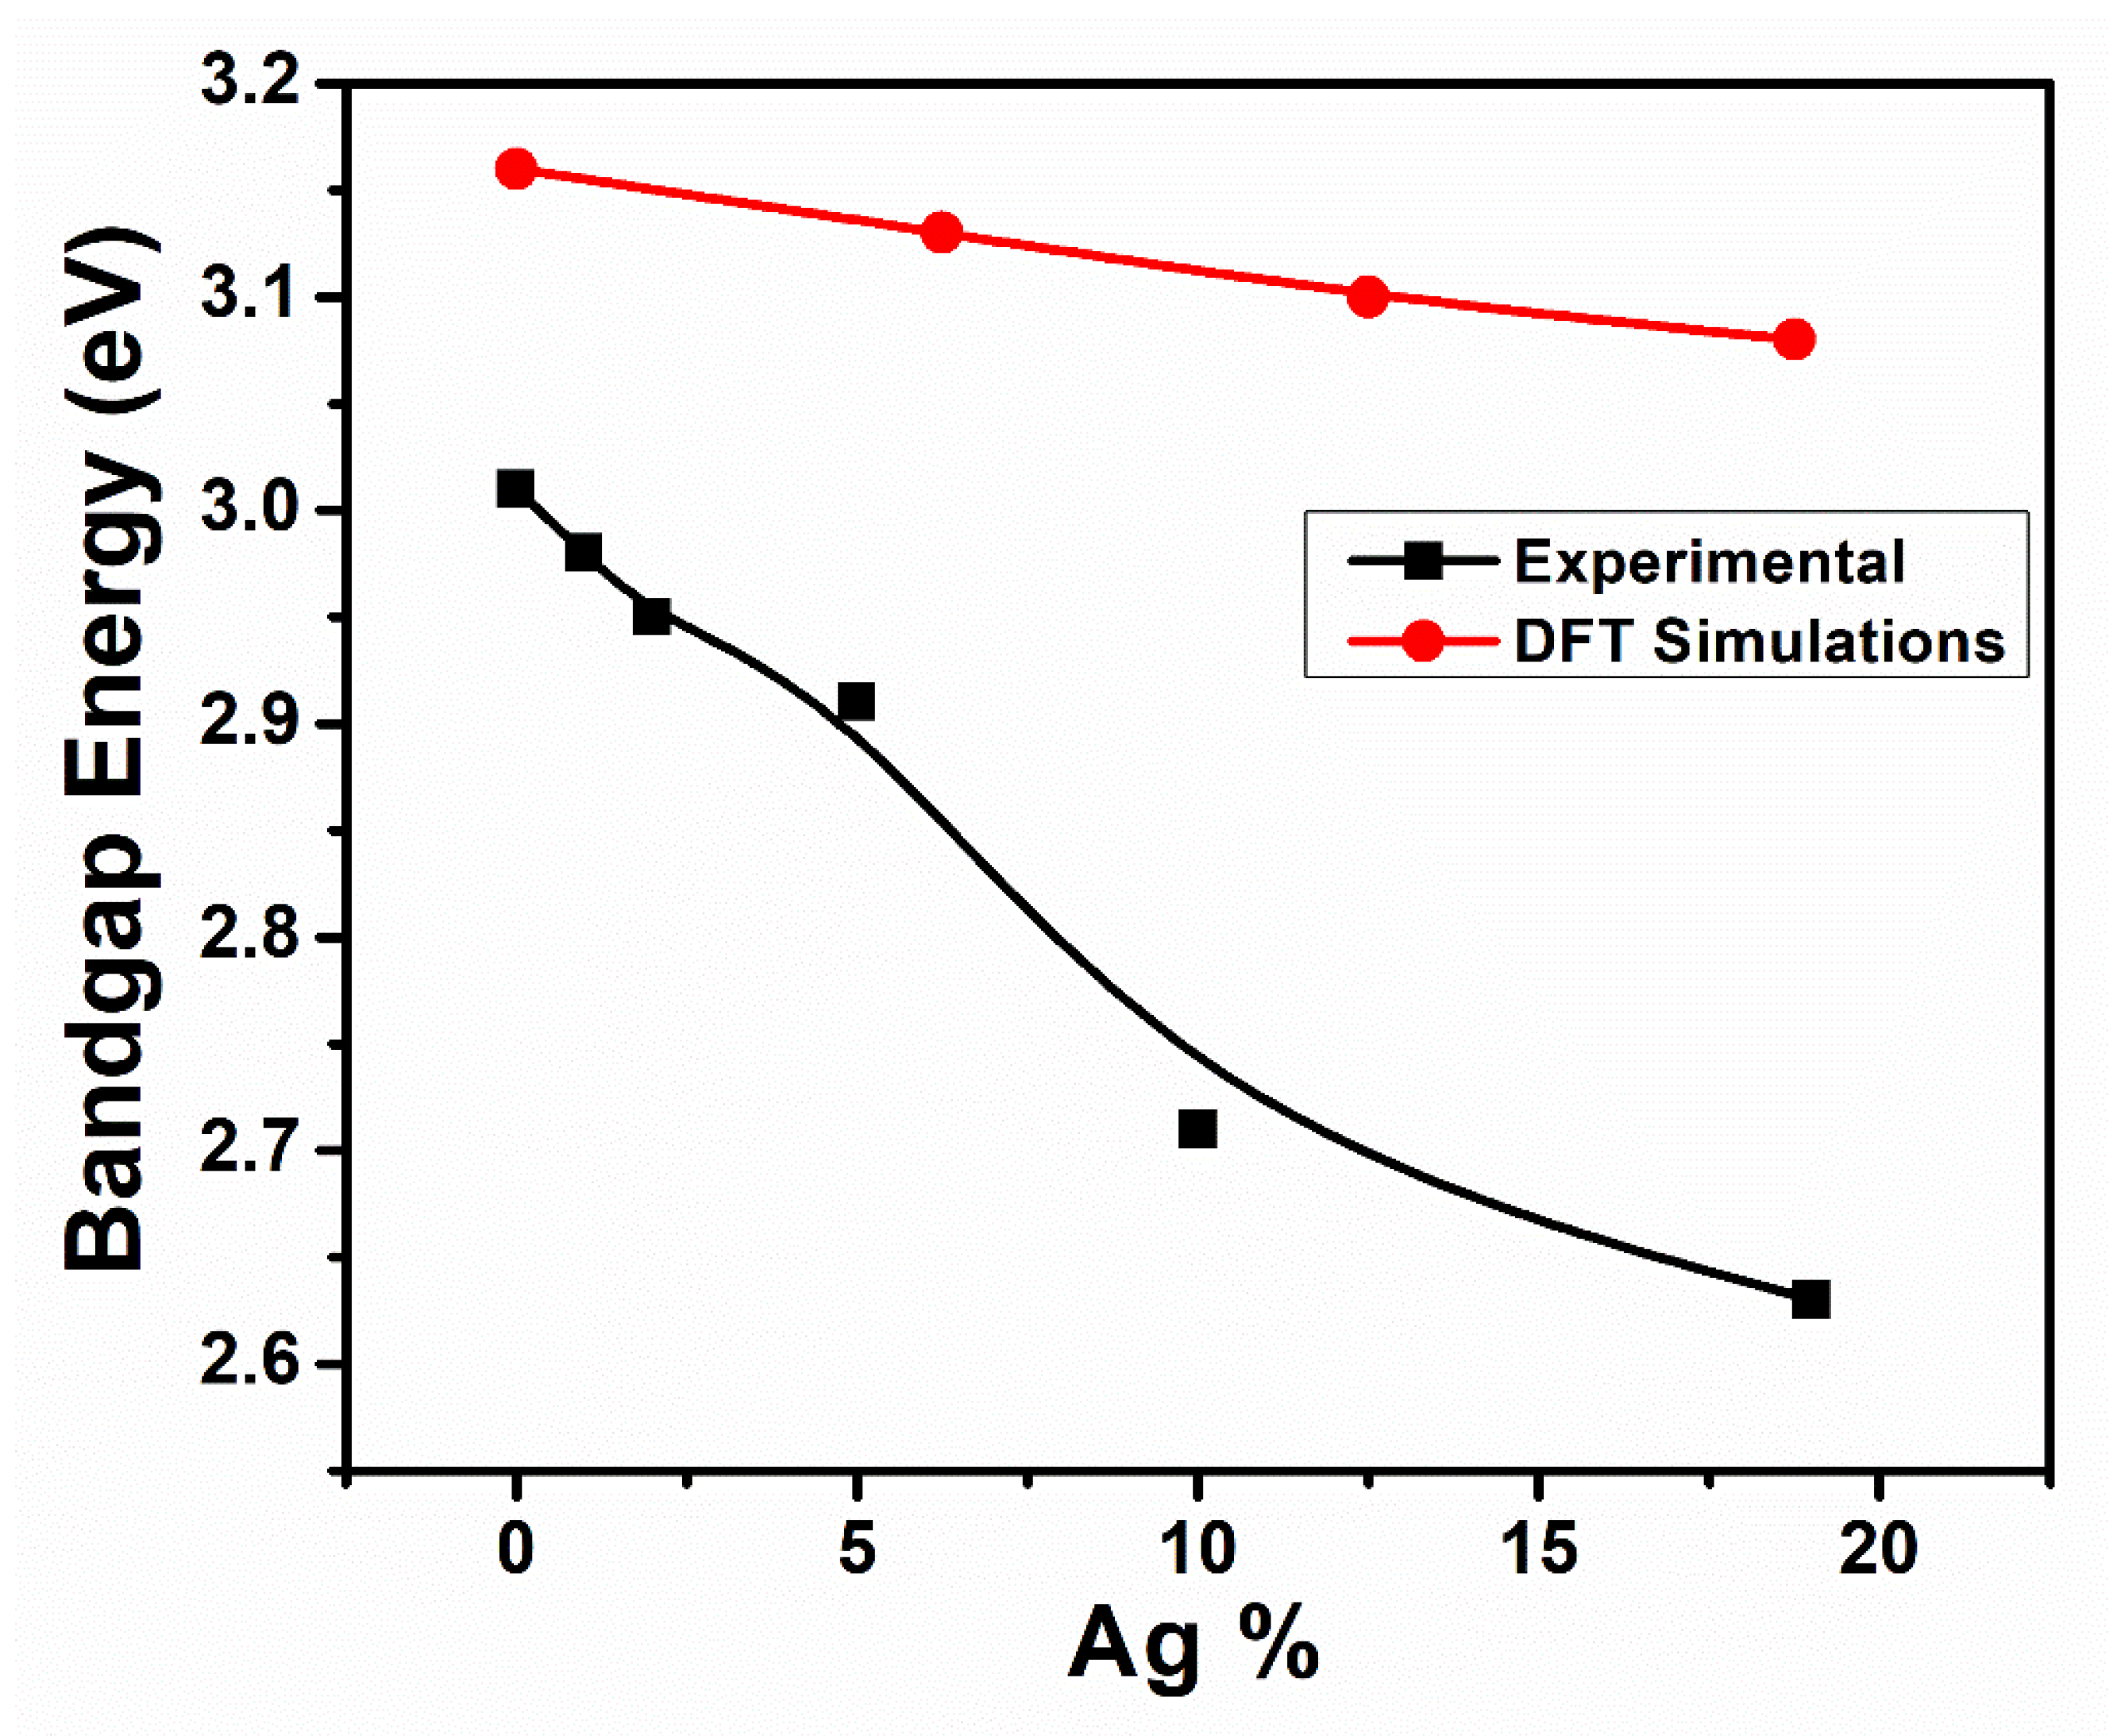
3.2. Optical Properties

The UV-Vis absorption spectra of the pure and AgNPs-loaded TiO2 nanocrystals are shown in Figure 3A. As TiO2 belongs to the wide band gap semiconductor and hence it does not show any absorption peak in the visible region. The obtained absorption spectra show that the maximum absorption is ~340–350 nm, which is due to the strong interaction between O 2p → Ti 3d charges. In order to confirm the presence of AgNPs, UV-Vis of AgNPs alone is shown which depicts a clear absorption peak at ~421 nm corresponding to the plasmonic absorption of AgNPs. In the UV-Vis spectra (Figure 3A), pure TiO2 showed the absorbance in the UV range, while AgNPs showed a clear peak in the visible range. With the increase of AgNPs in TiO2, the absorbance in the UV range was found to decrease, while the absorbance in the visible range was increased for AgNPs-loaded TiO2. This increase might be due to the fact that the ability of AgNPs-loaded TiO2 to absorb light in the visible region is stronger than that of pure TiO2 [55]. The absorption intensity of the pure and AgNPs-loaded TiO2 nanocrystals has been calculated using the relation:
I = I 0 e α t
Whereas, the absorption coefficient (α) is calculated by the formula:
α = 2.303 × A t
Figure 3B(a–f) displays the band gap of pure and Ag doped TiO2 nanocrystals. The energy band gaps were calculated using Tauc’s relation and is given by [56]:
α h ν = B h ν E g n
where n = 2 for indirect band gap semiconductor. The band gap for pure TiO2 was found to be 3.01 eV, while, with the increase of AgNPs concentration from 1 to 19%, the band gap was decreased from 2.98 to 2.63 eV, respectively. It was observed that the band gap was slightly decreased with 1% Ag, 2% Ag, and 5% Ag in TiO2, while, with higher concentration of Ag, such as 10%, and 19%, resulted in the abrupt decrease of band gap as compared to pure TiO2 (see Figure 3B(a–f)) Therefore, the optimum concentration of Ag in TiO2 to make it visible, light efficient could be taken as 5% Ag, which could be extend to 10% with decreased bandgap, thus increased visible light absorption.

3.3. Raman Analysis

Figure 4 shows the Raman spectra of pure and AgNPs-loaded TiO2 nanocrystals. The pure TiO2 shows an intense Raman peak at 145 cm−1, which can be assigned to the Eg optical Raman mode of anatase TiO2. The other Raman peaks at 196 cm−1, 394 cm−1, 512 cm−1, and 636 cm−1 were assigned to Eg, B1g, A1g, and Eg Raman modes of anatase TiO2, respectively. In the case of AgNPs-loaded TiO2 nanocrystals, all the Raman peaks of TiO2 have been observed; in addition, we observed a Raman band located at 240 cm−1 assigned to silver nitrogen Ag-N or Ag-O bonds that confirm the presence of AgNPs covered the TiO2 nanocrystals [57,58]. This band is well pronounced with the more silver-loaded samples.

3.4. Morphological Studies

Figure 5 displays the FESEM images of synthesized pure and AgNPs-loaded TiO2 nanocrystals under similar experimental conditions. Figure 5a shows the FESEM micrograph of pure TiO2 sample where the particles are well distributed all over the surface and exhibited well defined regular spherical structures. The spherical shape particles have almost uniform size in the range of 20–25 nm. The morphology of AgNPs-loaded TiO2 can be clearly seen from Figure 5b–f; it was observed that the particle size decreased with the increasing concentration of Ag nanoparticles in TiO2. More specifically, Figure 5b shows the morphology of the sample synthesized using 1% AgNPs-loaded TiO2 nanocrystals which has particle size of 18–22 nm. When the concentration of Ag further increased to 2%, the particle size reduced to 18–20 nm (see Figure 5c). A further increase in Ag concertation to 5% in TiO2, a reduction of particle size of 17–19 nm can be observed. Upon the increase in the concentration of Ag to 10% and 19%, the particles size was decreased to 15–18 nm (see Figure 5e) and 14–19 nm (see Figure 5f), respectively. The reduced size of the nanoparticles might be related to the effect of confined electrons, which hinders the interaction of surface Plasmon resonance at visible light, such as noted by UV-Vis. This phenomenon can be associated with electronic barrier sets for Ag NPs with very small sizes, e.g., diameters < 20 nm, such as that explained by Tsivadze A, et al. [59]. Interestingly, the anchored Ag nanoparticles on the surface of TiO2 could be seen for the samples doped with Ag nanoparticles (Figure 5b–f) which further confirms the successful attachment of Ag nanoparticles on the surface of TiO2 nanocrystals.

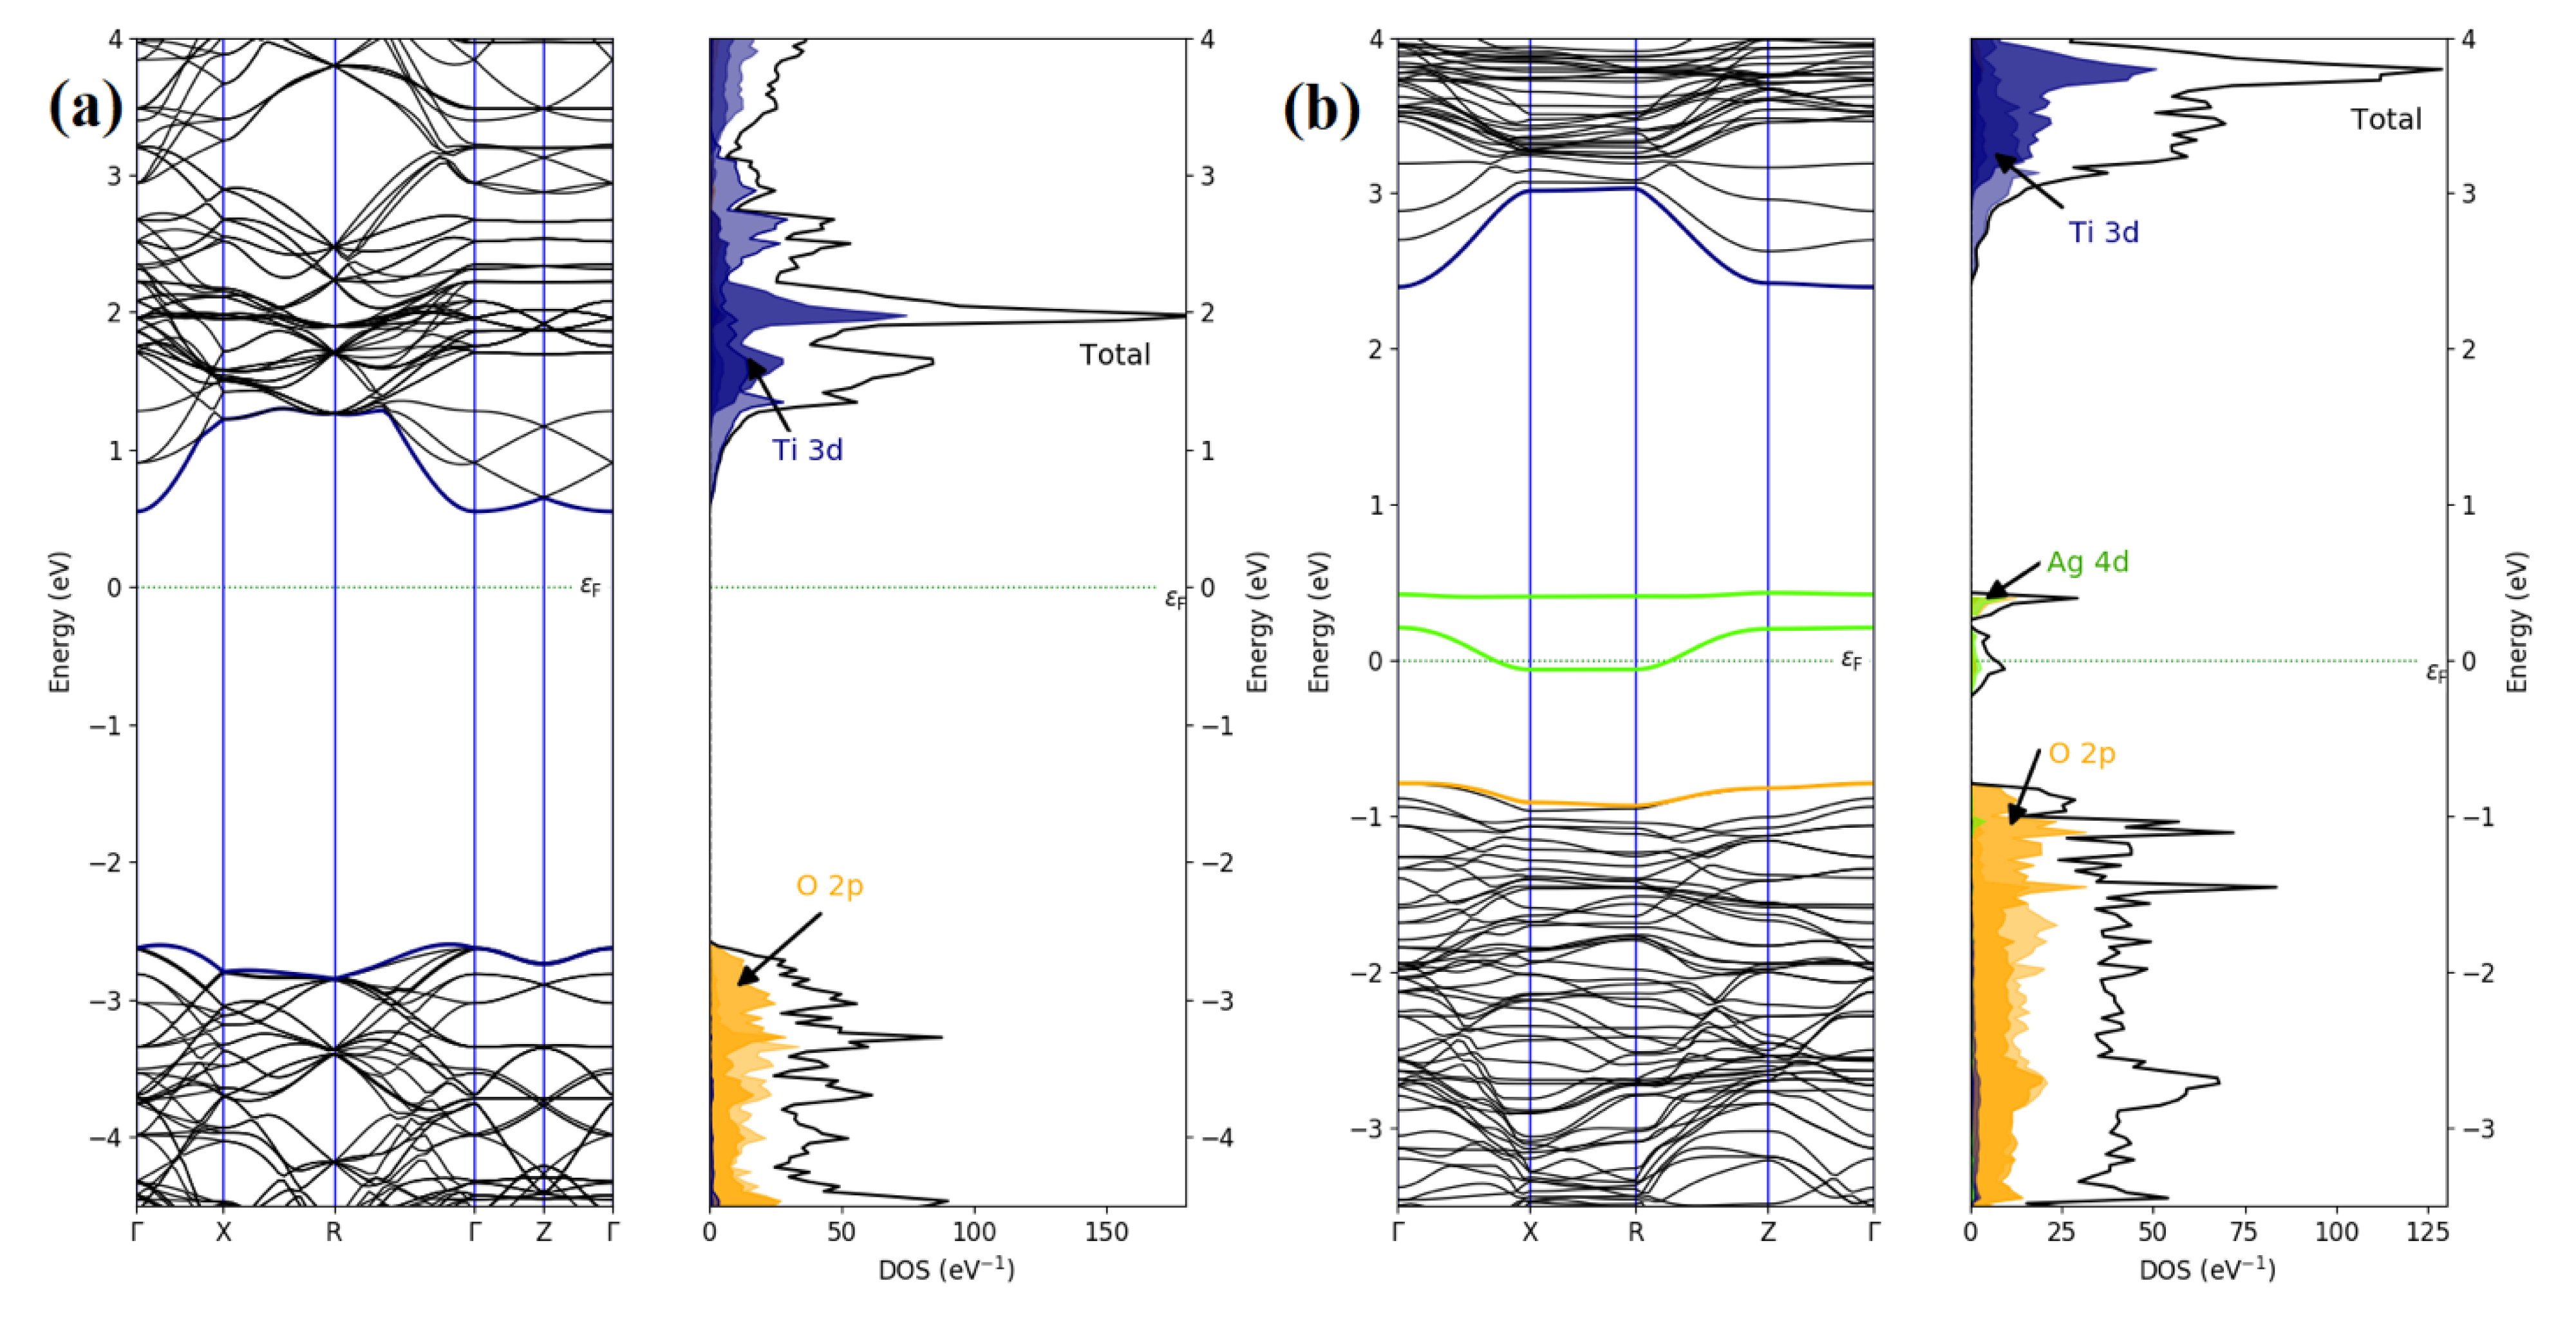
3.5. Computational Electronic Properties

We started by performing a structural analysis of defect free TiO2 prior to investigating the defects using first-principles calculations. The anatase structure is the most common polymorphs of TiO2 which is hexagonal (the space group I41/amd), as shown in Figure 6. The optimized lattice parameters, a = 3.782 Å, c = 9.496 Å, show a fair agreement with the experimentally reported values (a = 3.7842 Å, c = 9.5146 Å) [60]. To construct configurations doped with TiO2, a 2 × 2 × 1 supercell consisting of 48 atoms was used, as shown in Figure 6. Substitutional defects are induced in the supercell to model the different doped systems [61]. Three types of doping configurations are modeled, including one substitutional Ag at Ti site (equivalent to 6.25% Ag concentration), two substitutional Ag at Ti sites (equivalent to 12.5% Ag concentration), and three substitutional Ag at Ti sites at (equivalent to 18.75% Ag concentration). The incorporation of Ag dopants into the anatase lattice at Ti sites shows that a- and c-lattice parameters change a little compared to those of pristine TiO2 (Table 1). This difference occurs from the tetragonal lattice distortion after the incorporation of Ag dopants. The optimized Ti−O and O−O average bond lengths of pure TiO2 are 1.960 and 2.47 Å, respectively, which are rather close with the experimental measurements [62] and theoretical values [62,63,64]. For the introduction of single Ag impurity, the process decreases the Ti−O and increases O−O bond distance because of the crystalline structure distortion. Our results show that Ag doping shows a long-range impact on the system, in which all lengths of interatomic bond are changed [65]. A similar feature is observed for two and three Ag doping.
Band structure plots for pristine and Ag doped anatase TiO2 with different concentrations are shown in Figure 7. For pristine anatase TiO2, our computed band gap energy of 3.16 eV with HSE06 functional agrees well with the experimental value (3.01 eV) in which the top of the valence band is located near Γ-X points while the bottom of the conduction band is located at Γ point. When substituting one Ti with an Ag atom, the band structure of the host TiO2 is perturbated by adding an acceptor level above valence band edge, as illustrated in Figure 7b. The induced impurity state near the valence band edge is also clearly appearing in the corresponding density of states (DOS), reflecting the achievement of the p-type states. Introduction of impurity states in the gap region owing to Ag doping may be convenient to shift the absorption edge of pristine TiO2 into visible light. For two Ag doping at two Ti sites in TiO2 supercell, an increased amount of impurity energy levels appeared in the band gap just above the valence band edge, which may facilitate in transferring excited electrons by visible light to the conduction band (see Figure 7c). With increasing dopant concentration by replacing three Ti atoms by three Ag atoms, Figure 7d shows that more impurity states are created near the Fermi level and above valence band maximum (VBM). All these findings show that increasing Ag dopant concentration in TiO2 supercell may reveal greater p-type behavior than the single Ag doped system which might be practical in absorbing visible light low-energy photons. To explain the modifications in the band structures, the total and partial DOS are calculated using the HSE06 functional and displayed in Figure 7. The analysis of DOS of pure anatase TiO2 shows that the conduction band minimum is mainly made by Ti 3d states, whereas the valence band maximum is dominated by the contribution of O 2p states. From Figure 7b, the Ag doping introduces acceptor states in which the contribution of Ag 4d states is larger compared with O 2p states, indicating the occurrence of the O 2p-Ag 4d hybridization. Moreover, the VBM and conduction band maximum (CBM) shift to higher energies. With Ag incorporation concentration rising, more defect states are added. It is noticed that the VBM and CBM of two and three Ag doping configurations keep nearly at the same position. It is found that with increasing substitution concentration, the number of defect states incorporated in the gap region increases with a wide distribution above the VBM.
To estimate the optical harvesting ability, the absorption coefficients are computed at HSE06 levels for undoped and doped TiO2 at different concentrations, as illustrated in Figure 8. The spectrum of TiO2 reveals the appearance of high intensity resonant peaks in the ultraviolet range and displays no absorption response in the visible region. Doping Ag into TiO2 structure modified the absorption spectrum of pristine TiO2. It shows a good optical absorption property in the visible region. It should be noted that there is a strong absorption peak in UV region at 220 nm and another absorption peak at about 520 nm in the visible light range. Interestingly, the improved absorption is ascribed to the photons absorptions because of the electron excitation from valence band edge to the Ag 4d gap states, inducing significant red shift, corresponding to the absorption at 520 nm. This result is consistent with the previous theoretical results [66]. With the increase of Ag substitution concentration, synergistic effect of Ag(12.5%) and Ag(18.75%) doping induces more impurity Ag 4d gap states, which lead to the improvement of the visible light photocatalytic ability. Therefore, the absorption of visible and UV light is highly enhanced in Ag(18.75%) doping compared with the pure and other doping configurations.
Figure 9 reports the trend of experimental energy gap as a function of Ag% for pure and AgNPs-loaded TiO2 nanocrystals (black square) in comparaison with DFT values (red circle). A comparison of the experimental bandgap values AgNPs-loaded TiO2 nanocrystals and the calculated values for the Ag doped TiO2 system show a similar trend in the reduction of the band gap value with the Ag content.

4. Conclusions

In summary, pure and AgNPs-loaded TiO2 nanocrystals with various concentrations of Ag nanoparticles were successfully prepared. XRD and Raman studies confirmed the single-phase nature and high crystalline quality of the product. In the nanocomposites, the presence of both the Ag and TiO2 phases revealed the formation of loaded TiO2 with Ag NPs. It was observed that the size was tuned with the Ag concentration in TiO2. FTIR studies showed the characteristics bands of TiO2 and AgNPs Optical properties studied by UV-Vis spectroscopy showed the characteristics peaks of TiO2 and Ag, and the shifting of the peaks position was observed by changing the concentration of Ag. The tuning of bandgap was observed with the increase in AgNPs. Morphological characterizations by using FESEM show that the particles size was reduced with the increase of Ag in the TiO2, however, keeping the shape of the nanoparticles unchanged. First-principles calculations were performed for various Ag configurations of doped TiO2 structures to calculate the structural and electronic properties. The analysis of the electronic structures showed that Ag doping induces new localized gap states around the Fermi level. Moreover, the incorporation of dopant states in the gap region owing to Ag doping can be convenient to shift the absorption edge of pristine TiO2 through visible light.

Author Contributions

Conceptualization, F.A., M.B.K. and C.A.; Data curation, F.A. and M.B.K.; Formal analysis, F.A. and M.B.K.; Funding acquisition, C.A.; Methodology, F.A. and C.A.; Computational methodology, M.B.K., Resources, C.A.; Visualization, M.B.K. and C.A.; Writing—original draft, F.A. and M.B.K.; Writing—review & editing, C.A., C.J. and P.-F.B. All authors have read and agreed to the published version of the manuscript.

Funding

This research was funded by the Deputyship for Research & Innovation, Ministry of Education in Saudi Arabia through the project number (1063) And the APC was funded by the project number (1063).

Institutional Review Board Statement

Not applicable.

Informed Consent Statement

Not applicable.

Data Availability Statement

Not applicable.

Acknowledgments

The authors extend their appreciation to the Deputyship for Research & Innovation, Ministry of Education in Saudi Arabia for funding this research work through the project number (1063).

Conflicts of Interest

The authors declare that they have no competing interests.

References

  1. Khan, S.U.M.; Al-Shahry, M.; Ingler, W.B., Jr. Efficient Photochemical Water Splitting by a Chemically Modified n-TiO2. Science 2002, 297, 2243–2245. [Google Scholar] [CrossRef]
  2. Chen, X.; Mao, S.S. Titanium dioxide nanomaterials: Synthesis, properties, modifications, and applications. Chem. Rev. 2007, 107, 2891–2959. [Google Scholar] [CrossRef]
  3. Lin, L.; Jiang, Z.; Zhu, C.; Hu, X.; Zhang, X.; Zhu, H.; Fan, J. Enhanced optical absorption and photocatalytic activity of anatase TiO2 through (Si,Ni) codoping. J. Appl. Phys. Lett. 2012, 101, 062106. [Google Scholar] [CrossRef] [Green Version]
  4. Yin, W.J.; Tang, H.; Wei, S.H.; Al-Jassim, M.M.; Turner, J.; Yan, Y. Band structure engineering of semiconductors for enhanced photoelectrochemical water splitting: The case of TiO2. Phys. Rev. B Ondens. Matter Mater. Phys. 2010, 82, 045106. [Google Scholar] [CrossRef] [Green Version]
  5. Liu, L.; Jiang, Y.; Zhao, H.; Chen, J.; Cheng, J.; Yang, K.; Li, Y. Engineering Coexposed {001} and {101} Facets in Oxygen-Deficient TiO2 Nanocrystals for Enhanced CO2 Photoreduction under Visible Light. ACS Catal. 2016, 6, 1097–1108. [Google Scholar] [CrossRef]
  6. Wójcik, E.B.; Szwajgier, P.; Oleszczuk, A.; Mieczan, W. Effects of Titanium Dioxide Nanoparticles Exposure on Human Health-a Review. Biol. Trace Elem. Res. 2020, 193, 118–129. [Google Scholar] [CrossRef] [PubMed] [Green Version]
  7. Hou, J.; Wang, L.; Wang, C.; Zhang, S.; Liu, H.; Li, S.; Wang, X. Toxicity and mechanisms of action of titanium dioxide nanoparticles in living organisms. J. Environ. Sci. 2019, 75, 40–53. [Google Scholar] [CrossRef]
  8. Hernandez-Alonso, M.D.; Fresno, F.; Suarez, S.; Coronado, J.M. Development of alternative photocatalysts to TiO2: Challenges and opportunities. Energy Environ. Sci. 2009, 2, 1231–1257. [Google Scholar] [CrossRef]
  9. Gai, Y.; Li, J.; Li, S.S.; Xia, J.B.; Wei, S.H. Design of Narrow-Gap TiO2: A Passivated Codoping Approach for Enhanced Photoelectrochemical Activity. Phys. Rev. Lett. 2009, 102, 036402. [Google Scholar] [CrossRef]
  10. Chang, J.; Jiang, Z.-Y.; Zhang, Z.Y.; Lin, Y.M.; Tian, P.-L.; Zhou, B.; Chen, L. Theoretical studies of photocatalytic behaviors of isoelectronic C/Si/Ge/Sn-doped TiO2: DFT+ U. Appl. Surf. Sci. 2019, 484, 1304–1309. [Google Scholar] [CrossRef]
  11. Wilke, K.; Breuer, H. The influence of transition metal doping on the physical and photocatalytic properties of titania. J. Photochem. Photobiol. A 1999, 121, 49–53. [Google Scholar] [CrossRef]
  12. Verbruggen, S.W.; Keulemans, M.; Filippousi, M.; Flahaut, D.; Tendeloo, G.V.; Lacombe, S.; Martens, J.A.; Lenaerts, S. Plasmonic gold–silver alloy on TiO2 photocatalysts with tunable visible light activity. Appl. Catal. B Environ. 2014, 156–157, 116–121. [Google Scholar] [CrossRef]
  13. Choi, W.; Termin, A.; Hoffmann, M.R. The Role of Metal Ion Dopants in Quantum-Sized TiO2: Correlation between Photoreactivity and Charge Carrier Recombination Dynamics. J. Phys. Chem. 1994, 98, 13669–13679. [Google Scholar] [CrossRef]
  14. Schneider, J.; Matsuoka, M.; Takeuchi, M.; Zhang, J.; Horiuchi, Y.; Anpo, M.; Detlef, W.B. Understanding TiO2 Photocatalysis: Mechanisms and Materials. Chem. Rev. 2014, 114, 9919–9986. [Google Scholar] [CrossRef]
  15. Zhang, H.; Liang, C.; Liu, J.; Tian, Z.; Wang, G.; Cai, W. Defect-Mediated Formation of Ag Cluster-Doped TiO2 Nanoparticles for Efficient Photodegradation of Pentachlorophenol. Langmuir 2012, 28, 3938–3944. [Google Scholar] [CrossRef] [PubMed]
  16. Subrahmanyam, A.; Biju, K.; Rajesh, P.; Kumar, K.J.; Kiran, M.R. Surface modification of sol gel TiO2 surface with sputtered metallic silver for Sun light photocatalytic activity: Initial studies. Sol. Energy Mater. Sol. Cells 2012, 101, 241–248. [Google Scholar] [CrossRef]
  17. Li, Y.; Ma, M.; Chen, W.; Li, L.; Zen, M. Preparation of Ag-doped TiO2 nanoparticles by a miniemulsion method and their photoactivity in visible light illuminations. Mater. Chem. Phys. 2011, 129, 501–505. [Google Scholar] [CrossRef]
  18. Gogoi, D.; Namdeo, A.; Golder, A.K.; Peela, N.R. Ag-doped TiO2 photocatalysts with effective charge transfer for highly efficient hydrogen production through water splitting. Int. J. Hydrog. Energy 2020, 45, 2729–2744. [Google Scholar] [CrossRef]
  19. Liu, L.; Ouyang, S.; Ye, J. Gold-nanorod-photosensitized titanium dioxide with wide-range visible-light harvesting based on localized surface plasmon resonance. Angew. Chem. 2013, 125, 6821–6825. [Google Scholar] [CrossRef]
  20. Wang, P.; Huang, B.; Dai, Y.; Whangbo, M.-H. Plasmonic photocatalysts: Harvesting visible light with noble metal nanoparticles. Phys. Chem. Chem. Phys. 2012, 14, 9813–9825. [Google Scholar] [CrossRef]
  21. De Souza, M.L.; dos Santos, D.P.; Corio, P. Localized surface plasmon resonance enhanced photocatalysis: An experimental and theoretical mechanistic investigation. RSC Adv. 2018, 8, 28753. [Google Scholar] [CrossRef] [Green Version]
  22. Quiñones-Jurado, Z.V.; Waldo-Mendoza, M.; Aguilera-Bandin, H.M.; Villabona-Leal, E.G.; Cervantes-Gonzalez, E.; Pérez, E. Silver Nanoparticles Supported on TiO2 and Their Antibacterial Properties: Effect of Surface Confinement and Nonexistence of Plasmon Resonance. Mater. Sci. Appl. 2014, 5, 895–903. [Google Scholar] [CrossRef] [Green Version]
  23. Yang, L.; Sang, Q.; Du, J.; Yang, M.; Li, X.; Shen, Y.; Han, X.; Jiang, X.; Zhao, B. A Ag synchronously deposited and doped TiO2 hybrid as an ultrasensitive SERS substrate: A multifunctional platform for SERS detection and photocatalytic degradation. Phys. Chem. Chem. Phys. 2018, 20, 15149. [Google Scholar] [CrossRef]
  24. Zhou, L.; Zhou, J.; Lai, W.; Yang, X.; Meng, J.; Su, L.; Gu, C.; Jiang, T.; Pun, E.Y.B.; Shao, L. Irreversible accumulated SERS behavior of the molecule-linked silver and silver-doped titanium dioxide hybrid system. Nat. Commun. 2020, 11, 1785. [Google Scholar] [CrossRef] [Green Version]
  25. Al Suliman, N.; Awada, C.; Alshoaibi, A.; Shaalan, N.M. Simple Preparation of Ceramic-Like Materials Based on 1D-Agx (x= 0, 5, 10, 20, 40 mM)/TiO2 Nanostructures and Their Photocatalysis Performance. Crystals 2020, 10, 1024. [Google Scholar] [CrossRef]
  26. Wang, F.; Di Valentin, C.; Pacchioni, G. Doping of WO3 for Photocatalytic Water Splitting: Hints from Density Functional Theory. J. Phys. Chem. C 2012, 116, 8901–8909. [Google Scholar] [CrossRef]
  27. Islam, M.M.; Calatayud, M.; Pacchioni, G. Hydrogen Adsorption and Diffusion on the Anatase TiO2(101) Surface: A First-Principles Investigation. J. Phys. Chem. C 2011, 115, 6809–6814. [Google Scholar] [CrossRef]
  28. Kubacka, A.; Fern´andez-Garcıa, M.; Colon, G. Advanced nanoarchitectures for solar photocatalytic applications. Chem. Rev. 2012, 112, 1555–1614. [Google Scholar] [CrossRef]
  29. Henrich, V.E. Metal-oxide surfaces. Prog. Surf. Sci. 1995, 50, 77–90. [Google Scholar] [CrossRef]
  30. Daghrir, R.; Drogui, P.; Robert, D. Modified TiO2 for Environmental Photocatalytic Applications: A Review. Ind. Eng. Chem. Res. 2013, 52, 3581–3599. [Google Scholar] [CrossRef]
  31. Park, H.; Park, Y.; Kim, W.; Choi, W. Surface modification of TiO2 photocatalyst for environmental applications. J. Photochem. Photobiol. C 2013, 15, 1–20. [Google Scholar] [CrossRef]
  32. Shwetharani, R.; Sakar, M.; Fernando, C.A.N.; Binas, V. Recent advances and strategies to tailor the energy levels, active sites and electron mobility in titania and its doped/composite analogues for hydrogen evolution in sunlight. Sci. Technol. 2019, 9, 12–46. [Google Scholar] [CrossRef]
  33. Nam, Y.; Lim, J.H.; Ko, K.C.; Lee, J.Y. Photocatalytic activity of TiO2 nanoparticles: A theoretical aspect. J. Mater. Chem. A 2019, 7, 13833. [Google Scholar] [CrossRef]
  34. Lin, Y.; Jiang, Z.; Zhu, C.; Hu, X.; Zhang, X.; Zhu, H.; Fand, J.; Linbe, S.H. C/B codoping effect on band gap narrowing and optical performance of TiO2 photocatalyst: A spin-polarized DFT study. J. Mater. Chem. A 2013, 1, 4516. [Google Scholar] [CrossRef]
  35. Niu, M.; Cheng, D.; Cao, D. Understanding Photoelectrochemical Properties of B–N Codoped Anatase TiO2 for Solar Energy Conversion. J. Phys. Chem. C 2013, 117, 15911–15917. [Google Scholar] [CrossRef]
  36. Zhou, X.; Dong, H. A Theoretical Perspective on Charge Separation and Transfer in Metal Oxide Photocatalysts for Water Splitting. ChemCatChem 2019, 11, 3688–3715. [Google Scholar] [CrossRef]
  37. Vorontsov, V.A.; Valdés, H.; Smirniotisc, P.G.; Paza, Y. Computational models of (001) faceted anatase TiO2 nanoparticles. J. Chem. Technol. Biotechnol. 2020, 95, 2750–2760. [Google Scholar]
  38. Tamura, T.; Ishibashi, S.; Terakura, K.; Weng, H. First-principles study of the rectifying properties of Pt/TiO2 interface. Phys. Rev. B 2009, 80, 195302. [Google Scholar] [CrossRef] [Green Version]
  39. Shahzad, N.; Hussain, A.; Mustafa, N.; Ali, N.; Kanoun, M.B.; Goumri-Said, S. First principles study of the adsorption and dissociation mechanisms of H2S on a TiO2 anatase (001) surface. RSC Adv. 2016, 6, 7941–7949. [Google Scholar] [CrossRef]
  40. Okazaki, K.; Morikawa, Y.; Tanaka, S.; Tanaka, K.; Kohyama, M. Electronic structures of Au on TiO2 (100) by first-principles calculations. Phys. Rev. B 2004, 69, 235404. [Google Scholar] [CrossRef]
  41. Marri, I.; Ossicini, S. Oxygen vacancy effects on the Schottky barrier height at the Au/TiO2 (110) interface: A first principle study. Solid State Commun. 2008, 147, 205–207. [Google Scholar] [CrossRef]
  42. Boonchun, A.; Umezawa, N.; Ohno, T.; Ouyanga, S.; Jinhua, Y. Role of photoexcited electrons in hydrogen evolution from platinum co-catalysts loaded on anatase TiO2: A first-principles study. Mater. Chem. A 2013, 1, 6664. [Google Scholar] [CrossRef]
  43. Hammer, A.; Norskov, J.K. Electronic factors determining the reactivity of metal surfaces. Surf. Sci. 1995, 343, 211–220. [Google Scholar] [CrossRef]
  44. Smidstrup, S.; Markussen, T.; Vancraeyveld, P.; Wellendorff, J.; Schneider, J.; Gunst, T.; Verstichel, B.; Stradi, D.; Khomyakov, P.A.; Vej-Hansen, U.G.; et al. QuantumATK: An integrated platform of electronic and atomic-scale modelling tools. J. Phys. Condens. Matter 2020, 32, 015901. [Google Scholar] [CrossRef]
  45. Perdew, J.P.; Burke, K.; Ernzerhof, M. Generalized gradient approximation made simple. Phys. Rev. Lett. 1996, 77, 3865–3868. [Google Scholar] [CrossRef] [Green Version]
  46. Van Setten, M.; Giantomassi, M.; Bousquet, E.; Verstraete, M.; Hamann, D.; Gonze, X.; Rignanese, G.-M. The PseudoDojo: Training and grading a 85 element optimized norm-conserving pseudopotential table. Comput. Phys. Commun. 2018, 226, 39–54. [Google Scholar] [CrossRef] [Green Version]
  47. Monkhorst, H.J.; Pack, J.D. Special points for Brillouin-zone integrations. Phys. Rev. B 1976, 13, 5188–5192. [Google Scholar] [CrossRef]
  48. Ferreira, L.G.; Marques, M.; Teles, L.K. Approximation to density functional theory for the calculation of band gaps of semiconductors. Phys. Rev. B 2008, 78, 125116. [Google Scholar] [CrossRef] [Green Version]
  49. MKanoun, M.-B.; Goumri-Said, S.; Schwingenschlögl, U.; Manchon, A. Magnetism in Sc-doped ZnO with zinc vacancies: A hybrid density functional and GGA+U approaches. Chem. Phys. Lett. 2012, 532, 96–99. [Google Scholar] [CrossRef]
  50. Tian, J. Large Oriented Arrays and Continuous Films of TiO2-Based Nanotubes. Am. Chem. Soc. 2003, 125, 12384. [Google Scholar] [CrossRef] [PubMed]
  51. Chakhtouna, H.; Benzeid, H.; Zari, N.; Qaiss, A.E.K.; Bouhfid, R. Recent progress on Ag/TiO2 photocatalysts: Photocatalytic and bactericidal behaviors. Environ. Sci. Pollut. Res. 2021, 28, 44638–44666. [Google Scholar] [CrossRef]
  52. Rajakumar, A.; Abdul Rauman, S.; Mohana Roopan, V.G.; Khanna, G.; Elango, C.; Kamaraj, A.A.; Zahir, K.; Velayutham, K. Fungus-mediated biosynthesis and characterization of TiO2 nanoparticles and their activity against pathogenic bacteria. Spectrochim. Acta Part A Mol. Biomol. Spectrosc. 2012, 91, 23–29. [Google Scholar] [CrossRef]
  53. Palencia, M.; Córdoba, A.; Bernabé, L.R. Concentration–polarization effect of poly(sodium styrenesulfonate) on size distribution of colloidal silver nanoparticlesduring diafiltration experiments. Colloid. Polym. Sci. 2014, 292, 619–626. [Google Scholar] [CrossRef]
  54. Begam, J.N. Biosynthesis and characterization of silver nanoparticles (AgNPs) using marine bacteria against certain human pathogens. Int. J. Adv. Sci. Res. 2016, 2, 152–156. [Google Scholar] [CrossRef] [Green Version]
  55. Wang, S.; Han, Z.; Di, T.; Li, R.; Liu, S.; Cheng, Z. Preparation of pod-shaped TiO2 and Ag@TiO2 nano burst tubes and their photocatalytic activity. R. Soc. Open Sci. 2019, 6, 191019. [Google Scholar] [CrossRef] [PubMed] [Green Version]
  56. Kumar, K.A.; Manonmani, J.; Senthilselvan, J. Effect on interfacial charge transfer resistance by hybrid co-sensitization in DSSC applications. J. Mater. Sci. Mater. Electron. 2014, 25, 5296–5301. [Google Scholar] [CrossRef]
  57. Chowdhury, J.; Ghosh, M. Concentration-dependent surface-enhanced Raman scattering of 2-benzoylpyridine adsorbed on colloidal silver particles. J. Colloid Interface Sci. 2004, 277, 121–127. [Google Scholar] [CrossRef]
  58. Mukherjee, P.K.; Roy, M.; Mandal, B.P.; Dey, G.K.; Mukherjee, P.K.; Ghatak, J.; Tyagi, A.K.; Kale, S.P. Green synthesis of highly stabilized nanocrystalline silver particles by a non-pathogenic and agriculturally important fungusT. asperellum. Nanotechnology 2008, 19, 075103. [Google Scholar] [CrossRef]
  59. Alsharaeh, E.H.; Bora, T.; Soliman, A.; Ahmed, F.; Bharath, G.; Ghoniem, M.G.; Khalid, M.; Abu-Salah, L.; Dutta, J. Sol-Gel-Assisted Microwave-Derived Synthesis of Anatase Ag/TiO2/GO Nanohybrids toward Efficient Visible Light Phenol Degradation. Catalysts 2017, 7, 133. [Google Scholar] [CrossRef]
  60. Tsivadze, A.Y.; Ionova, G.V.; Mikhalko, V.K.; Ionova, I.S.; Gerasimova, G.A. Plasmon properties of silver spherical nanoparticles and films. Prot. Met. Phys. Chem. Surfaces 2013, 49, 169–172. [Google Scholar] [CrossRef]
  61. Burdett, J.K.; Hughbanks, T.; Miller, G.J.; Richardson, J.W.; Smith, J.V. Structural-electronic relationships in inorganic solids: Powder neutron diffraction studies of the rutile and anatase polymorphs of titanium dioxide at 15 and 295 K. J. Am. Chem. Soc. 1987, 109, 3639. [Google Scholar] [CrossRef]
  62. Ikram, M.; Wakeel, M.; Hassan, J.; Haider, A.; Naz, S.; Ul-Hamid, A.; Haider, J.; Ali, S.; Goumri-Said, S.; Kanoun, M.B. Impact of Bi Doping into Boron Nitride Nanosheets on Electronic and Optical Properties Using Theoretical Calculations and Experiments. Nanoscale Res. Lett. 2021, 16, 82. [Google Scholar] [CrossRef] [PubMed]
  63. Khan, M.; Xu, J.; Chen, N.; Cao, W.; Ullah, A.; Usman, Z.; Khan, D.F. Effect of Ag doping concentration on the electronic and optical properties of anatase TiO2: A DFT-based theoretical study. Res. Chem. Intermed. 2013, 39, 1633–1644. [Google Scholar] [CrossRef]
  64. Guo, M.; Du, J. First-principles study of electronic structures and opticalproperties of Cu, Ag, and Au-dopedanataseTiO2. Physica B 2012, 407, 1003–1007. [Google Scholar] [CrossRef] [Green Version]
  65. Wang, Y.; Zhang, R.; Li, J.; Li, L.; Lin, S. First-principles study on transition metal-doped anatase TiO2. Nanoscale Res. Lett. 2014, 9, 46. [Google Scholar] [CrossRef] [PubMed] [Green Version]
  66. Alshoaibi, A.; Kanoun, M.B.; Haq, B.U.; AlFaify, S.; Goumri-Said, S. Insights into the Impact of Yttrium Doping at the Ba and Ti Sites of BaTiO3 on the Electronic Structures and Optical Properties: A First-Principles Study. ACS Omega 2020, 5, 15502–15509. [Google Scholar] [CrossRef]
Figure 1. XRD patterns of pure and AgNPs-doped TiO2 nanocrystals. Peaks marked by * belong to Ag. Inset shows HRTEM image of AgNPs-loaded TiO2.
Crystals 11 01488 g001
Figure 2. FT-IR spectra of pure and Ag doped TiO2 nanocrystals. Zoomed area of selected region in FTIR spectra is shown.
Crystals 11 01488 g002
Figure 3. (A) UV-Vis absorption spectra of pure and AgNPs-loaded TiO2 nanocrystals, (B) Band gap determination of (a) pure, (b) 1%, (c) 2%, (d) 5%, (e) 10%, and (f) 19% AgNPs-loaded TiO2 nanocrystals.
Crystals 11 01488 g003
Figure 4. Room-temperature Raman spectra of pure and AgNPs-loaded TiO2 nanocrystals.
Crystals 11 01488 g004
Figure 5. FESEM images of (a) pure TiO2; (b) 1% AgNPs-loaded TiO2; (c) 2% AgNPs-loaded TiO2; (d) 5% AgNPs-loaded TiO2; (e) 10% AgNPs-loaded TiO2; and (f) 19% AgNPs-loaded TiO2. Inset of (c) shows the zoomed area of selected region in which AgNPs are attached the surface of TiO2.
Crystals 11 01488 g005
Figure 6. The optimized geometry structures of 2 × 2 × 1 supercell model of anatase (a) undoped and (b) Ag doped TiO2. The blue, red, and gray spheres represent Ti atoms, O atoms, and Ag atom, respectively.
Crystals 11 01488 g006
Figure 7. Calculated Band structures and total and partial DOS of (a) pristine; (b) Ag(6.25%) doped TiO2; (c) Ag(12.5%) doped TiO2; and (d) Ag(18.75%) doped TiO2.
Crystals 11 01488 g007aCrystals 11 01488 g007b
Figure 8. Calculated Absorption coefficient spectra of Ag doped TiO2 as compared with those of pristine TiO2.
Crystals 11 01488 g008
Figure 9. Plot of Band gap obtained from experimental and DFT calculations as a function of Ag% for pure and AgNPs-loaded TiO2 nanocrystals.
Crystals 11 01488 g009
Table 1. Lattice parameters, a, c, volume, V, and average bond lengths (Å) of pure and doped anatase TiO2.
Titlea (Å)c (Å)V (Å)Ti–OO–OO–Ag
Pristine3.7829.496543.341.9602.47-
Ag(6.25%)3.8009.528550.401.9502.502.030
Ag(12.5%)3.8189.572557.081.9512.482.064
Ag(18.75%)3.8459.586561.111.9502.4782.020
Publisher’s Note: MDPI stays neutral with regard to jurisdictional claims in published maps and institutional affiliations.

