
Interfacial Microstructure Characteristics and Mechanical Properties of a Press Bonded Ti–5Al–2Sn–2Zr–4Mo–4Cr Alloy
1
School of Materials Science and Engineering, Northwestern Polytechnical University, Xi’an 710072, China
2
Shaanxi Key Laboratory of High-Performance Precision Forming Technology and Equipment, Northwestern Polytechnical University, Xi’an 710072, China
*
Author to whom correspondence should be addressed.
Crystals 2021, 11(11), 1395; https://doi.org/10.3390/cryst11111395
Submission received: 21 October 2021
/
Revised: 11 November 2021
/
Accepted: 13 November 2021
/
Published: 15 November 2021
(This article belongs to the Section Crystalline Metals and Alloys)
Abstract
:The microstructure evolution characteristics and the shear strength of bond and base alloys were investigated during the press bonding of the Ti–5Al–2Sn–2Zr–4Mo–4Cr alloy. The quantitative detection of the interfacial void shows that the interfacial voids shrunk gradually with time and a bond free of voids could be obtained at the time above 10 min. The microstructure of the base alloy shows that the primary α phase tends to be equiaxed because of the increase in plastic deformation and the variation in the volume fraction and grain size of the primary α phase that are complicated with time. The grain boundary misorientation characteristics in bond and base alloys are not consistent. However, they tend to be comparable over time. The shear strength of bond and base alloys at different times was explained and compared. The compared results indicate that the enhanced strength of the bond is mainly due to the increase in the bonded area. However, the strength of the bond decreases slightly because of the slight coarsening of the grain size and the decrease in the volume fraction of the primary α phase at the time more than 20 min. The shear strength of the bond and base alloys tends to be highest and close at 10 min.
1. Introduction
The Ti–5Al–2Sn–2Zr–4Mo–4Cr alloy is a ‘beta-rich’ α+β titanium alloy with an 8% content of β-stabililizer alloying elements such as molybdenum and chromium [1]. Due to its high strength and excellent corrosion resistance, this alloy is mainly used to manufacture important force-bearing components for aircraft engines of which the service temperature is up to 427 °C. As a solid-state bonding method, the press bonding or diffusion bonding is a common process to join titanium alloy components together without the use of the secondary phases, solvents or liquids [2,3,4,5], in which the metallurgical bond can be achieved by imposing a certain pressure for a duration at a high temperature.
The mechanical properties of press or diffusion-bonded titanium alloys are dependent on its final microstructure. The interfacial microstructure evolution during the bonding and its influence on the mechanical properties of the bond have been studied intensively. Tuppen et al. [6] examined the atom diffusion layer in the diffusion bond of the Ti-6Al-4V and Ti 500 alloy. It was found that there is an atom diffusion layer with a width of 2 μm in the bond, in which the micro hardness is higher than that in base alloy. Wang et al. [7] found that the bonding interface of the γ-TiAl alloy and Ti–6Al–4V alloy is composed of two zones and its width increases with the increase in bonding temperature. The microhardness increases monotonously from the side near the γ-TiAl alloy to the side near the Ti–6Al–4V alloy. It can be seen that a transition layer with different microstructures and mechanical properties from the base alloy forms in the dissimilar titanium alloy bond. However, in the bonding of the similar titanium alloy, there is no interface transition layer in the bond. Cepeda-Jiménez et al. [8] stated that the left voids in the bonding interface at 750 °C induces a lower interfacial toughness while a higher interfacial toughness is obtained in a superior bond without voids at 900 °C. Li et al. [9] quantitatively characterized the interfacial void size and its distribution in the bonding interface of the Ti–5Al–2Sn–2Zr–4Mo–4Cr alloy. The bonded area increases by void shrinking, which enhances the shear strength of the bond. At 860 °C and 30 MPa for 10 min, the voids disappear completely [10]. The interfacial void evolution has been investigated in the bonding process of steels [11], aluminum alloys [12], magnesium alloys [13] and titanium alloys [14]. In addition, multiform mathematic models have been established to predict the void shrinking process based on the mechanisms of diffusion and plastic flow [15,16,17]. Complete void shrinking results in the contact of the phase/grains on both sides of bonding interface and this bonding interface can be transformed to the interfacial grain boundary. A few studies have been conducted to investigate the motion and migration of the interfacial grain boundary in the bonding of metals with a single phase [18,19]. The motion and migration of the interfacial grain boundary induces a comparable microstructure in the bond with that of base alloy. However, the interfacial grain boundary characteristic in the bonding of metals with multi-phases such as titanium alloy has not been investigated in detail.
In addition, changes in the microstructure of the base titanium alloy are common during the bonding process due to its sensitivity to hot process parameters, which influences the mechanical property. Calvo et al. [20] found that the grain size of the primary α phase evidently increases which induces a decrease above 10% in the tensile strength of base alloy, even though a high-quality bond in the Ti–6Al–4V alloy was obtained at 850 °C and 4 MPa for 120 min. Similar phenomena have also been reported in the literature [21,22]. In particular, as the applied pressure is enough to cause a significant plastic deformation [10], the microstructure will be influenced. By imposing enough plastic deformation on a titanium alloy, the morphology and grain size of different phases may be changed, which induces the variation in the mechanical properties [23]. Therefore, the microstructure and the mechanical properties of the bond and base alloy should be considered simultaneously to evaluate the quality of the bonded titanium alloy.
In this work, the Ti–5Al–2Sn–2Zr–4Mo–4Cr alloy was press bonded by the application of a high pressure of 30 MPa, which induces plastic deformation in the bond. The interfacial void evolution was quantitatively analyzed, the microstructure of the base alloy was characterized by the grain size and the volume fraction of primary α phase was investigated. The grain boundary misorientation characteristics in the bonding interface and the base alloy were examined and compared via EBSD technology. The mechanical properties of the bond and base alloy were evaluated by shear testing and discussed based on the microstructure evolution of the bonding interface and the base alloy.
2. Experimental Section
2.1. Materials
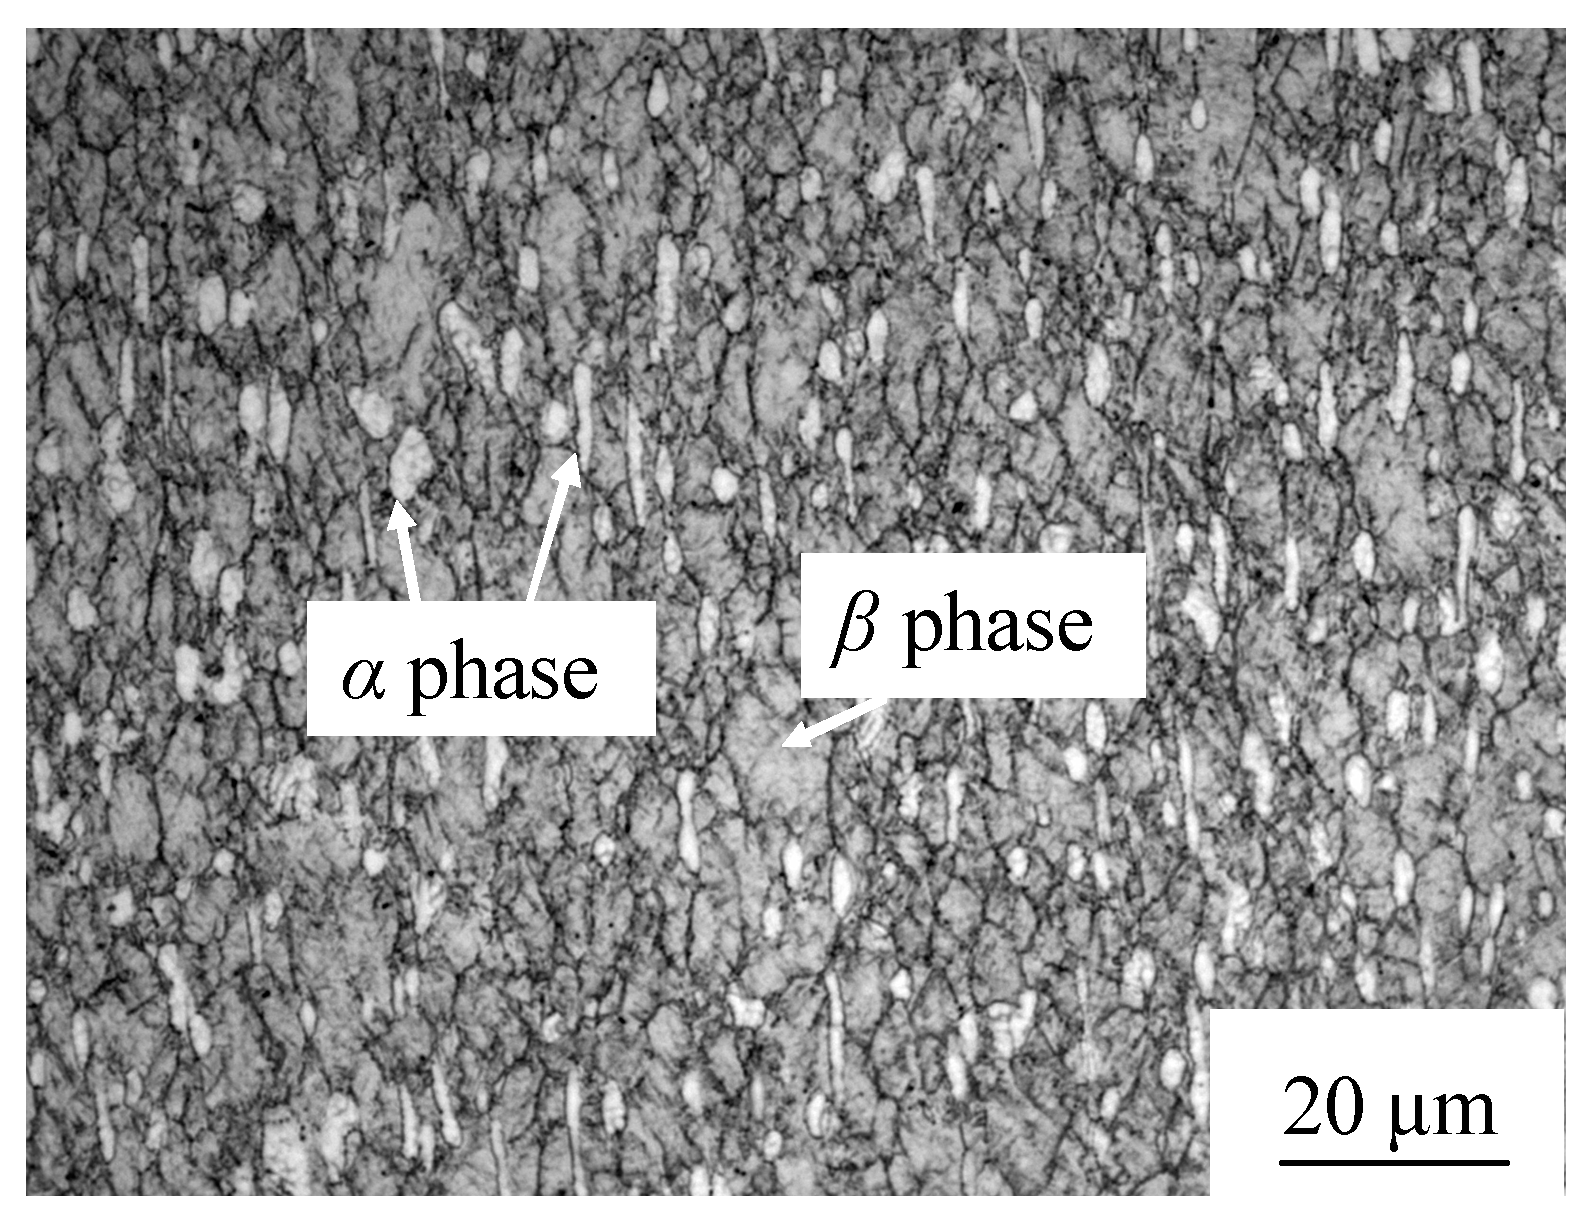
The specimens for press bonding were Ti–5Al–2Sn–2Zr–4Mo–4Cr alloy cylinders with a diameter of 30.0 mm and a height of 20.0 mm. The chemical composition (wt%) wa sas follows: 5.1 Al, 2.3S n, 2.0 Zr, 4.1 Mo, 4.1 Cr, 0.04 Fe, 0.01 C, 0.02 N, 0.004 H, 0.11 O and balance Ti. The β transus temperature was 895 ± 5 °C. The initial microstructure is shown in Figure 1. As seen from Figure 1, some equiaxed and a few elongated primary α grains were distributed in the β matrix. The grain size of primary α phase was measured as 2.7 ± 0.6 μm.
2.2. Press Bonding Procedure
Prior to press bonding, the bonding surfaces of the specimens were ground by 600#, 1000# and 1500# grit SiC paper, sequentially. The ground surfaces were ultrasonically cleaned in ethanol for 10 min and then dried. The ground surfaces of the bonding specimens were matched together and then put into a hot press with a vacuum furnace. The press bonding process in the furnace is illustrated in Figure 2. The specimens were heated to 860 °C at a heating rate of 15 °C·min−1 as the vacuum degree was higher than 5 × 10⁻³ Pa. After the temperature in the specimens became homogenous, a pressure of 30 MPa was imposed on the specimens and kept for a given time ranging from 1 min to 20 min. After bonding, the bonded specimens were cooled to room temperature in the furnace. The deformation ratio of the Ti–5Al–2Sn–2Zr–4Mo–4Cr alloy was denoted by calculating the height reduction in the bonded specimens before and after bonding.
2.3. Microstructure Examination
The bonded specimens were axially sectioned and prepared by the standard metallographic method. The microstructure morphology of the bond was examined using a SUPRA-55 scanning electron microscopy (SEM) (Wetzlar, Germany). The interfacial void size was measured by using Image-Pro Plus software (Rockville, MD, USA). The void size was denoted by the length of the void along the bonding interface as illustrated in Figure 3. The ratio of the length of the bonding interface free of voids to that of the whole bonding interface was calculated and denoted as the percent of bonded area.
The areas of primary α phases were measured by using Image-Pro Plus software. The volume fraction of the primary α phase was denoted by the ratio of the areas of primary α phases to the areas of SEM images. The grain size of the primary α phase was denoted by the average diameter of primary α grains of which the shapes are considered to be equiaxed.
Electron backscattered diffraction (EBSD) examinations on the bonds were performed on a TESCAN MIRA3 XMU SEM (Kohoutovice, Czech Republic) equipped with a Nordlys EBSD detector and HKL Channel 5 software to investigate the grain orientation in the α phase and β phase. Two rectangular areas with a length of 40 μm and a width of 6 μm were chosen to account for the misorientations of the α grain boundaries and β grain boundaries. One area where the medium line was located at the bonding interface was denoted as the bonding zone (BZ) and the other area located in the base alloy adjacent to the BZ was denoted as the vicinity of the bonding zone (VBZ).
2.4. Lap Shear Tests
To evaluate the mechanical properties of the bond and base alloy in the press-bonded Ti–5Al–2Sn–2Zr–4Mo–4Cr alloy, the lap shear test was conducted with an INSTRON 3382 universal test machine (Boston, MA, USA) with a crosshead speed of 1.0 mm·min−1. The location and dimension of the shear samples cut from the bond and base alloy can be seen in Figure 4. The shear plane of the shear samples was cut from the bond located in the bonding interface. The shear fracture surfaces were observed on a SUPRA-55 SEM (Wetzlar, Germany).
3. Results and Discussion
3.1. Deformation Ratio
Because the applied pressure of 30 MPa was higher than the yield stress of the Ti–5Al–2Sn–2Zr–4Mo–4Cr alloy at 860 °C [1], an evident plastic deformation was achieved in the press bonding. The height reductions in the bonded specimens at different times were measured to evaluate the plastic deformation as illustrated in Figure 5. It can be seen that the height reduction increased with time. The highest height reduction was about 57.7%, which was obtained at 20 min in this study.
3.2. Microstructure Morphology of the Bond
Figure 6 shows the microstructure morphology of the Ti–5Al–2Sn–2Zr–4Mo–4Cr alloy bond obtained at different times. The white solid arrows represent the initial bonding interface. As can be seen from Figure 6a, the bonding interface was distinct and straight at the time of 1 min. There were some voids with a small size left in the bonding interface. The SEM image with a high magnification in Figure 6a shows that the void was nearly in a shape of ellipse. The interfacial grain/phase boundaries formed in some zones of the bonding interface where the voids closed completely. At 3 min, the bonding interface became indistinct as shown in Figure 6b and the number of voids decreased while the size and morphology of the voids varied slightly. At 5 min, there were only a few tiny and round voids distributed in the bonding interface, as shown in Figure 6c. The bonding interface was not continuous and some parts were not distinct from the base alloy. At 10 min, it can be seen from Figure 6d that all the voids disappeared completely and the microstructure abutting the bonding interface was comparable to that of the base alloy. This demonstrates that a sound bond without any voids was formed. At 20 min, there was no distinct variation in the bonding interface morphology shown in Figure 6e compared to that shown in Figure 6d. In addition, the microstructure in the base alloy abutting the bonding interface varied with time, as can be seen from Figure 6. As the time increased from 1 min to 20 min, the elongated primary α grains tended to be equiaxed. This variation is mainly attributed to the increase in plastic deformation with time, as shown in Figure 5.
3.3. Interfacial Void Size and Distribution
As shown in Figure 6, the interfacial void size at different times was measured and is illustrated in Figure 7. It can be seen that the voids in the bonding interface were not uniform. As shown in Figure 7a, about 93% of the voids were in the size range from 0.62 μm to 2.7 μm and the maximum void size was about 4.7 μm at 1 min. At 3 min, about 95% of the voids had a size ranging from 0.65 μm to 2.8 μm and the maximum void size was approximately 4.6 μm. At 5 min, the void size decreased evidently and became more uniform. The maximum void size was only 1.9 μm and the size of more than 92% of the voids was less than 1.0 μm, as shown in Figure 7c. As the time was more than 10 min, the void size decreased to zero and there was no void in the bonding interface. The shrinking of the voids is mainly due to the plastic flow on the bonding surfaces and atom diffusion [24].
The average void size and bonding ratio in the bonding interface at different times were calculated and are listed in Table 1. It can be seen from Table 1 that the average void size decreased from 1.2 μm to zero and the bonding ratio increased from 89.4% to 100% as the time increased from 1 min to 10 min. As the time was not less than 10 min, all the voids disappeared and the interfacial grain/phase boundaries formed in the whole bonding interface, which caused the continuous grains or phases.
3.4. Volume Fraction and Grain Size of the Primary α Phase
The volume fraction and grain size of the primary α phase shown in Figure 6 are listed in Table 2. The influence of time on the volume fraction and the grain size of the primary α phase is complicated. From 1 min to 5 min, both the volume fraction and grain size firstly decreased to a low level and then increased. At 10 min, the volume fraction increased to a highest level while the grain size decreased. At 20 min, there was a slight decrease in the volume fraction and a rare increase in grain size, as shown in Table 2. The variation in the volume fraction and the grain size of the primary α phase with time is mainly dependent on the coupling contributions of α→β phase transformation and the grain growth of the primary α phase at the temperature of 860 °C.
3.5. Grain Boundary Misorientation
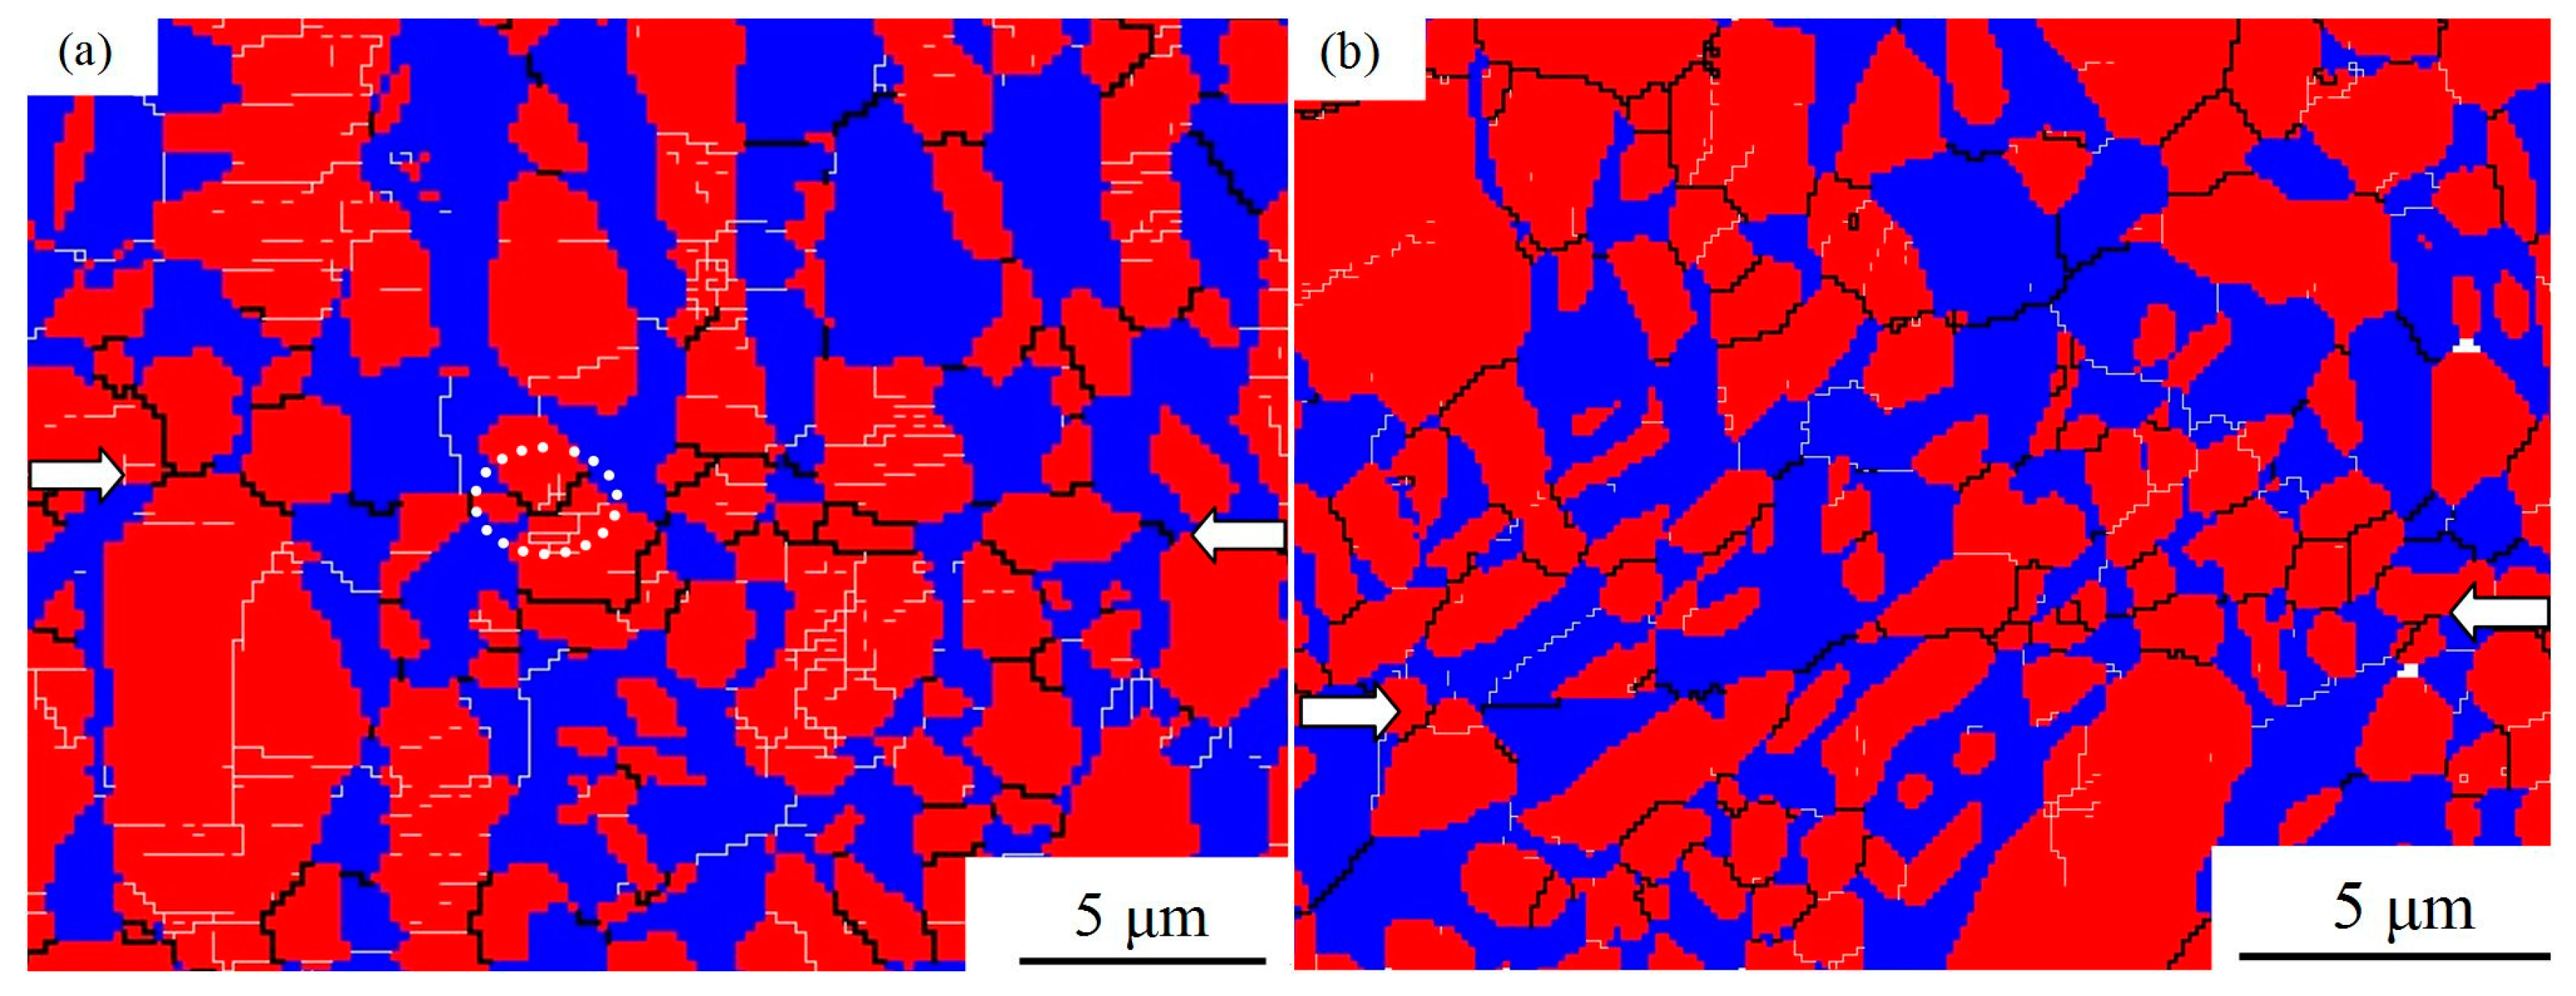
Figure 8 shows the EBSD orientation maps of the Ti–5Al–2Sn–2Zr–4Mo–4Cr alloy bonds obtained at 1 min and 10 min. The white arrows represent the bonding interface. Low angle boundaries (LABs) with misorientations between 2° and 15° and high angle boundaries (HABs) with a misorientation of more than 15° are denoted by white lines and black lines, respectively. The α grains and β grains are marked in red and in blue, respectively. It can be seen from Figure 8 that the interfacial grain boundaries were almost HABs at different times. At 1 min, Figure 8a shows that large numbers of interfacial grain boundaries denoted in the dashed ellipse were not in a straight line, which demonstrates that the interfacial grain/phase boundary migrated. In addition, there were many LABs in primary α grains. At 10 min, the bonding interface was difficult to identify from the base alloy, as shown in Figure 8b. There were only a few LABs in the primary α grains.
Figure 9 shows the misorientation distribution of the α grain boundary in BZ and VBZ at 1 min and 10 min. It can be seen that there was only a little difference between the misorientation distribution characteristics of the α grain boundary in BZ and those in VBZ. The total relative frequency of HABs in BZ was slightly higher than that in VBZ. The average misorientation of the α grain boundary in BZ as listed in Table 3 was close to that in VBZ. It can be concluded that the misorientation of the interfacial grain boundary between two α grains was similar to that of the actual α grain boundary in the base alloy. However, the influence of time on the misorientation of α grain boundary was significant. From 1 min to 10 min, the relative frequency of HABs increased evidently in BZ and VBZ. An increase above 60% in the average misorientation of α grain boundary is shown in Table 3.
Figure 10 shows the misorientation distribution of the β grain boundary in BZ and VBZ at 1 min and 10 min. The results in Figure 10a indicate that the misorientation distribution of the β grain boundary in BZ was different to that in VBZ when the Ti–5Al–2Sn–2Zr–4Mo–4Cr alloy was bonded at 1 min. Some misorientation angles of the β grain boundary in BZ exceeded 25° while almost 100% of the misorientation angles of the β grain boundary in VBZ were below 25°. The total relative frequency of HABs in BZ was evidently higher than that in VBZ. The average misorientation angle of the β grain boundary in BZ was around twice that in VBZ, as listed in Table 3. As the Ti–5Al–2Sn–2Zr–4Mo–4Cr alloy was bonded at 10 min, the total relative frequency of HABs in BZ and VBZ increased simultaneously. Although a few misorientation angles of the β grain boundary in BZ (Figure 10b)) were distributed in the range from 30° to 50° compared to that in VBZ (Figure 10b′), the total relative frequency of LABs and HABs in BZ was close to that in VBZ and the difference in the calculated average misorientation angles of β grain boundary between BZ and VBZ was smaller, as listed in Table 3. The results demonstrate that the misorientation of the interfacial grain boundary between two separate β grains was not consistent with that of the β grain boundary in the base alloy. However, it is beneficial to obtain the interfacial grain boundaries with the misorientation characteristics comparable to that of the actual β grain boundary by prolonging the time.
3.6. Shear Strength of the Bond
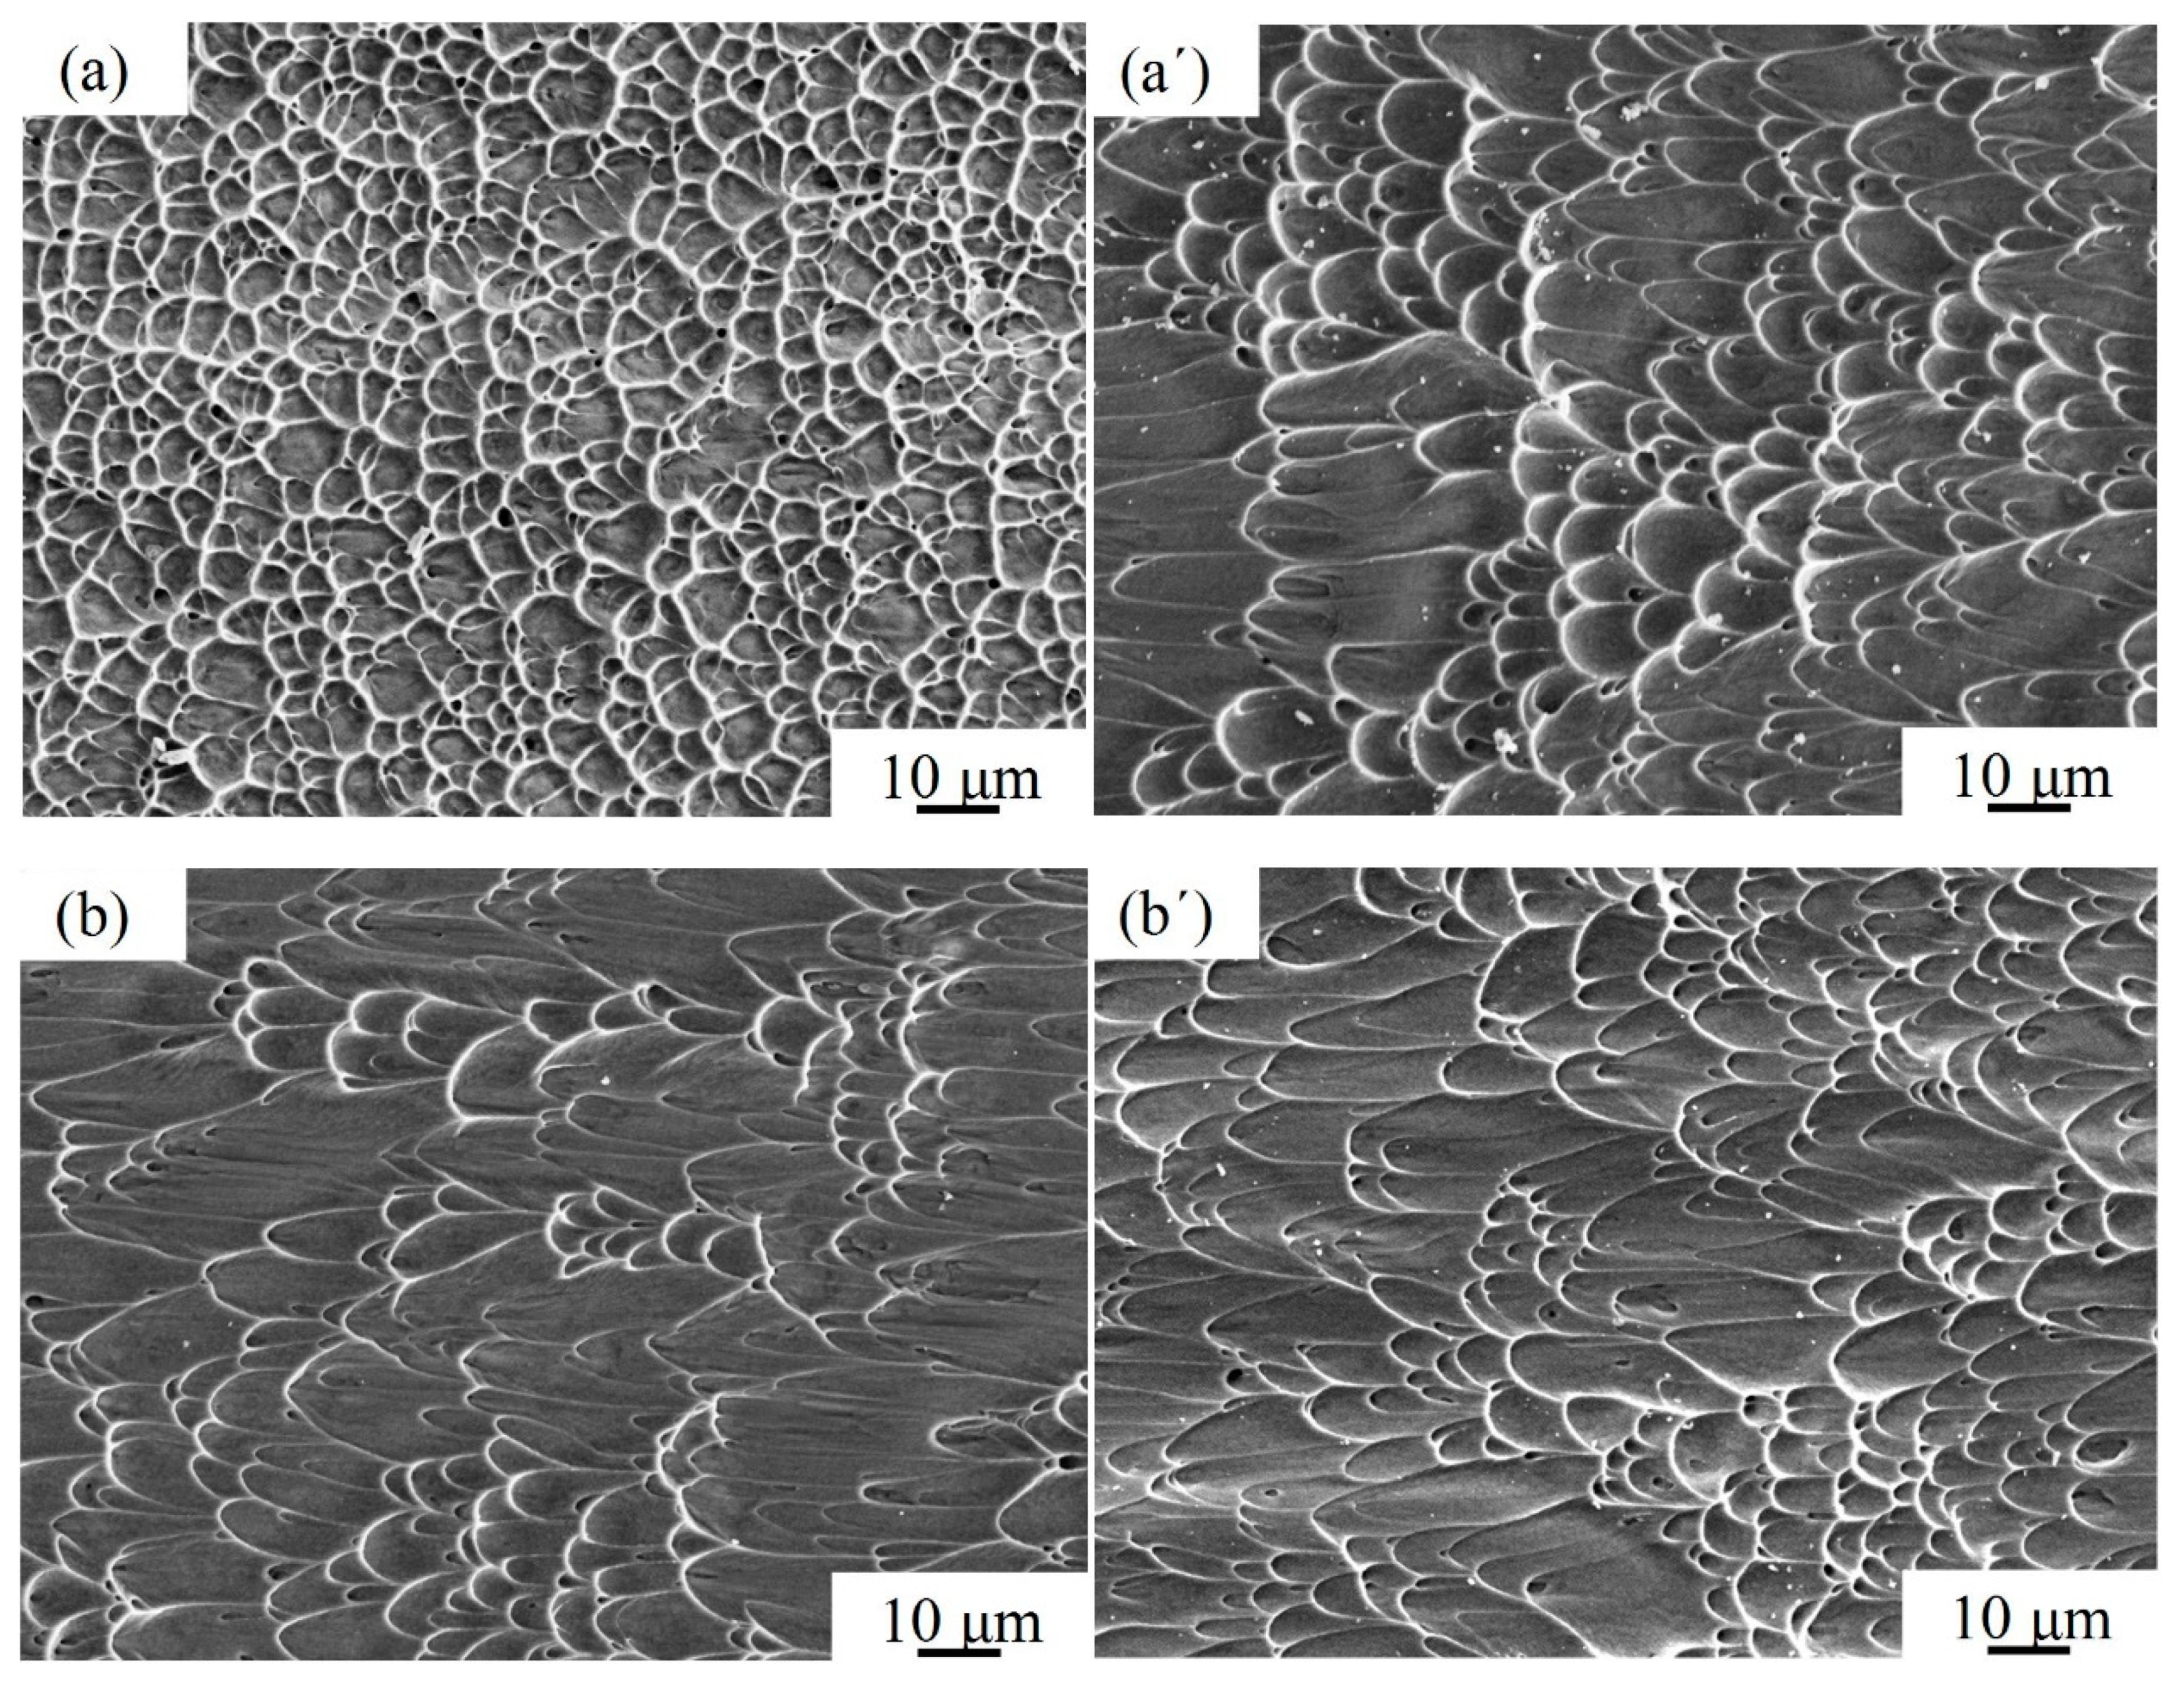
Table 4 shows the shear strength of the bond and base alloy of Ti–5Al–2Sn–2Zr–4Mo–4Cr alloy at different times. At 1 min, the shear strength of bond was about 847.7 MPa, which was lower that of the base alloy. From the microscopic morphology of the shear fracture surfaces of the bond shown in Figure 11a, it can be seen that the equiaxed dimples were distributed in the shear fracture surfaces, which shows the ductile fracture chracteristics and demonstrates the formation of a metallurgical bond. However, the metallurgical bonding strength was not high enough because the dimples were very small in area and in depth compared with those on the shear fracture surface of the base alloy shown in Figure 11a′. This is because some voids were left in the bonding interface shown in Figure 6a and the atom diffusion across the bonding interface in bonded area was not enough to obtain a high metallurgical bonding strength. Meanwhile, the interfacial grain boundaries were still not comparable to that of actual grain boundaries in the base alloy.
From 1 min to 5 min, the shear strength of the base alloy decreased slightly because of the microstructure evolution shown in Figure 6 and Table 2. However, the shear strength of the bond increased evidently. It can be concluded that the increase in the bonded area by void shrinking improved the strength of bond. At 10 min, the shear strength of the bond and base alloy tended to be highest at the same time. Meanwhile, the shear strength of bond was also close to that of base alloy. The dimples on the shear fracture surface of the bond shown in Figure 11b were large in size and in the shape of parabola parallel to the shearing direction, which were similar to those shown in Figure 11b′. This is mainly due to the comparable microstructure of the bond with the base alloy, in which all voids shrank completely and the grain boundary misorientation characteristics were similar to those in the base alloy. In addition, the increase in HABs helps to enhance the strength of alloy and promotes the atom diffusion across the grain boundary owing to the higher grain boundary diffusion coefficient in HABs than in LABs [25,26]. However, at 20 min, the shear strength of the bond and base alloy decreased slightly because of the slight coarsening of the grain size and the decrease in the volume fraction of the primary α phase, as shown in Table 2. Therefore, the time from 10 min to 20 min is reasonable to perform the press bonding of the Ti–5Al–2Sn–2Zr–4Mo–4Cr alloy at a temperature of 860 °C and a pressure of 30 MPa.
4. Conclusions
In this study, the formation and evolution of the bonding interface was investigated in the press bonding of the Ti–5Al–2Sn–2Zr–4Mo–4Cr alloy at a temperature of 860 °C and pressure of 30 MPa. The morphology of the bonding interface was investigated via SEM at different times. Voids resulting from the ridges in the bonding surfaces gradually closed. The void size decreased and the bonding ratio increased with time. A bonding interface free of voids could be obtained and the structure characteristics of the bonding interface were rarely identified from that of the base alloy as the time was not less than 10 min.
The EBSD examination results showed that GBBIs formed in the bonding interface were almost HABs. By increasing the time from 1 min to 10 min, the total relative frequency of HABs and the average misorientation angle of GBBIs increased and the misorientation distribution of GBBIs tended to be close to that of the grain boundary in the base alloy. The increasing of HABs promoted grain boundary diffusion which is beneficial to the formation of GBBIs with a metallurgical structure comparable to that of the actual grain boundary in the base alloy.
The shear strength of the bond increased with the increase in time from 1 min to 10 min, and then rarely varied as the time increased to 20 min. The highest shear strength of bond was 950.6 MPa which was obtained simultaneously at 10 min, which was close to that of the base alloy. The structure of GBBIs formed after 10 min is likely to be comparable to that of the grain boundary in the base alloy.
In summary, a bond with the equivalent mechanical properties of a base alloy can be obtained in a short time due to the imposition of plastic deformation during the press bonding of a Ti–5Al–2Sn–2Zr–4Mo–4Cr alloy. The application of this method to the manufacturing of industrial components may help to reduce the production cycle and costs.
Author Contributions
Conceptualization, H.L. and M.L.; methodology, H.L.; software, H.L.; validation, H.L.; formal analysis, H.L.; investigation, H.L.; data curation, H.L.; writing—original draft preparation, H.L.; writing—review and editing, H.L.; visualization, M.L.; supervision, M.L.; project administration, M.L.; funding acquisition, H.L. All authors have read and agreed to the published version of the manuscript.
Funding
This research was funded by the Shaanxi Key Laboratory of Precision Forming Technology and Equipment (SKL-PFTE) (No. PETE-2019-ZZ-01) and Fundamental Research Funds for the Central Universities (No. 3102019MS0403).
Institutional Review Board Statement
Not applicable.
Informed Consent Statement
Not applicable.
Data Availability Statement
Not applicable.
Acknowledgments
This work was supported by the project of the Shaanxi Key Laboratory of Precision Forming Technology and Equipment (SKL-PFTE) (No. PETE-2019-ZZ-01) and Fundamental Research Funds for the Central Universities (No. 3102019MS0403).
Conflicts of Interest
The authors declare no conflict of interest.
References
- Li, H.; Li, M.Q.; Han, T.; Liu, H.B. The deformation behavior of isothermally compressed, Ti-17 titanium alloy in α + β field. Mater. Sci. Eng. A 2012, 546, 40–45. [Google Scholar] [CrossRef]
- Wang, Y.; Hu, B.; Wei, Y.; Feng, G.; Deng, D. Microstructure and mechanical properties of vacuum diffusion bonded, Ti2AlNb/Ti/TC4 joint. Crystals 2021, 11, 770. [Google Scholar] [CrossRef]
- Lee, H.S.; Yoon, J.H.; Yi, Y.M. Oxidation behavior of titanium alloy under diffusion bonding. Thermochim. Acta 2007, 455, 105–108. [Google Scholar] [CrossRef]
- Zhang, C.; Li, M.Q.; Li, H. The behavior and mechanism of void self-shrinkage in diffusion bonded 1Cr11Ni2W2MoV steel joint: Effect of temperature and void morphology. J. Manuf. Process. 2018, 35, 71–78. [Google Scholar] [CrossRef]
- Li, H.; Yang, C.; Sun, L.X.; Li, M.Q. Hot press bonding of γ-TiAl and, TC 17 at a low bonding temperature by imposing plastic deformation and post heating. Mater. Lett. 2017, 187, 4–6. [Google Scholar] [CrossRef]
- Tuppen, S.J.; Bache, M.R.; Voice, W.E. A fatigue assessment of dissimilar titanium alloy diffusion bonds. Int. J. Fatigue 2005, 27, 651–658. [Google Scholar] [CrossRef]
- Wang, X.F.; Ma, M.; Liu, X.B.; Lin, J.G. Interface characteristics in diffusion bonding of γ-TiAl alloy to, Ti-6Al-4V. J. Mater. Sci. 2007, 42, 4004–4008. [Google Scholar] [CrossRef]
- Cepeda-Jiménez, C.M.; Carreño, F.; Ruano, O.A.; Sarkeeva, A.A.; Kruglov, A.A.; Lutfullin, R.Y. Influence of interfacial defects on the impact toughness of solid state diffusion bonded, Ti-6Al-4V alloy based multilayer composites. Mater. Sci. Eng. A 2013, 563, 28–35. [Google Scholar] [CrossRef] [Green Version]
- Li, H.; Zhang, C.; Liu, H.B.; Li, M.Q. Bonding interface characteristic and shear strength of diffusion bonded, Ti-17 titanium alloy, Trans. Nonferrous. Met. Soc. China 2015, 25, 80–87. [Google Scholar]
- Li, H.; Liu, H.B.; Yu, W.X.; Li, M.Q. Fabrication of high strength bond of, Ti-5Al-2Sn-2Zr-4Mo-4Cr alloy using press bonding under a high bonding pressure. Mater. Lett. 2013, 108, 212–214. [Google Scholar] [CrossRef]
- Chen, J.G.; Liu, C.X.; Wei, C.; Liu, Y.C.; Li, H.J. Study on microstructure and mechanical properties of direct diffusion bonded low-carbon, RAFM steels. J. Manuf. Process. 2019, 43, 192–199. [Google Scholar] [CrossRef]
- Wu, H.; Lee, S. Effect of bonding variables on bonding mechanisms in press bonding superplastic 8090 aluminium alloy. Mater. Sci. Technol. 2001, 17, 906–911. [Google Scholar] [CrossRef]
- Somekawa, H.; Watanabe, H.; Mukai, T.; Higashi, K. Low temperature diffusion bonding in a superplastic, AZ31 magnesium alloy. Scr. Mater. 2003, 48, 1249–1254. [Google Scholar] [CrossRef]
- Wang, X.L.; Zhao, Y.Q.; Hou, H.L.; Wang, Y.Q. Effect of hydrogen content on superplastic forming/diffusion bonding of, TC21 alloys. J. Alloys Compd. 2010, 503, 151–154. [Google Scholar] [CrossRef]
- Derby, B.; Wallach, E.R. Theoretical model for diffusion bonding. Met. Sci. 1982, 16, 49–56. [Google Scholar] [CrossRef]
- Somekawa, H.; Tanaka, T.; Sasaki, H.; Kita, K.; Inoue, A.; Higashi, K. Diffusion bonding in ultra fine-grained, Al-Fe alloy indicating high-strain-rate superplasticity. Acta Mater. 2004, 52, 1051–1059. [Google Scholar] [CrossRef]
- Ma, R.F.; Li, M.Q.; Li, H.; Yu, W.X. Modeling of void closure in diffusion bonding process based on dynamic conditions. Sci. China Technol. Sci. 2012, 55, 2420–2431. [Google Scholar] [CrossRef]
- Hu, W.; Ponge, D.; Gottstein, G. Origin of grain boundary motion during diffusion bonding by hot pressing. Mater. Sci. Eng. A 1995, 190, 223–229. [Google Scholar] [CrossRef]
- Zhang, C.; Li, H.; Li, M.Q. Role of surface finish on interface grain boundary migration in vacuum diffusion bonding. Vacuum 2017, 137, 49–55. [Google Scholar] [CrossRef]
- Calvo, F.A.; De Salazar, J.M.G.; Urena, A.; Perosanz, F. Diffusion bonding of, Ti-6Al-4V alloy at low temperature: Metallurgical aspects. J. Mater. Sci. 1992, 27, 391–398. [Google Scholar] [CrossRef]
- Xun, Y.W.; Tan, M.J. Applications of superplastic forming and diffusion bonding to hollow engine blades. J. Mater. Process. Technol. 2000, 99, 80–85. [Google Scholar] [CrossRef]
- Han, W.B.; Zhang, K.F.; Wang, G.F. Superplastic forming and diffusion bonding for honeycomb structure of, Ti-6Al-4V alloy. J. Mater. Process. Technol. 2007, 183, 450–454. [Google Scholar] [CrossRef]
- Luo, J.; Li, M.; Yu, W.; Li, H. Effect of the strain on processing maps of titanium alloys in isothermal compression. Mater. Sci. Eng. A 2009, 504, 90–98. [Google Scholar] [CrossRef]
- Chen, H.Y.; Cao, J.; Song, X.G.; Feng, J.C. Contributions of atomic diffusion and plastic deformation to the plasma surface activation assisted diffusion bonding of zirconium-based bulk metallic glass. Appl. Phys. Lett. 2012, 100, 211602. [Google Scholar] [CrossRef]
- Jardim, P.M.; Acchar, W.; Losch, W. Grain boundary reactive diffusion during, Ni2Si formation in thin films and its dependence on the grain boundary angle. Appl. Surf. Sci. 1999, 137, 163–169. [Google Scholar] [CrossRef]
- Das, S.K.; Brodusch, N.; Gauvin, R.; Jung, I.H. Grain boundary diffusion of, Al in, Mg. Scr. Mater. 2014, 80, 41–44. [Google Scholar] [CrossRef]
Figure 1.
Initial microstructure of the Ti–5Al–2Sn–2Zr–4Mo–4Cr alloy.

Figure 2.
Schematic diagram for the press bonding process.
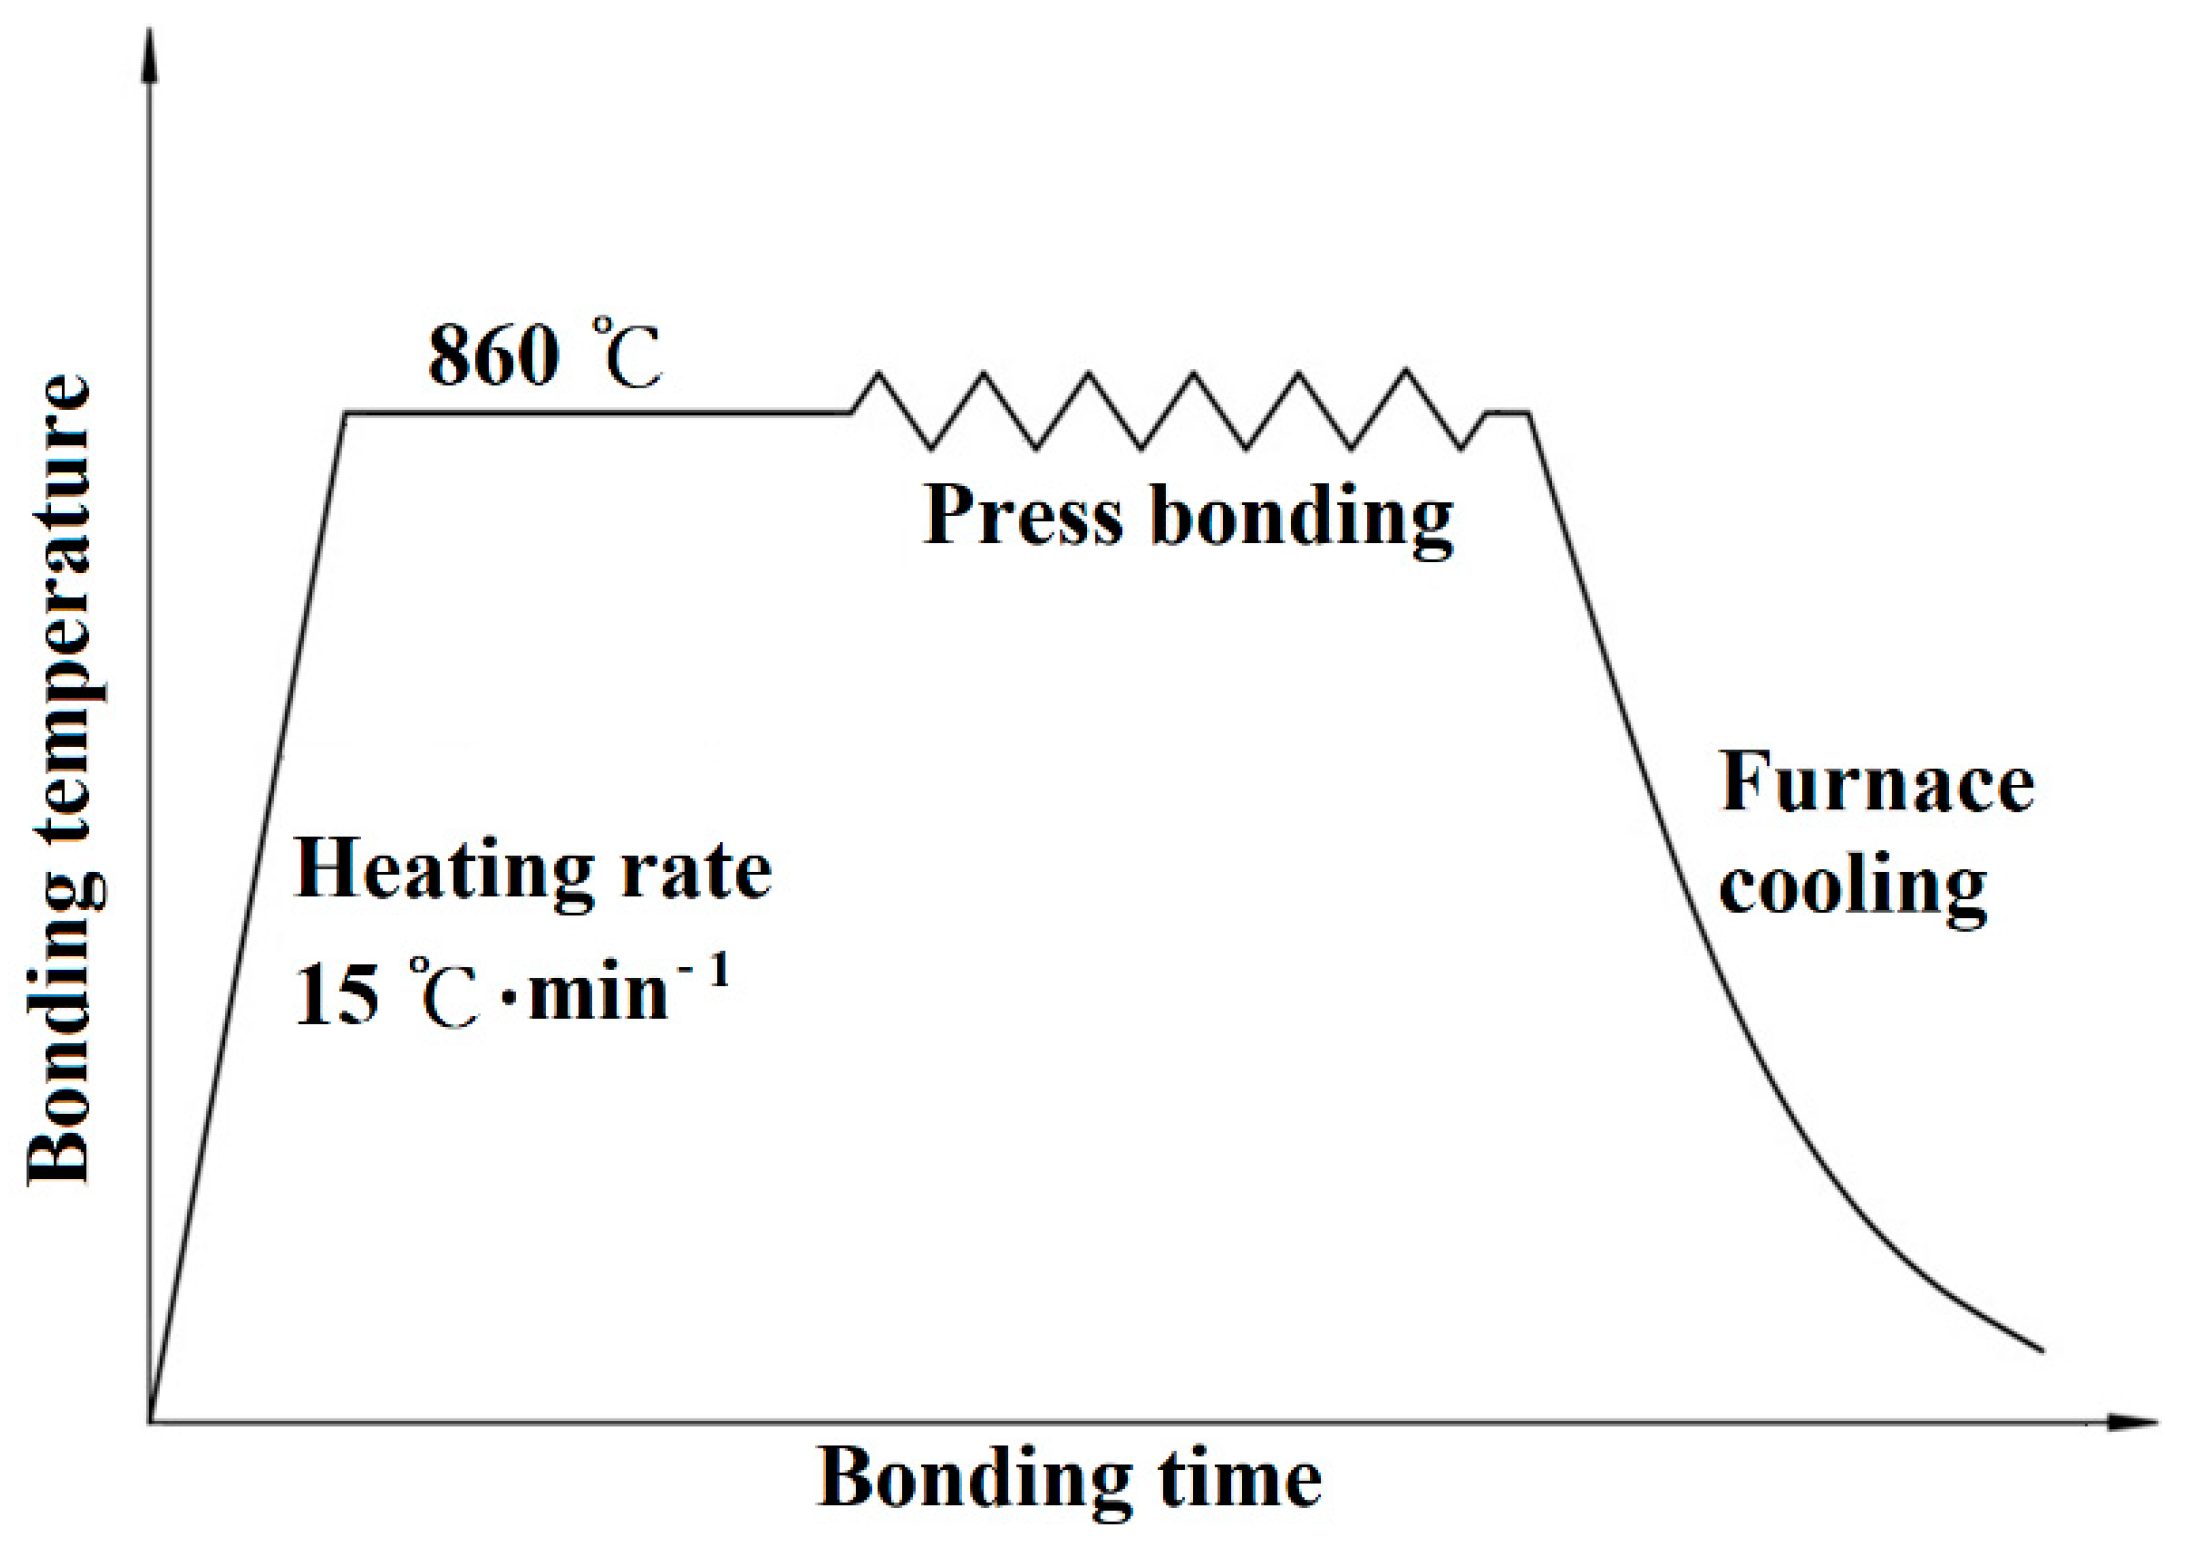
Figure 3.
Schematic diagram for measuring the void size.
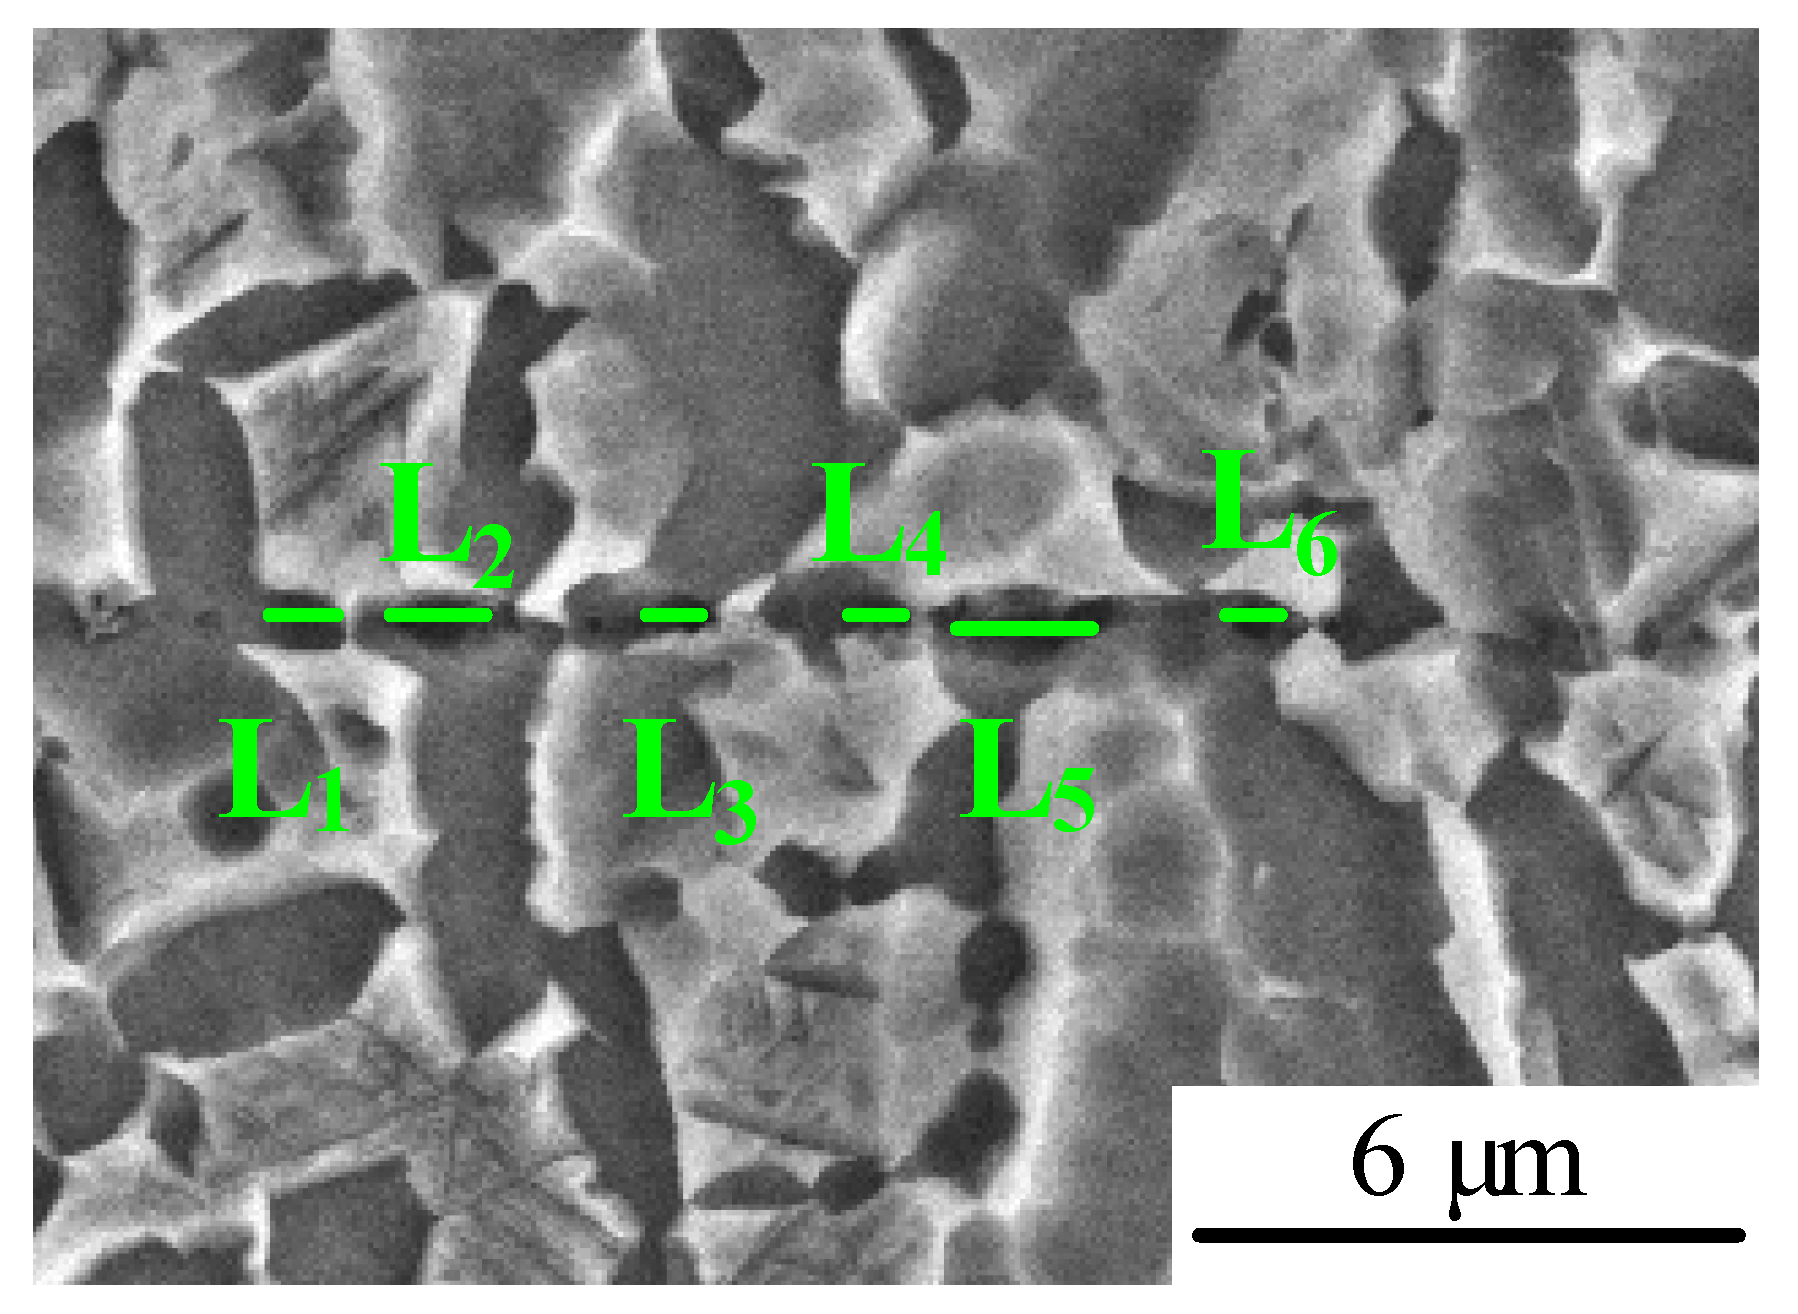
Figure 4.
Location (a) and dimension (b) of the shear samples cut from the bond and base alloy. (Unit: mm).
Figure 4.
Location (a) and dimension (b) of the shear samples cut from the bond and base alloy. (Unit: mm).
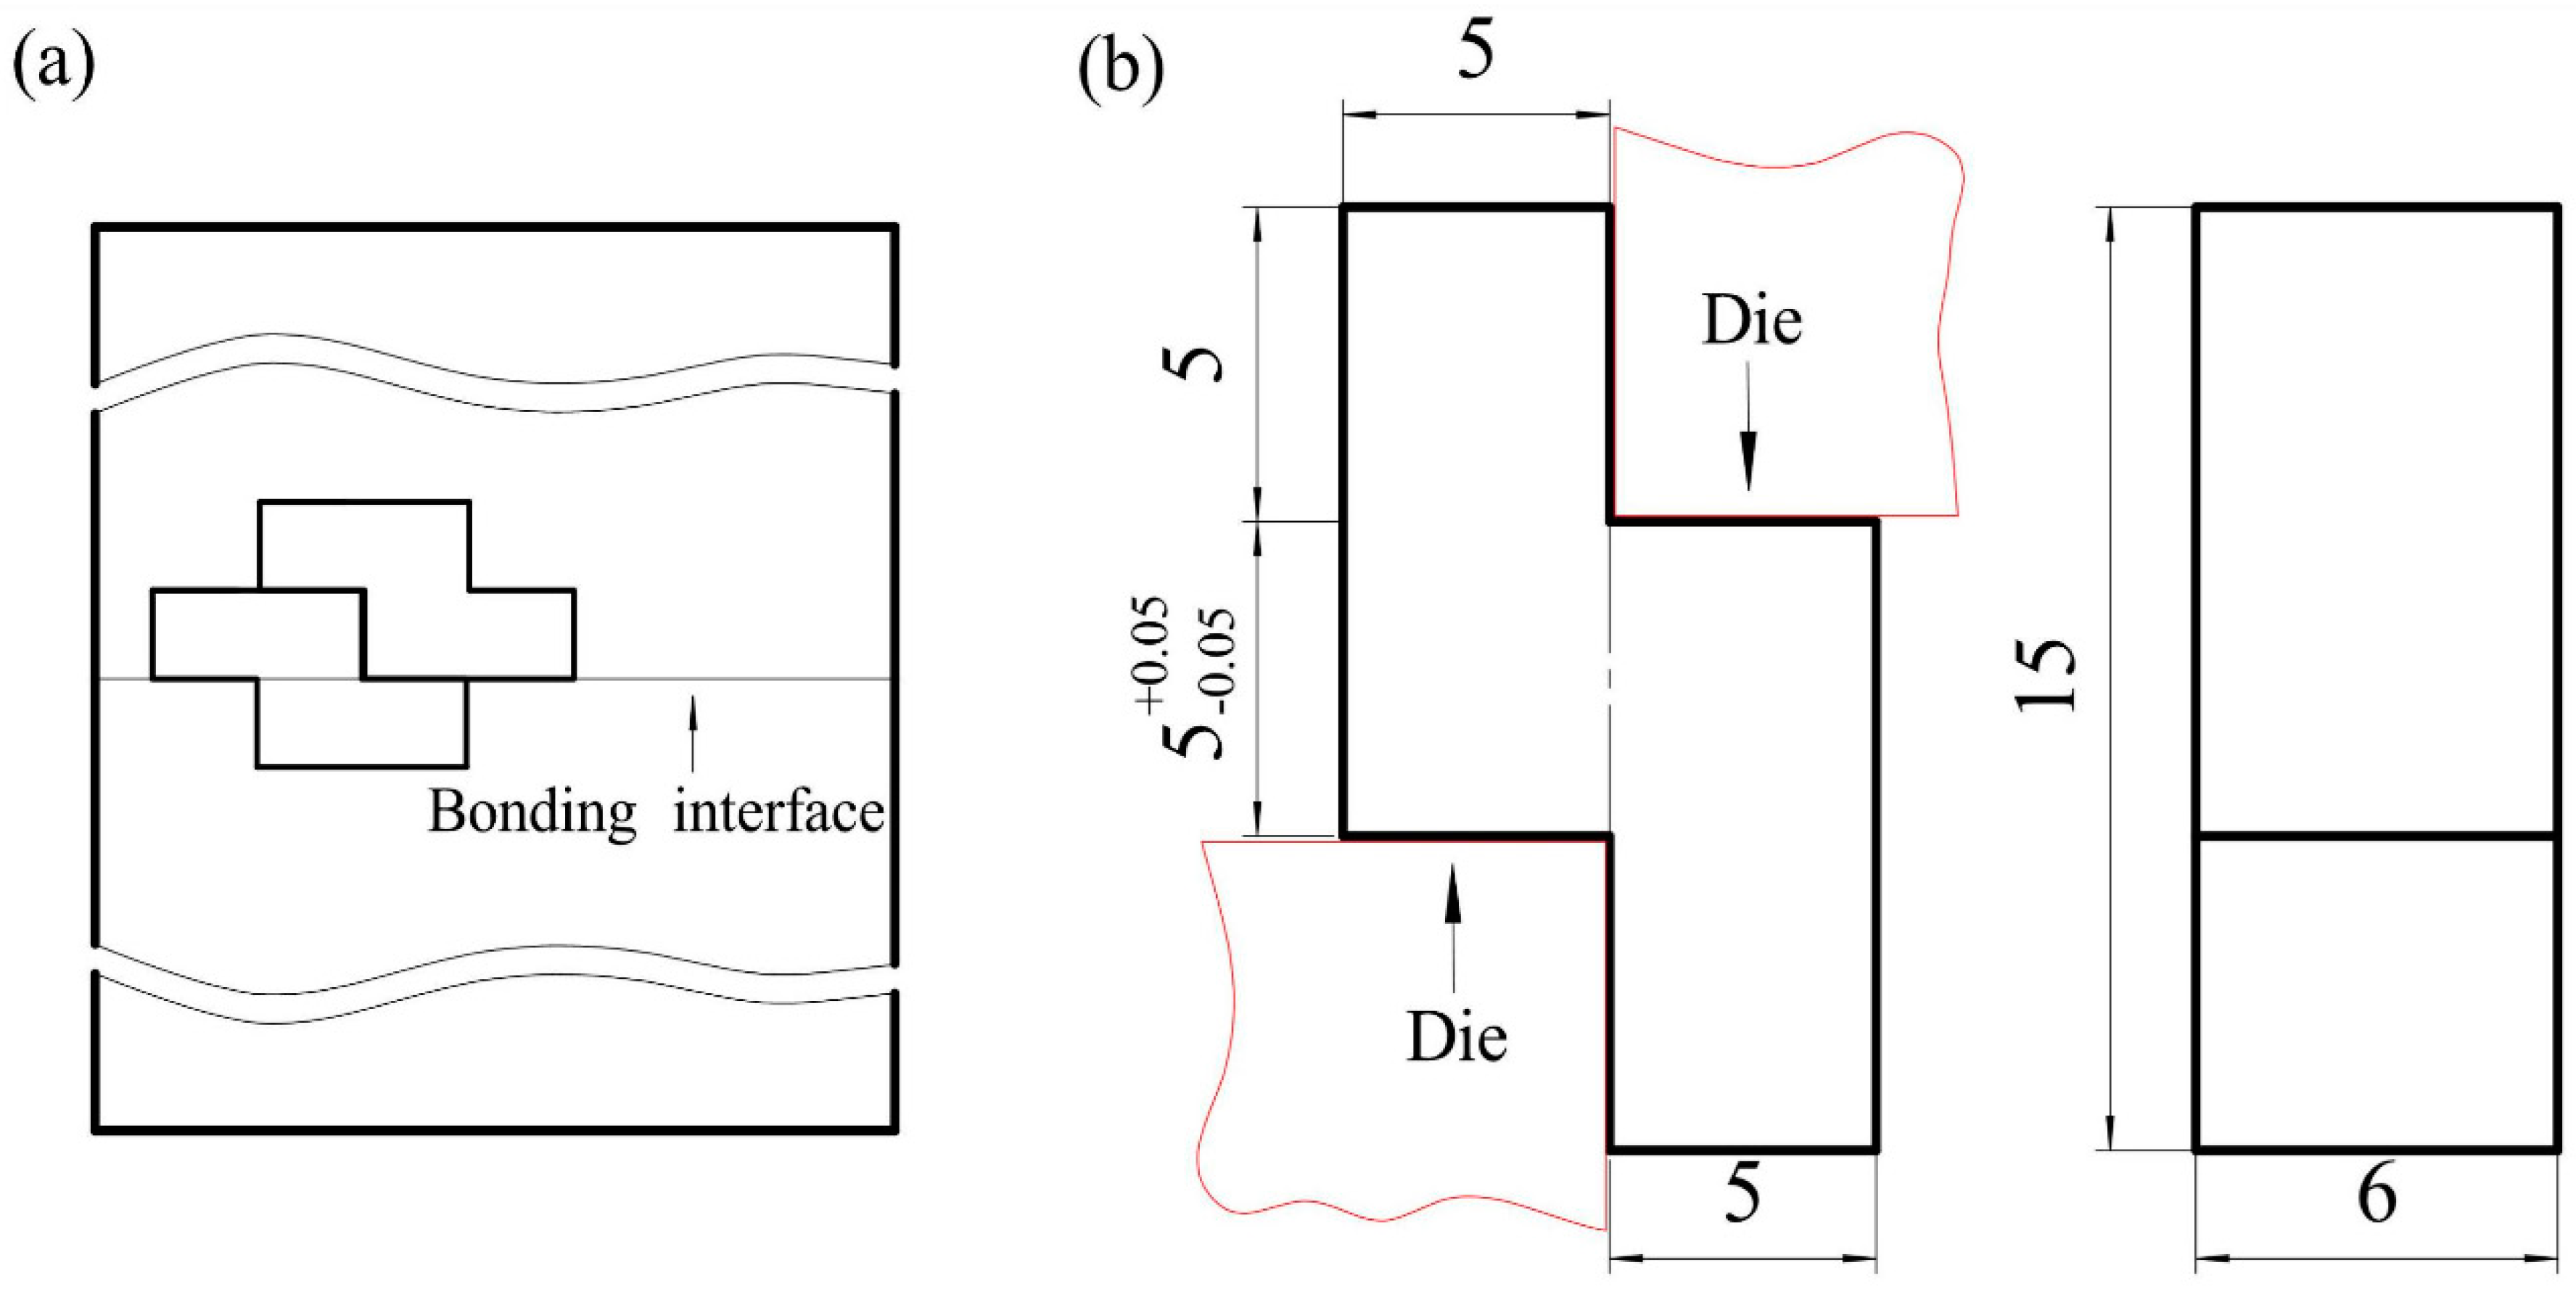
Figure 5.
Height reductions in the bonded Ti–5Al–2Sn–2Zr–4Mo–4Cr alloy at different times.
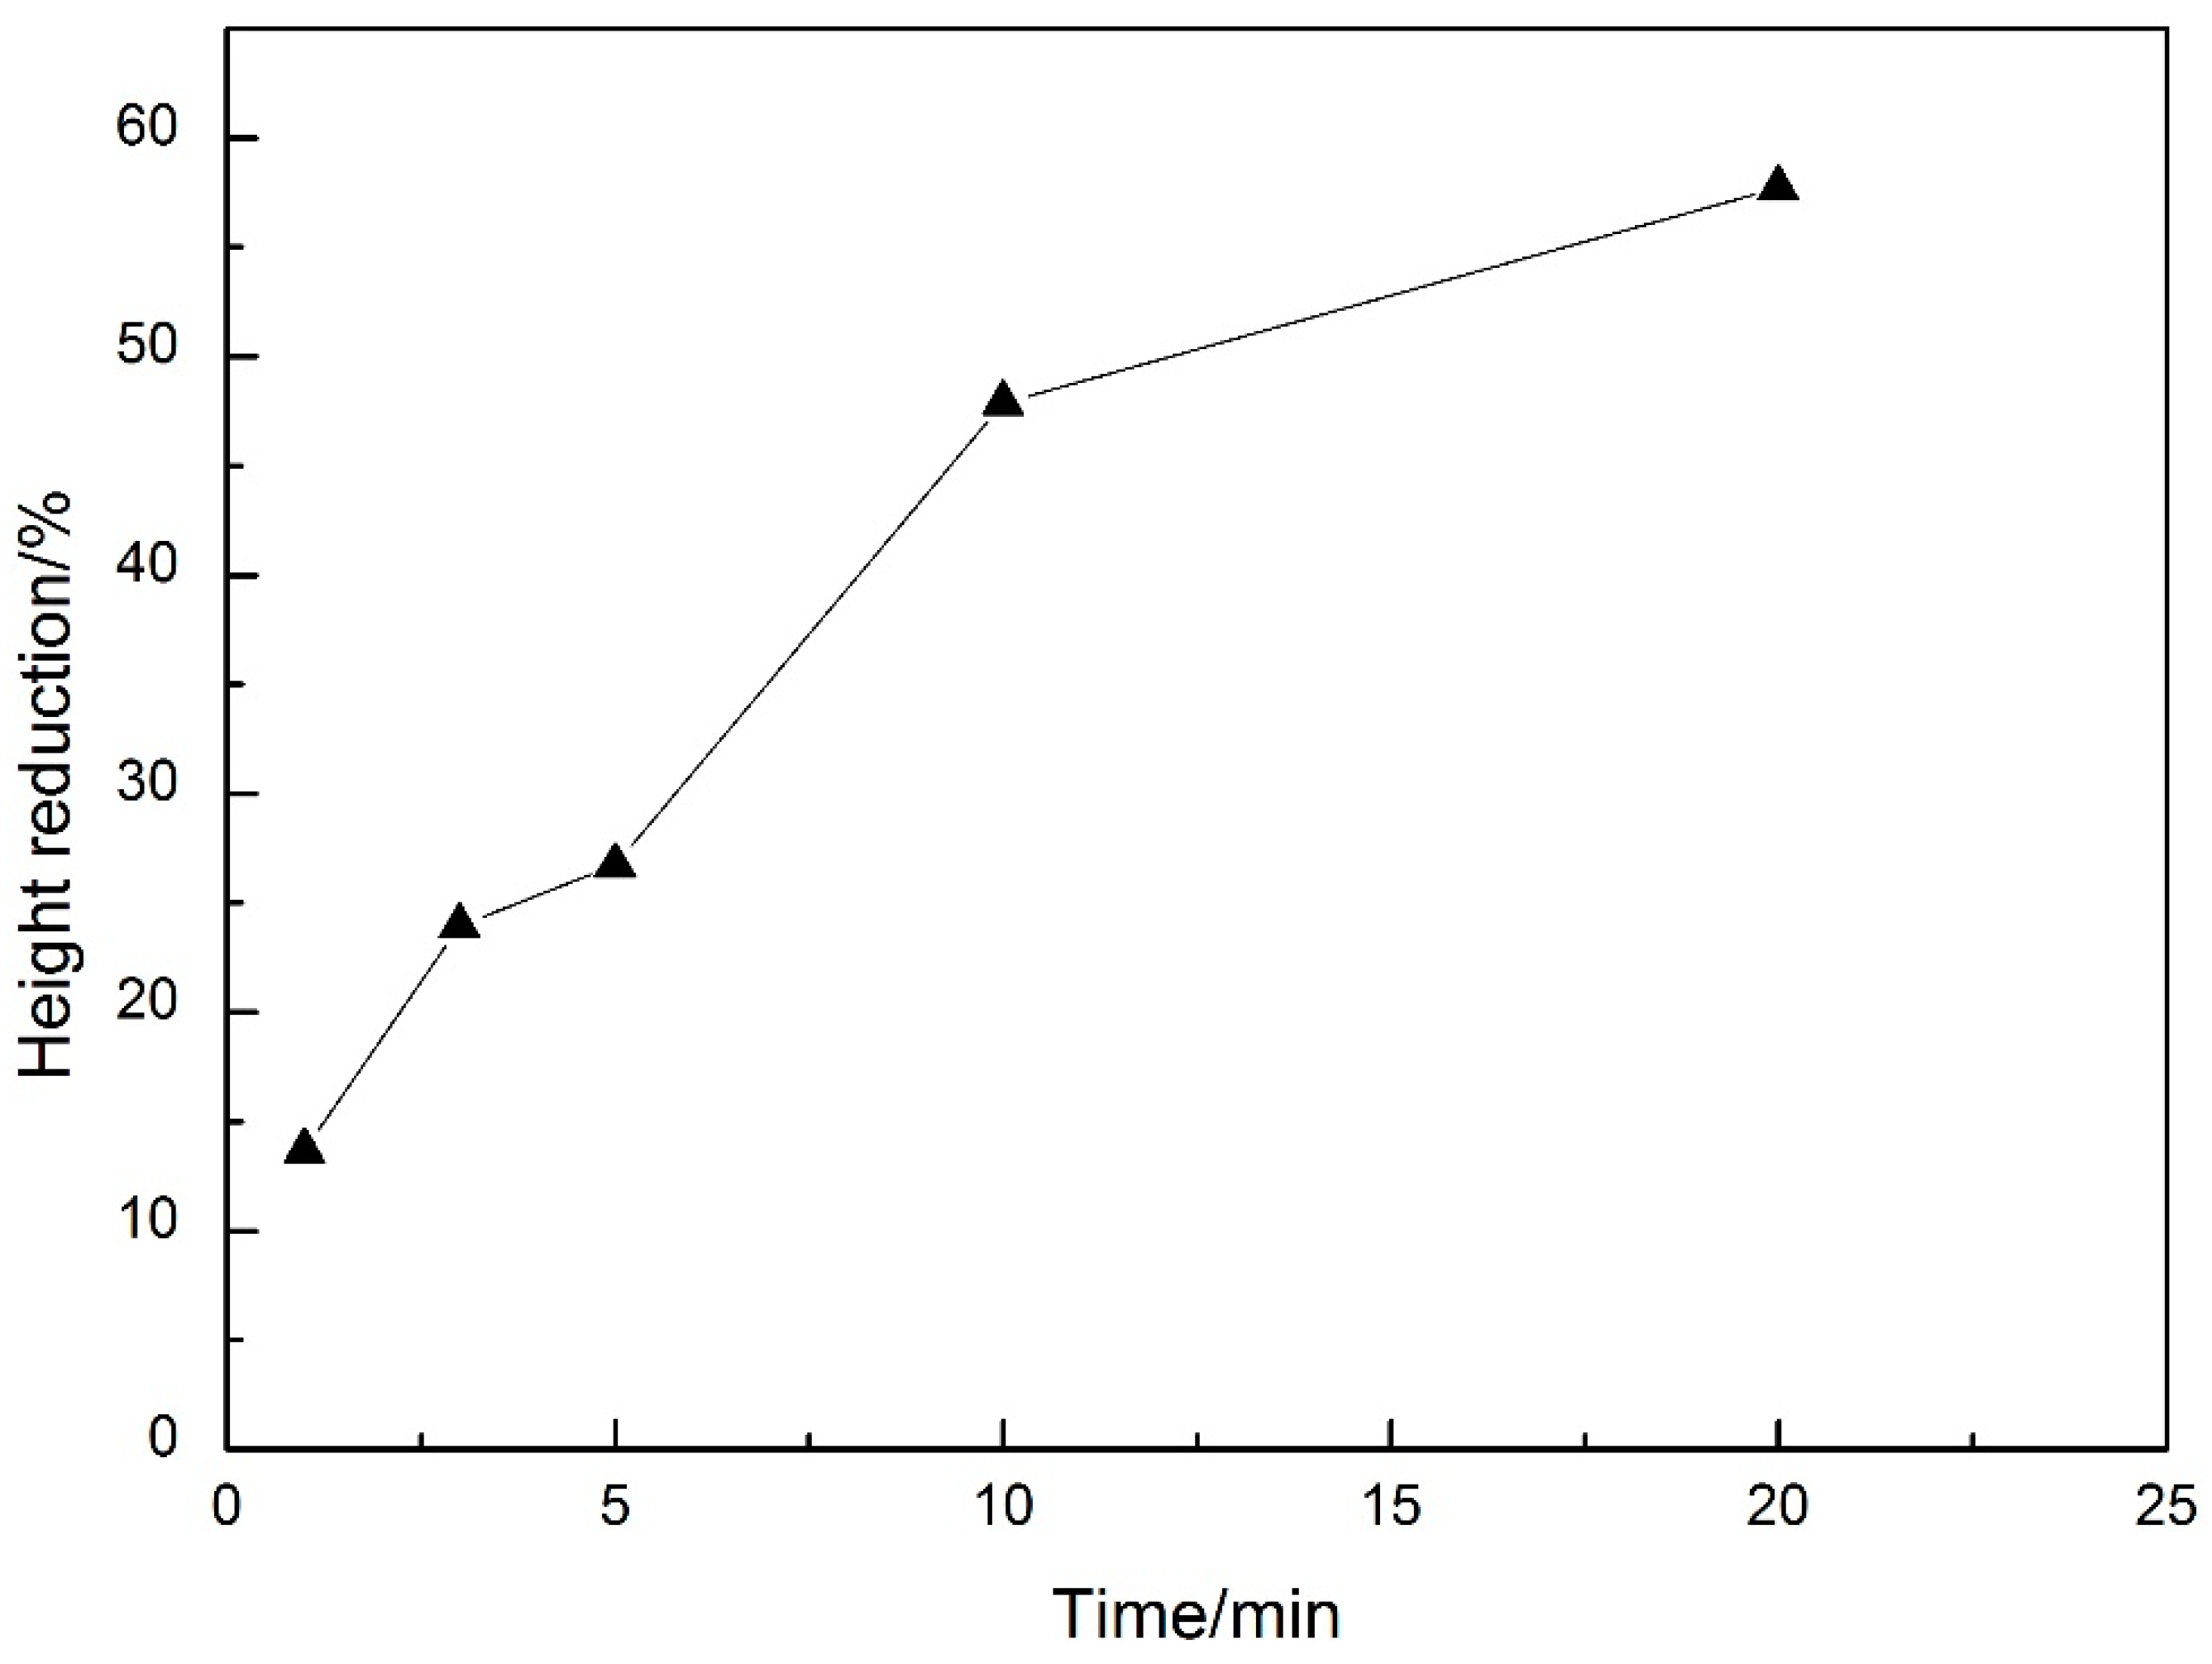
Figure 6.
Microstructure morphology of the Ti–5Al–2Sn–2Zr–4Mo–4Cr alloy bond obtained at different times: (a) 1 min; (b) 3 min; (c) 5 min; (d) 10 min; (e) 20 min.
Figure 6.
Microstructure morphology of the Ti–5Al–2Sn–2Zr–4Mo–4Cr alloy bond obtained at different times: (a) 1 min; (b) 3 min; (c) 5 min; (d) 10 min; (e) 20 min.

Figure 7.
Void size in the bonding interface at different times: (a) 1 min; (b) 3 min; (c) 5 min.
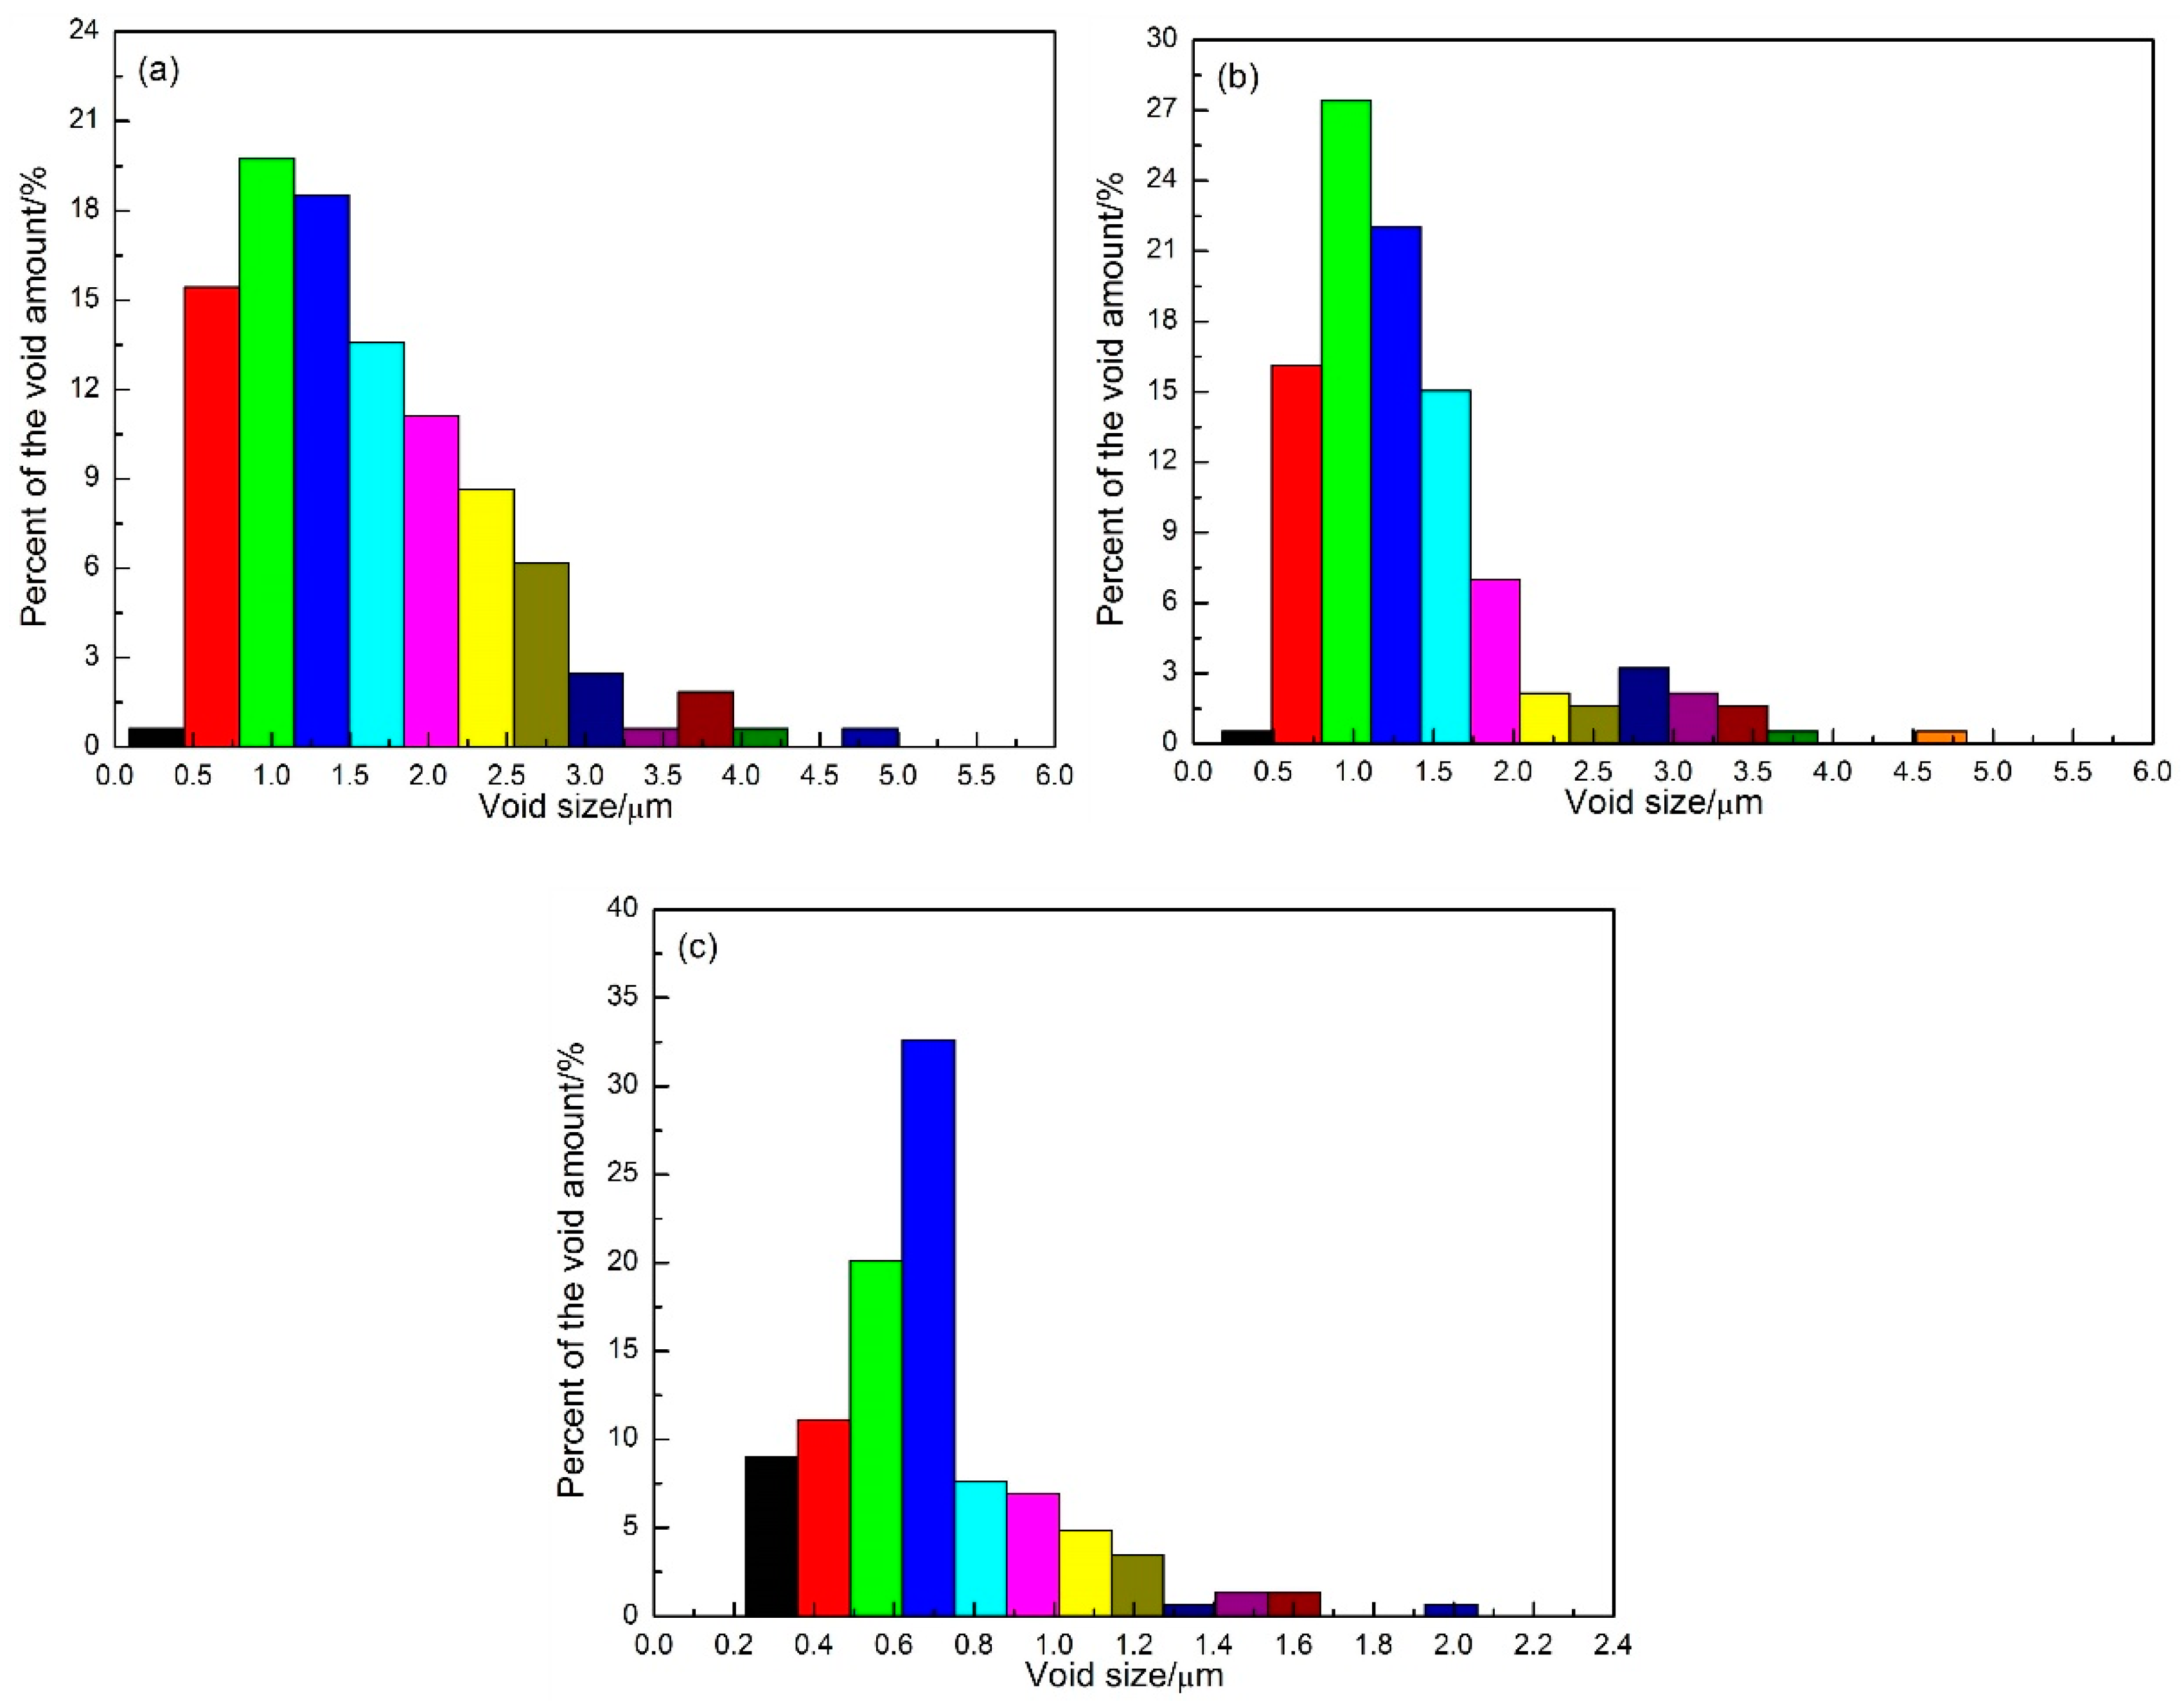
Figure 8.
EBSD orientation maps of Ti–5Al–2Sn–2Zr–4Mo–4Cr alloy bonds obtained at different times: (a) 1 min; (b) 10 min.
Figure 8.
EBSD orientation maps of Ti–5Al–2Sn–2Zr–4Mo–4Cr alloy bonds obtained at different times: (a) 1 min; (b) 10 min.

Figure 9.
Misorientation distribution of the α grain boundary in BZ (left figures) and VBZ (right figures) at different times: (a,a′) 1 min; (b,b′) 10 min.
Figure 9.
Misorientation distribution of the α grain boundary in BZ (left figures) and VBZ (right figures) at different times: (a,a′) 1 min; (b,b′) 10 min.
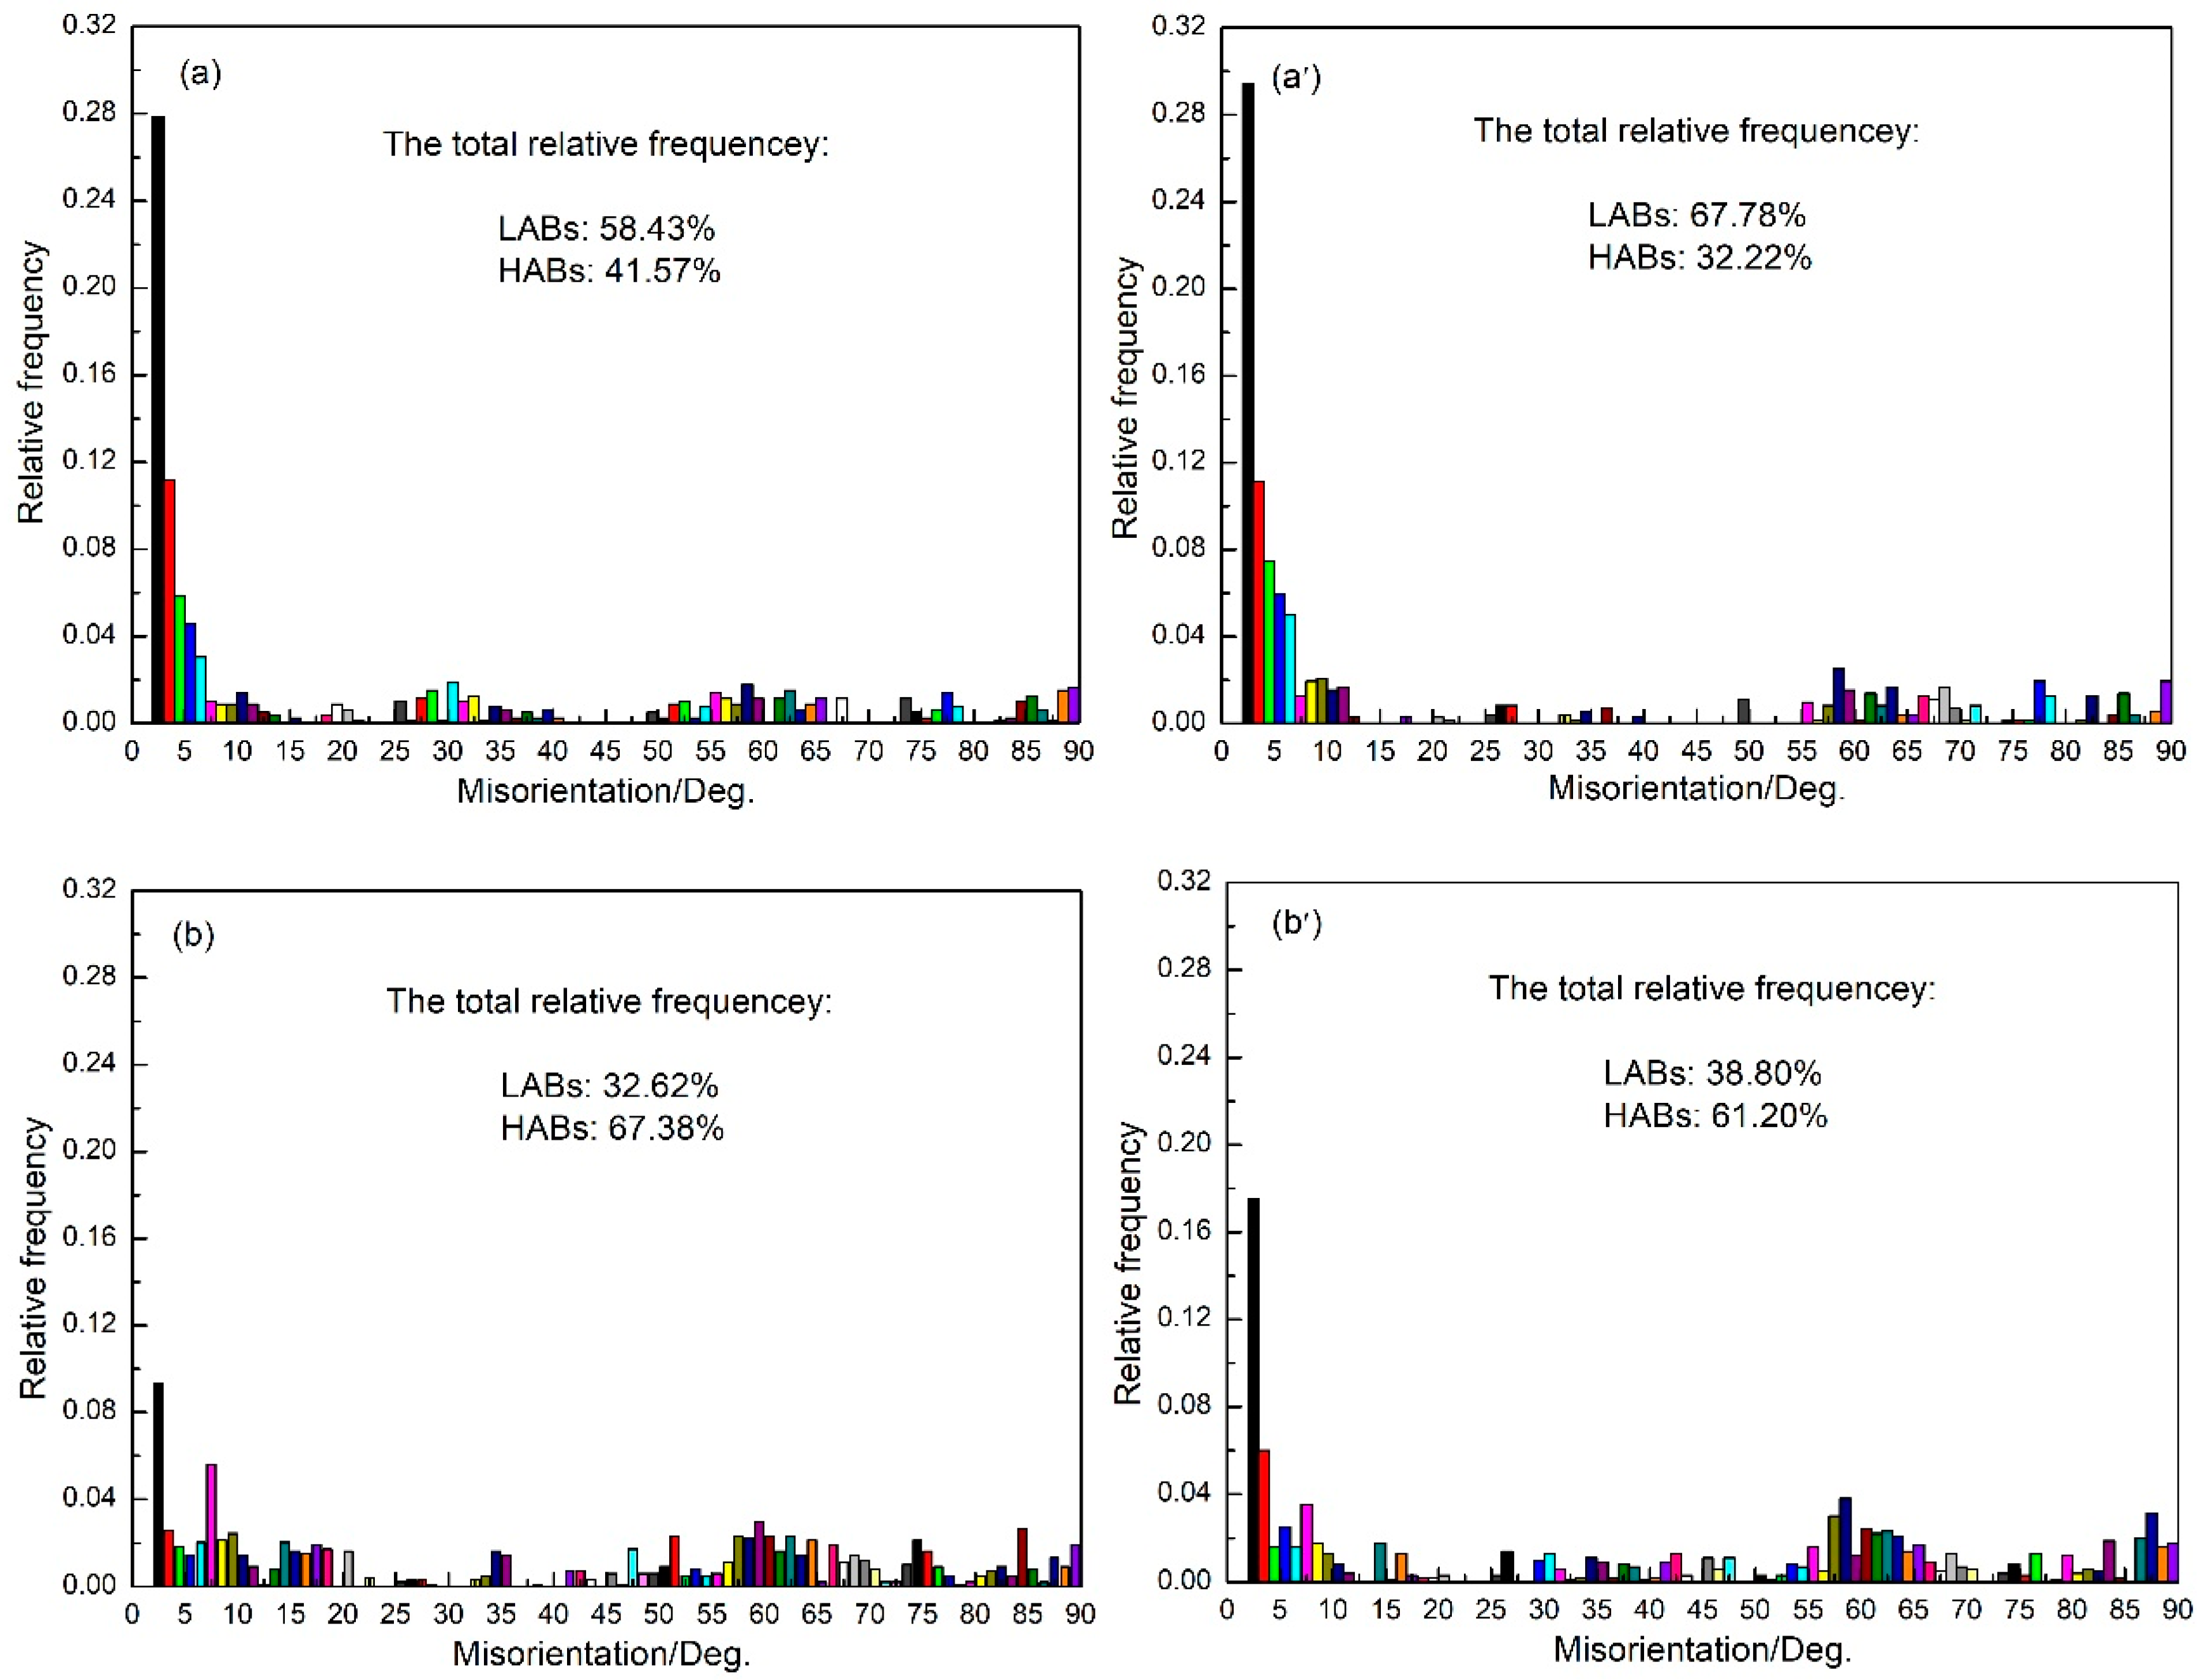
Figure 10.
Misorientation distribution of the β grain boundary in BZ (left figures) and VBZ (right figures) at different times: (a,a′) 1 min; (b,b′) 10 min.
Figure 10.
Misorientation distribution of the β grain boundary in BZ (left figures) and VBZ (right figures) at different times: (a,a′) 1 min; (b,b′) 10 min.
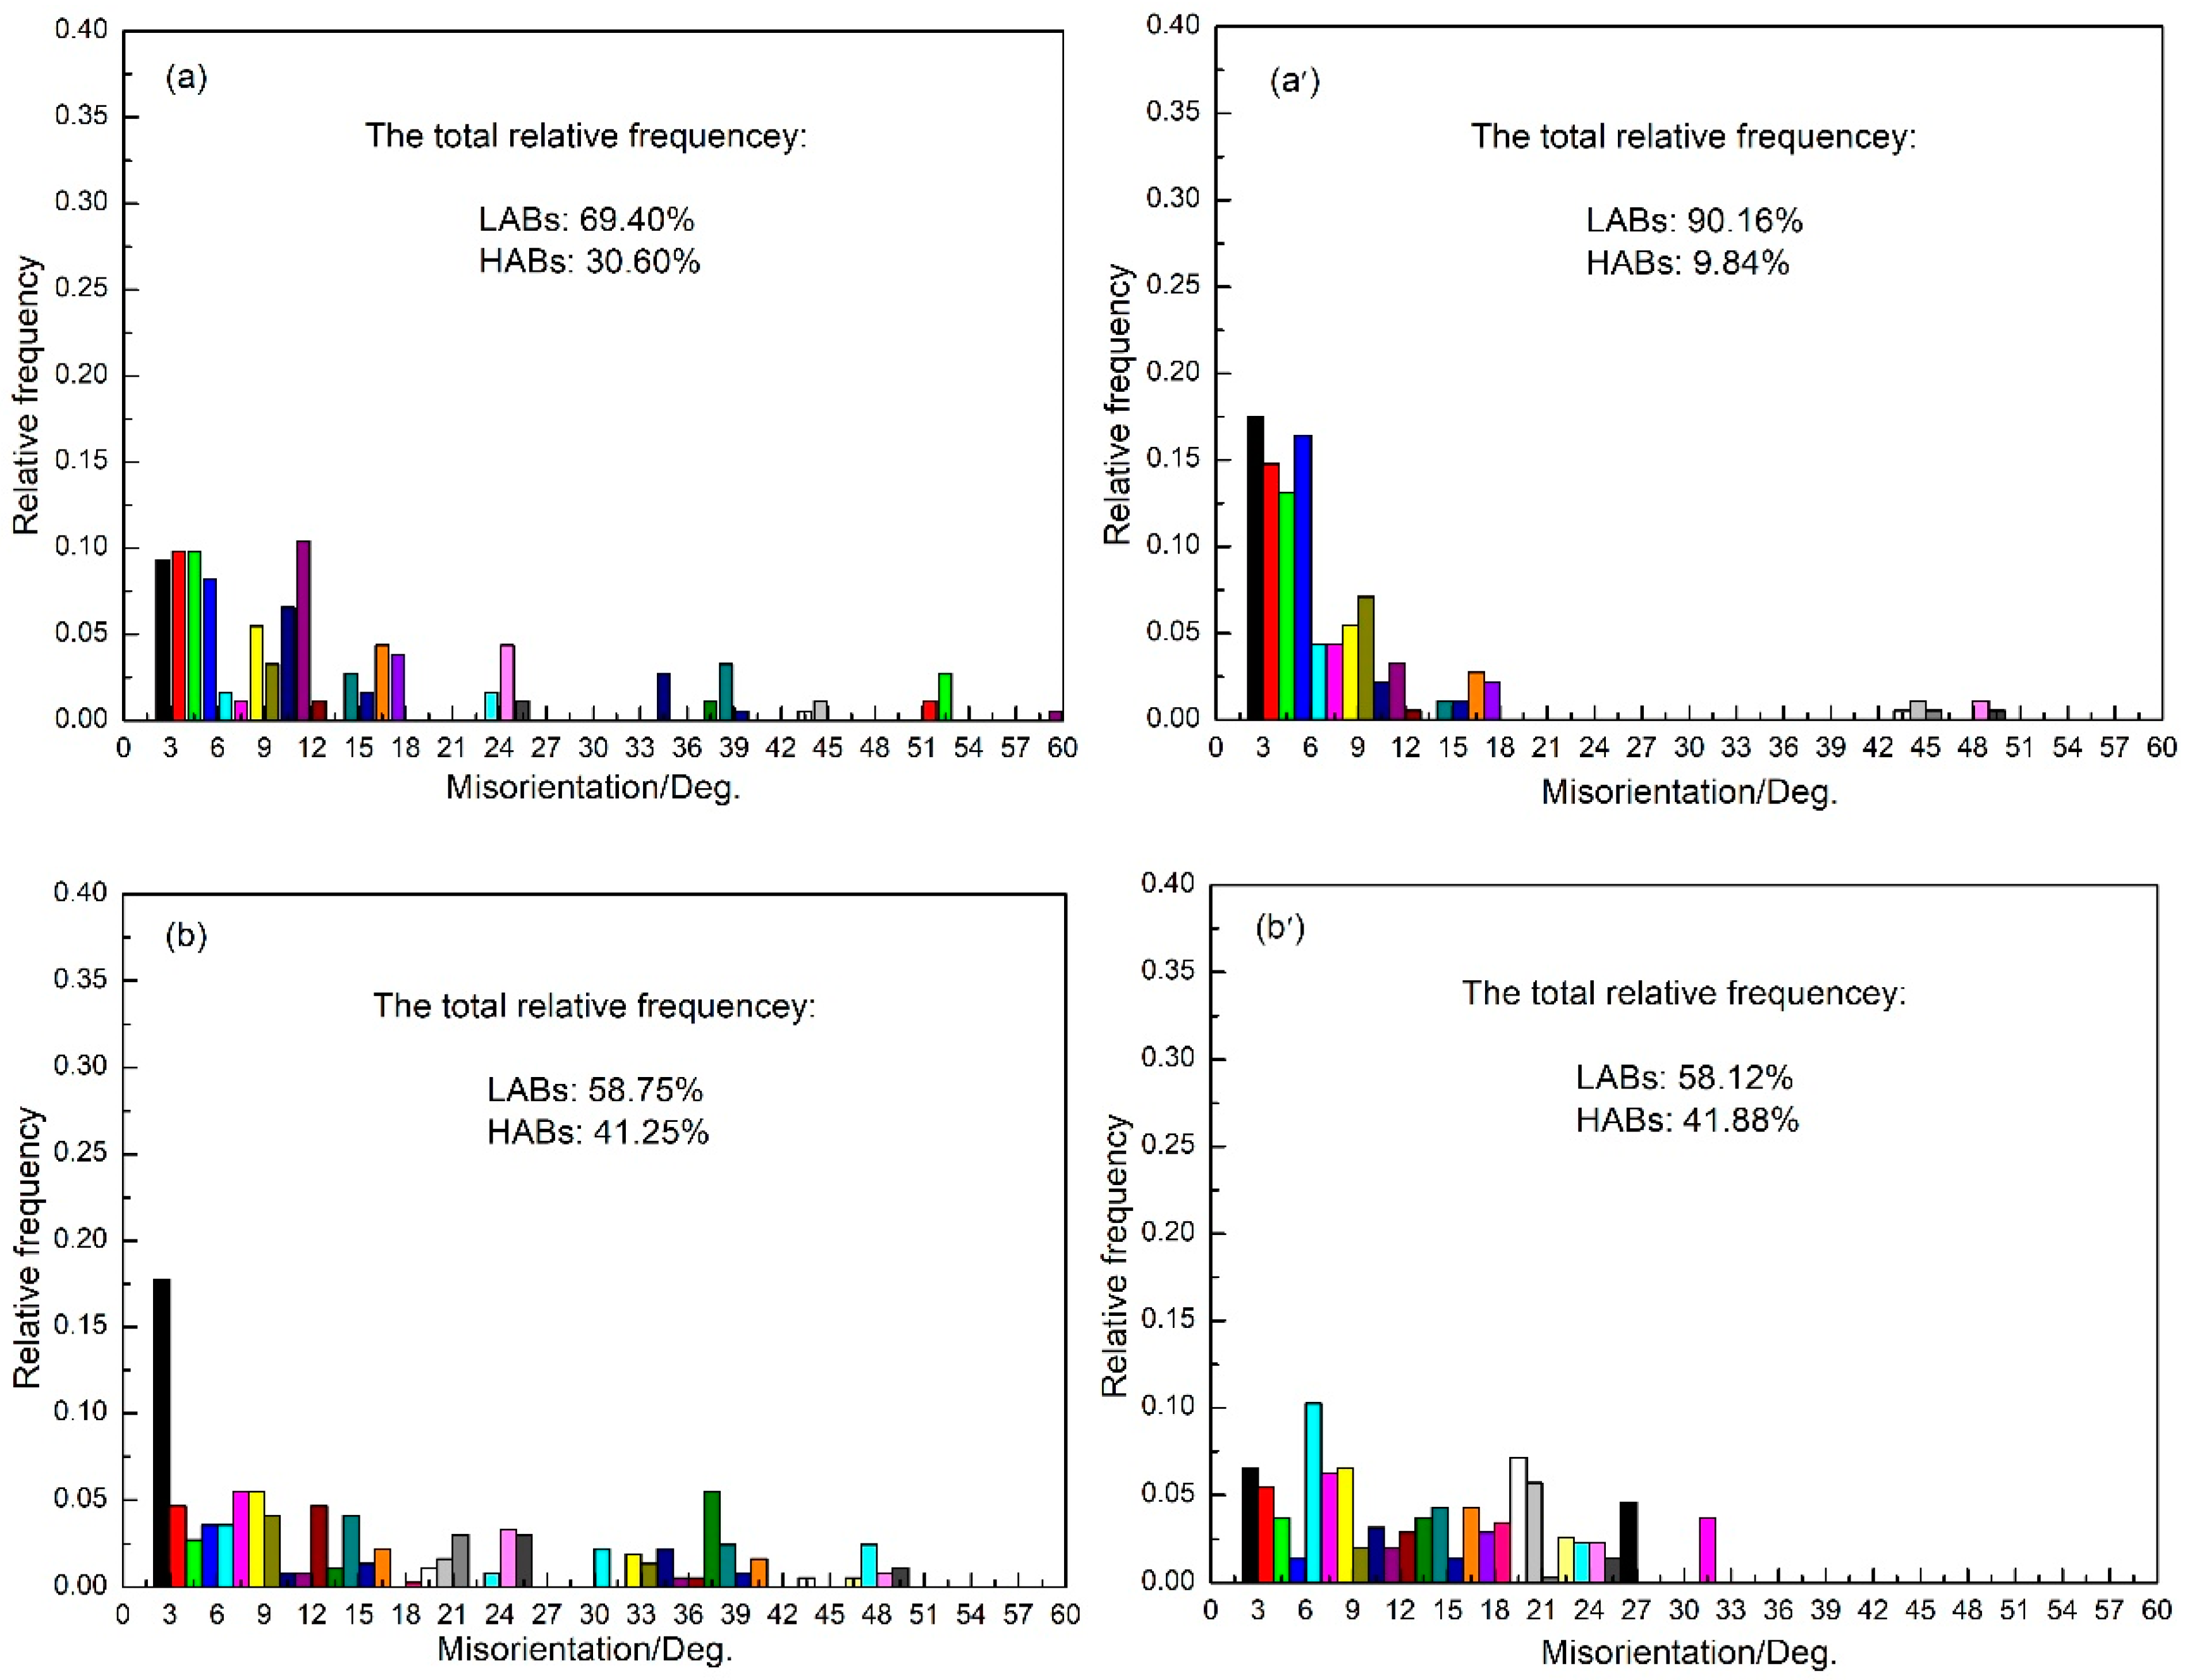
Figure 11.
Microscopic morphology of the shear fracture surfaces of the bond (left figures) and base alloy (right figures) at different times: (a,a′) 1 min; (b,b′) 10 min. (The shearing direction is horizontal.).
Figure 11.
Microscopic morphology of the shear fracture surfaces of the bond (left figures) and base alloy (right figures) at different times: (a,a′) 1 min; (b,b′) 10 min. (The shearing direction is horizontal.).

Table 1.
Average void size and bonding ratios at different times.
| Time/min | 1 | 3 | 5 | 10 | 20 |
|---|---|---|---|---|---|
| Average void size/μm | 1.2 | 1.0 | 0.6 | 0 | 0 |
| Bonding ratio/% | 89.4 | 91.7 | 94.9 | 100.0 | 100.0 |
Table 2.
Volume fraction and grain size of the primary α phase at different times.
| Time/min | 1 | 3 | 5 | 10 | 20 |
|---|---|---|---|---|---|
| Volume fraction/% | 25.45 | 23.99 | 26.75 | 31.43 | 29.51 |
| Grain size/μm | 3.98 ± 0.90 | 3.58 ± 0.78 | 4.23 ± 0.90 | 3.97 ± 1.05 | 4.06 ± 0.91 |
Table 3.
Average misorientation of the α and β grain boundaries in BZ and VBZ.
| Time/min | α Grain Boundary | β Grain Boundary | ||
|---|---|---|---|---|
| BZ | VBZ | BZ | VBZ | |
| 1 | 25.5° | 23.4° | 14.1° | 7.8° |
| 10 | 40.7° | 38.5° | 16.9° | 13.6° |
Table 4.
Shear strength of the bond and base alloy.
| Time/min | 1 | 3 | 5 | 10 | 20 | |
|---|---|---|---|---|---|---|
| Shear strength/MPa | Bond | 847.7 | 868.1 | 892.6 | 950.6 | 949.6 |
| Base alloy | 920.7 | 916.9 | 908.1 | 972.5 | 957.0 | |
Publisher’s Note: MDPI stays neutral with regard to jurisdictional claims in published maps and institutional affiliations. |
© 2021 by the authors. Licensee MDPI, Basel, Switzerland. This article is an open access article distributed under the terms and conditions of the Creative Commons Attribution (CC BY) license (https://creativecommons.org/licenses/by/4.0/).
Share and Cite
MDPI and ACS Style
Li, H.; Li, M. Interfacial Microstructure Characteristics and Mechanical Properties of a Press Bonded Ti–5Al–2Sn–2Zr–4Mo–4Cr Alloy. Crystals 2021, 11, 1395. https://doi.org/10.3390/cryst11111395
AMA Style
Li H, Li M. Interfacial Microstructure Characteristics and Mechanical Properties of a Press Bonded Ti–5Al–2Sn–2Zr–4Mo–4Cr Alloy. Crystals. 2021; 11(11):1395. https://doi.org/10.3390/cryst11111395
Chicago/Turabian StyleLi, Hong, and Miaoquan Li. 2021. "Interfacial Microstructure Characteristics and Mechanical Properties of a Press Bonded Ti–5Al–2Sn–2Zr–4Mo–4Cr Alloy" Crystals 11, no. 11: 1395. https://doi.org/10.3390/cryst11111395
Note that from the first issue of 2016, this journal uses article numbers instead of page numbers. See further details here.