1. Introduction
Advances in technology and science have taken a new direction in the twentieth century with the introduction of materials that are biodegradable when used in the natural environment. They are commonly employed in biomedical applications as a replacement for biomaterials due to their great biocompatibility, which makes them a popular choice. They are commonly employed in biomedical applications as a replacement for biomaterials due to their great biocompatibility, which makes them a popular choice. The most common use of materials in biomedical applications can be found in transplantation, tissue replacement and repair, and other similar procedures [
1,
2,
3]. However, taking the potential developments that could be incorporated within the biomedical industry into consideration, it is apparent that the future advancements are centralized around the production of high-quality materials. Such materials should have better mechanical and corrosion behaviors in order to ensure longevity in the life of these implants, and thus the health of the patients. For some applications like the metallic implants, biological effects of metallic ions determine the biocompatibility of the implant [
4,
5,
6,
7]. In addition to the importance of titanium and its base alloys in biomedical applications, it has been widely employed in aerospace, automotive, etc. [
1,
2,
6].
Among the various Ti-based alloys, the most popular biomaterial is the Ti-6Al-4V alloy [
8]. However, several studies have highlighted the potential occurrence of toxic reactions when using Ti-6Al-4V alloys as biomedical implants within the human body due to the presence of free radicals of Al
+3 and V
+5, which react with the bloodstream, increasing the potential risk of Alzheimer’s disease within the patients [
9,
10]. Additionally, recent studies found that Zr can replace V and Al to form a strong and safe non-toxic Ti alloy [
11]. Furthermore, adding Zr to Ti provides good biocompatibility, high mechanical strengths, and excellent corrosion resistance [
12]. In this regard, many researchers have report the rule of Zr in improving the corrosion resistance as well as the biocompatibility of Ti [
11,
12,
13,
14,
15]. As an example, Akimoto et al. [
13] studied the effect of different additions of Zr; namely, 30%, 50%, and 70%, on the corrosion of Ti in lactic acid containing sodium chloride solution and found that 30% Zr and at a Zr < 50% offer an ideal level of corrosion resistance for clinical applications. Also, Ikarashi et al. [
14] have investigated the improved biocompatibility of Ti-Zr alloy focusing on the tissue reaction and sensitization Ti-Zr alloy compared with Ti and Zr in rat implantation.
The objective of the present work was to investigate the impact of addition of 15 weight % Zr on the passivation of the electrochemical corrosion of pure titanium in SBF. The choice of SBF as a corrosion medium was because SBF has a similar effect to the human’s blood towards the investigated Ti and Ti-Zr materials. The experimental results were collected using electrochemical impedance spectroscopy, cyclic potentiodynamic polarization, chronoamperometric current time, SEM, and EDX techniques.
2. Materials and Methods
The elemental metal powders included Ti (purity 99.9%, particle size, supplied by NanoChemaZone Inc., 38 Truesdale Cres, Guelph, ON, Canada) and Zr (purity 99.9%, particle size 5–7 μm, purity 99%, particle size 10 μm, supplied by NanoChemaZone Inc., 38 Truesdale Cres, Guelph, ON, Canada) to be used to prepare a powder mixture of the pure Ti and Ti-15%Zr alloy. A high energy ball mill (Pulverisette7, FRITSCH, supplied by Gulf Bio Analytical Group, Bani Malik District, 23223 Riyadh, Riyadh, Saudi Arabia) was utilized to mix the powders for 30 min as a ball milling time with a speed of 150 rpm. A 4 gm of the pure Ti and another 4 gm of the mixed Ti-Zr powder were pressed in two graphite dies. Each die has a diameter of 10 mm and a length of 200 mm. The die was then placed inside a HFIHSF heating process at a rate of 100 K/min for 5 min holding time and an applied load of 40 MPa. The weights of Ti and Ti-Zr powders were equal (4 gm) to obtain similar thicknesses during the uniaxial pressure was applied. This was to conform to the solidified sample as per the dimensions of the die. The chamber was evacuated until it reached a vacuum of 1 × 10⁻³ Torr. After sintering, the samples were left to cool down then removed from the die before being prepared for the different measurements. The corrosive medium was a Dulbecco’s Modified Eagle’s Medium simulated body fluid (SBF), which was delivered by Gibco® Life technologies™, (Birchwood, Warrington, UK). The Ti and Ti-Zr electrodes were prepared for electrochemical experiments via its welding to copper wires. The welded electrode mounted in a nonconductive epoxy resin to obtain only one face of the electrode. Before exposure to SBF, the face to be exposed was ground with different grits of emery papers, from 200 grit up to 1000 grit. After grinding, the Ti and Ti-Zr electrodes were cleaned with distilled water, degreased with a volatile solvent namely, acetone, and rewashed with distilled water before being immersed in the SBF electrolyte.
The electrochemical tests were conducted at 37 °C using a standard three-electrode configuration cell accommodates for 40 mL SBF. Pure Ti and Ti-Zr alloy were employed as the working electrode. The reference electrode was a silver/silver chloride, while the counter electrode was a platinum sheet, respectively. A Potentiostat (PGSTAT302N computer controlled by Autolab, supplied by Metrohm, Amsterdam, Netherlands) was used for the electrochemical measurements. For PCP curves, the potential was scanned from −1000 to + 400 mV (Ag/AgCl) at a scan rate of 1.67 mV/s. The EIS measurements were conducted from the open-circuit potential (OCP) at a range of frequency between 100,000 Hz and 0.1 Hz [
16]. The change of current, PCT, experiments were achieved by applying 400 mV (Ag/AgCl) on the electrode for 1 h. All experiments were carried out after 1 h and 72 h and were repeated 3 times on a fresh sample surface and in a new portion of SBF. The elemental analysis of the corroded surface was done using an EDX analyzer coupled to the SEM device, which was employed to obtain the microscopic images.
3. Results and Discussion
3.1. Microstructure Investigation
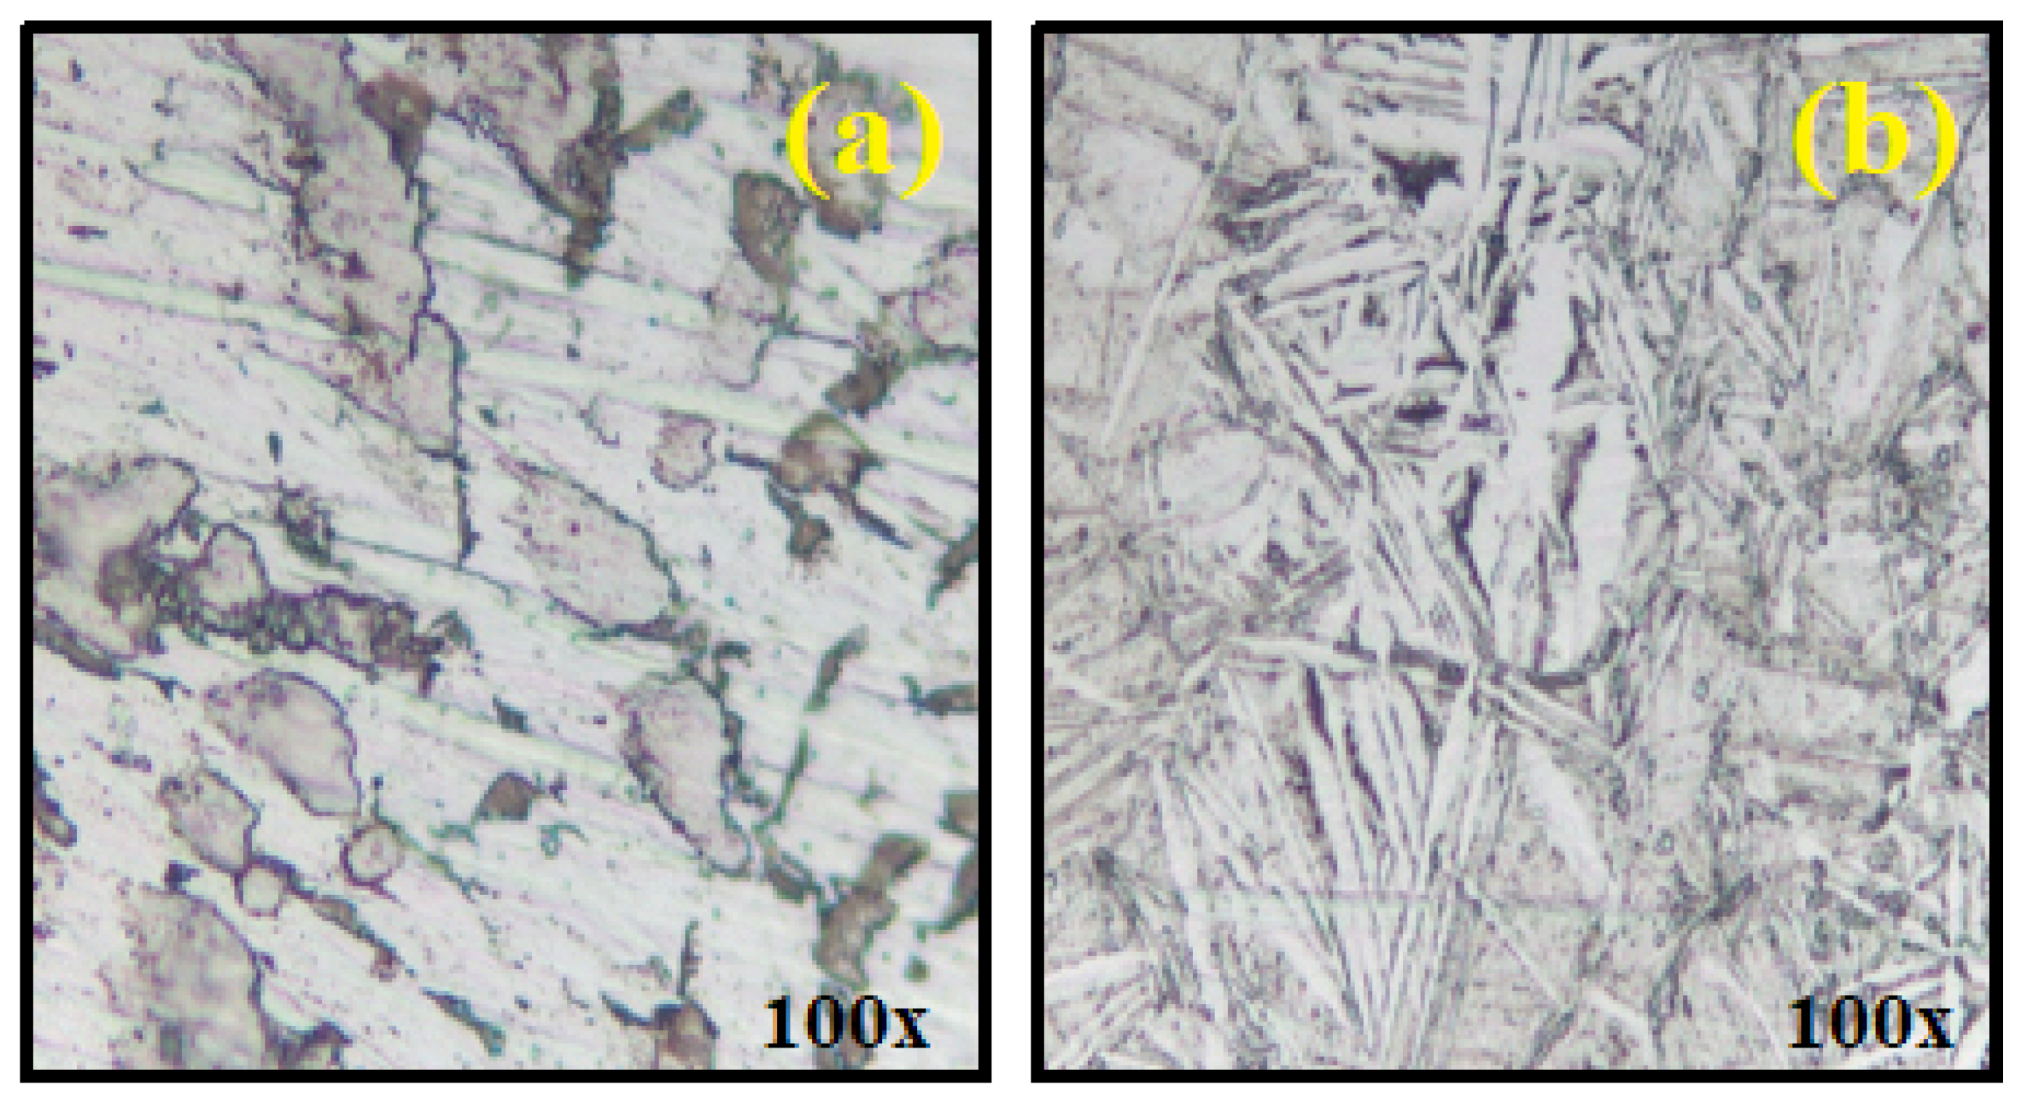
In order to study the surface phenomena of the synthesized materials, optical microscopic studies were evaluated. The microstructure of the powders of (a) pure Ti and (b) 85%Ti-15%Zr is represented in
Figure 1. It is seen that the pure Ti (
Figure 1a) has a very high grain size. However, when it was alloyed with 15% Zr (
Figure 1b), its surface became harder and the grain size decreased. The average grain size for Ti alone recorded 5.382155 µm, while when mixing 15% Zr, the average grain sized was largely decreased to record only 3.283924 µm. It has been reported that the reduced grain size in the alloy increases the number of grains on the surface of the alloy [
17].
3.2. Polarization Measurements
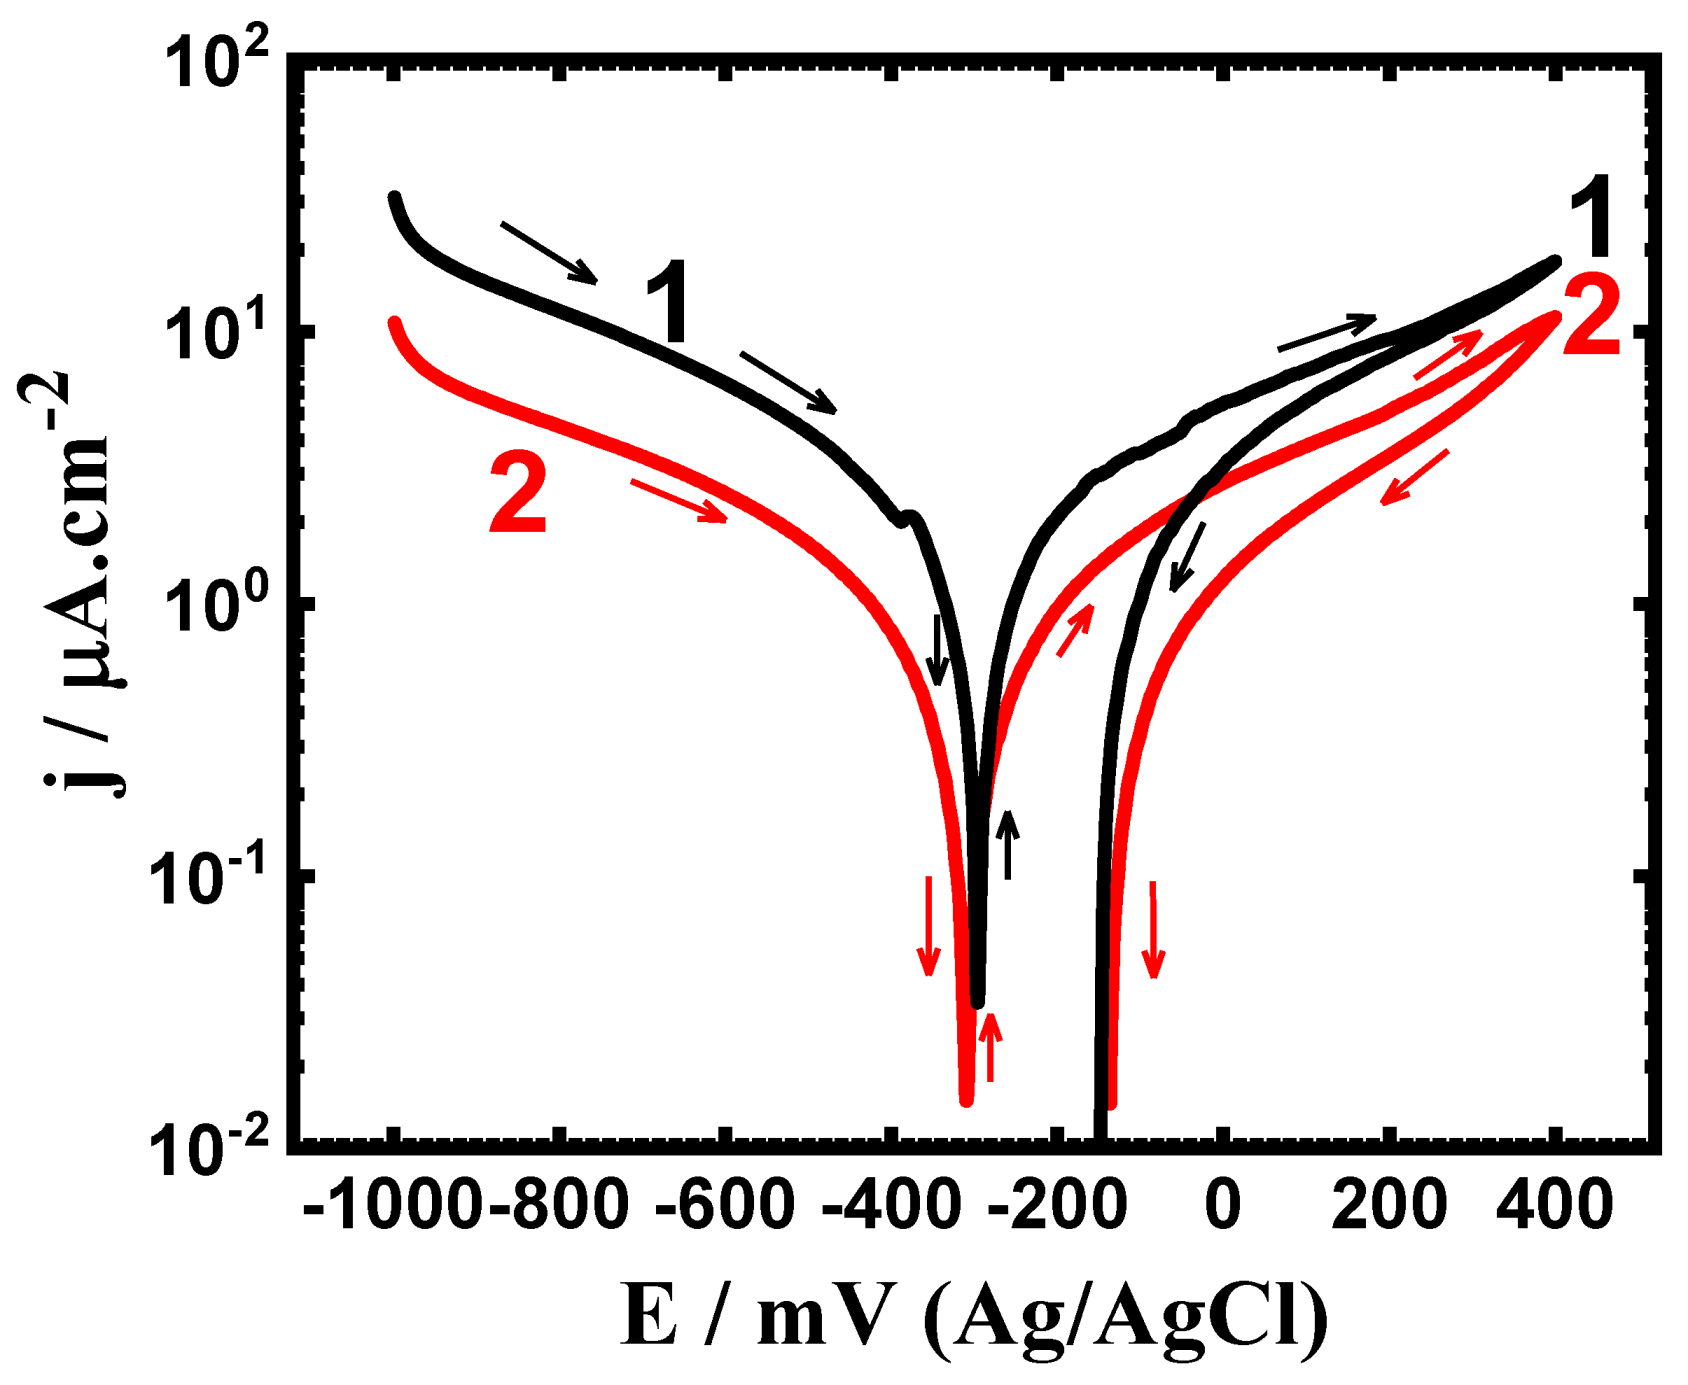
The PCP curves of (1) pure Ti and (2) Ti-15Zr alloy after immersion in SBF for 1 h are shown in
Figure 2. The curves depicted in
Figure 3 also obtained for the same electrodes after 72 h in SBF solution. The estimated data from
Figure 2 and
Figure 3 are presented in
Table 1. Here, βc = cathodic Tafel slope βa = anodic Tafel slope, j
Corr = corrosion current density, E
Corr = corrosion potential, R
Corr = corrosion rate, and R
P = polarization resistance. Obtaining βc and βa values were made via extrapolation of a tangent to the linearized current regions. The j
Corr and E
Corr values were obtained as reported before [
16,
18,
19,
20]. The values of R
P were calculated from of βc, βa and j
Corr as follows [
16,
18,
19,
20]:
The values of R
Corr were also calculated from the corrosion parameters as reported in the earlier studies [
16,
18,
19,
20]. The PCP curves represented in
Figure 2 and
Figure 3 reveal that the cathodic current decreases towards the minimum values (where j
Corr and E
Corr obtained) due to the oxygen reduction [
20,
21];
The anodic reaction of Ti and Ti-Zr alloy starts with rising the current in the anodic side. The anodic current is seen to be higher for Ti than the current recorded for Ti-Zr alloy at the same value of potential, which is due to the better corrosion resistance for Ti-Zr alloy than for pure Ti. Scanning the potential in the back direction results in a lower current values for both Ti and Ti-Zr alloy, indicating that the pitting attack is not taking place at these conditions.
The PCP curves after prolonging the immersion time (
Figure 3) show almost similar curves to the ones shown after 1 h exposure (
Figure 2) but having smaller currents at the same values of the scanned potential. The data of
Table 1 also confirmed this, where j
Corr values and the calculated values for R
Corr are smaller but the values of R
P are higher for Ti-Zr alloy. The increase of time of exposure to 72 h increases this effect too. The formation of mixed oxides of TiO
2 and ZrO
2 is most probably the reason for the better corrosion resistance and lower corrosion rate obtained for Ti-Zr alloy. On the other hand, the formation of TiO
2 is only possible for Ti and is the reason for the less corrosion resistance and corrosion rate than those for Ti-Zr alloy. The PCP results thus confirm that the impact of adding 15%Zr to Ti increases its corrosion resistance when exposed to SBF and this effect increase when the time of exposure increases.
3.3. EIS Data
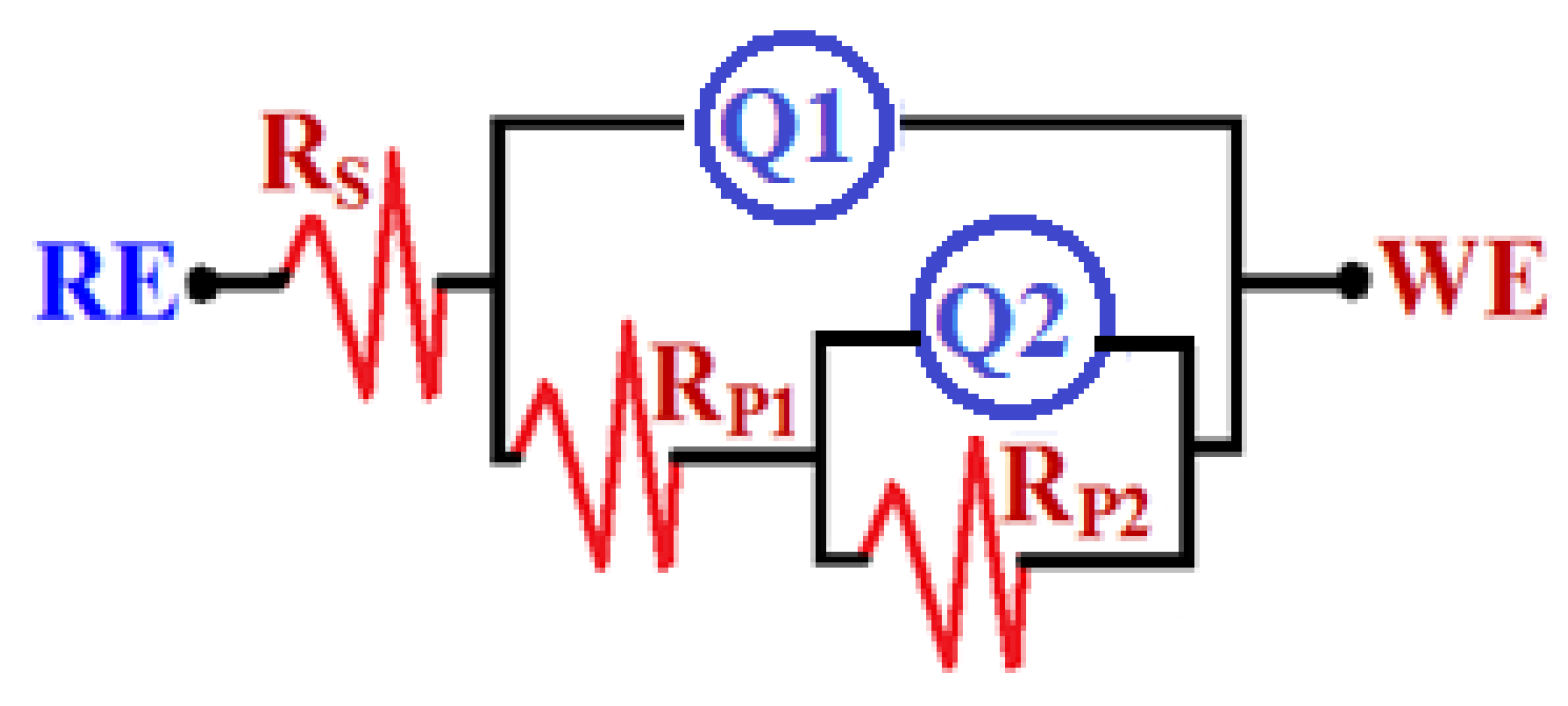
Figure 4 illustrates the Nyquist plots for (1) Ti and (2) Ti-15Zr alloys after immersion in SBF for one hour. A Nyquist plot was taken for the same samples after 72 h of immersion, as seen in
Figure 5. The best circuit model equivalent to these EIS data is presented in
Figure 6. It consists of a R
S = solution resistance, Q
1 and Q
2 = two constant phase elements, and R
P1 and R
P2 = two polarization resistances. As a result of these elements being presented,
Table 2 summarizes their values. Similarly, the same circuit has been used for other materials [
16,
18,
22]. The presence of a Q (CPEs) in a capacitive response system has been used to estimate deviations from ideality [
23]. Moreover, the presence R
P1 may indicate on the polarization resistance at the interface between the metal (Ti and Ti-Zr alloy) and a surface formed layer. Also, the presence of R
P2 points to a resistance at an outer formed layer on the surface and the solution interface.
Values of R
S, R
P1, and R
P2 are higher for Ti-Zr alloy than those values listed in
Table 2 for pure Ti only. The total corrosion resistance (R
P) equals the sum of R
P1, and R
P2, i.e., R
P = R
P1 + R
P2. Furthermore, the presence of Q showed that the formed films have a complex structure, indicating that two layers are probably formed. A high-frequency inner layer is characterized by dominant impedance, while a low-frequency outer layer is porous and characterized by dominant impedance [
24,
25,
26,
27,
28,
29]. The Q
1 and Q
2, with the values of their “n”, are assigned the role of a double-layer capacitor, C
dl, which confirms the existence of pores on the outer layer. Those C
dls signify that Zr increases the passivity of the Ti in SBF solution.
Table 2 also proves that the values of Y
Q1 and Y
Q2 decrease in the presence of Zr, indicating also that Zr increases the passivity of the Ti. This effect of increasing the surface and polarization resistances and the decreasing of the constant phase elements increases when exposure time in SBF increases from 1 h to 72 h.
The Bode (a) impedance of the interface and (b) degree of phase angle plots for (1) Ti and (2) Ti85-Zr15 alloy after 1 h exposure to SBF are exhibited in
Figure 7. Similar plots were obtained after 72 h been in SBF for Ti and Ti-Zr alloy are depicted in
Figure 8. The presence of Zr (
Figure 7) increases the values of (|Z|) as well as increases the maximum value for the phase angle (Φ) proving that the presence of Zr increases the passivity of Ti. Also, and when the immersion time is extended from 1 h to 72 h, both |Z| and the maximum heights for Φ remarkably rise confirming that the long immersion time before measurement enhances the corrosion resistance for both Ti and Ti-Zr alloy. The EIS results collectively confirm thus the addition of 15% Zr highly enhances the resistance to corrosion for the pure Ti and this impact is remarkably increased when the time is prolonged to 72 h. This is because the long immersion period increases the chance for corrosion passivation via oxide film thickening.
3.4. PCT Investigations
The PCT technique was successfully used to report whether pitting corrosion takes place at the surface of the investigated materials harsh environments [
30,
31,
32,
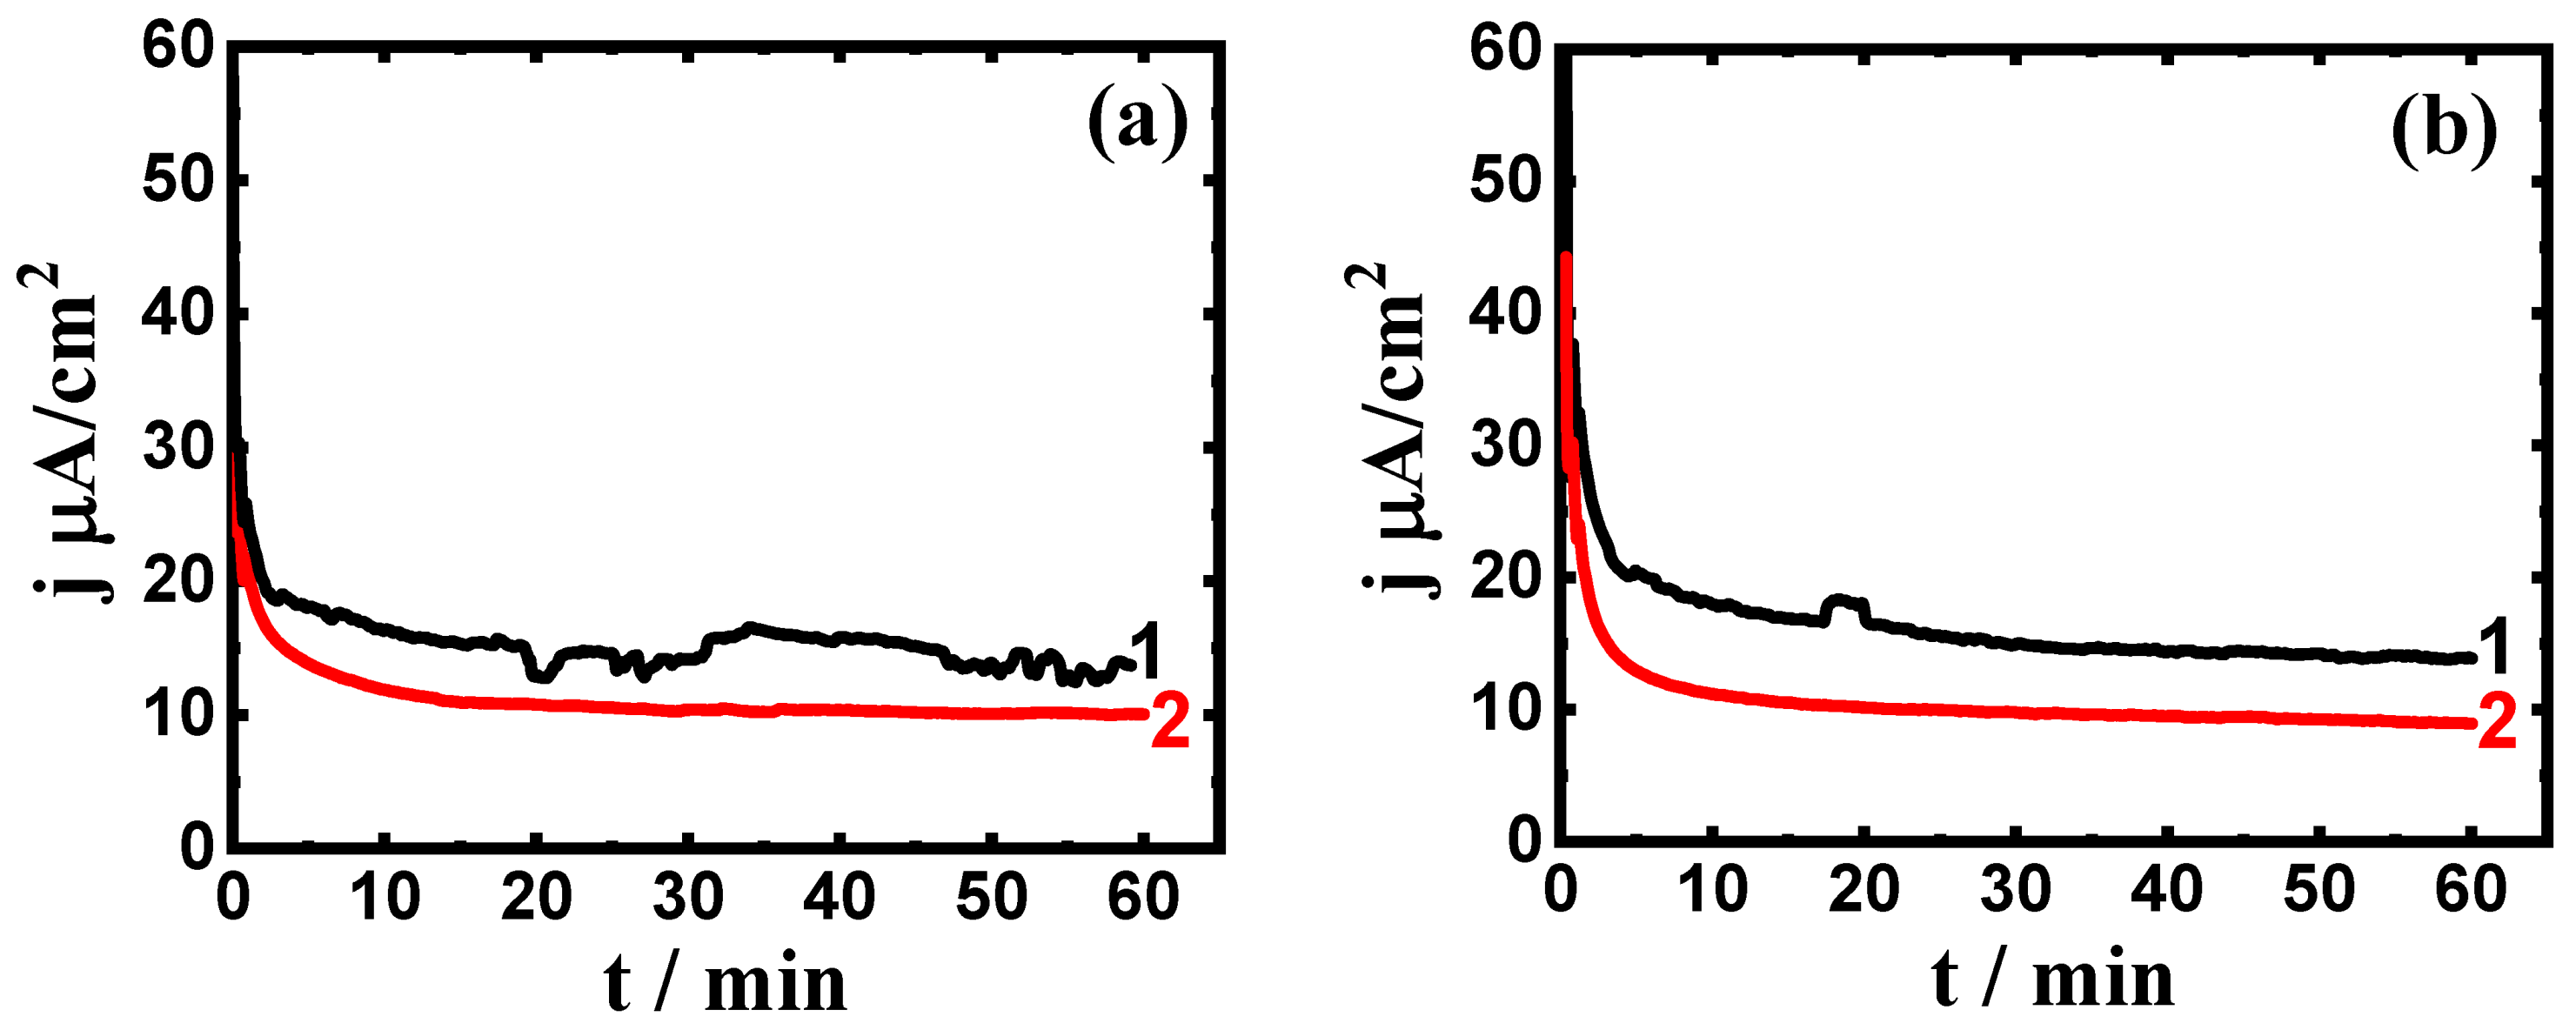
33]. In order to investigate the effect of adding Zr on the resistance to corrosion of the titanium in the SBF after 1 and 72 h exposures, the PCT experiments at 400 mV (Ag/AgCl) were conducted. The PCT curves for (1) pure Ti and (2) Ti-Zr alloy in SBF, (a) 1 h and (b) 72 h immersion, at 400 mV (Ag/AgCl) are displayed in
Figure 9. The obtained currents for Ti alone (
Figure 9, curve 1) recorded higher value. This current decreases with time as a consequence of the oxide film formation. After a few minutes, the current shows a slight further decreases as the oxide film thickens. The addition of Zr (
Figure 9, 2nd curve) recorded nearly similar current-time attitude but with reduced absolute currents. The higher absolute currents obtained for pure Ti accompanied with some fluctuations confirms the higher uniform corrosion and also a pitting attack is possible to occur. The absence of fluctuations in case of Ti-Zr alloy reveals that Zr reduces the uniform attack of Ti and eliminates the chance for pitting corrosion.
Extending the time to 72 h (
Figure 9b), both Ti and Ti-Zr alloy depicted almost the same behavior as that in
Figure 9a after 1 h immersion. The main difference recorded for the samples after 72 h of exposure was a slight rise in current values at the beginning of applying the anodic potential (400 mV). The PCT behavior obtained for pure Ti and Ti-Zr alloy whether these samples were immersed for 1 h or for 72 h proved that the addition of Zr enhances the corrosion resistance of Ti through decreasing its deterioration.
3.5. Surface Analyses
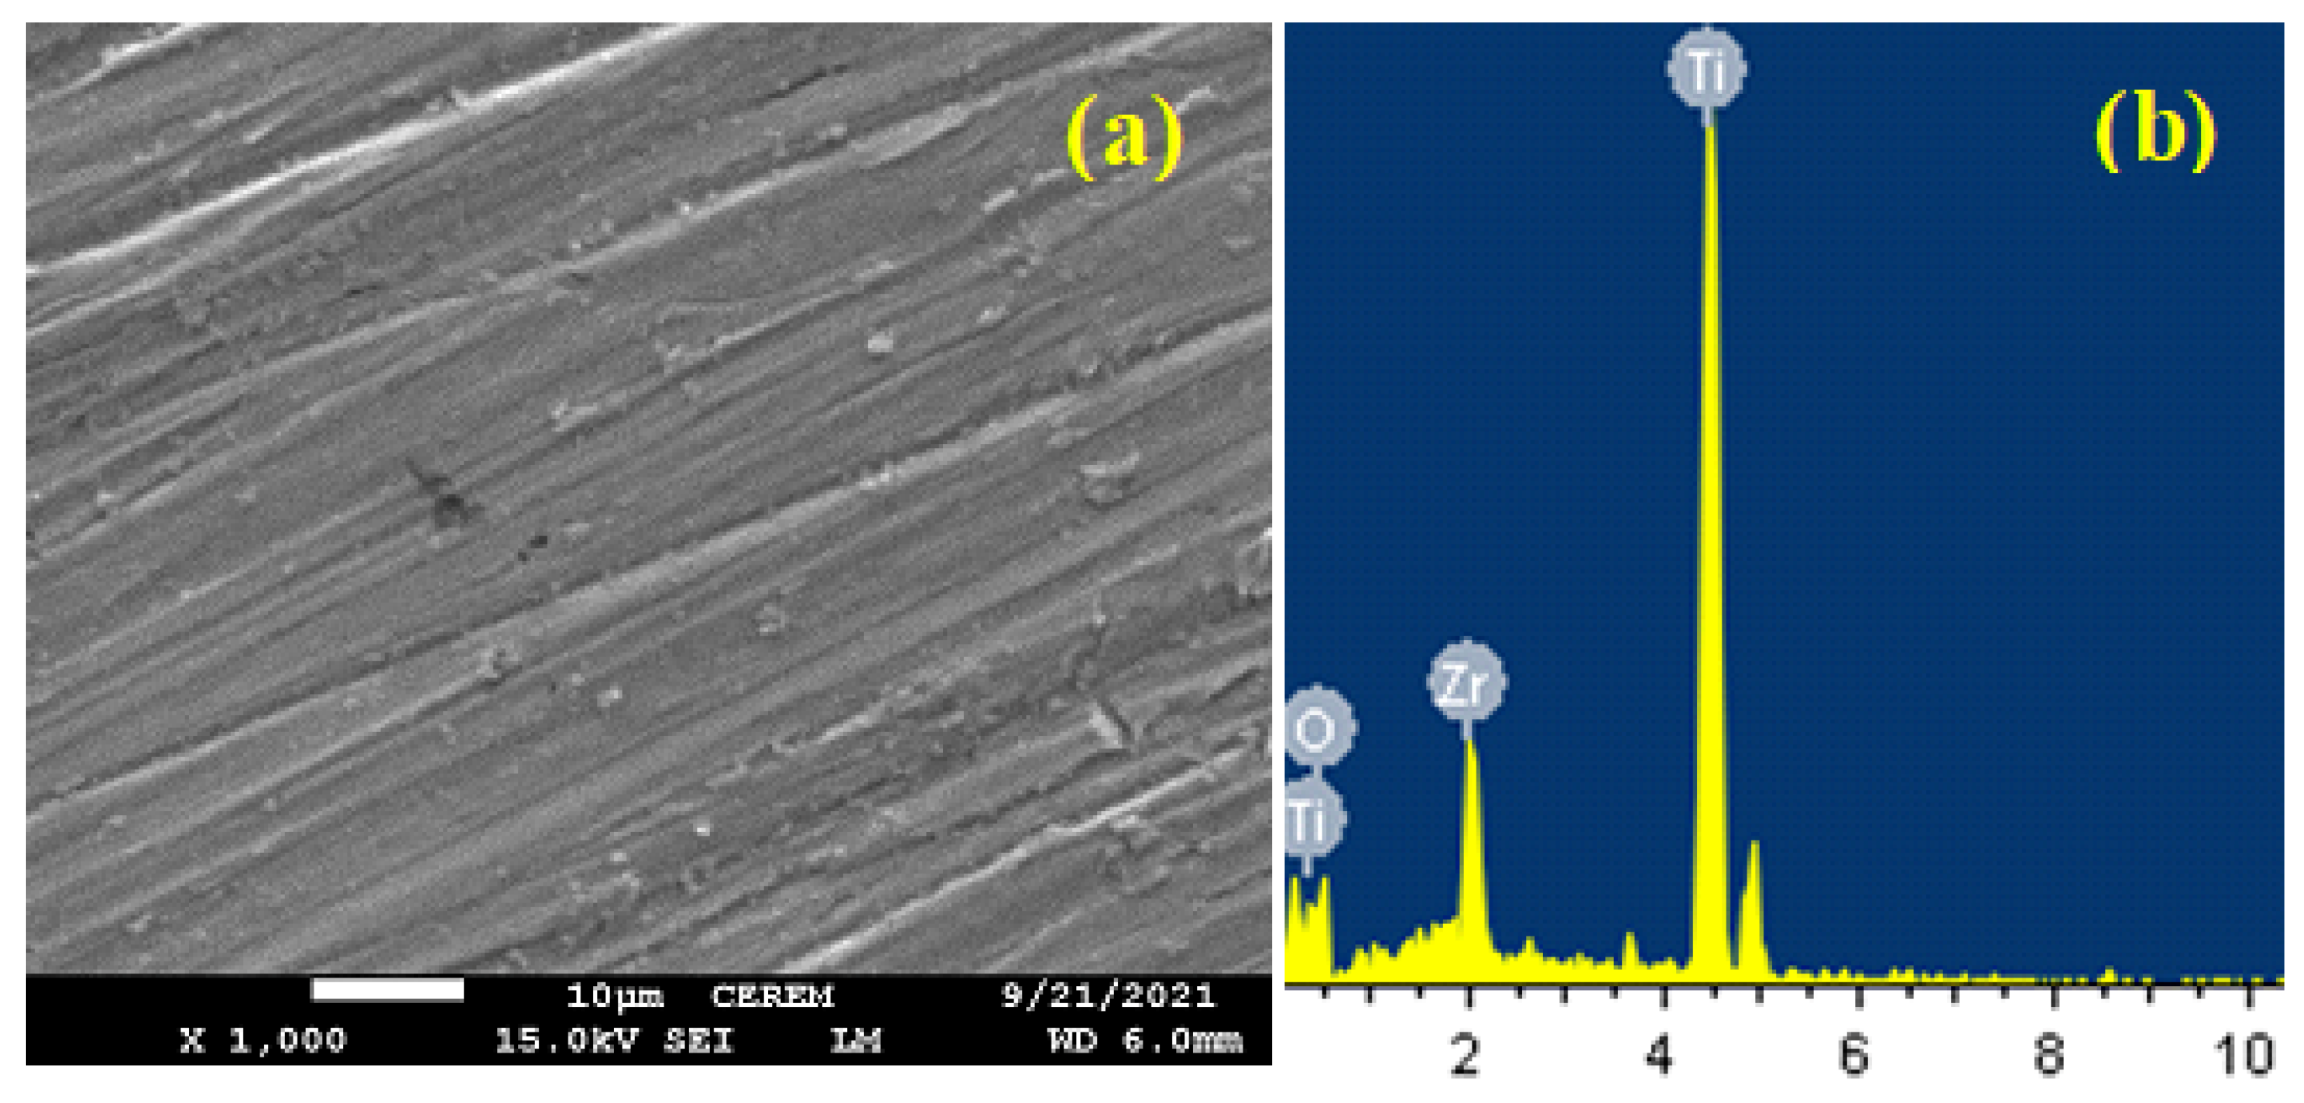
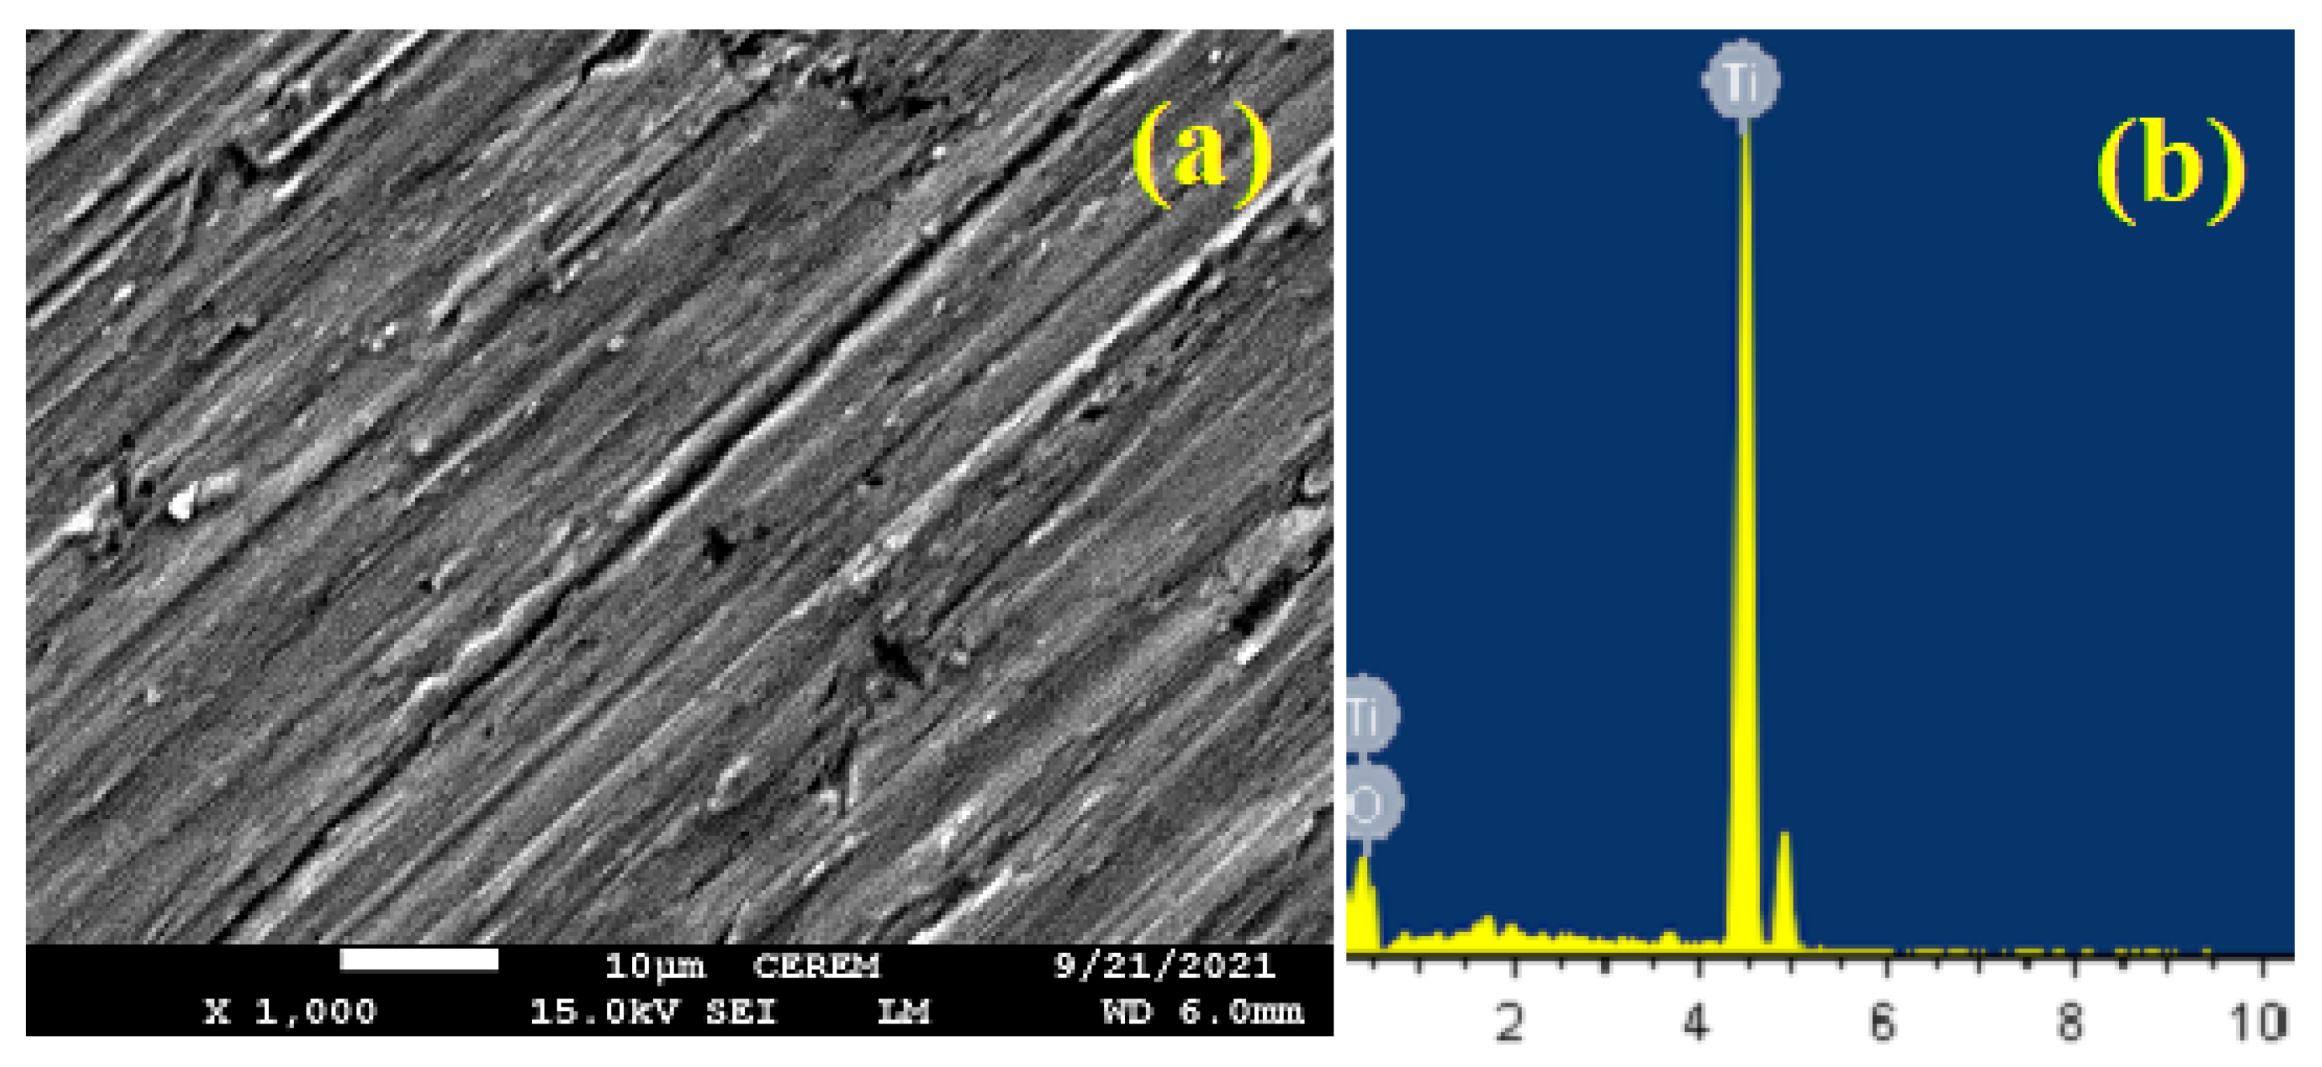
Figure 10 depicts (a) SEM micrographs and (b) EDX profiling for titanium after immersion in SBF for 72 h then step 400 mV (Ag/AgCl) for 60 min. It is gotten from
Figure 10a that Ti shows an uncovered surface with the possibility of the presence of some pits due to the corrosiveness action of the SBF solution and the high applied anodic potential. The surface of Ti sample was having only Ti and O with weight % (wt. %) of 77.95% (Ti) and 22.05% (O) and atomic % (at. %) of 54.14% (Ti) and 45.86% (O), respectively. This indicates that the surface most probably is covered with titanium oxide (TiO
2).
Figure 11a, and
Figure 11b taken for the surface of the Ti-15%Zr alloy were at the same considered conditions for Ti (see
Figure 10). It is clear that the surface of Ti-Zr alloy that is seen from
Figure 11a does not contain the black spots that refer to pits as compared to the surface of Ti (
Figure 10a). This gives another prove on the ability of Zr to prevent the pitting corrosion of Ti. The elements detected on the surface using EDX (
Figure 11b) analysis confirmed that the surface has 64.19% Ti, 13.72% Zr and 22.09% O (weight %). The presence of these elements at these percentages indicates that the surface has a layer of a mixed oxides of TiO
2 and ZrO
2, which gives more protection to the surface as compared to the surface of pure Ti.
4. Conclusions
Powder metallurgy was used to fabricate Ti and Ti-15%Zr by inducing the frequency induction heat sintering furnace (HFIHSF) method. Throughout this research, a variety of approaches, including PCP, EIS, and PCT measuring methods were used to examine the influence of 15%Zr addition on the severity of titanium corrosion after 1 h and 72 h in SBF at room temperature. It has been found from PCP results that adding Zr to titanium decreased corrosion by decreasing jCorr and RCorr, while increasing RP. Nyquist and Bode plots confirmed that the addition of Zr minimizes the corrosion of Ti. This was recognized through increasing the corrosion resistance in the form of higher values of all resistances as well as lower values of the constant phase elements, CPEs (Q1 and Q2). The PCT measurements revealed that the corrosion decreased when Zr was added via decreasing the absolute currents obtained for Ti-15%Zr alloy as compared to pure Ti. The presence of Zr also eliminates the possibility of the occurrence of pitting corrosion. The SEM and EDX analyses confirmed the electrochemical results by showing that the formation of ZrO2 in addition to TiO2, which are formed on the surface during the immersion in the SBF, may increase the passivation of Ti.
Author Contributions
Conceptualization, H.F.A., Y.A.B. and E.-S.M.S.; methodology, H.F.A., Y.A.B. and E.-S.M.S.; formal analysis, Y.A.B. and E.-S.M.S.; funding, E.-S.M.S.; writing—original draft preparation, Y.A.B. and E.-S.M.S.; writing—review and editing, E.-S.M.S.; supervision, H.F.A. and E.-S.M.S.; project administration, H.F.A. and E.-S.M.S. All authors have read and agreed to the published version of the manuscript.
Funding
This work was funded through the Researchers Supporting Project Number (RSP-2021/33) at King Saud University, Riyadh, Saudi Arabia.
Institutional Review Board Statement
Not applicable.
Informed Consent Statement
Not applicable.
Data Availability Statement
The data presented in this study are available within the manuscript.
Acknowledgments
Researchers Supporting Project Number (RSP-2021/33), King Saud University, Riyadh, Saudi Arabia.
Conflicts of Interest
The authors declare no competing financial interest.
References
- Abdel-Hady, M.; Fuwa, H.; Hinoshita, K.; Kimura, H.; Shinzato, Y.; Morinaga, M. Phase stability change with Zr content in β-type Ti–Nb alloys. Scr. Mater. 2007, 57, 1000–1003. [Google Scholar] [CrossRef]
- Biehl, V.; Wack, T.; Winter, S.; Seyfert, U.T.; Breme, J. Evaluation of the hemocompatibility of titanium-based biomaterials. Biomol. Eng. 2002, 19, 97–101. [Google Scholar] [CrossRef]
- Chong, Y.; Bhattacharjee, T.; Tsuji, N. Bi-lamellar microstructure in Ti–6Al–4V: Microstructure evolution and mechanical properties. Mater. Sci. Eng. A 2019, 762, 138077. [Google Scholar] [CrossRef]
- Correa, D.R.N.; Kuroda, P.A.B.; Lourenço, M.L.; Buzalaf, M.A.R.; Grandini, C.R. Adjustment of the microstructure and selected mechanical properties of biomedical Ti-15Zr-Mo alloys through oxygen doping. J. Alloys Compd. 2019, 775, 158–167. [Google Scholar] [CrossRef]
- da Silva, M.R.; Gargarella, P.; Plaine, A.H.; Contieri, R.J.; Pauly, S.; Kühn, U.; Bolfarini, C. Influence of the deformation rate on phase stability and mechanical properties of a Ti–29Nb–13Ta–4.6 Zr–xO alloy analyzed by in situ high-energy X-ray diffraction during compression tests. J. Mater. Res. 2020, 35, 1777–1789. [Google Scholar] [CrossRef]
- Gu, X.; Zheng, Y.; Cheng, Y.; Zhong, S.; Xi, T. In vitro corrosion and biocompatibility of binary magnesium alloys. Biomaterials 2009, 30, 484–498. [Google Scholar] [CrossRef]
- Heiner, A.D.; Poggie, R.A.; Brown, T.D. Flexural rigidity of laboratory and surgical substitutes for human fibular bone grafts. J. Musculoskelet. Res. 1998, 2, 267–272. [Google Scholar] [CrossRef]
- Isaksson, H.; Nagao, S.; MaŁkiewicz, M.; Julkunen, P.; Nowak, R.; Jurvelin, J.S. Precision of nanoindentation protocols for measurement of viscoelasticity in cortical and trabecular bone. J. Biomech. 2010, 43, 2410–2417. [Google Scholar] [CrossRef]
- Li, R.; Liu, G.; Yang, L.; Qing, Y.A.; Tang, X.; Guo, D.; Zhang, K.; Qin, Y. Tantalum boride as a biocompatible coating to improve osteogenesis of the bionano interface. J. Biomed. Mater. Res. A 2020, 108, 1726–1735. [Google Scholar] [CrossRef]
- Li, Y.; Yang, C.; Zhao, H.; Qu, S.; Li, X.; Li, Y. New developments of Ti-based alloys for biomedical applications. Materials 2014, 7, 1709–1800. [Google Scholar] [CrossRef] [Green Version]
- Lin, J.; Ozan, S.; Li, Y.; Ping, D.; Tong, X.; Li, G.; Wen, C. Novel Ti-Ta-Hf-Zr alloys with promising mechanical properties for prospective stent applications. Sci. Rep. 2016, 6, 1–11. [Google Scholar] [CrossRef] [PubMed]
- Liu, H.; Chen, Y.; Tang, Y.; Wei, S.; Niu, G. The microstructure, tensile properties, and creep behavior of as-cast Mg– (1–10)% Sn alloys. J. Alloy Compd. 2007, 440, 122–126. [Google Scholar] [CrossRef]
- Akimoto, T.; Ueno, T.; Tsutsumi, Y.; Doi, H.; Hanawa, T.; Wakabayashi, N. Evaluation of corrosion resistance of implant-use Ti-Zr binary alloys with a range of compositions. J. Biomed. Mater. Res. Part B Appl. Biomater. 2016, 106, 73–79. [Google Scholar] [CrossRef]
- Ikarashi, Y.; Toyoda, K.; Kobayashi, E.; Doi, H.; Yoneyama, T.; Hamanaka, H.; Tsuchiya, T. Improved Biocompatibility of Titanium–Zirconium (Ti–Zr) Alloy: Tissue Reaction and Sensitization to Ti–Zr Alloy Compared with Pure Ti and Zr in Rat Implantation Study. Mater. Trans. 2005, 46, 2260–2267. [Google Scholar] [CrossRef] [Green Version]
- Lee, S.-Y.; Lee, H.-J.; Baek, J.-H.; Park, S.S.; Lee, J.G. Microstructural and Corrosion Properties of Ti-to-Zr Dissimilar Alloy Joints Brazed with a Zr-Ti-Cu-Ni Amorphous Filler Alloy. Metals 2021, 11, 192. [Google Scholar] [CrossRef]
- Sherif, E.S.M. Effects of exposure time on the anodic dissolution of Monel-400 in aerated stagnant sodium chloride solutions. J. Solid State Electrochem. 2012, 16, 891–899. [Google Scholar] [CrossRef]
- Liu, Y.J.; Li, X.P.; Zhang, L.C.; Sercombe, T.B. Processing and properties of topologically optimised biomedical Ti–24Nb–4Zr–8Sn scaffolds manufactured by selective laser melting. Mater. Sci. Eng. A 2015, 642, 268–278. [Google Scholar] [CrossRef]
- Sherif, E.-S.M.; Ahmed, A.H.; Abdo, H.S.; DefAllah, M.N. Impediment of Iron Corrosion by N,N0-bis[2-hydroxynaphthylidene]amino]oxamide in 3.5% NaCl solution. Crystals 2021, 11, 1263. [Google Scholar] [CrossRef]
- Sherif, E.-S.M.; Potgieter, J.H.; Comins, J.D.; Cornish, L.; Olubambi, P.A.; Machio, C.N. Effects of minor additions of ruthenium on the passivation of duplex stainless-steel corrosion in concentrated hydrochloric acid solutions. J. Appl. Electrochem. 2009, 39, 1385–1392. [Google Scholar] [CrossRef]
- Sherif, E.S.M.; Potgieter, J.H.; Comins, J.D.; Cornish, L.; Olubambi, P.A.; Machio, C.N. The beneficial effect of ruthenium additions on the passivation of duplex stainless-steel corrosion in sodium chloride solutions. Corros. Sci. 2009, 51, 1364–1371. [Google Scholar] [CrossRef]
- Badawy, W.A.; Al-Kharafi, F.M.; El-Azab, A.S. Electrochemical behaviour and corrosion inhibition of Al, Al-6061 and Al-Cu in neutral aqueous solutions. Corros. Sci. 1999, 41, 709–727. [Google Scholar] [CrossRef]
- Afzali, P.; Ghomashchi, R.; Oskouei, R.H. On the corrosion Behaviour of low modulus titanium alloys for medical implant applications: A review. Metals 2019, 9, 878. [Google Scholar] [CrossRef] [Green Version]
- Diamanti, M.V.; Bolzoni, F.; Ormellese, M.; Pérez-Rosales, E.A.; Pedeferri, M.P. Characterization of titanium oxide films by potentiodynamic polarisation and electrochemical impedance spectroscopy. Corros. Eng. Sci. Technol. 2010, 45, 428–434. [Google Scholar] [CrossRef]
- Zhang, Z.; Chen, S.; Li, Y.; Li, S.; Wang, L. A study of the inhibition of iron corrosion by imidazole and its derivatives self-assembled films. Corros. Sci. 2009, 51, 291–300. [Google Scholar] [CrossRef]
- Sherif, E.S.M.; Abdo, H.S.; Alharthi, N.H. Beneficial Effects of Vanadium Additions on the Corrosion of Ti6AlxV Alloys in Chloride Solutions. Metals 2020, 10, 264. [Google Scholar] [CrossRef] [Green Version]
- Sherif, E.-S.M.; Erasmus, R.M.; Comins, J.D. In situ Raman spectroscopy and electrochemical techniques for studying corrosion and corrosion inhibition of iron in sodium chloride solutions. Electrochim. Acta 2010, 55, 3657–3663. [Google Scholar] [CrossRef]
- Khalil, K.A.; Sherif, E.-S.M.; Almajid, A.A. Corrosion passivation in Simulated Body Fluid of Magnesium/Hydroxyapatite Nanocomposites Sintered by High Frequency Induction Heating. Int. J. Electrochem. Sci. 2011, 6, 6184–6199. [Google Scholar]
- Sherif, E.-S.M. Effects of 5-(3-aminophenyl)-tetrazole on the inhibition of unalloyed iron corrosion in aerated 3.5% sodium chloride solutions as a corrosion inhibitor. Mater. Chem. Phys. 2011, 129, 961–967. [Google Scholar] [CrossRef]
- Orazem, M.E.; Tribollet, B. Electrochemical Impedance Spectroscopy, 1st ed.; John Wiley & Sons: Hoboken, NJ, USA, 2008. [Google Scholar]
- Sherif, E.-S.M.; Park, S.-M. Effects of 1,5-Naphthalenediol on Aluminum Corrosion as a Corrosion Inhibitor in 0.50 M NaCl. J. Electrochem. Soc. 2005, 152, B205–B211. [Google Scholar] [CrossRef] [Green Version]
- Ahmed, A.H.; Sherif, E.-S.M.; Abdo, H.S.; Gad, E.S. Ethanedihydrazide as a Corrosion Inhibitor for Iron in 3.5% NaCl Solutions. ACS Omega 2021, 6, 14525–14532. [Google Scholar] [CrossRef]
- Sherif, E.-S.M.; Ragab, S.A.; Abdo, H.S. Role of Vanadium Additions on the Corrosion Mitigation of Ti-6Al-xV Alloy in Simulated Body Fluid. Metals 2020, 10, 903. [Google Scholar] [CrossRef]
- Latief, F.; Sherif, E.-S.M.; Almajid, A.; Junaedi, H. Fabrication of exfoliated graphite nanoplatelets-reinforced aluminum composites and evaluating their mechanical properties and corrosion behavior. J. Anal. Appl. Pyrolysis 2011, 92, 485–492. [Google Scholar] [CrossRef]
| Publisher’s Note: MDPI stays neutral with regard to jurisdictional claims in published maps and institutional affiliations. |
© 2021 by the authors. Licensee MDPI, Basel, Switzerland. This article is an open access article distributed under the terms and conditions of the Creative Commons Attribution (CC BY) license (https://creativecommons.org/licenses/by/4.0/).


