Article

Discharge Energy as a Key Contributing Factor Determining Microgeometry of Aluminum Samples Created by Electrical Discharge Machining

Faculty of Mechanical Engineering, Institute of Mechanical Technology, Poznan University of Technology, ul. Piotrowo 3, 61-138 Poznan, Poland
*
Author to whom correspondence should be addressed.
Crystals 2021, 11(11), 1371; https://doi.org/10.3390/cryst11111371
Submission received: 27 October 2021 / Revised: 8 November 2021 / Accepted: 10 November 2021 / Published: 11 November 2021

Abstract

:
The aim of this study is first to determine the effect of the discharge energy on the surface microgeometry of aluminum samples created by electrical discharge machining (EDM). Secondly, an additional purpose is to demonstrate the differences between the geometric multiscale methods: length-, area-scale, and curvature. Eleven samples were manufactured using discharge energies ranging from 0.486 mJ to 1389.18 mJ and, subsequently, measured with focus variation microscopy. Standard ISO and multiscale parameters were calculated and used for surface discrimination and regression analysis. The results of linear, logarithmic, and exponential regression analyses revealed a strong correlation (R2 > 0.9) between the geometrical features of the surface topography and the discharge energy. The approach presented in this paper shows that it is possible to shape surface microgeometry by changing the energy of electrical discharges, and these dependencies are visible in various scales of observation. The similarities of the results produced by curvature and length-scale methods were observed, despite the significant differences in the essence of those methods.

Graphical Abstract

1. Introduction

Electrical discharge machining is becoming an increasingly popular method of machining materials, thanks to its unconventional and wide machining capabilities. In comparison to other conventional processes (e.g., grinding, milling), EDM is distinguished by the possibility of texturing complex geometric surfaces of any electrically conductive materials [1,2]. The material is removed by electrothermal phenomena in which electrical discharges occur between the tool electrode and the workpiece immersed in a dielectric liquid [3]. This liquid (e.g., distilled water, ethylene glycol) is designed to separate the electrode from the machined surface to obtain a high electric current density, as well as to cool the electrode and remove molten particles from the machining area [4]. A series of electrical discharges are separated by a constant spark gap [5]. The susceptibility of a material to electrical discharge depends mainly on its electrical conductivity as well as electrical resistance, melting point, and thermal conductivity [4].
Electrical discharge machining is a method that allows the formation of the surface topography of metal materials [6]. The surface of the material created by EDM is perceived as plateaus and craters, whose geometrical characteristics are closely related to the parameters of the machining process. Analysis of the correlation between the formed features of surface geometry, including their radius, depth, curvature, and volume, and the related determinants of EDM, allow the design and control of the surface finishing process and the technological properties of engineering materials [7,8]. The surface roughness is influenced by EDM parameters, mainly the current, voltage, polarity, and duration of the electric impulse, the multiplication of which is the energy of electric discharges—a key factor determining the surface finish. Additionally important are the dielectric liquid, electrode material, and the type of machining movement [9,10,11]. Surface microgeometry is mainly determined by the energy of the electrical discharge between the electrode and the workpiece [12]. Klocke et al. added that with increasing the energy of the discharges, a greater depth of the transformation layer is obtained [13]. Other authors have found a relationship between electrical discharge and the morphology of surface craters, their diameter and depth [14], curvature [15], area [16], and volume [17]. The research proves that these correlations follow linear [18] or logarithmic [19] trends, while all the obtained results show the features of a close interaction of crater microgeometry with the energy of electrical discharges under the conditions of not changing other factors influencing the machining process. A recent summary of surface texture-processing parameter interactions was given by Jithin [20].
The energy of electric discharges, as the main factor influencing the surface topography, also indirectly determines the technological and functional properties of the surface, including microstructure and microhardness [21], corrosion behavior [22], wear resistance [23], and wettability [24]. Knowledge of the correlation between these parameters enables the design of the required surface properties by controlling the EDM parameters [25,26,27].
The surface topography can be characterized by several methods. The first and most conventional involves the determination of surface texture parameters in accordance with the ISO 25178–2 standard. This approach allows the quantification of the basic texture parameters of the analyzed sample area [28]. Another method focuses on characterizing the surface features created by the production process. A set of such features includes, for example, valleys and ridges, inextricably linked with the milling process, or craters closely related to electrical discharge machining. Some topographic formations can be described based on the ISO standard, but without specifying the observation scale of these features. Due to the fact that the discernibility and visibility of certain surface formations change with different scales of observation, a third method is used, which is based on the multiscale approach. In scientific papers, it is described that certain geometric measures of topographic features (length and area) change with the scale of observation, which is closely related to physical phenomena and their influence on the surface formation process [29]. The method of multiscale curvatures allows for a more multifaceted description of surfaces, including measurements of concavity and convexity of surface geometric features and the degree of their bending in specific spatial directions [30,31,32].
The multiscale geometric approach is particularly applicable to irregular surface topographic structures, mainly generated by interacting physical phenomena. The purpose of using multiscale methods is to more accurately determine the functional correlations between the parameters of machining processes and the created surface topographies [33]. Surface decomposition allows distinguishing its features, evident in many scales of observation, which depend on the interaction scales. Such a property is not available in traditional topographic analysis methods [29]. Fractal complexity, one of the parameters describing the surface, is determined on various scales for which it changes its values. In multiscale analyses, in addition to the key surface height data, curvature tensors are also processed [30].
There are two main types of multiscale analysis methods. In both of them, the scope of the scales to be analyzed and the measurement intervals are selected. The first method is distinguished by the constant sampling frequency distances for the surface decomposition process, using the Gauss, wavelets, boxes, or area-scale approaches. The second method is characterized by the use of scale searching algorithms in the surface decomposition process, in which the sampling distances may be variable, e.g., the method of the slit island. The basis for the use of multiscale methods is the earlier mathematical characterization of surfaces with regular or irregular features. Type I of the surface is defined as a function of the form z = f(x,y). Type II includes parametric surfaces 𝑧 = 𝛤(𝑡), and Type III combines multiple curves with parametric features. Among the various parameters representing the surface, the Sdr, defined as the ratio of the surface formations to the projected surface area, is of particular importance [33].
The functions of convolutions, variations, and coverings are used to describe the surface topography. The first function decomposes the topography on the basis of finding the features with the greatest degree of similarity. Meaning is attributed to scalable wavelets essential to describe a decomposed topographic signature, complementing basic mathematical forms interpreting simple and basic topographic features. Scale wavelets are important in interpreting physical mechanisms in different scales [34,35]. Variance functions refer to numerical indices that describe topographic diversity across multiple scale ranges [36]. Coverings consist in determining the Minkowski–Bouligand dimension, using box, sphere, and oscillation covers. This approach is complemented by Mandelbrot’s concept of the classification of covering methods into fixed and variable yardsticks, then the Minkowski and Packing system. In this approach, there is a method of determining the fractal dimensions of the surface, consisting of the horizontal decomposition of topographic features shown in the form of islands, characterized by the relationship between their surface and perimeter [33]. The categories described by Mandelbrot can be analyzed using three basic multiscale methods: patchwork, box, and motifs. The first method used is area-scale analysis. The classic version of this method consists in isolating the patches of triangles of various sizes, covering the analyzed surface area. At each stage of this analysis, the triangular 3D solids correspond to the scale of the area. The box method uses rectangles that are divided into squares. In this variant, mainly Sa and Sz parameters are analyzed. The multiscale analysis is based on the continuous change of the box size and the calculation of topographic parameters. In the motif method, topographic motifs are located, and the basic parameters describing the surface, such as height, diameter, and orientation are calculated, using Wolf pruning. A pattern is defined as the distance between two peaks and one valley between them, or two valleys and one peak in the middle. The motif method uses a varied sampling distance, unlike the box and patchwork methods [33,37,38]. A recent summary of the practical use of multiscale methods was presented by Brown et al. [29].
In industrial practice, the VDI 3400 standard is widely recognized for assessing surface roughness of EDMed parts. Although the method was developed more than 40 years ago, in 1975, it is still used for a reference optical and tactile comparison of machined surfaces. The changing industry requirements for defining surface topography renders the VDI 3400 standard incomplete for many precision industry applications. This standard allows only the roughness parameter Ra to be verified, which does not fully show the surface morphology and detailed topographic parameters [39].
In this paper, we apply the same material, manufacturing, and measurements techniques that were described in our previous study [24]. That work was focused on controlling the wetting performance by adjusting technological parameters in order to achieve a hydrophobic effect. This paper addresses the different research problems as it focuses on the energy of electric discharges as a machining parameter, closely related to the topography of the created surfaces. Workpiece texturing by EDM to modify the functional properties of the surface offers development potential in many applications, for example in the aerospace, automotive, and biomedicine industries. Similar research using multiscale analysis was already performed for stainless [15,40] and tool steel [12]. This study is an extension made for aluminum-based alloy and aims at verifying that similar observations can be found for all material groups using multiscale geometric methods. According to the literature review and the authors’ best knowledge, no previous research in Al-based alloys using EDM and multiscale analysis was conducted. Additionally, the novelty and purpose of this paper is to compare the performance of different multiscale approaches: length-, area-scale, and curvature, i.e. how well they can discriminate between surfaces and how well they perform in finding strong functional correlations between discharge energy and corresponding characterization parameters. This paper presents analyses of production samples made of aluminum alloy used in the automotive heat exchange industry, including length-scale and area-scale analyses. This study aims to provide a more comprehensive approach to the description of machined surface microgeometry than presented in industrial, not fully complete standards (VDI 3400), and also incompletely described in other publications, which was recently well summarized by Jithin et al. [41].

2. Materials and Methods

2.1. Sample Preparation

The EDM process and surface topography analyses were performed on 11 rectangular blocks with dimensions of 40 mm × 40 mm × 5 mm. The samples were made of aluminum alloy 6060 T4 (Hydro Extrusion) with the chemical composition presented in Table 1. The tested material is characterized by a yield point of 60 MPa, a tensile strength of 120 MPa, and Brinell hardness of 40 HB. These parameters have been verified and given in the certificate document by the material supplier.
The samples were first milled and then electro-eroded using an EDM machine GF Agie Charmilles Form 20. In order to determine the effect of electrical discharge machining on the surface topography, the process parameters were changed for each sample in accordance with Table 2. In the area of the sample, during the EDM process, the discharge energy changes into thermal energy, which is related to the local material melting. The discharge energy is calculated on the basis of the changed EDM parameters, which are multiplied: current, spark voltage, and electric discharge time [12]. It was the authors’ intention not to focus on finding relations between all relevant machining parameters but concentrating on a single unifying factor—discharge energy [12,15,24,40,41]. As the commercial EDM machine tool is used, the figures are shown in Table 2 (voltage, current, single pulse time, and break between pulses) were automatically adjusted by the machine tool control system to achieve theoretical VDI class of surface texture for the given electrode and machined material. The motivation here was, thus, to follow the industrial practice for practical application of the hereby presented research work.
The constant variables of the process were a copper electrode with dimensions adapted to the area of the treated surface to increase the efficiency of the process and to limit the movement of the tool to reciprocating. The dielectric fluid was distilled water to minimize the presence of EDM products on the surface of the samples subjected to further analysis.
Samples after electrical discharge machining are shown in Figure 1. The set parameters of the EDM machine made it possible to obtain texturing of the surface with a roughness in the range of 0.56–18 µm, which corresponds to classes 14–45 defined in the industrial standard VDI 3400. In order to prepare the samples for the analysis of the surface topography, degreasing in acetone was performed (1 min), then in isopropyl alcohol (10 min).

2.2. Measurements and Filtration

A Focus Variation Microscope (FVM)—Alicona InfiniteFocus G5, was used here for the measurement of the samples. FVM is a contrast-detection-based technology that utilizes both narrow depth of field of the microscopic lens and precise movement along the optical axis in order to accurately estimate the coordinate of maximum point “sharpness” and therefore its relative position to the neighboring points. Measurement parameters are presented in Table 3. The choice of this particular measurement technique was dictated by its ability to measure high slopes and variable surface asperities [42,43], which are abundant on surfaces fabricated by EDM. This allowed the researchers to obtain datasets nearly free from non-measured points, with fully measured curvature of the craters.
Selected magnification enabled accurate measurement of microscale roughness and craters geometry. No polarizer or external light source was used. Prior to the measurement, the samples were additionally cleaned using plain air to remove any residual dust particles. Each measurement consisted of five sub-measurements located evenly on the sample surface in a cross-like pattern. Samples were mounted in a fixture in order to preserve the distance between the sub-measurements. Each sub-measurement was performed with the exact same parameters ensuring constant conditions for each sample.
Measurement results were saved as a point cloud, which was then directly analyzed in the dedicated software MountainsMap (Digital Surf, Besançon, France). All datasets underwent the same processing procedure, which consisted of:
  • dataset leveling—in this operation non-measured points and their neighboring areas were excluded from the calculation of the least square polynomial surface of 1st degree. There was no form-removal step since the samples were manufactured as a flat surface and form deviation would not clearly manifest itself in the relatively small measurement area;
  • thresholding—this operation generally aids in the next step of software-driven outliers removal, which does not always remove larger spikes, and plateau-like artifacts, which are characteristic of FVM measurements [44]. Generally, for other surface morphologies, this step would be omitted and only outliers removal procedure would be performed [45];
  • outliers removal—the built-in software operation was used to remove the outliers, i.e., spikes, vertical slopes, etc.;
  • filling in non-measured points—in this operation non-measured points were replaced with a smooth shape calculated from the neighbors. In order to avoid the reappearance of previously present artifacts, non-measured zones were dilated by 1.5 µm. None of the measured surfaces contained significantly large (>15 µm in diameter) non-measured areas.
It has to be emphasized that the measurement technique, further digital processing of the data, and the applied software have a strong impact on the fidelity of the post-processed surface topography and resulting characterization parameters [46,47,48,49]. Thus, providing a detailed description of the methods is not only important from the repeatability perspective but also improves the credibility of particular research. The presence of non-measured points is critical for the reliable calculation of surface characterization parameters. In rough surfaces, such as obtained with EDM, there are significant variations in surface texture, resulting in multiple areas that may be either under or overexposed during the measurement causing the non-measured points to occur. Manipulating the light intensity in general eventually leads to a setting, where the least non-measured points ratio occurs. As described by Pawlus et al. [46], the location of non-measured areas affects the surface parameters differently, and, to some extent depends on light intensity, e.g., too little light causes the presence of non-measured points in a valley area, while overexposure in the peak area. Surface parameters that are most affected by the presence of non-measured points are also listed in that study.

2.3. Surface Characterization Methods

2.3.1. Standard Analysis with ISO Parameters (MM)

In this study, a conventional surface characterization is used using as described in ISO 25178, as well as in EUR 15178N standard. Additional parameters (Smean, Sdar, and Spar) were defined by the European SURFSTAND project [50] and are designed to describe surface zones that actively take part in tribological phenomena. These parameters were calculated according to the guidance of ISO 25178, i.e., for the S-L surface, with the nesting index of 250 μm (Gaussian filter). According to Townsend et al. “filtering is based on the roughness or scale of the largest significant feature” [51]. In the case of the predicted and calculated roughness values, it indicated that the correct nesting index value should be as aforementioned. Choosing a smaller value would lead to an excess transfer of roughness information into the waviness surface. The same approach was also presented in [12]. The full list of parameters is shown in Table 4 and their full meanings are given in Table A1.

2.3.2. Length-Scale and Area-Scale Analyses

Length-, area-scale, and complexity-scale analyses [52,53] were performed on the filtered files. In this study, symbols of the multiscale characterization parameters were taken from the ASME standard. Length-scale analysis determines the relative length (Rel), a ratio of the calculated to the nominal length of profile at each scale. The extension to three-dimensional data is done through area-scale analysis which involves a determination of the relative area (RelA), which is a ratio of the calculated to nominal areas, at each scale. Since surfaces created by EDM are most often isotropic, the performance of both aforementioned methods should be similar.
The relative lengths were calculated over profiles extracted horizontally (rows) and vertically (columns) from areal measurements. Profiles were spaced by the original sampling interval (1.5 μm). The relative areas of surfaces were evaluated over the areal scales available in the measurement, from half the region measured (405,000 μm2) to the smallest possible triangle (0.75 μm2). Computations of length- and area-scale parameters were made using MountainsMap 9 software (DigitalSurf, Besançon, France). The relative area is computed through the patchwork method [54] which tiles the surface with triangular patches of equal area reflecting a scale. Visualizations of tiled surfaces for fine, middle, and coarse scales were presented using GOM Inspect software (GOM GmbH, Braunschweig, Germany). The length- (Lsfc) and area-scale fractal complexities (Asfc) (ASME B46.1), which are the slopes of the length-/area-scale plots, were also determined using the aforementioned software.

2.3.3. Multiscale Curvature Analysis

Curvature as a function of scale was evaluated using the method described in [12,15,24,28]. Statistical measures (average and standard deviation) of maximum (κ1), minimum (κ2), mean (H), and Gaussian (K) curvature were determined for the range of scales between 1 and 66 μm. Both signed and unsigned curvature were considered here [23]. All curvature computations were performed using Wolfram Mathematica software (version 12, Wolfram Research, Oxfordshire, UK). A list of all curvature parameters is presented in Table A1.
Curvature is a measure that is indicative of local shape. For example, it can determine if certain geometric topographic feature exhibits concavity or convexity and quantify the amount by which a particular region of surface bends in any direction. For EDM parts, surface morphology is a mosaic of overlapping craters which geometry can be evaluated via curvature.

2.4. Discrimination Analysis

In order to determine if a given multiscale topographic characterization parameter allows to statistically discriminate between surfaces, one-way ANOVA with post hoc Tukey test was applied. The ability to tell the surfaces apart with 95% or greater confidence was considered sufficient (p < 0.05). The normality of residuals was verified by the Shapiro–Wilk test.
Strengths of correlations between discharge energy and multiscale surface characterization parameters were determined as a function of scale. Linear and non-linear regressions (exponential and logarithmic) were considered. Strong correlations were assumed when the coefficient of determination R2 was greater than 0.9.

3. Results

3.1. Measurements of Surface Topographies

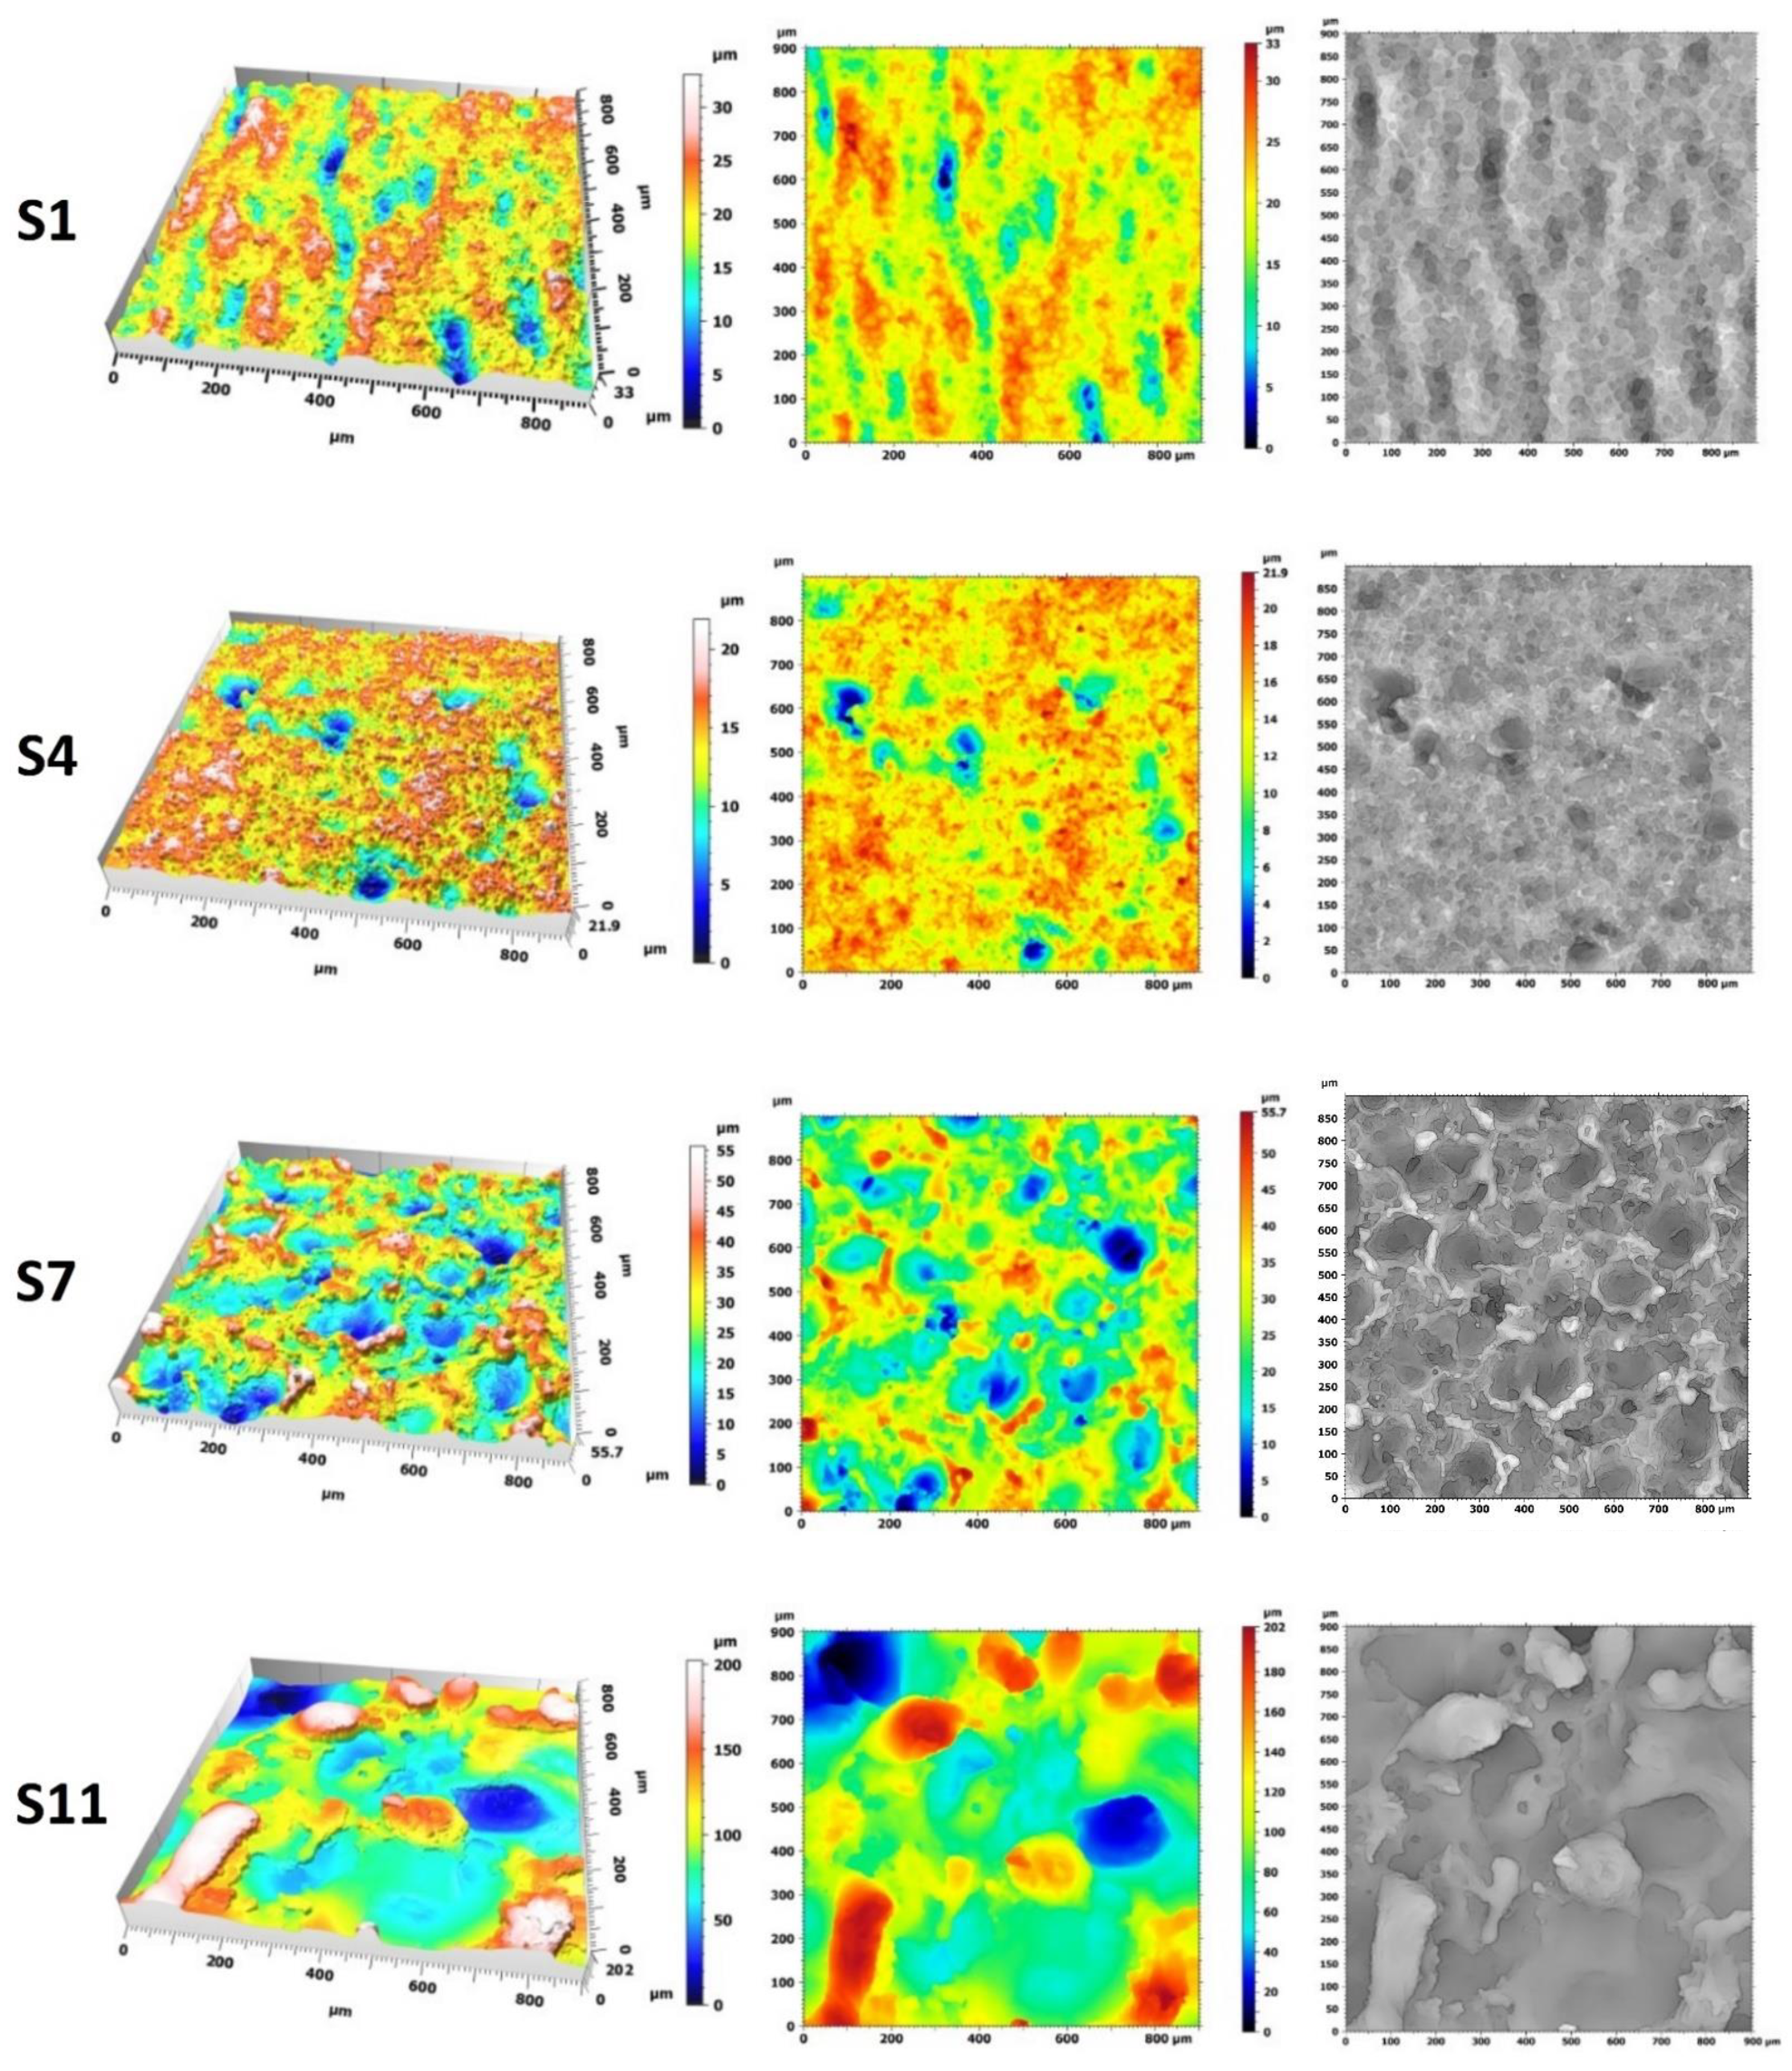
Measurement of the surface topographies using FVM provided datasets nearly free from outliers and non-measured points, both of which were eliminated during the post-processing. Surfaces of EDMed parts may pose a challenge to the focus variation technology in the case when small, shiny globules of melted material reside on the surface. However, in this study, the obtained surfaces were generally matt and therefore with relatively uniform reflectivity. High slopes of the craters were well mapped. Vertical lines, which can be seen in Surface 11 in Figure 2 indicate the presence of re-entrant features [55], which cannot be measured directly. The change in the discharge energy visibly affects the surface morphology. Samples manufactured with higher energy exhibit larger and deeper topographic features. The geometry of these craters was quantified using conventional and multiscale methods.

3.2. Standard Analysis with ISO Parameters

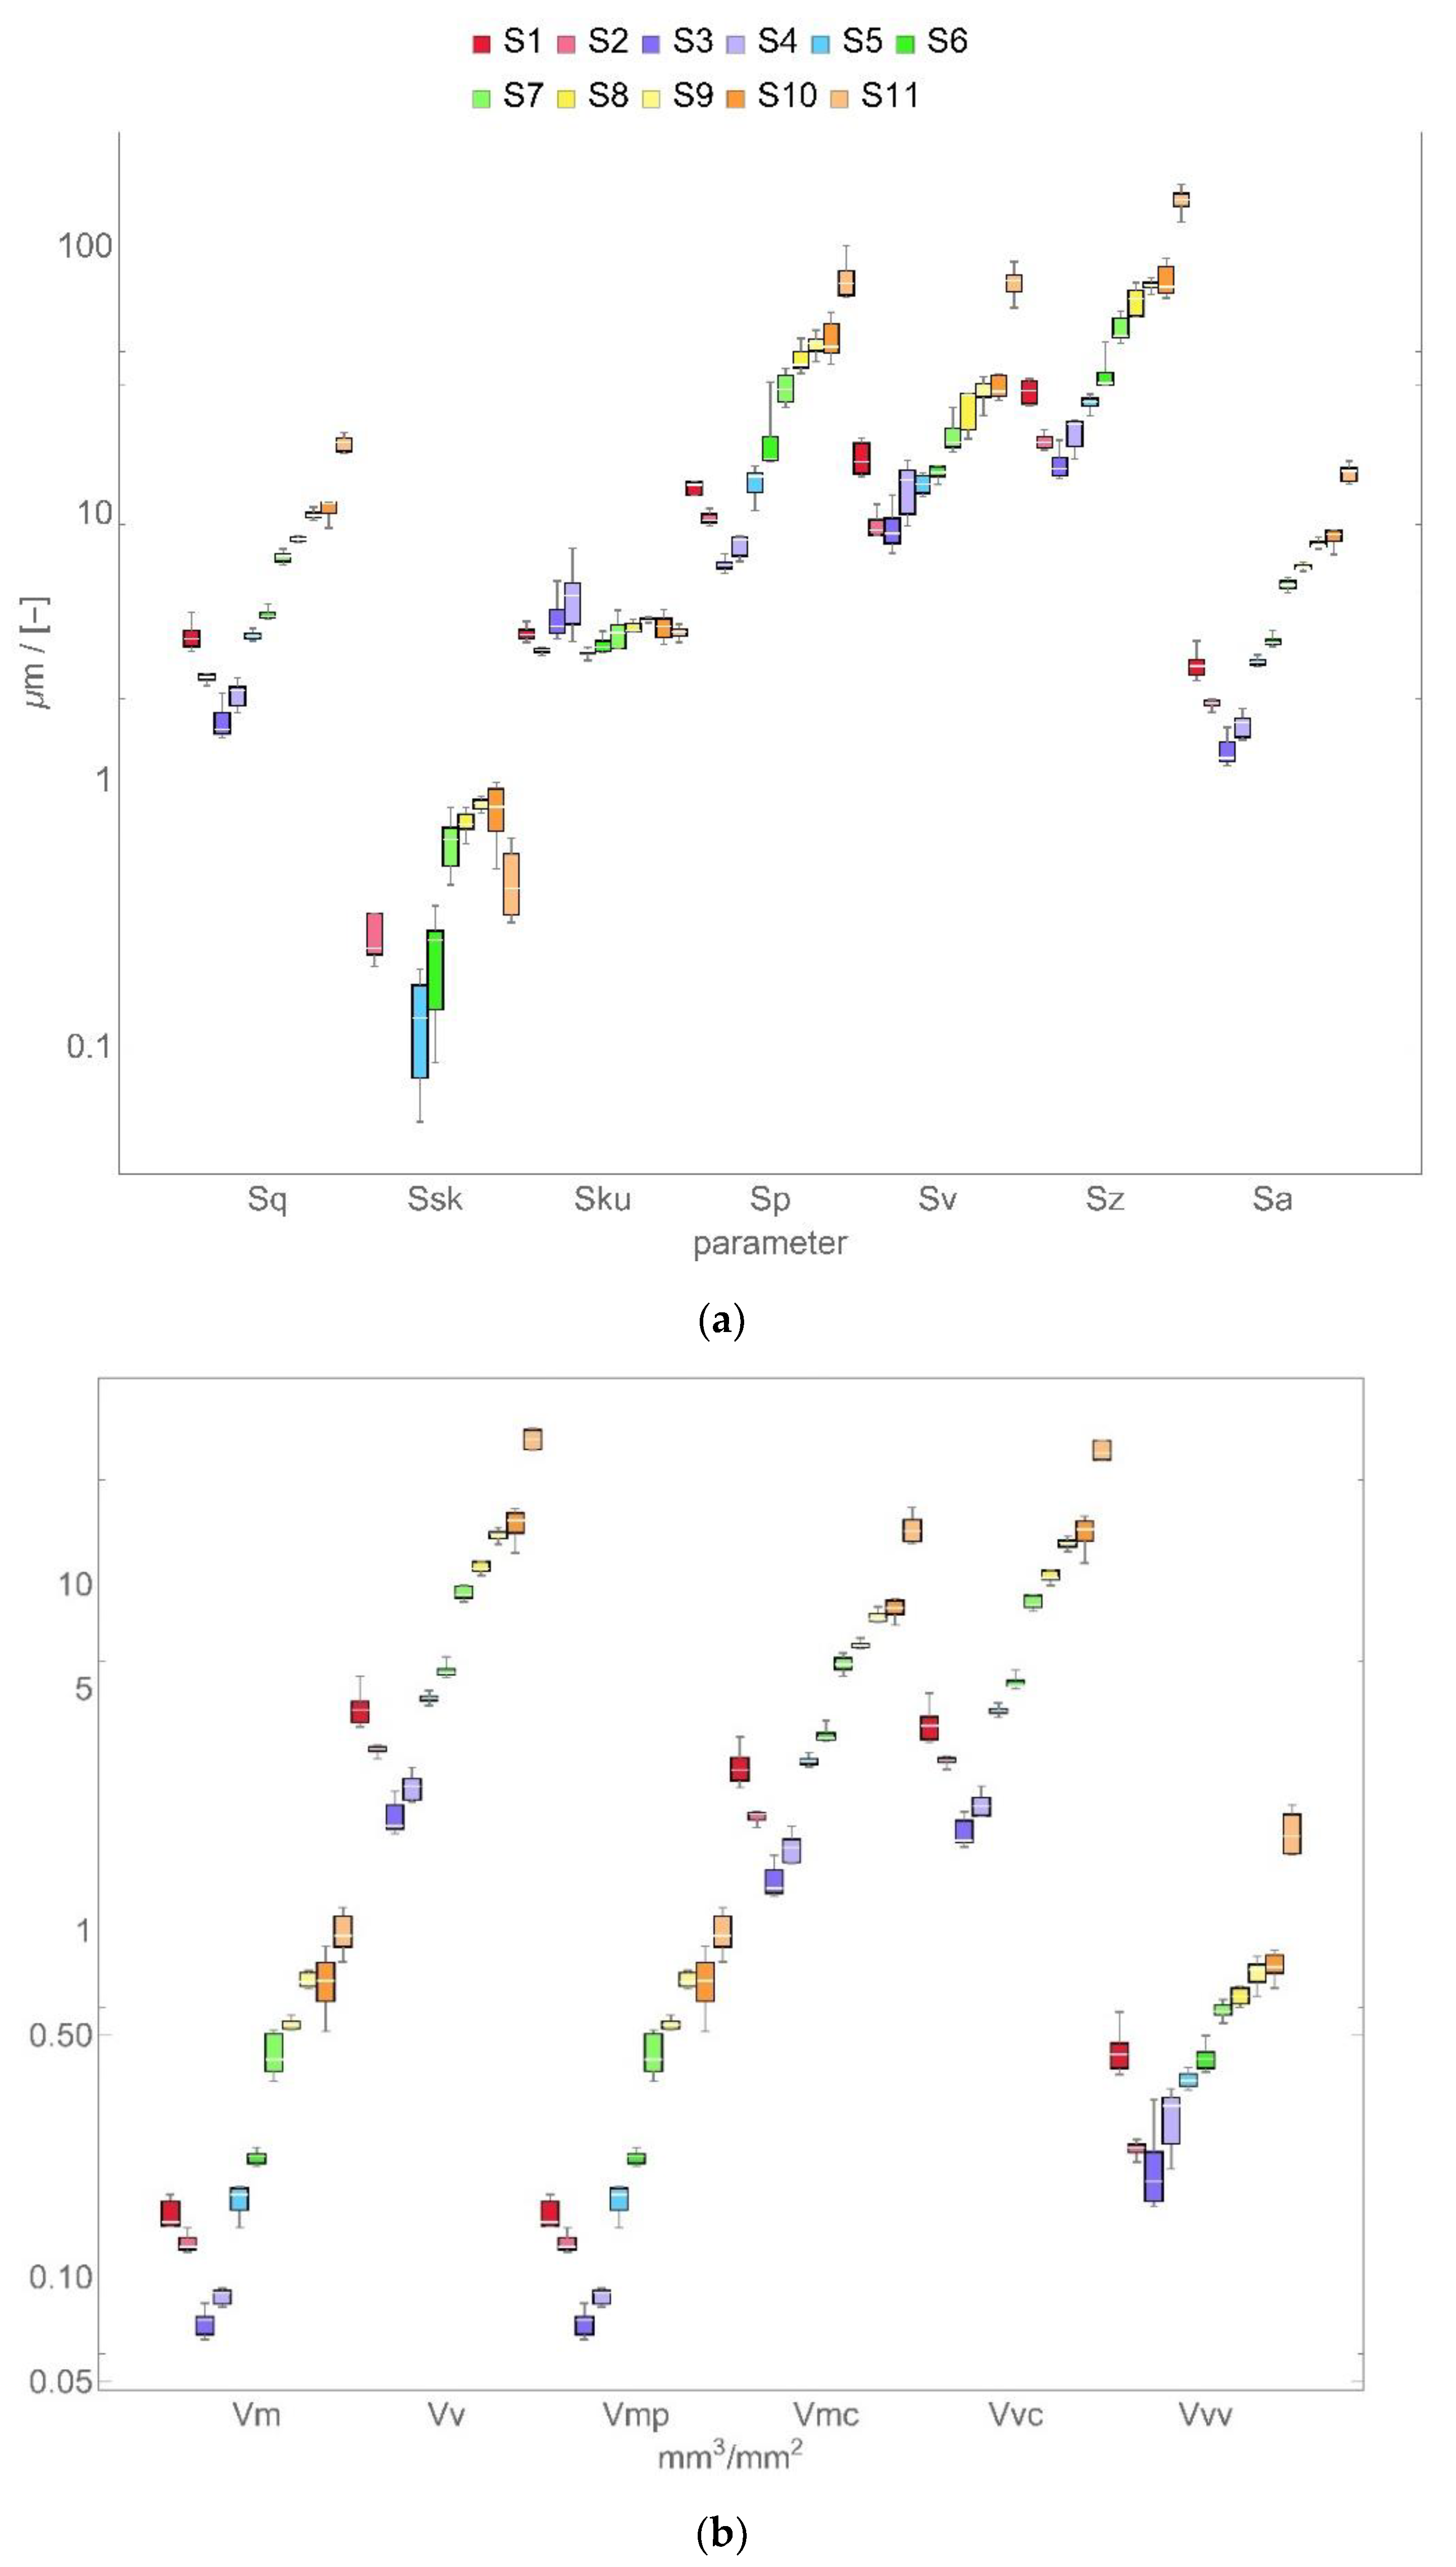
Exemplary visualizations of conventional parameters from height and volume group, calculated for each surface, are depicted as box-and-whisker plots (Figure 3). Results for other parameters are given in the Supplementary Materials to this study. Apart from kurtosis (Sku), the height parameter tends to increase with the discharge energy. That characteristic trend as in Sa or Sq is also present for parameters from other groups: hybrid (Sdq and Sdr), feature (S10z, S5p, S5v, Sda, Sha, Sdv, Shv), functional (Smc and Sxp), and other (Sdar). A declining trend was observed for Svi and Smr. No clear relation can be seen for other parameters.
The strengths of correlations between particular areal characterization parameters and the discharge energy are determined using linear, logarithmic, and exponential regressions. The detailed results displaying the coefficient of determination (R2) are shown in Table A2 in Appendix A. Strong correlations (R2 > 0.9) were observed only for a limited number of parameters and using linear regression: Sv, Spc, Shv, Spar. Maximum pit height, arithmetic mean peak curvature, mean hill volume, and projected area perform the best at describing surface morphology of EDMed samples with a reference to processing parameters. For the analyzed case, no strong evidence was found referring to logarithmic or exponential relations between analyzed areal parameters and the discharge energy.

3.3. Length- and Area-Scale Analyses

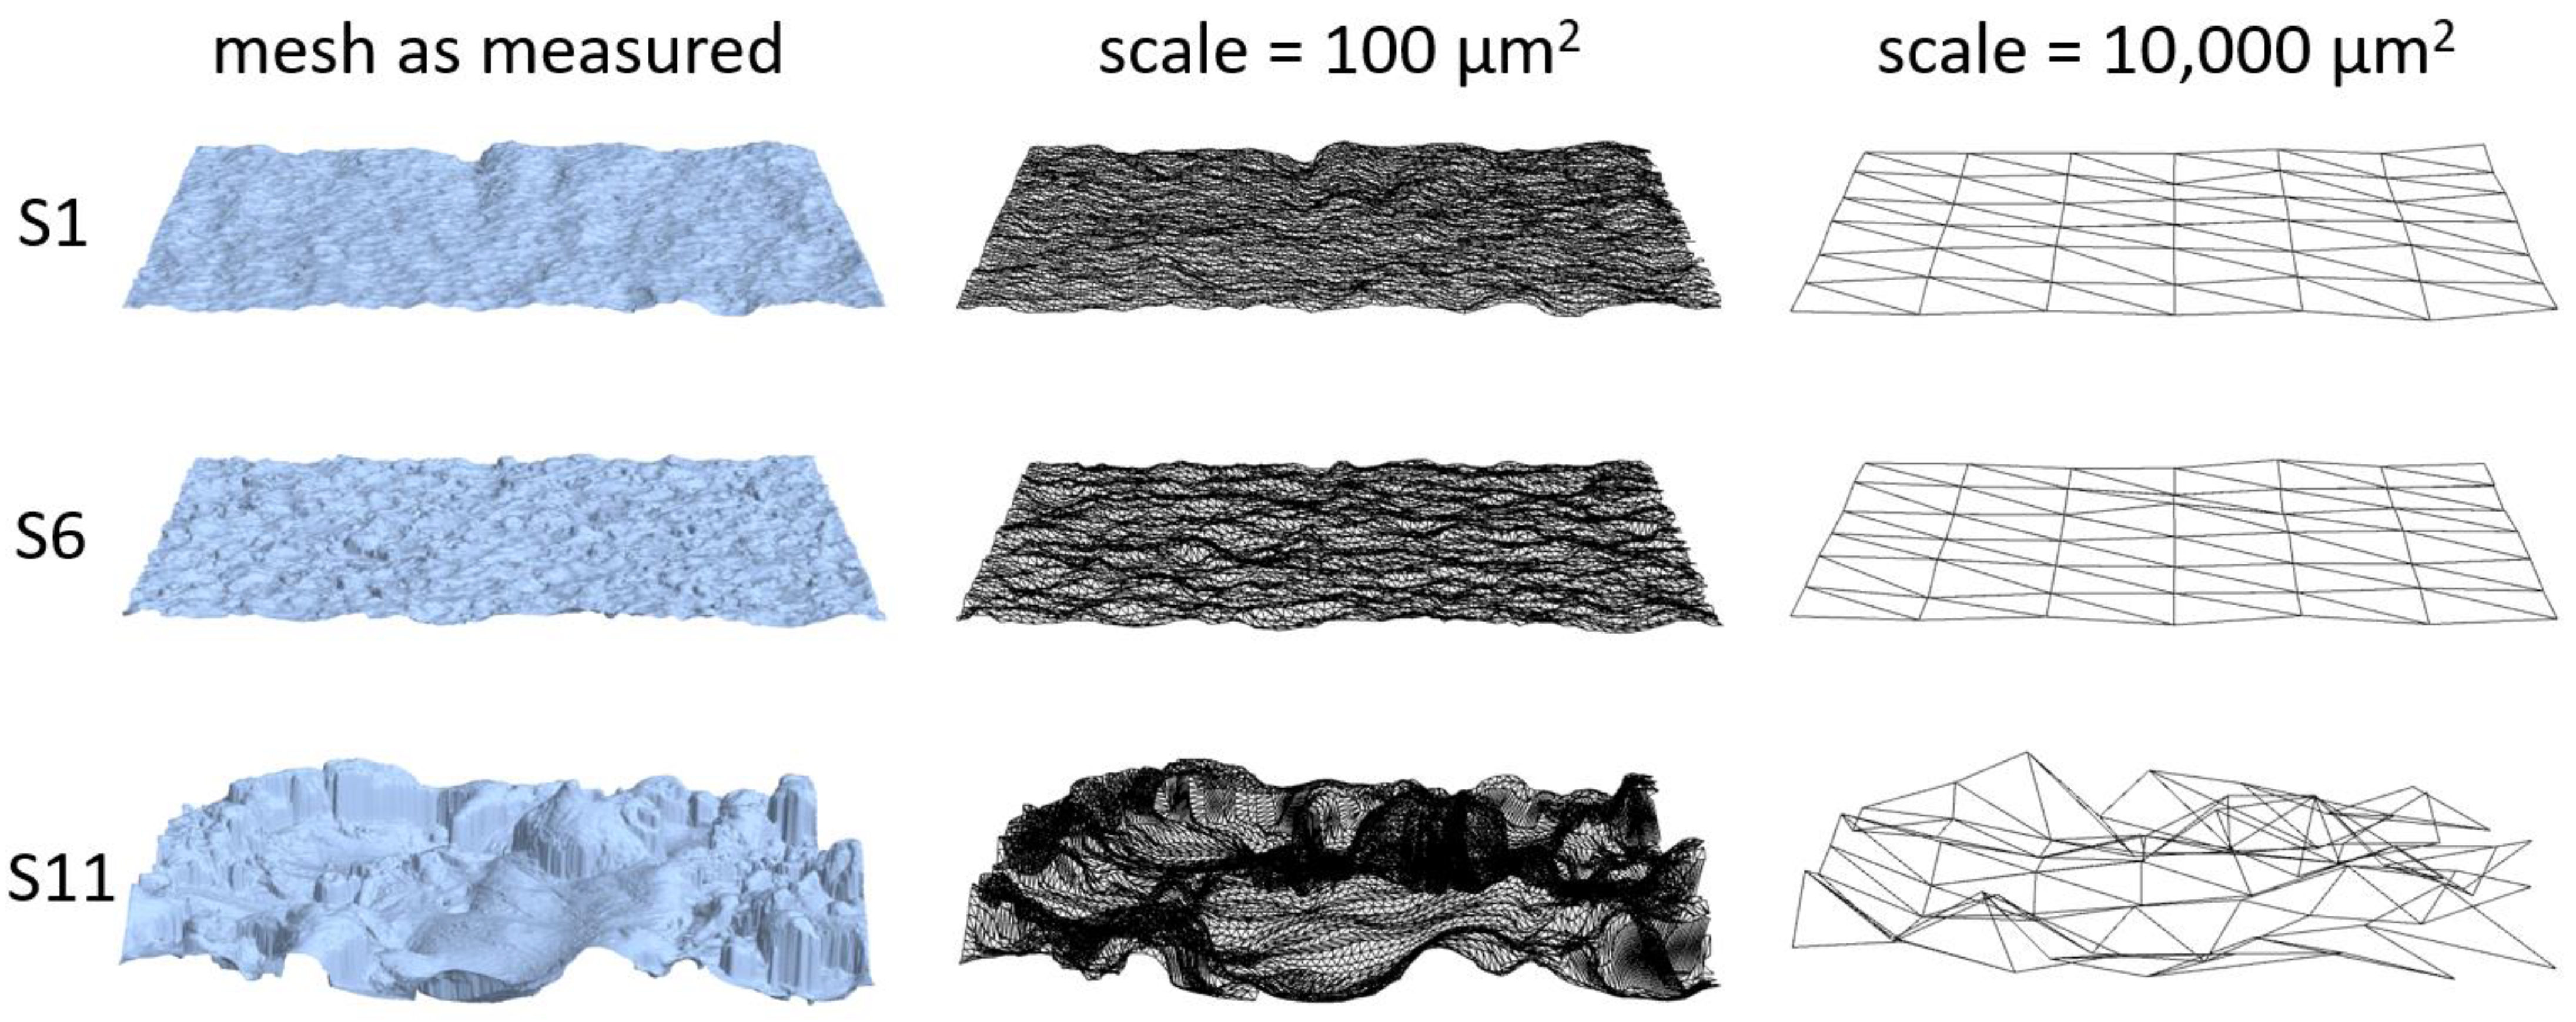
The use of relative areal provides a scale-sensitive characterization parameter, in which both the order of the heights and the spacing of the surface features are employed to quantitatively document the topography. In Figure 4, the effect of scale in the tiling exercise is visualized for fine (100 µm2) and coarse (10,000 µm2) as computed for exemplary surfaces S1, S6, and S11. Topographic features of small size are better “mapped” when fine-scale tiling is considered. At a larger scale, the visual differences between surfaces S1 and S6 are subtle when compared to S11. Large size formations can still be discerned at the coarse-scale for surface machined with the highest discharge energy. The nominal area, which is the projected or x × y area, that is tiled in that particular scale, varies slightly with each tiling exercise because only full tiles are used, all with the same area in a particular tiling exercise. The tiling exercises are never able to cover exactly the same area as the scale changes.
The results of the discrimination analysis for length- and area-scale parameters are presented in Figure 5. It can be seen that the p-value is below 0.05 for all considered parameters and scales, which means that those multiscale characterizations performed well in telling the surfaces apart. The ability to discriminate appears to be somewhat weaker for RelA and Asfc when the largest scales are taken into account. This is might be caused by the fact that the effect of EDM with the lowest energies is marginal to form or waviness which is characterized at coarse scales. The electrode shape was generally flat what is also reflected in the planar form of the manufactured samples.
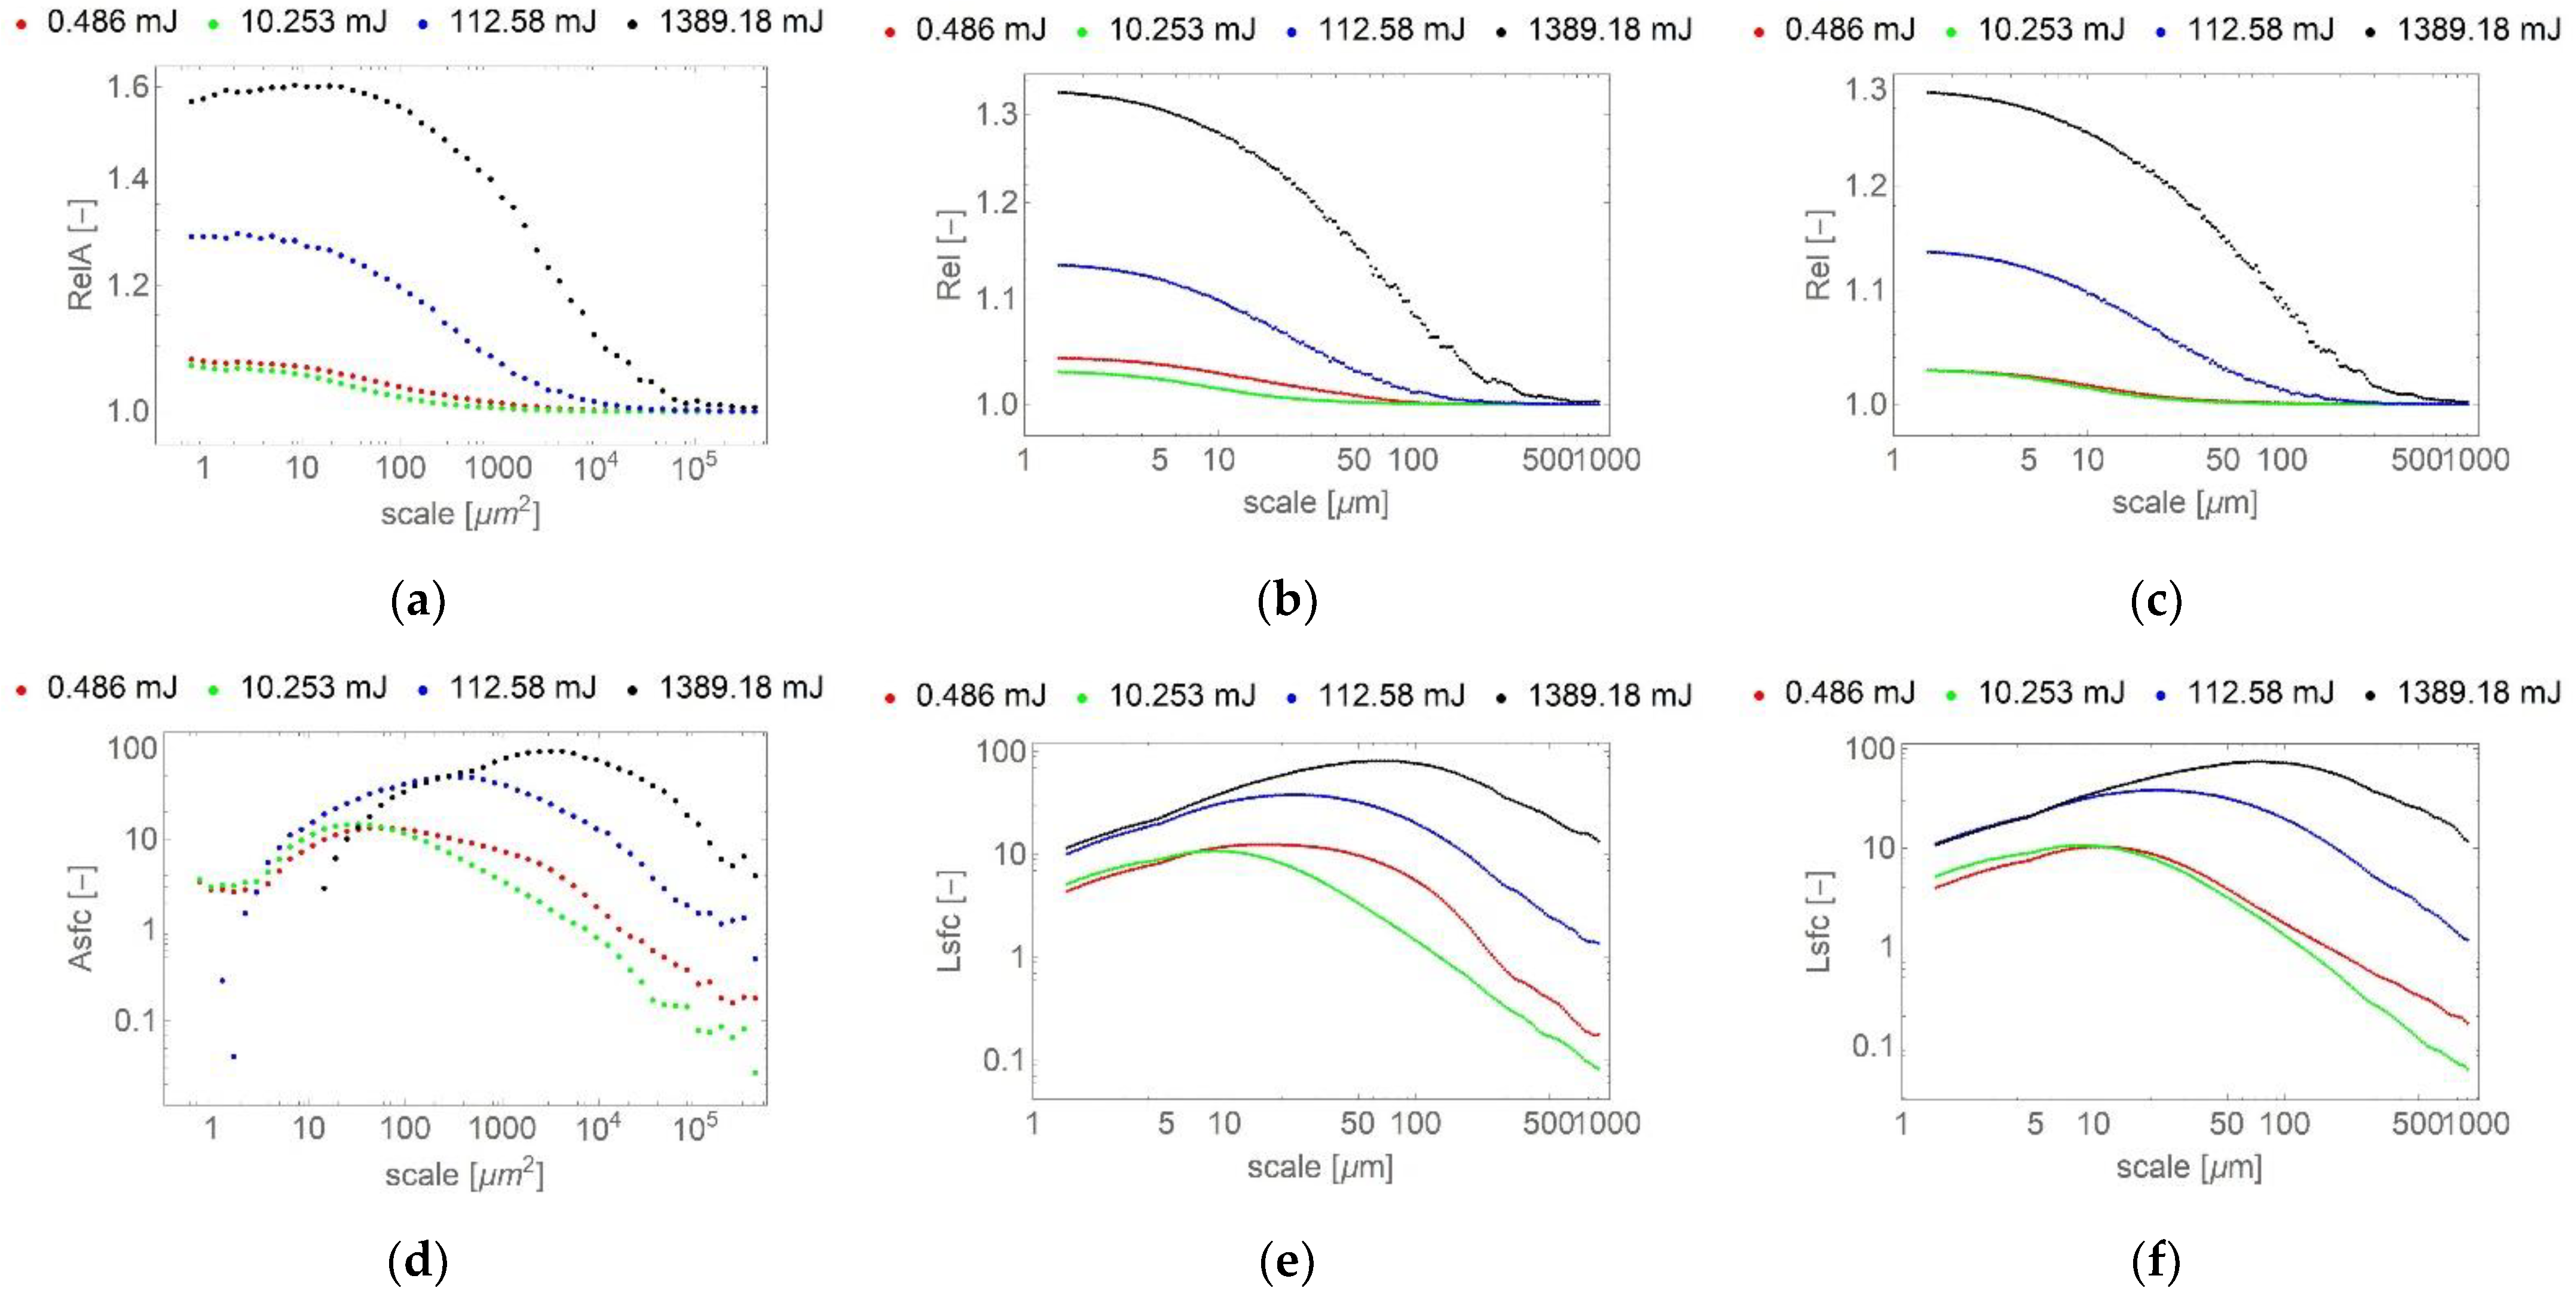
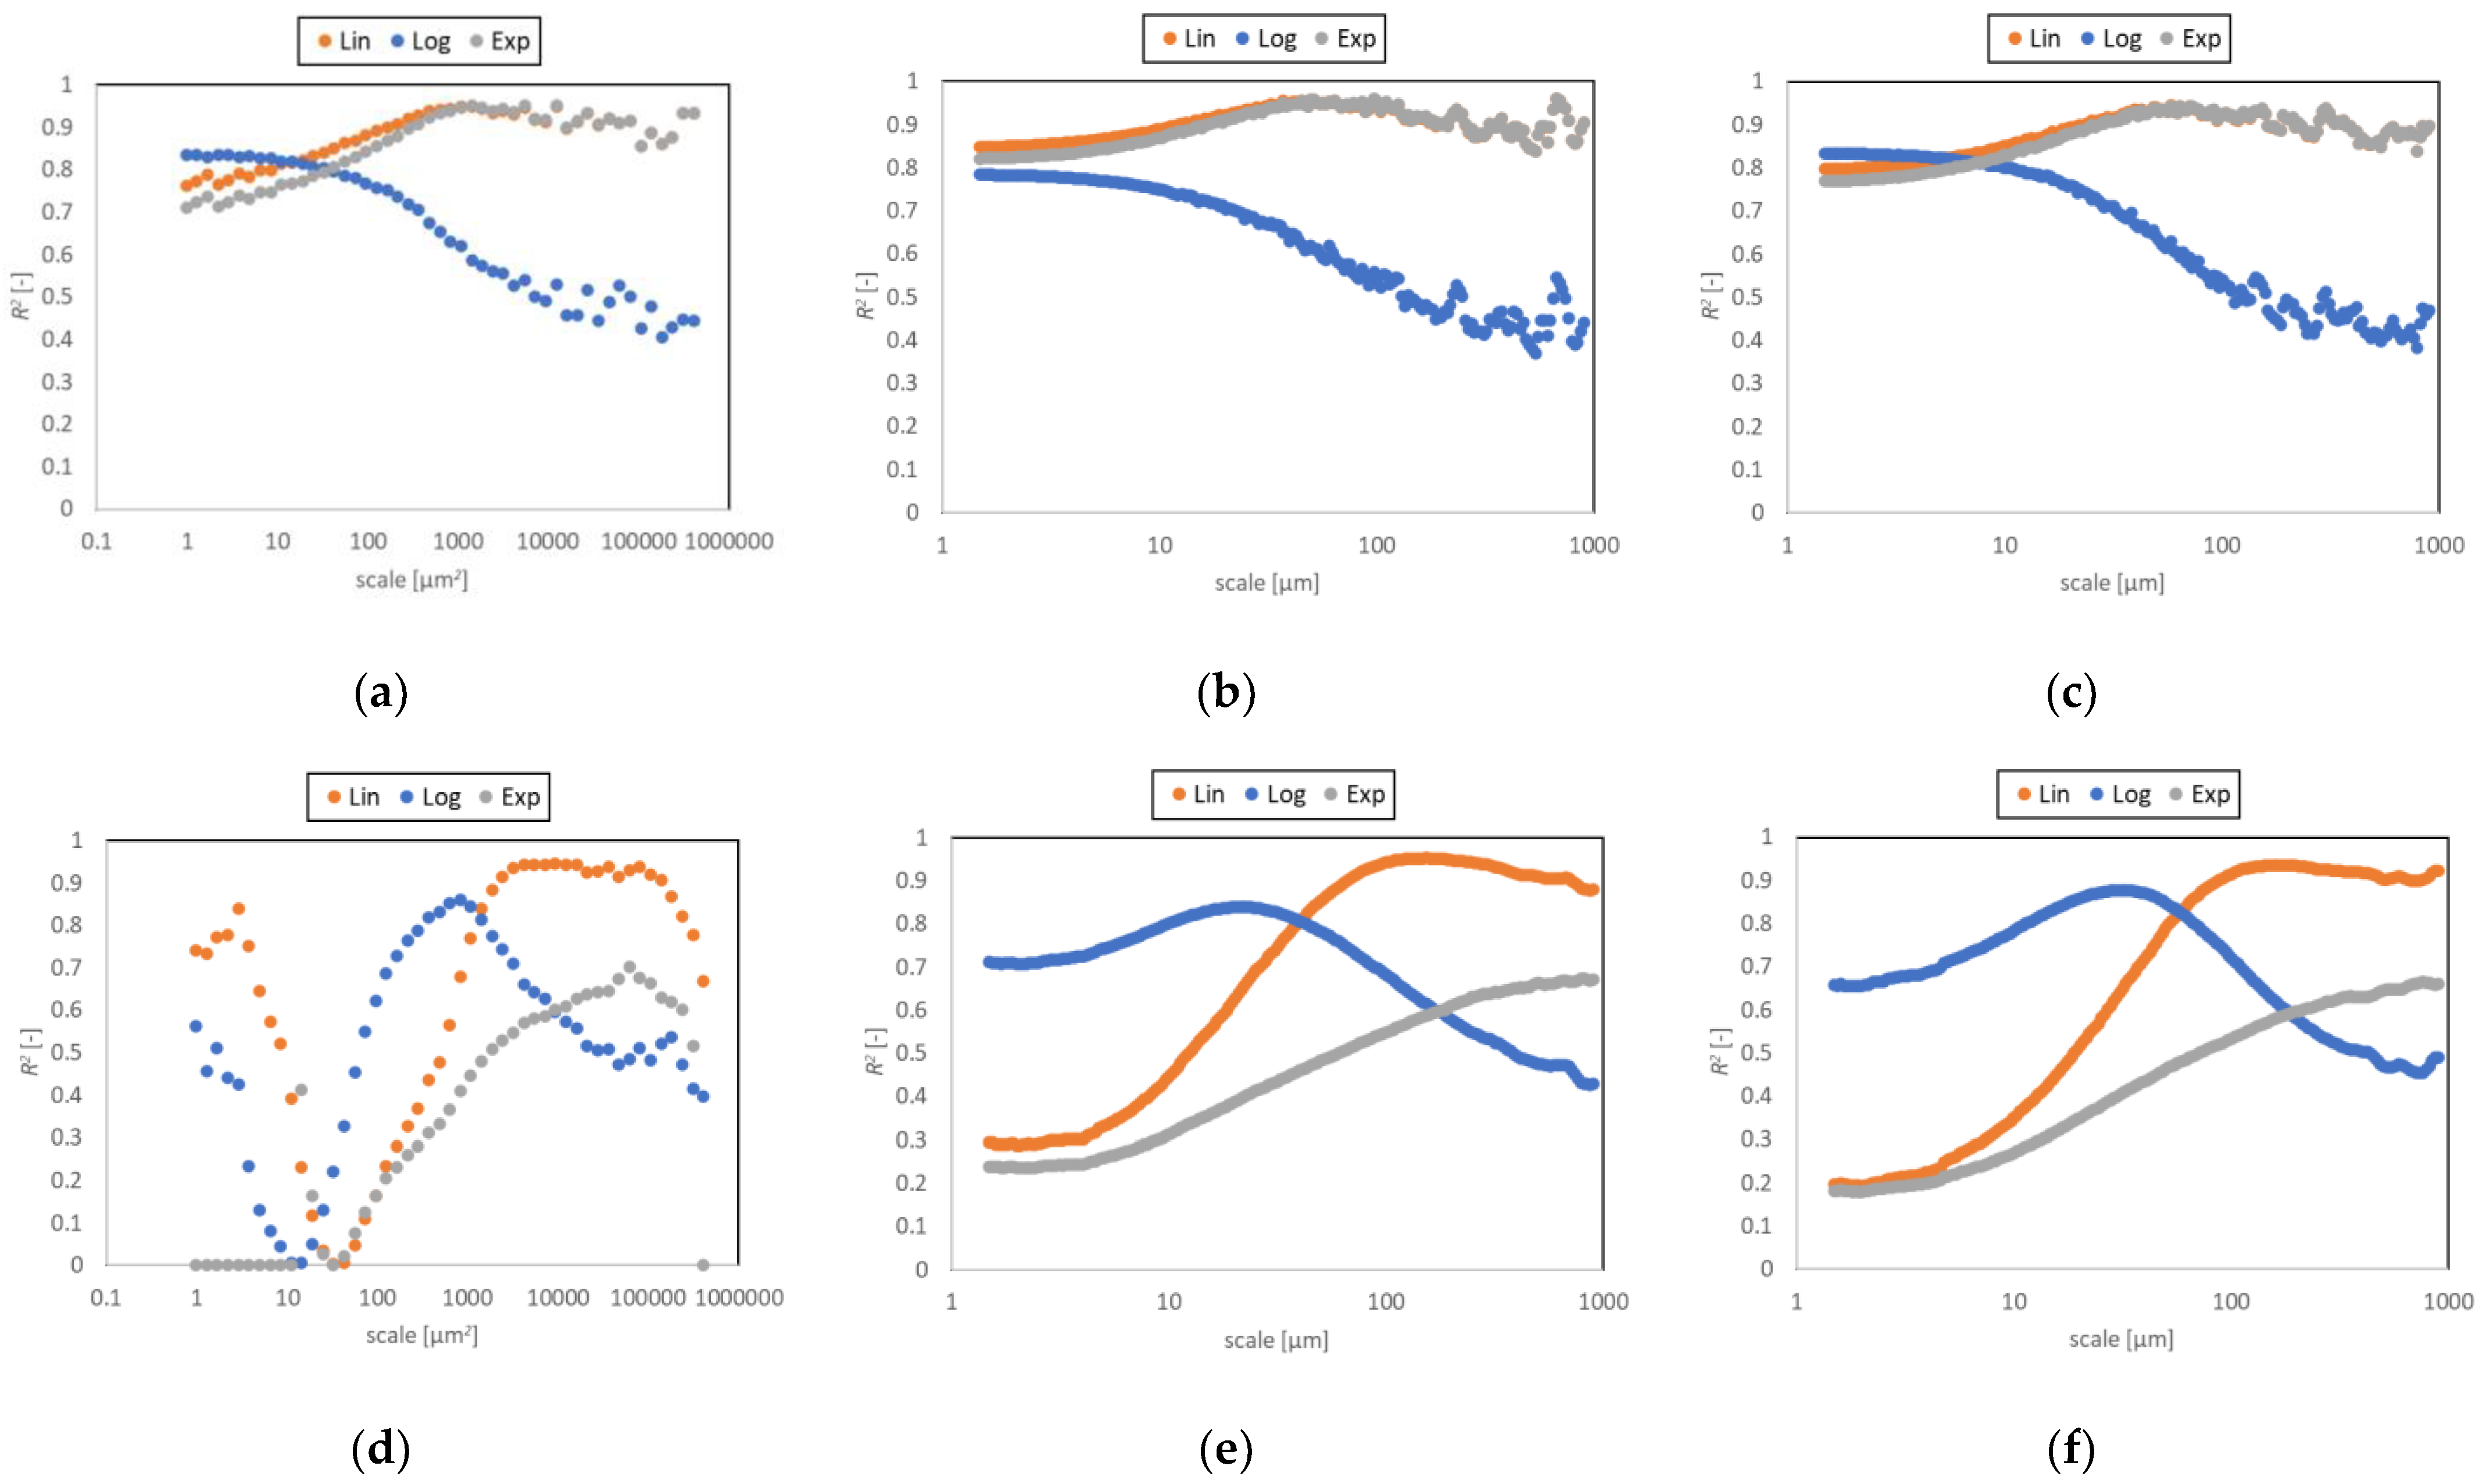
Figure 6a–c shows an area-scale plot of the measured surfaces created with four different discharge energies 0.486, 10.253, 112.58, and 1,389.18 mJ discharge pulses. Relative areas of one indicate that the surfaces are essentially smooth at these scales. The smooth-to-rough crossover (SRC) occurs at some larger scales where the relative areas are greater than one, and the surface is rough at these scales. Depending on the threshold chosen in the relative area the SRC could be between about 1000 and 100,000 μm2. For lower discharge pulse energies, the SRC tends to finer scales. Additionally, the maximum relative areas, which appear at the finest scales in the study, tend to decrease with the lower discharge energies. The differences between length-scale parameters when calculated from profiles extracted in the x- and y-directions are small. This suggests the morphology is most probably isotropic. Similarities in the trends are visually observed for RelA and Asfc when compared to Rel and Lsfc correspondingly. Figure 6d–f shows the mean length- (Lsfc) and area-scale fractal complexity (Asfc) for all the measurements on each surface created with the four aforementioned values of the discharge energy. For lower discharge pulse energies, the fractal complexities tend to be smaller. The maximum Lsfc and Asfc are not present at the finest scales, but rather their maximums, which decline with decreasing the discharge energy, occur at some intermediate scales. These scales of the maximum fractal complexities appear to increase with discharge pulse energy starting from 10 mJ.
Coefficients of determination, R2, for linear, logarithmic, and exponential regressions of length- and area-scale parameters versus discharge energies are plotted as a function of scale and presented in Figure 7. No matter the parameter, the strength of correlations are weaker when the finest scales are considered. The strongest correlations (R2 > 0.9) can be found for linear and exponential regressions considering intermediate and coarse scales for RelA and Rel. Fractal complexity performs well only when linear regression is considered (R2 > 0.9 for Asfc for scales between 2400 µm2 and 138,000 µm2 as well as for Lsfc for scales larger than about 90 µm). While the trends for relative area and length are similar no matter the regression type, the dispersion between Asfc and Lsfc is evident when the evolutions of the coefficient of determinations are analyzed.

3.4. Curvature

The ability to tell surfaces apart changes depending on the curvature parameter and scale. For considered scales, all curvature parameters discriminate the EDMed surfaces at p < 0.05, but with an exception found for κ1q and κ1qabs which both fail for scales finer than 11 µm.
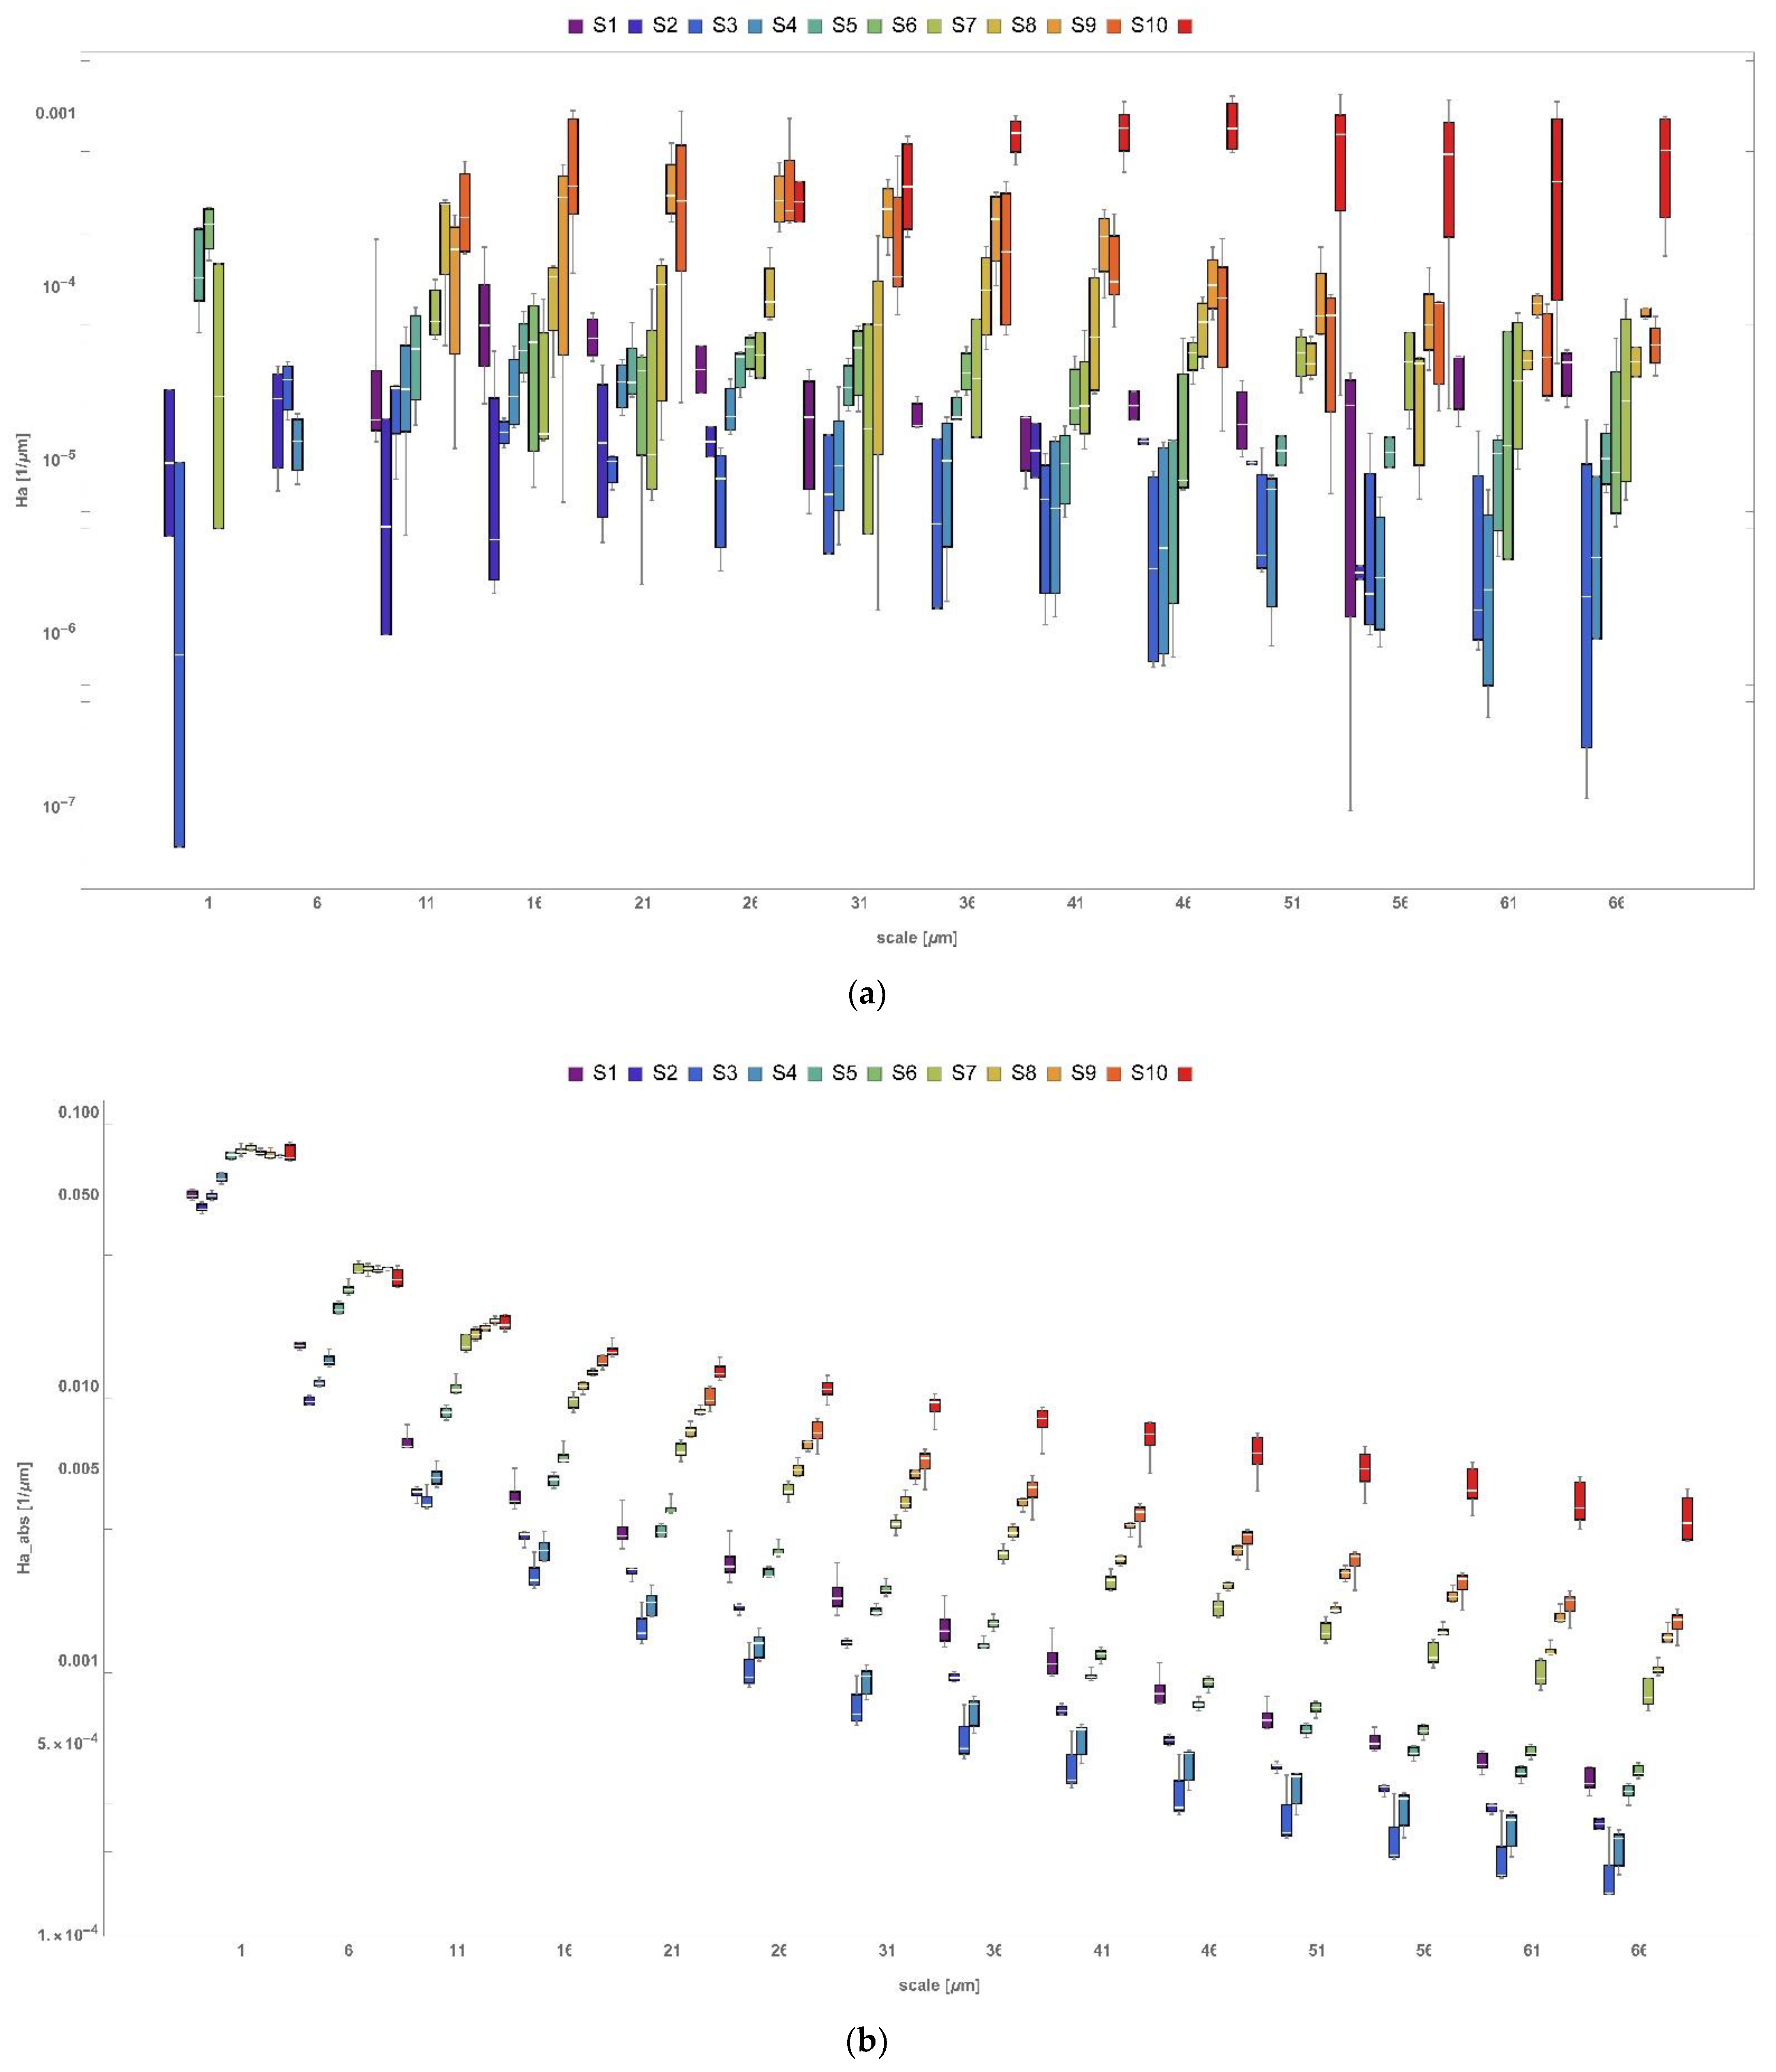
The average and standard deviation of the mean curvature H, as a function of scale, for all analyzed surfaces are shown in Figure 8. Results for other curvature parameters are presented in the Supplementary Materials to this study. Mean curvature describes the average shape of the surface at a given region. Considering Ha (average mean curvature) and each surface separately, no clear tendency can be noticed as the values fluctuate with the scale (Figure 8a). Whereas for standard deviation measure of mean curvature (Hq), the values seem to converge with scale to constant values but at different rates, which might be related to the fact that at the coarsest scale curvature of form is characterized.
Mean curvature can also be associated with average shape (convexity or concavity) at a particular scale. Considering Ha, their values are generally positive which means that surface is generally concave. This is supported by the fact that dominant surface features are craters whose average shape is also concave. Although the craters can also have convex ridges, their negative curvatures are not that significant in the totals. Hq is the measure that characterizes the variation of curvature which declines with the scale. This can be explained by the fact that the magnitudes of the curvatures tend to increase with decreasing scale. At the finest scales, many small features characterized by the high curvature are evident. Similar tendencies were noticed for parameters related to minimum, maximum, and Gaussian curvature.
An evident effect of the discharge energy is manifested through the magnitude of the principal curvatures and their combinations. The average minimum curvature κ2a appeared to be the least influenced by changing the processing parameters because no clear tendency was observed for all considered scales. For the other three average measures: κ1a, Ha, and Ka, such relations can be found starting from the intermediate scales (between 36 and 41 µm). Considering absolute values (regardless of the sign of the curvature) and standard deviations, these measures perform well in finding strong functional relations between the discharge energy and the resulting curvature. This is noticed for scales greater than 31 µm.
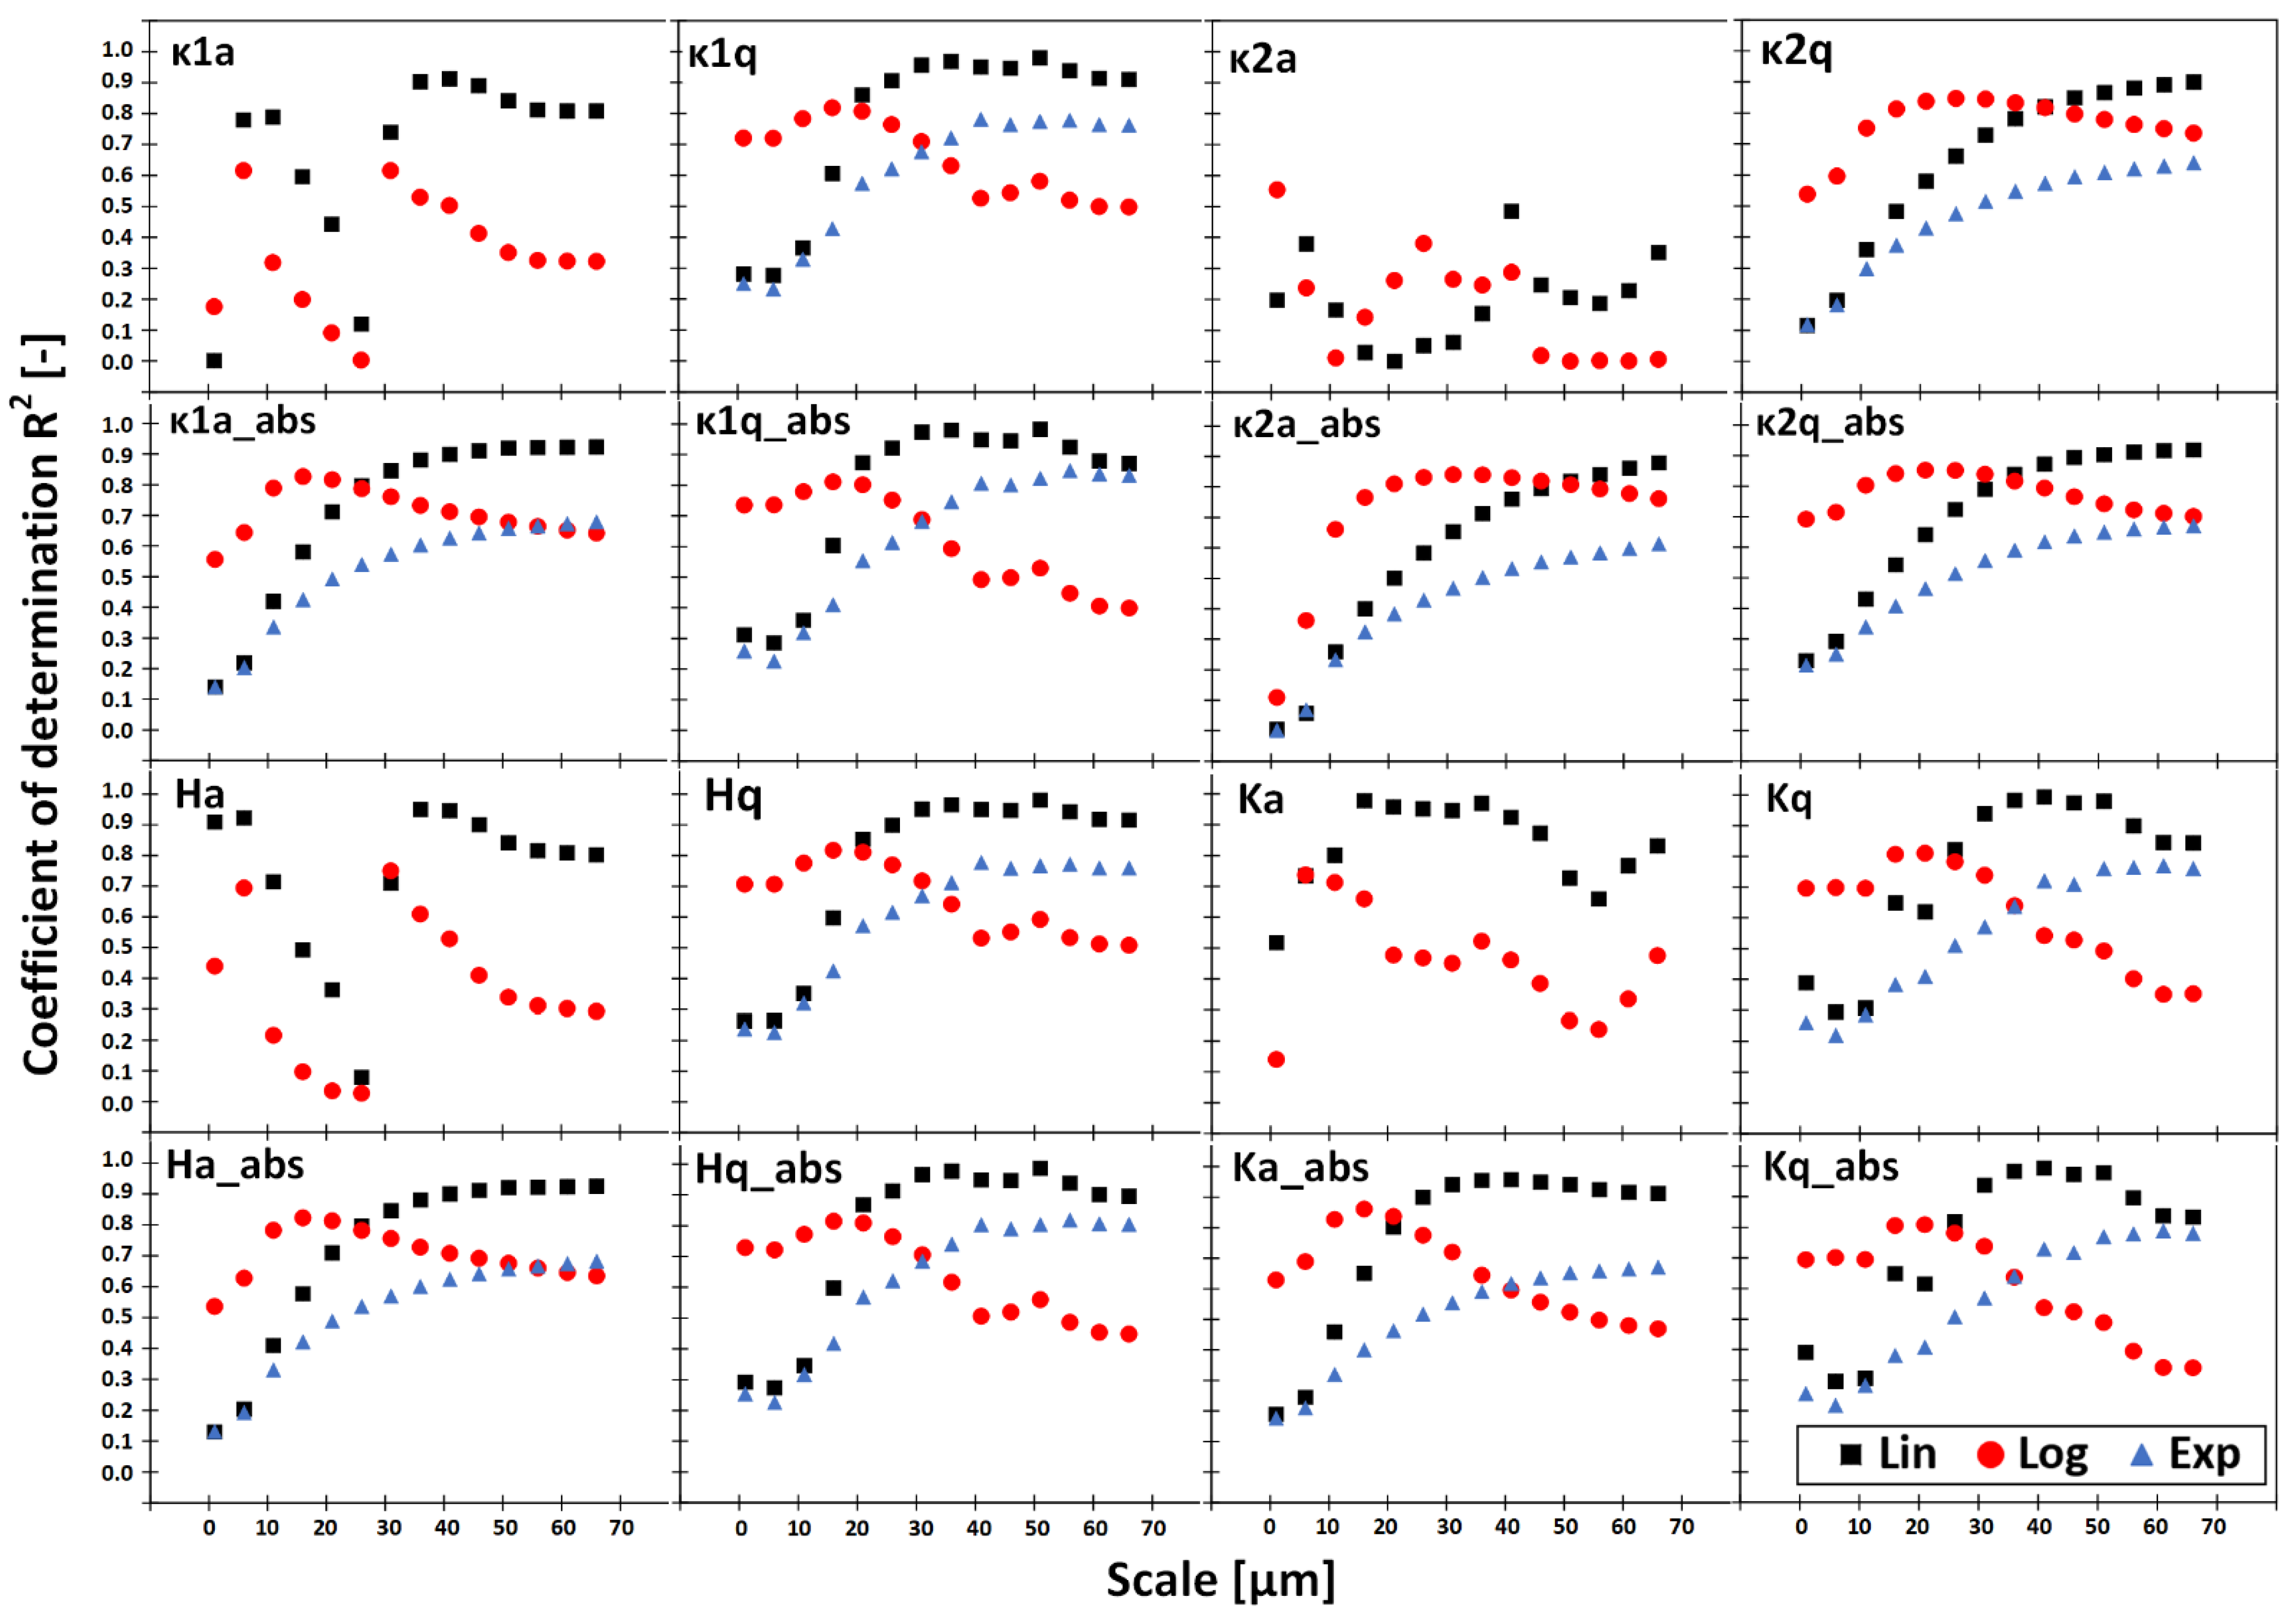
The strengths of the linear, logarithmic, and exponential regression analyses (R2) for the curvatures versus the discharge energies are shown as a function of scale in Figure 9. The strongest correlations were generally found for scales starting from 36 µm for linear trends. The average Gaussian curvature was found to correlate the strongest with the range of scales between 16 µm and 41 µm. Curvature does not correlate well when it is used to describe the surface morphology at the finest scales, although the highest coefficients of determination are noted for logarithmic regression. This tendency was also observed for relative length and area as well as length-scale fractal complexity.
The coefficient of determination evolves with the scale in a similar manner for absolute curvature parameters and standard deviation parameters of signed curvatures (κ1q, κ2q, Hq, and Kq). These parameters describe the variation of curvature which, in the analyzed case, appears to be heavily affected by the discharge energy. The average minimum curvature performs the worst no matter scale and regression type. Unlike length- and area-scale characterizations, all curvature parameters do not perform well when finding strong correlations with processing when exponential regression was used.

4. Discussion

The modeling of electrical discharge machining is based on the selection of technological parameters of the process and the knowledge of the physical and chemical properties of the machined materials. The EDM mechanism leads to the fabrication of topographic features, including the formation of craters, visible in rendered images from a focus variation microscope. The key factor determining the size and the shape of surface topographic features is the electric discharge energy, the increase of which leads to the formation of craters of greater depth, length, area, and curvature.
Surface microgeometry was characterized by using conventional ISO and multiscale quantitative methods. The geometric properties of the surface morphology strongly correlate with the energies of electrical discharges. The multiscale analysis allows for a more detailed understanding of the interaction between surface characteristics and machining process parameters, in particular determining the scales of interactions between fabrication and the resulting texture [29]. In the studied case, the strongest correlations were observed for the scales starting from intermediate values of about 16 µm and 31 µm for curvature parameters and between 12 and 24 µm for relative length. Although length-scale and curvature methods differ totally in terms of how the term “scale” is handled by both methods and how the calculation procedure is performed, the convergence of the results is high. This may suggest that geometric properties of the craters are the best discernible and characterized starting from those scales. Length- and area-scale analysis performed the best at discriminating the surfaces, while curvature failed at the lowest scales (<11 µm) when the standard deviation of both signed and signed maximum curvature was considered. This shows that, generally, surfaces can be told apart when analyzing the entire range of scales from original sampling interval to measured area size, which can be indicative of EDM leaving its manufacturing signature at the entire range of scales. Although strong correlations were found for limited ranges of scales using linear, logarithmic, and exponential regression, this does not mean that other, more complex, functional relations can be confidently established at other scales.
The conventional parameters calculated based on the non-multiscale approach mostly do not correlate strongly with the discharge energy. This might be caused by the fact that they analyze the surface in the nominal scale associated with the original sampling interval in x- and y-direction. Generally, at that finest scale, multiscale parameters also do not correlate strongly with the discharge energy. There are two conventional parameters that correspond to the presented multiscale geometric characterizations when analyzing at the finest scale: Spc (mean peak curvature) and Sdr (surface developed ratio). The first one correlates well when the linear model is considered (R2 = 0.925), although it only characterizes the mean curvature of peaks. The latter which can be associated with RelA also correlates strongly (with discharge energy (R2 = 0.857)) but only when regressed logarithmically. The relative area also shows its best performance at the finest scale using the same regression model. A recent study proved that Sdr was also found to correlate with the discharge energy when non-linear regression was applied [56]. This indicates that conventional characterizations can be useful in describing surface topography of EDMed parts but only when evaluating appropriate aspects of surface morphology or particular features [12,29]. Yet the conventional parameters are most commonly used to characterize surface roughness and topography [41]. This is mainly caused by the fact that that they are included in the widely used commercial software and they can be evaluated with basic knowledge of surface metrology principles. Alternative approaches using multiscale analysis or autocorrelation function are still rare [57,58], because, in principle, they are more complicated and would require more skillful and mindful users. They will be appreciated once they add value by advancing the understanding of the relations between topographies and phenomena or if they can better exploit the acquired topographic information [29,59]. Therefore, the development of ready and free-to-use commercial or academic software fitted with multiscale analysis tools should contribute to the popularization of the presented methods.
The analyzed surfaces do not show significant differences on smaller scales, which might suggest that the mechanism of creating fine-scale topographic features in the EDM process is parallel and comparable regardless of the value of the discharge energy. A similar observation was made in other multiscale studies related to a different material that was processed: tool steel [12] and stainless steel [40].
There does not exist a single universal technological parameter that can fully quantify the relations between the formation process (discharge energy, current, voltage, gap, polarity, pulse duration) and fabricated surfaces, for all materials (electrode and workpiece), part geometries, and other conditions (dielectric fluid and flushing). The main reason for that is the intensity and randomness of electric discharges as well as the physical complexity of the phenomena occurring during the process. This, in turn, makes the development of analytical modeling for EDM a difficult endeavor. This is generally common for any other manufacturing process which involves material removal or addition through energy (electric discharge, electron, or laser beam) [60,61,62]. Therefore, the phenomenological approach which is based on functional correlations can be more convenient, especially from a practical perspective. Geometric characterizations which focus on the morphology of craters (length, area, and curvature) were proved in this study to be successful in establishing strong functional correlations between discharge energy and particular surface parameter when analyzing at the appropriate scales.
Some implicit relations between VDI roughness and parameters of discharge are incorporated in the control systems of machine tools, as presented in this study. That standard, however, was developed more than 50 years and, obviously, does not involve modern measurement and characterization techniques currently applied in surface metrology but focuses on simple average roughness parameters. The directions of further research should be the development of a universal function describing the relationship between the parameters of the EDM process and the features of the textured surface for a broad range of processed material. Hereby, the presented work confirms that the similar relations between discharge energy and surface microgeometry can be found not only for steel [12,15,40] but also for aluminum alloys. EDM machine tool control systems operate on certain dependencies between roughness and the parameters of electrical discharge pulses. However, they do not capture the existing functional dependencies in a broader sense, as they focus on simple average roughness regardless of scale. Morphological analysis of surface craters is the starting point for reliable studies, due to their relationship to the nature of EDM processes. The relationship between machining parameters and surface topography is also of greater importance and influences other functional characteristics of the material, including tribological wear, lubrication properties, and corrosion resistance.

5. Conclusions

The research results presented in this study show that the surface topography obtained by EDM is strongly dependent on the electric discharge energy while processing. This statement is confirmed by obtaining strong correlations between the energy and the microgeometric parameters of the surface, mainly their curvature as well as length- and area-scale parameters. In addition, research conducted on many scales of observation provides an in-depth understanding of the phenomena contributing to the formed surface topography. Similarities of the results produced by length-scale and curvature methods were noted. In addition, the detailed conclusions can be formulated as follows:
  • Strong correlations (R2 > 0.9) were found between the electrical discharge energy values and the topographic parameters of the surface:
    Rel, Lsfc for scales >90 µm, RelA, Asfc for scales ranging between 2400 and 138,000 µm
    Curvature statistical measures (apart from κ2a) starting from scales between 36 a 41 µm.
  • The highest coefficients of determination were noted generally for the coarse scales of observation in which geometrical properties of large size morphological features are best characterized. The strongest coefficients of determination R2 > 0.9 were noted for linear (0.993 for Ka at scale = 41 µm, 0.951 for Rel at scale = 111.38 µm) and exponential regressions (0.957 for Rel at scale 51.49 µm);
  • Length- and area-scale analyses performed the best at discriminating the surfaces. A similar observation was made for curvature, apart from standard deviations of both signed and signed maximum curvature was considered, which failed at finest scales (<11 µm);
  • The convergence of the results obtained by the considered multiscale methods is high for intermediate scales although the definition of scale differs depending on the method;
  • Apart from average mean curvature (Ha), characterizations of fine-scale features do not correlate strongly with the energy of electrical discharges using the proposed linear, logarithmic, and exponential models (as R2 < 0.9), although surfaces can be confidently discriminated at those corresponding scales. A more complex statistical model should be considered in those cases;
  • Conventional surface characterization parameters generally do not correlate well with the discharge weakly. Some exceptions were found for Sv, Spc, Shv, and Spar for which R2 was found to be greater than 0.9;
  • The effect of the discharge energy is shown in the magnitude of the surface principal curvatures and their combinations. This relationship is evident mainly for the three mean measures: κ1a, Ha, and Ka and occurs starting from the intermediate scales (between 36 and 41 µm).

Supplementary Materials

The following are available online at https://www.mdpi.com/article/10.3390/cryst11111371/s1. The supplementary materials contain the calculation of conventional areal parameters used in this study as well as the evolution of all analyzed curvature parameters as a function of scale. The data are presented in the form of box-and-whisker plots.

Author Contributions

Conceptualization, T.B. and K.P.; methodology, T.B.; software, T.B. and M.M.; validation, T.B. and K.P.; formal analysis, T.B., K.P. and M.M.; investigation, T.B, K.P. and M.M.; resources, K.P. and M.M; data curation, T.B.; writing—original draft preparation, T.B. and K.P.; writing—review and editing, T.B. and K.P.; visualization, T.B. and K.P.; supervision, T.B.; project administration, K.P.; funding acquisition, T.B. All authors have read and agreed to the published version of the manuscript.

Funding

This research was funded by the Polish Ministry of Science and Education as a part of a research subsidy, project number: 0614/SBAD/1547.

Conflicts of Interest

The authors declare no conflict of interest.

Appendix A

Table A1. Abbreviations of surface characterization parameters and their full meanings.
AbbrevationFull Name
SqRoot-mean-square height
SskSkewness
SkuKurtosis
SpMaximum peak height
SvMaximum pit height
SzMaximum height
SaArithmetic mean height
SmrAreal material ratio
SmcInverse areal material ratio
SxpExtreme peak height
SalAutocorrelation length
StrTexture-aspect ratio
StdTexture direction
SdqRoot-mean-square gradient
SdrDeveloped interfacial area ratio
VmMaterial volume
VvVoid volume
VmpPeak material volume
VmcCore material volume
VvcCore void volume
VvvPit void volume
SpdDensity of peaks
SpcArithmetic mean peak curvature
S10zTen point height
S5pFive point peak height
S5vFive point pit height
SdaMean dale area
ShaMean hill area
SdvMean dale volume
ShvMean hill volume
SbiSurface bearing index
SciCore fluid retention index
SviValley fluid retention index
SmeanMean height in absolute
SdarDeveloped area
SparProjected area
RelRelative length
RelARelative area
LsfcLength-scale fractal complexity
AsfcArea-scale fractal complexity
κ1aAverage maximum curvature
κ1qStandard deviation of maximum curvature
κ2aAverage minimum curvature
κ2qStandard deviation of minimum curvature
HaAverage mean curvature
HqStandard deviation of mean curvature
KaAverage Gaussian curvature
KqStandard deviation of Gaussian curvature
κ1aabsAverage absolute maximum curvature
κ1qabsStandard deviation of absolute maximum curvature
κ2aabsAverage absolute minimum curvature
κ2qabsStandard deviation of absolute minimum curvature
HaabsAverage absolute mean curvature
HqabsStandard deviation of absolute mean curvature
KaabsAverage absolute Gaussian curvature
KqabsStandard deviation of absolute Gaussian curvature
Table A2. Coefficient of determination R2 calculated for linear, logarithmic and exponential regression between areal characterization parameters and the discharge energy.
ParameterR2 Linear RegressionR2 Logarithmic RegressionR2 Exponential Regression
Sq0.8330.7760.577
Ssk0.2380.593N/A
Sku0.0000.0100.001
Sp0.7320.8260.500
Sv0.9000.6550.718
Sz0.8270.7730.599
Sa0.8260.7790.568
Smr (c = 1 µm under the highest peak)0.3920.3550.755
Smc (p = 10%)0.8380.7840.573
Sxp (p = 50%, q = 97.5%)0.8570.6980.620
Sal (s = 0.2)0.7000.7330.629
Str (s = 0.2)0.0600.3360.046
Std (Reference angle = 0°)0.0060.0460.006
Sdq0.7940.8420.558
Sdr0.7320.8570.461
Vm (p = 10%)0.8010.8080.532
Vv (p = 10%)0.8360.7850.571
Vmp (p = 10%)0.8010.8080.532
Vmc (p = 10%, q = 80%)0.8020.7840.548
Vvc (p = 10%, q = 80%)0.8300.7930.563
Vvv (p = 80%)0.8890.6230.676
Spd (pruning = 2.5%)0.3200.3930.572
Spc (pruning = 2.5%)0.9250.5920.869
S10z (pruning = 2.5%)0.8090.7760.585
S5p (pruning = 2.5%)0.7320.8200.494
S5v (pruning = 2.5%)0.8830.6480.727
Sda (pruning = 2.5%)0.8740.7310.638
Sha (pruning = 2.5%)0.7790.6980.534
Sdv (pruning = 2.5%)0.8990.7750.508
Shv (pruning = 2.5%)0.9470.6230.594
Sbi0.1960.0040.165
Sci0.3940.7230.374
Svi0.1180.4970.113
Smean0.7800.429N/A
Sdar0.7380.8550.693
Spar0.9090.2620.826

References

  1. Marashi, H.; Sarhan, A.; Maher, I.; Sayuti, M. 1.7 Techniques to Improve EDM Capabilities: A Review. Compr. Mater. Finish. 2017, 1–3, 171–202. [Google Scholar] [CrossRef]
  2. Lauwers, B.; Vleugels, J.; Malek, O.; Brans, K.; Liu, K. Electrical discharge machining of composites. Mach. Technol. Compos. Mater. 2012, 202–241. [Google Scholar] [CrossRef]
  3. Slătineanu, L.; Dodun, O.; Coteaţă, M.; Nagîţ, G.; Băncescu, I.; Hriţuc, A. Wire Electrical Discharge Machining—A Review. Machines 2020, 8, 69. [Google Scholar] [CrossRef]
  4. Panda, R.C.; Sharada, A.; Samanta, L.D. A review on electrical discharge machining and its characterization. Mater. Today Proc. 2021. [Google Scholar] [CrossRef]
  5. Ho, K.; Newman, S. State of the art electrical discharge machining (EDM). Int. J. Mach. Tools Manuf. 2003, 43, 1287–1300. [Google Scholar] [CrossRef]
  6. Calvo, R.; Daniel, M. Wire electrical discharge machining (EDM) setup parameters influence in functional surface roughness. Procedia Manuf. 2019, 41, 602–609. [Google Scholar] [CrossRef]
  7. Braatz, R.; Alkire, R.; Seebauer, E.; Rusli, E.; Gunawan, R.; Drews, T.; Li, X.; He, Y. Perspectives on the design and control of multiscale systems. J. Process. Control. 2006, 16, 193–204. [Google Scholar] [CrossRef]
  8. Meshram, D.B.; Puri, Y.M. Effective parametric analysis of machining curvature channel using semicircular curved copper electrode and OHNS steel workpiece through a novel curved EDM process. Eng. Res. Express 2019, 1, 015014. [Google Scholar] [CrossRef]
  9. Dhadda, G.; Hamed, M.; Koshy, P. Electrical discharge surface texturing for enhanced pool boiling heat transfer. J. Mater. Process. Technol. 2021, 293, 117083. [Google Scholar] [CrossRef]
  10. Gostimirovic, M.; Kovac, P.; Sekulic, M.; Skoric, B. Influence of discharge energy on machining characteristics in EDM. J. Mech. Sci. Technol. 2012, 26, 173–179. [Google Scholar] [CrossRef]
  11. Liu, Q.; Zhang, Q.; Zhang, M.; Yang, F. Study on the Time-Varying Characteristics of Discharge Plasma in Micro-Electrical Discharge Machining. Coatings 2019, 9, 718. [Google Scholar] [CrossRef] [Green Version]
  12. Bartkowiak, T.; Mendak, M.; Mrozek, K.; Wieczorowski, M. Analysis of Surface Microgeometry Created by Electric Discharge Machining. Materials 2020, 13, 3830. [Google Scholar] [CrossRef] [PubMed]
  13. Klocke, F.; Lung, D.; Antonoglou, G.; Thomaidis, D. The effects of powder suspended dielectrics on the thermal influenced zone by electrodischarge machining with small discharge energies. J. Mater. Process. Technol. 2004, 149, 191–197. [Google Scholar] [CrossRef]
  14. Wang, H.J.; Zuo, D.W.; Wu, X.; Wang, M. Relationship between the Fine Discharge Parameters and Craters EDMed of the NAK80 Steel. Key Eng. Mater. 2010, 426–427, 85–88. [Google Scholar] [CrossRef]
  15. Bartkowiak, T.; Brown, C.A. A Characterization of Process–Surface Texture Interactions in Micro-Electrical Discharge Machining Using Multiscale Curvature Tensor Analysis. J. Manuf. Sci. Eng. 2018, 140, 021013. [Google Scholar] [CrossRef]
  16. Lertphokanont, V.; Sato, T.; Ota, M.; Yamaguchi, K.; Egashira, K. Micro-Structuring on Cylindrical Inner Surface Using Whirling Electrical Discharge Texturing. Adv. Mater. Res. 2012, 565, 430–435. [Google Scholar] [CrossRef] [Green Version]
  17. Shao, B.; Rajurkar, K.P. Modelling of the Crater Formation in Micro-EDM. Procedia CIRP 2015, 33, 376–381. [Google Scholar] [CrossRef] [Green Version]
  18. Han, F.; Jiang, J.; Yu, D. Influence of discharge current on machined surfaces by thermo-analysis in finish cut of WEDM. Int. J. Mach. Tools Manuf. 2007, 47, 1187–1196. [Google Scholar] [CrossRef]
  19. Kurnia, W.; Tan, P.C.; Yeo, S.H.; Tan, Q.P. Surface roughness model for micro electrical discharge machining. Proc. Inst. Mech. Eng. Part B: J. Eng. Manuf. 2009, 223, 279–287. [Google Scholar] [CrossRef]
  20. Jithin, S. Modelling and Analysis of Surface Topographies Generated Using Electrical Discharge Texturing. Ph.D. Thesis, Indian Institute of Technology Bombay, Mumbai, India, 2020. [Google Scholar]
  21. Dmowska, A.; Nowicki, B.; Podolak-Lejtas, A. Surface Layer Properties after Successive EDM or EDA and Then Superficial Roto-Peen Machining. Adv. Tribol. 2012, 2012, 1–12. [Google Scholar] [CrossRef] [Green Version]
  22. Kumar, S.S.; Varol, T.; Canakci, A.; Kumaran, S.T.; Uthayakumar, M. A review on the performance of the materials by surface modification through EDM. Int. J. Light. Mater. Manuf. 2021, 4, 127–144. [Google Scholar] [CrossRef]
  23. Prathipati, R.; Dora, S.P.; Chanamala, R. Wear behavior of wire electric discharge machined surface of 316L stainless steel. SN Appl. Sci. 2020, 2, 412. [Google Scholar] [CrossRef] [Green Version]
  24. Peta, K.; Bartkowiak, T.; Galek, P.; Mendak, M. Contact angle analysis of surface topographies created by electric discharge machining. Tribol. Int. 2021, 163, 107139. [Google Scholar] [CrossRef]
  25. Khan, A.A.; Al Hazza, M.H.; Daud, M.R.H.C.; Kamal, N.S.B.M. Optimization of Surface Quality of Mild Steel Machined by Wire EDM Using Simulated Annealing Algorithm. In Proceedings of the 2015 4th International Conference on Advanced Computer Science Applications and Technologies (ACSAT), Kuala Lumpur, Malaysia, 8–10 December 2015; 2015; pp. 3–8. [Google Scholar] [CrossRef]
  26. Antar, M.; Hayward, P.; Dunleavey, J.; Butler-Smith, P. Surface Integrity Evaluation of Modified EDM Surface Structure. Procedia CIRP 2018, 68, 308–312. [Google Scholar] [CrossRef]
  27. Shen, D.; Ming, W.; Ren, X.; Xie, Z.; Liu, X. Progress in Non-Traditional Processing for Fabricating Superhydrophobic Surfaces. Micromachines 2021, 12, 1003. [Google Scholar] [CrossRef]
  28. Pagani, L.; Qi, Q.; Jiang, X.; Scott, P. Towards a new definition of areal surface texture parameters on freeform surface. Measurement 2017, 109, 281–291. [Google Scholar] [CrossRef]
  29. Brown, C.A.; Hansen, H.N.; Jiang, X.J.; Blateyron, F.; Berglund, J.; Senin, N.; Bartkowiak, T.; Dixon, B.; Le Goïc, G.; Quinsat, Y.; et al. Multiscale analyses and characterizations of surface topographies. CIRP Ann. 2018, 67, 839–862. [Google Scholar] [CrossRef]
  30. Bartkowiak, T.; Brown, C.A. Multiscale 3D Curvature Analysis of Processed Surface Textures of Aluminum Alloy 6061 T6. Materials 2019, 12, 257. [Google Scholar] [CrossRef] [PubMed] [Green Version]
  31. De Boer, G.N.; Gao, L.; Hewson, R.W.; Thompson, H.M.; Raske, N.; Toropov, V.V. A multiscale method for optimising surface topography in elastohydrodynamic lubrication (EHL) using metamodels. Struct. Multidiscip. Optim. 2016, 54, 483–497. [Google Scholar] [CrossRef] [Green Version]
  32. Barré, F.; Lopez, J. Watershed lines and catchment basins: A new 3D-motif method. Int. J. Mach. Tools Manuf. 2000, 40, 1171–1184. [Google Scholar] [CrossRef]
  33. Guibert, R.; Hanafi, S.; Deltombe, R.; Bigerelle, M.; A Brown, C. Comparison of three multiscale methods for topographic analyses. Surf. Topogr. Metrol. Prop. 2020, 8, 024002. [Google Scholar] [CrossRef]
  34. Le Goïc, G.; Bigerelle, M.; Samper, S.; Favrelière, H.; Pillet, M. Multiscale roughness analysis of engineering surfaces: A comparison of methods for the investigation of functional correlations. Mech. Syst. Signal Process. 2016, 66–67, 437–457. [Google Scholar] [CrossRef]
  35. Bigerelle, M.; Guillemot, G.; Khawaja, Z.; El Mansori, M.; Antoni, J. Relevance of Wavelet Shape Selection in a complex signal. Mech. Syst. Signal Process. 2013, 41, 14–33. [Google Scholar] [CrossRef]
  36. Bigerelle, M.; Iost, A. A new method to calculate the fractal dimension of surfaces: Application to human cell proliferation. Comput. Math. Appl. 2001, 42, 241–253. [Google Scholar] [CrossRef] [Green Version]
  37. Brown, C.; Charles, P.; Johnsen, W.; Chesters, S. Fractal analysis of topographic data by the patchwork method. Wear 1993, 161, 61–67. [Google Scholar] [CrossRef]
  38. Wolf, G.W. Scale independent surface characterisation: Geography meets precision surface metrology. Precis. Eng. 2017, 49, 456–480. [Google Scholar] [CrossRef]
  39. Klink, A.; Holsten, M.; Hensgen, L. Crater morphology evaluation of contemporary advanced EDM generator technology. CIRP Ann. 2017, 66, 197–200. [Google Scholar] [CrossRef]
  40. Hyde, J.M.; Cadet, L.; Montgomery, J.; Brown, C.A. Multi-scale areal topographic analysis of surfaces created by micro-EDM and functional correlations with discharge energy. Surf. Topogr. Metrol. Prop. 2014, 2, 2. [Google Scholar] [CrossRef]
  41. Jithin, S.; Joshi, S.S. Surface topography generation and simulation in electrical discharge texturing: A review. J. Mater. Process. Technol. 2021, 298, 117297. [Google Scholar] [CrossRef]
  42. Helmli, F. Focus Variation Instruments. In Optical Measurement of Surface Topography; Springer Science and Business Media LLC: Berlin, Germany, 2011; pp. 131–166. [Google Scholar]
  43. Lou, S.; Jiang, X.; Sun, W.; Zeng, W.; Pagani, L.; Scott, P. Characterisation methods for powder bed fusion processed surface topography. Precis. Eng. 2019, 57, 1–15. [Google Scholar] [CrossRef]
  44. Senin, N.; Thompson, A.; Leach, R. Characterisation of the topography of metal additive surface features with different measurement technologies. Meas. Sci. Technol. 2017, 28, 095003. [Google Scholar] [CrossRef]
  45. Podulka, P.; Pawlus, P.; Dobrzański, P.; Lenart, A. Spikes removal in surface measurement. J. Physics: Conf. Ser. 2014, 483, 012025. [Google Scholar] [CrossRef] [Green Version]
  46. Pawlus, P.; Reizer, R.; Wieczorowski, M. Problem of Non-Measured Points in Surface Texture Measurements. Metrol. Meas. Syst. 2017, 24, 525–536. [Google Scholar] [CrossRef]
  47. Pawlus, P.; Reizer, R.; Wieczorowski, M. Comparison of results of surface texture measurement obtained with stylus methods and optical methods. Metrol. Measurement Syst. 2018, 25, 589–602. [Google Scholar]
  48. De Groot, P.J. The Meaning and Measure of Vertical Resolution in Optical Surface Topography Measurement. Appl. Sci. 2017, 7, 54. [Google Scholar] [CrossRef]
  49. Zuo, X.; Peng, M.; Zhou, Y. Influence of noise on the fractal dimension of measured surface topography. Measurement 2020, 152, 107311. [Google Scholar] [CrossRef]
  50. Advanced Techniques for Assessment Surface Topography. Adv. Tech. Assess. Surf. Topogr. 2003, 1–355. [CrossRef]
  51. Townsend, A.; Senin, N.; Blunt, L.; Leach, R.; Taylor, J. Surface texture metrology for metal additive manufacturing: A review. Precis. Eng. 2016, 46, 34–47. [Google Scholar] [CrossRef] [Green Version]
  52. ASME B46. 1-2009 - Surface Texture (Surface Roughness, Waviness and Lay); ASME Int.: New York, NY, USA, 2010. [Google Scholar]
  53. Dansk Standard DS/EN ISO 25178-Geometrical Product Specification (GPS)—Surface Texture: Areal - Part 2: Terms, Definitions and Surface Texture Parameters. ISO 25178-Geometrical Product Specification (GPS)---Surface Texture: Areal—Part 2: Terms, Definitions and Surface Texture Parameters; ISO Standard: Geneva, Switzerland, 2012.
  54. Leach, R. Characterisation of Areal Surface Texture; Springer Sience & Business Media: Berlin/Heidelberg, Germany, 2013. [Google Scholar]
  55. Pagani, L.; Townsend, A.; Zeng, W.; Lou, S.; Blunt, L.; Jiang, X.Q.; Scott, P. Towards a new definition of areal surface texture parameters on freeform surface: Re-entrant features and functional parameters. Meas. 2019, 141, 442–459. [Google Scholar] [CrossRef]
  56. Jithin, S.; Bhandarkar, U.V.; Joshi, S.S. Three-dimensional topography analysis of electrical discharge textured SS304 surfaces. J. Manuf. Process. 2020, 60, 384–399. [Google Scholar] [CrossRef]
  57. Aich, U.; Banerjee, S. Characterizing topography of EDM generated surface by time series and autocorrelation function. Tribol. Int. 2017, 111, 73–90. [Google Scholar] [CrossRef]
  58. Podulka, P. Suppression of the High-Frequency Errors in Surface Topography Measurements Based on Comparison of Various Spline Filtering Methods. Mater. 2021, 14, 5096. [Google Scholar] [CrossRef]
  59. Pawlus, P. Digitisation of surface topography measurement results. Measurement 2007, 40, 672–686. [Google Scholar] [CrossRef]
  60. Barari, A.; Kishawy, H.A.; Kaji, F.; Elbestawi, M.A. On the surface quality of additive manufactured parts. Int. J. Adv. Manuf. Technol. 2017, 89, 1969–1974. [Google Scholar] [CrossRef]
  61. Gogolewski, D.; Bartkowiak, T.; Kozior, T.; Zmarzły, P. Multiscale Analysis of Surface Texture Quality of Models Manufactured by Laser Powder-Bed Fusion Technology and Machining from 316L Steel. Materials 2021, 14, 2794. [Google Scholar] [CrossRef] [PubMed]
  62. Jamiolahmadi, S.; Barari, A. Surface Topography of Additive Manufacturing Parts Using a Finite Difference Approach. J. Manuf. Sci. Eng. 2014, 136, 061009. [Google Scholar] [CrossRef]
Figure 1. View of samples prepared for surface topography analysis after EDM process.
Crystals 11 01371 g001
Figure 2. Results of areal measurements of representative locations on surfaces S1, S4, S7, and S11. 3D render of raw surface morphology (left column), 2D view of raw surface morphology (middle column), and raw surface morphology with highlighted topographical features (right column).
Crystals 11 01371 g002
Figure 3. Conventional areal characterization parameters plotted as a function of surface number: (a) height, (b) volume parameters. Please note that each box size indicates 25th and 75th percentiles, the white bar represents median and whiskers shows maximum and minimum values calculated for each scale.
Crystals 11 01371 g003
Figure 4. Effect of scale manipulation in the area-scale method for three different surfaces S1, S6, and S11: mesh as measured (left column), renderings of triangulated surfaces for scale equal to 100 μm2 (middle column) and 10,000 μm2 (right column) visualized in wireframe style. Please note that each row represents different surfaces.
Crystals 11 01371 g004
Figure 5. Results of ANOVA for discriminating against discharge energy shown as p-value as a function of scale for (a) length-scale analysis (rows), (b) length-scale analysis (columns), and (c) area-scale analysis.
Crystals 11 01371 g005
Figure 6. Area- and length-scale characterization parameters plotted as a function of scale for four different discharge energies: (a) relative area, (b) relative length (rows), (c) relative length (columns), (d) area-scale fractal complexity, (e) length-scale fractal complexity (rows), and (f) length-scale fractal complexity (columns).
Crystals 11 01371 g006
Figure 7. Coefficient of determination for linear, logarithmic, and exponential regression of area- and length-scale characterization parameters versus discharge energy plotted as a function of scale: (a) relative area, (b) relative length (rows), (c) relative length (columns), (d) area-scale fractal complexity, (e) length-scale fractal complexity (rows), and (f) length-scale fractal complexity (columns).
Crystals 11 01371 g007
Figure 8. Evolution of mean curvature as a function of scale: (a) signed Ha and (b) unsigned Haabs. Please note that each box size indicates 25th and 75th percentiles, the white bar represents median and whiskers shows maximum and minimum values calculated for each scale.
Crystals 11 01371 g008
Figure 9. Coefficient of determination for linear, exponential, and logarithmic regression plotted as a function for all analyzed curvature parameters.
Crystals 11 01371 g009
Table 1. Chemical composition of AA 6060 T4.
AlSiFeCuMnMgCrZnTi
rest0.3–0.60.1–0.3max. 0.1max. 0.10.35–0.6max. 0.05max. 0.15max. 0.1
Table 2. Technological parameters used for the EDM of samples.
SurfaceVoltage,
V
Current,
A
Single Pulse Time, µsBreak between Pulses,
µs
Single Discharge Energy,
mJ
Theoretical VDI ClassTheoretical Roughness Ra, µm
S11501.22.7150.486150.56
S21601.88.7152.506180.8
S31802.411.5154.968211.12
S41803.217.81810.253241.6
S51804.420.52716.236272.24
S61006.223.73714.694303.15
S71001031.64931.600334.5
S81001386.649112.580366.3
S910021133.449280.140399
S1010029237.149687.5904212.5
S1110039356.2491,389.1804518
Table 3. Surface measurement parameters.
ParameterUnitValue
Magnification50×
Area sizeμm900 × 900
Estimated vertical resolutionμm0.022
Estimated lateral resolutionμm1.500
Lateral sampling intervalsμm0.176
Table 4. List of standard and non-standard areal parameters used to characterize measured surfaces.
StandardParameter GroupParameter Symbol
ISO 25178Height Sq, Ssk, Sku, Sp, Sv, Sz, Sa
Functional Smr, Smc, Sxp
Spatial Sal, Str, Std
Hybrid Sdq, Sdr
Functional (Volume)Vm, Vv, Vmp, Vmc, Vvc, Vvv
FeatureSpd, Spc, S10z, S5p, S5v, Sda, Sha, Sdv, Shv
EUR 15178NFunctional Indices Sbi, Sci, Svi
-OtherSmean, Sdar, Spar
Publisher’s Note: MDPI stays neutral with regard to jurisdictional claims in published maps and institutional affiliations.