
Rolling Texture of Cu–30%Zn Alloy Using Taylor Model Based on Twinning and Coplanar Slip


Department of Materials Science and Engineering, National Cheng Kung University, Tainan 70101, Taiwan
*
Author to whom correspondence should be addressed.
Crystals 2021, 11(11), 1351; https://doi.org/10.3390/cryst11111351
Submission received: 27 October 2021
/
Revised: 3 November 2021
/
Accepted: 5 November 2021
/
Published: 7 November 2021
(This article belongs to the Special Issue Crystal Plasticity (Volume II))
Abstract
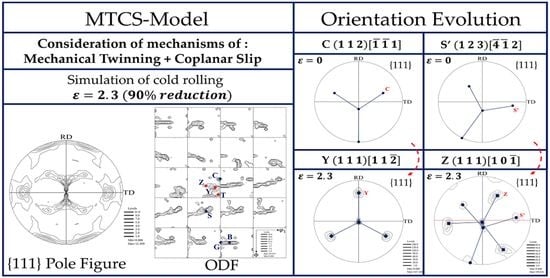
:A modified Taylor model, hereafter referred to as the MTCS (Mechanical-Twinning-with-Coplanar-Slip)-model, is proposed in the present work to predict weak texture components in the shear bands of brass-type fcc metals with a twin–matrix lamellar (TML) structure. The MTCS-model considers two boundary conditions (i.e., twinning does not occur in previously twinned areas and coplanar slip occurs in the TML region) to simulate the rolling texture of Cu–30%Zn. In the first approximation, texture simulation using the MTCS-model revealed brass-type textures, including Y{1 1 1} <1 1 2> and Z{1 1 1} <1 1 0> components, which correspond to the observed experimental textures. Single orientations of C and S’ were applied to the MTCS-model to understand the evolution of Y and Z components. For the Y orientation, the C orientation rotates toward T(5 5 2)[1 1 5] by twinning after 30% reduction and then toward Y(1 1 1)[1 1 2] by coplanar slip after over 30% reduction. For the Z orientation, the S’ orientation rotates toward T’ by twinning after 30% reduction and then toward Z by coplanar slip after over 30% reduction.
1. Introduction
In the industry applications, the formability of metals plays a significant role, which mainly depends on the crystallographic texture and microstructure [1]. Moderate-strain metals and alloys including copper exhibit laminar microstructures called shear bands (SBs), a form of plastic instability. Duggan et al. [2] and Fargette et al. [3] investigated the formation mechanism of SBs in Cu–Zn alloys. In rolled metals, the SBs form as thin planar sheets that are parallel to the transverse direction (TD) and inclined at ~35° to the rolling direction (RD). Brass-type SBs and copper-type SBs have been found in low stacking fault energy (SFE) and intermediate to high SFE materials [2,4], respectively. Hatherly and Malin [5] defined low SFE as <20 mJ/m2, intermediate SFE between 20 and 40 mJ/m2 and high SFE as >40 mJ/m2. Considering the low stacking fault energy (SFE) of fcc metals, the SBs exhibit the structure of twin–matrix lamellae (TML) composed of twin and matrix lamella layers. The TML structure was reported in the observation of deformed Cu–30%Zn by Duggan et al. [2] and Fargette et al. [3]. Malin and Hatherly [6] reported the TML structure in pure copper. An abnormal slip system parallel to twinning planes also occurs in the lamellar layer structure [2].
After large thickness reductions for α-brass, the SBs substantially change the texture from copper-type to brass-type because of the formation of the fine TML structure [2]. Wassermann et al. [7] reported that cold-rolled α-brass with C{1 1 2} <1 1 1>-oriented grains exhibit twin orientation T{5 5 2} <1 1 5> after twinning; consequently, the T-oriented grains rotate toward the B{1 1 0} <1 1 2> orientation by dislocation slip. Hirsch et al. [4] found that the T-oriented grains rotate to the transition orientation of {1 1 1} <1 1 2> (brassR) due to mechanical twinning (MT) after small reduction, and the brassR grains rotate to the G {1 1 0} <0 0 1> orientation through shear banding after large reductions. Paul et al. [8,9] studied low-SFE fcc single crystals initially oriented with copper and revealed that the two coplanar slip systems adjusted by the initiation of shear banding play an important role in the formation of brass-type textures.
Sevillano et al. [10] and van Houtte et al. [11,12] predicted copper-type texture using full constraint (FC)- and relaxed constraint (RC)-Taylor models, respectively. Leffers [13,14], Hirsch and Lücke [15] and van Houtte [16] estimated the brass-type texture using various Taylor models that consider MT. According to Chin’s study [17], Kallend [18] and van Houtte introduced MT into FC- [16] and RC-Taylor models [11,12]. Hirsch et al. [15] quantitatively compared the rolling texture between FC and RC Taylor models. Leffers [19,20] used a modified Sachs model to predict brass-type texture. Kalidindi [21] proposed a crystal plasticity model considering deformation twinning and observed that twinning is difficult to occur in the twinned regions. In addition, Kalidindi [22] modelled with shear banding to predict the texture transition from Cu-type to brass-type. Lebensohn and Tomé [23,24] utilized the VPSC model to simulate brass-type texture including comprehensive relative activity of slip and twin systems. Toth et al. [25] used a Taylor version of the VPSC model considering dislocation slip and twinning to simulate the deformed texture of TWIP Steel with fcc structure. Chalapathi et al. [26] proposed a modified LAMEL model to simulate the rolling texture of an fcc steel. Among all models, the present work aimed to incorporate the experimental observations of TML [27,28,29,30,31] in the Taylor model while considering MT to predict the rolling texture of Cu–30%Zn. The modified Taylor model was compared with conventional Taylor models such as FC and RC Taylor models in terms of rolling texture.
2. Materials and Methods
The dimensions of the as-received Cu–30%Zn alloy were reduced to 60.0 × 20.0 × 20.0 mm3 by using an abrasive cutting machine and annealed at 600 °C for 1 h to homogenize, and then cold-rolled up to 90% thickness reduction. A two-high non-reversing mill with roll diameter of 590 mm was set with rolling speed of 9 rpm to conduct the cold rolling experiment. Drops of lubricant oil were applied on the rolls to reduce to friction and heat during rolling. The alloy was rolled 10 times to reduce the thickness from 20.0 to 14.0 mm (30% reduction). Then, 1/3 length of the alloy was cut off and continued to roll 12 times to reduce the thickness from 14.0 to 8.0 mm (60% reduction). Finally, 1/2 length of the alloy was cut off and continued to roll 15 times to reduce the thickness from 8.0 to 2.0 mm (90% reduction). The middle regions of the rolled materials were selected and cut out in dimensions of 20.0 mm width and 20.0 mm length for further texture analysis. The specimens were prepared by grinding using #400, #800, #1500, #2500, and #4000 SiC papers.
The texture of Cu–30%Zn alloy was examined on the surface parallel to the out-of-plane direction called ND direction by using Bruker (Germany) D8 ADVANCE in NCKU with CuKα radiation of λ = 1.5406 Å at 40 kV and 40 mA. Three incomplete pole figures of {1 1 1}, {2 0 0}, and {2 2 0} were recorded by varying the tilting angle of 0°–70° and the rotation angle of 0°–360° with a scanning step of 5°. Defocusing correction was then employed on the measurement of random powder Cu–30%Zn alloy. Orientation distribution function (ODF) and complete {1 1 1} pole figure were calculated using LaboSoft (Poland) LaboTex ver.3.0 software in NCKU.
3. Modelling
The rolling texture of Cu–30%Zn alloy was modelled using modified Taylor models in the Matlab software. FC-Taylor model, RC-Taylor model, RC-Taylor model considering MT called MT-model, and RC-Taylor model considering MT and coplanar slip called MTCS-model were constructed as follows.
3.1. FC-Model
According to the method of van Houtte et al. [12,32] for establishing the FC-Taylor model, a given displacement gradient eij in a grain is composed of a symmetric matrix εij (called the strain tensor) and an antisymmetric matrix ωij (called the rotation tensor). Here, the given strain tensor εij of 90% reduction (corresponding true strain, = 2.3) is expressed in the macroscopic frame for plane strain condition as follows:
An incremental strain of 0.01 was set for each step in the simulation. In the crystal frame, the symmetric matrix , which relates the shear on the slip system s, is described for the slip systems of {1 1 1} <1 1 0> by:
where, , and denote the direction of the Burgers vector, the normal to the slip plane, and the shear on the slip system s, respectively, in the crystal frame. The symbol denotes the dyadic product of two vectors. The antisymmetric matrix is expressed by:
and
where is the lattice rotation in the macroscopic frame.
Five linear equations are needed to solve Equation (2) with 792 combinations for a given strain. According to the Taylor assumption [33], the minimum work corresponds to the minimum sum of the activated five absolute shears and is expressed as:
The critical resolved shear stress is denoted as for all 12 slip systems, and the number of the activated slip systems is ns = 5. The lattice rotation in the macroscopic frame can be obtained using Equation (5). As a result, the new orientation matrix g∗ is expressed by:
where is the initial orientation matrix before deformation.
3.2. RC-Model
After high reduction, the deformation texture shows discrepancies from that predicted by FC-Taylor model. Van Houtte [11] proposed the concept of partly constrained deformation of crystallites and labelled it as RC-model because of the observation that grains become flattened and elongated after high rolling reduction. In the RC-Taylor model, only four slip systems are activated. Hence, the relaxed constraint of shear strain can be calculated in Equation (1), where the X direction is the rolling direction and Z the normal direction, and the number of the activated slip system is = 4 in Equations (2) and (4). The given strain tensor is expressed in the macroscopic frame for plane strain condition as follows:
where the shear strain is unconstrained. Equations (2)–(7) are the same in the case of the FC-Taylor model.
3.3. MT-Model
Following their observation of MT in low-SFE metals, van Houtte [16] and Chin et al. [17] proposed a modified Taylor model that assumes that the shear in the crystal frame is due to the MT in {1 1 1} <1 1 2> twin systems for FC- and RC-models and not {1 1 1} <1 1 0> slip systems. Following the concept of van Houtte [16], the present study employed an RC-model combining three slip systems and one twin system. This model is referred to as the MT-model and differs from the RC-model in that the latter considers four slip systems. The flowchart of the subroutine is shown in Figure 1.
In the MT-model, the strain tensor resulting from three slip systems and one twinning system is expressed in the crystal frame as follows:
where the numbers of the activated slip and twin systems are = 3 and = 1, respectively. The former and latter parts of the symmetric matrix corresponding to the shear on the slip systems of {1 1 1} <1 1 0> in Equation (2) and the twin systems of {1 1 1} <1 1 2> are expressed as:
where , , and denote the direction of the Burgers vector, the normal to the twin plane, and the shear on the twin system t, respectively. The slip and twin systems used in the models are listed in Table 1. The rotational antisymmetric matrix in the crystal frame is expressed as:
where is the lattice rotation in the macroscopic frame.
Considering the contributions of slip and twinning, the minimum work of the MT-model is expressed in terms of as follows:
where the numbers of the activated slip and twinning systems are = 3 and = 1, respectively, and the critical resolved shear stresses for twinning and slip in all 12 twin and slip systems are denoted and , respectively. The CRSS values of the slip and twin systems are assumed to be identical, that is, . Thus, the new orientation of matrix is expressed by:
where is the initial orientation matrix prior to deformation.
After twinning deformation, the orientation number of the fine TML structure increases twofold after each simulation step, which leads to increases in computation time. To address the problem of time-consuming computations, van Houtte assumed a simplified method with only one orientation; here, either the matrix orientation or the twin orientation is selected as the new orientation of the matrix and twin area in the TML region. This orientation depends on the relation between a random number R ranging from 0 to 1 and the volume fraction of the twin region , which is expressed as:
where the constant of the twinning shear of fcc metals is denoted . If R is greater than , then the new orientation is determined by Equation (11). If R < , then the new orientation is given by Equation (11). The twinned orientation obtained after twinning is given by Equation (13):
where is the new matrix orientation and is a matrix that transforms the matrix orientation into a twin orientation, which is expressed as follows:
where T denotes the transpose of the matrix .
3.4. MTCS-Model
Considering the coplanar slip in the TML region reported by Hirsch et al. [4,34], the current work presents another modified Taylor model, hereafter referred to as the MTCS-model, that combines the MT-model with the concept of coplanar slip in the TML region. A major difference between the MTCS- and MT-models is the addition of two assumptions resulting in different textures in the former. The first assumption in the MTCS-model is that further twinning is forbidden in a priori twinned regions. The second assumption in this model is that the deformation of twinned grains contributes to two coplanar slip systems. The former assumption is based on the perspective that twinning cannot easily occur in previously twinned areas, as reported by Kalidindi [21]; in other words, secondary or further twinning is forbidden in previous twinning areas. The latter assumption is based on the coplanar slip observed in the TML region by Hirsch et al. [4]. The coplanar slip forms on the plane of activated twin systems. The two other slip systems were selected from non-coplanar slip systems. Therefore, the key difference between the MT- and MTCS-models lies in changes in the twinned orientation.
Following the procedures of the MT-model, we calculate rigid body rotation for the MTCS-model by taking the plastic strain and minimum work into account using Equations (10)–(12), as shown in Figure 2. After each deformation step, a new orientation is determined at random by selecting a number R between 0 and 1. Here the possibility of twinning is equal to the fraction of the twinning area . When , the new orientation is determined by twinning by using Equations (7) and (15); when , the new orientation is calculated by applying Equation (7) because of the deformation of the slip, as shown in Figure 2. This procedure for orientation determination leads to indicating the twinned and non-twinned orientations.
The two assumptions are then implemented in the MTSC-model. The first assumption is that secondary twinning, that is, further twinning in a previously twinned orientation, is excluded. For the non-twinned orientation indicated, rigid body rotation is calculated by considering the plastic strain and minimum work by using Equations (8)–(10). However, the twinned orientation indicated does not change according to Equation (13) but follows the right route in Figure 2 to avoid the formation of secondary twinning. This phenomenon corresponds to the assumption that the twinning orientation occurs only once. The second assumption is that the coplanar slip occurring in the TML region is implemented in the reorientation calculation of the twinned orientation. The activated systems in twinned orientations occur on twinning planes called coplanar slip systems at the first twinning. Thus, the 12 slip systems used in the models could be classified into coplanar and non-coplanar slip systems on the basis of the twinning planes. Therefore, two activated slip systems are selected from the coplanar slip systems, and another two slip systems are selected from the non-coplanar slip systems by using the RC-model. Thus, in addition to non-coplanar slip, coplanar slip can contribute to the plastic strain of twinned orientations via the relation:
where and are the plastic strains resulting from the coplanar slip and non-coplanar slip, respectively.
Considering the contribution of coplanar and non-coplanar slips, the optimization of the minimum work in the MTCS-model is expressed in terms of as:
where the numbers of the activated slip and twinning systems are = 2 and = 2, respectively, and the critical resolved shear stresses for the coplanar and non-coplanar slip systems are denoted and , respectively. The CRSS values of the slip and twin systems are assumed to be identical, that is, β = 1. The antisymmetric matrix is expressed as:
where is the lattice rotation in the macroscopic frame.
Thus, the new orientation of matrix is expressed as:
where is the twinned orientation matrix before deformation resulting from the coplanar slip.
For the four simulation models, the orientation number of grains is 5000, each strain step is 0.01, the total strain is 90% reduction, and the 5000 grains initially show random orientations. The simulated textures were analyzed, including ODF, complete {1 1 1} pole figures, and volume fraction by using LaboTex software. The Euler angles follow the definition of Bunge.
Single crystal C and S’ orientations were also employed for the initial orientations in MTCS-model to predict the components of Y and Z, respectively.
4. Results and Discussion
This section is divided by subheadings. It provides a concise and precise description of the experimental results, their interpretation, as well as the experimental conclusions that can be drawn.
4.1. Effect of Twinning on the Rolling Texture
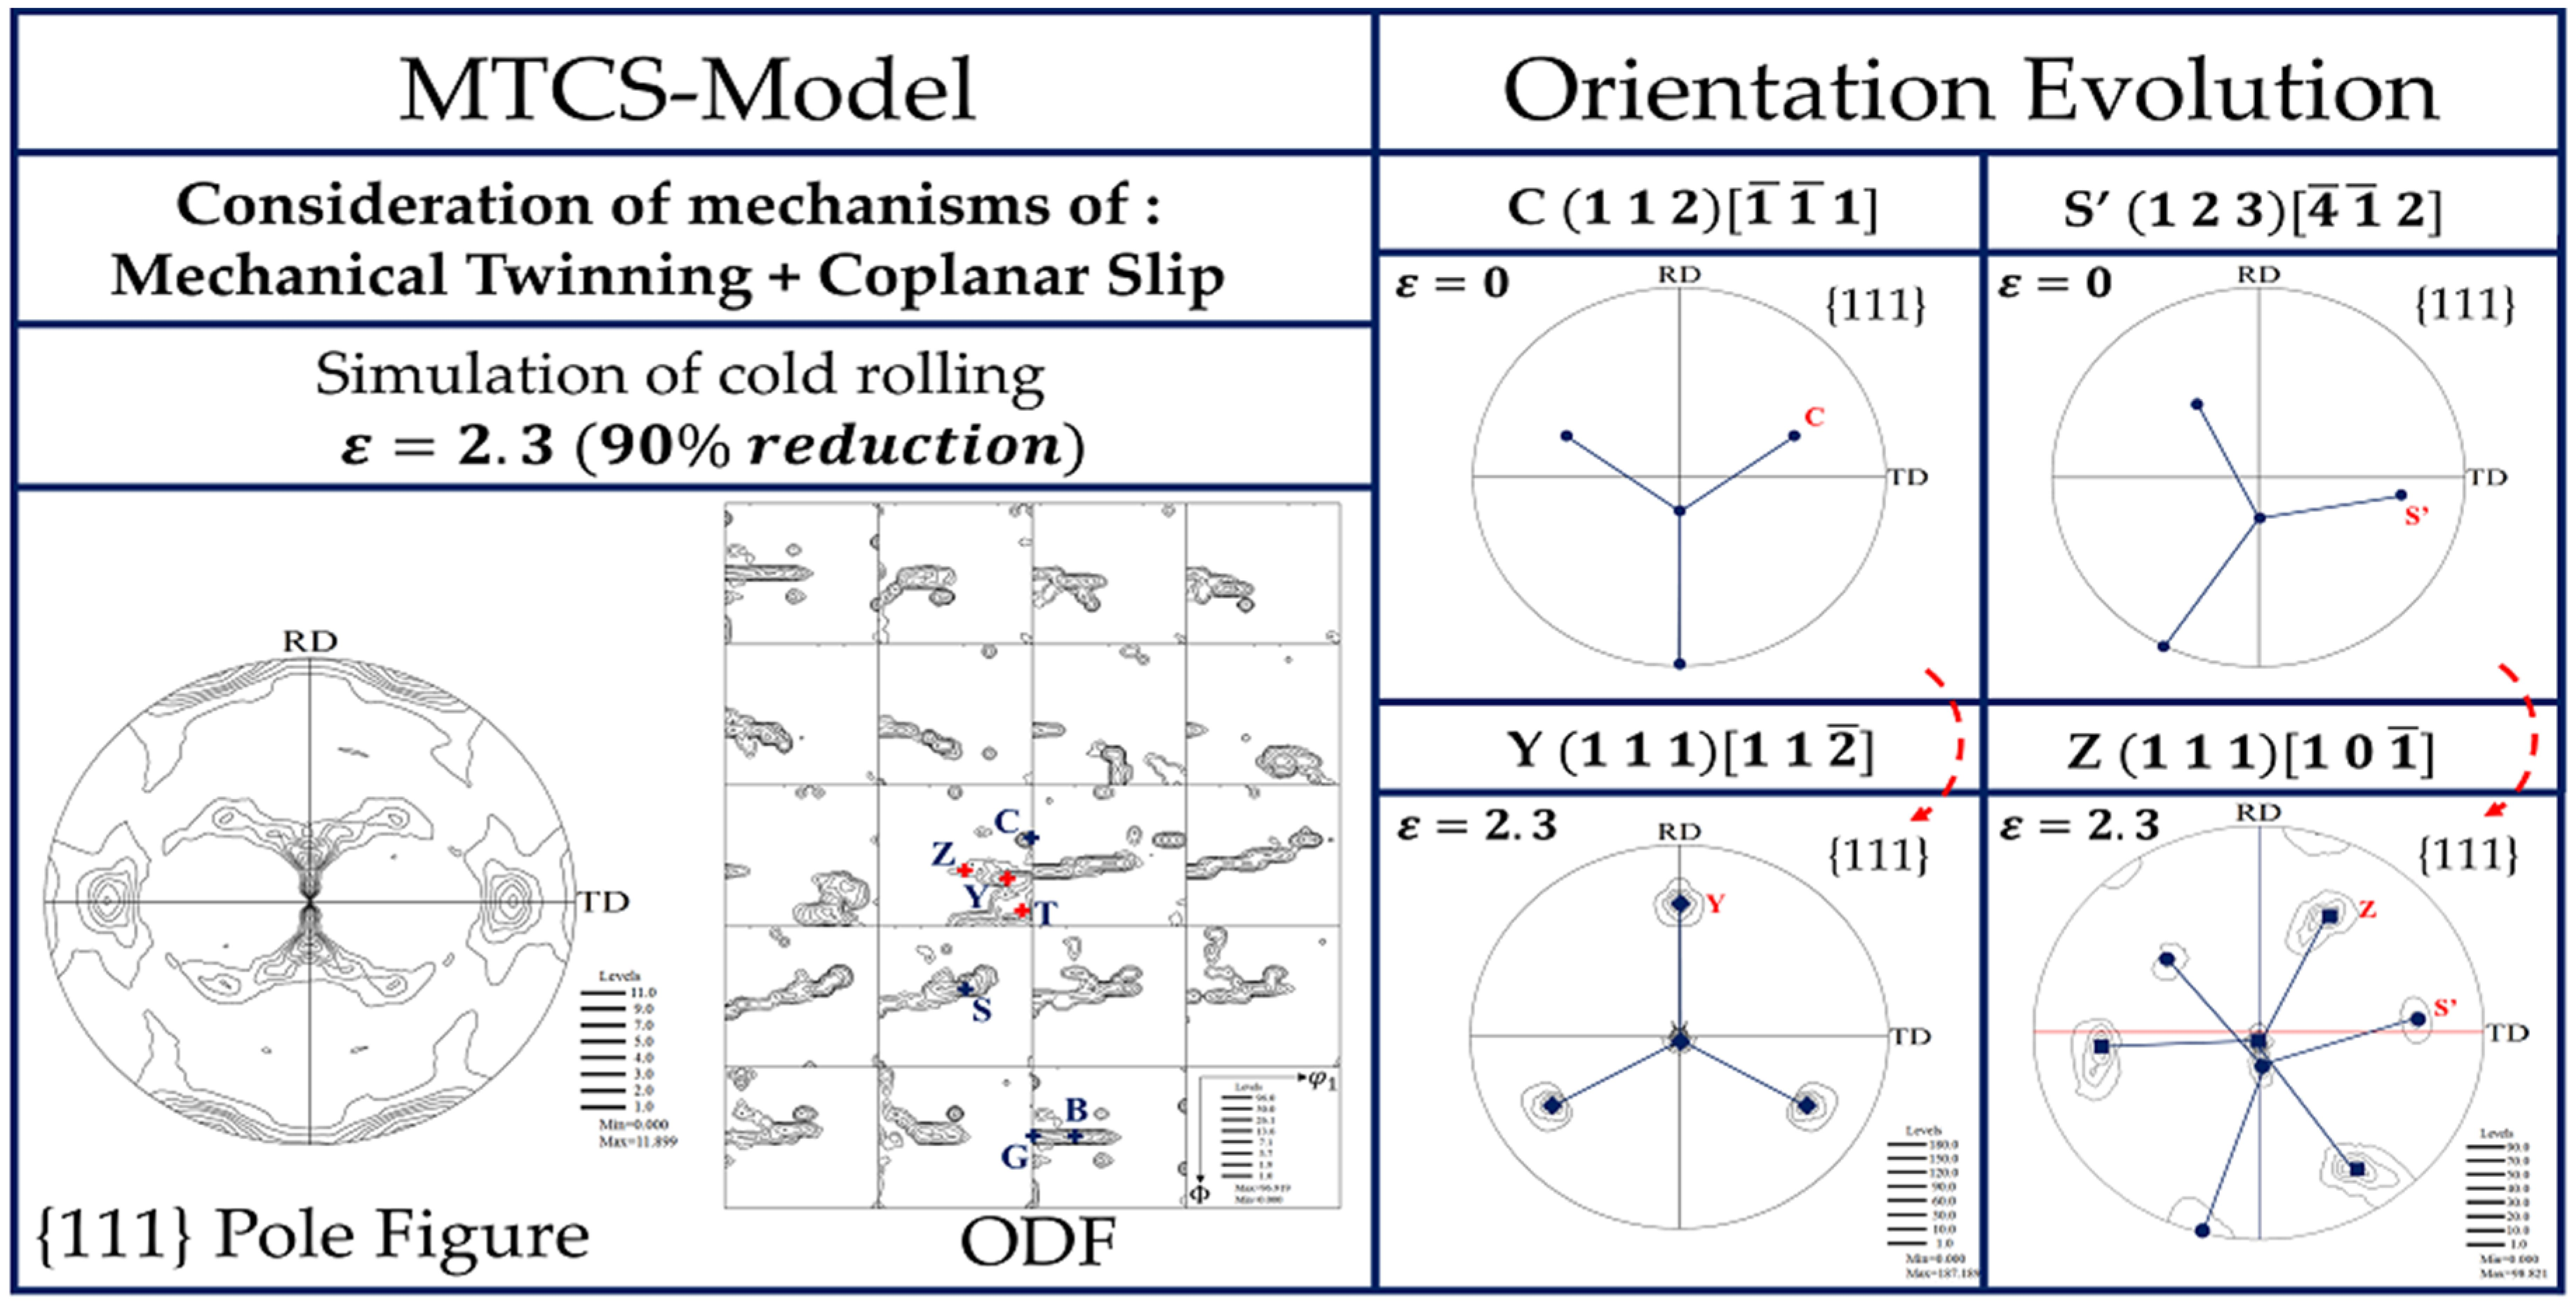
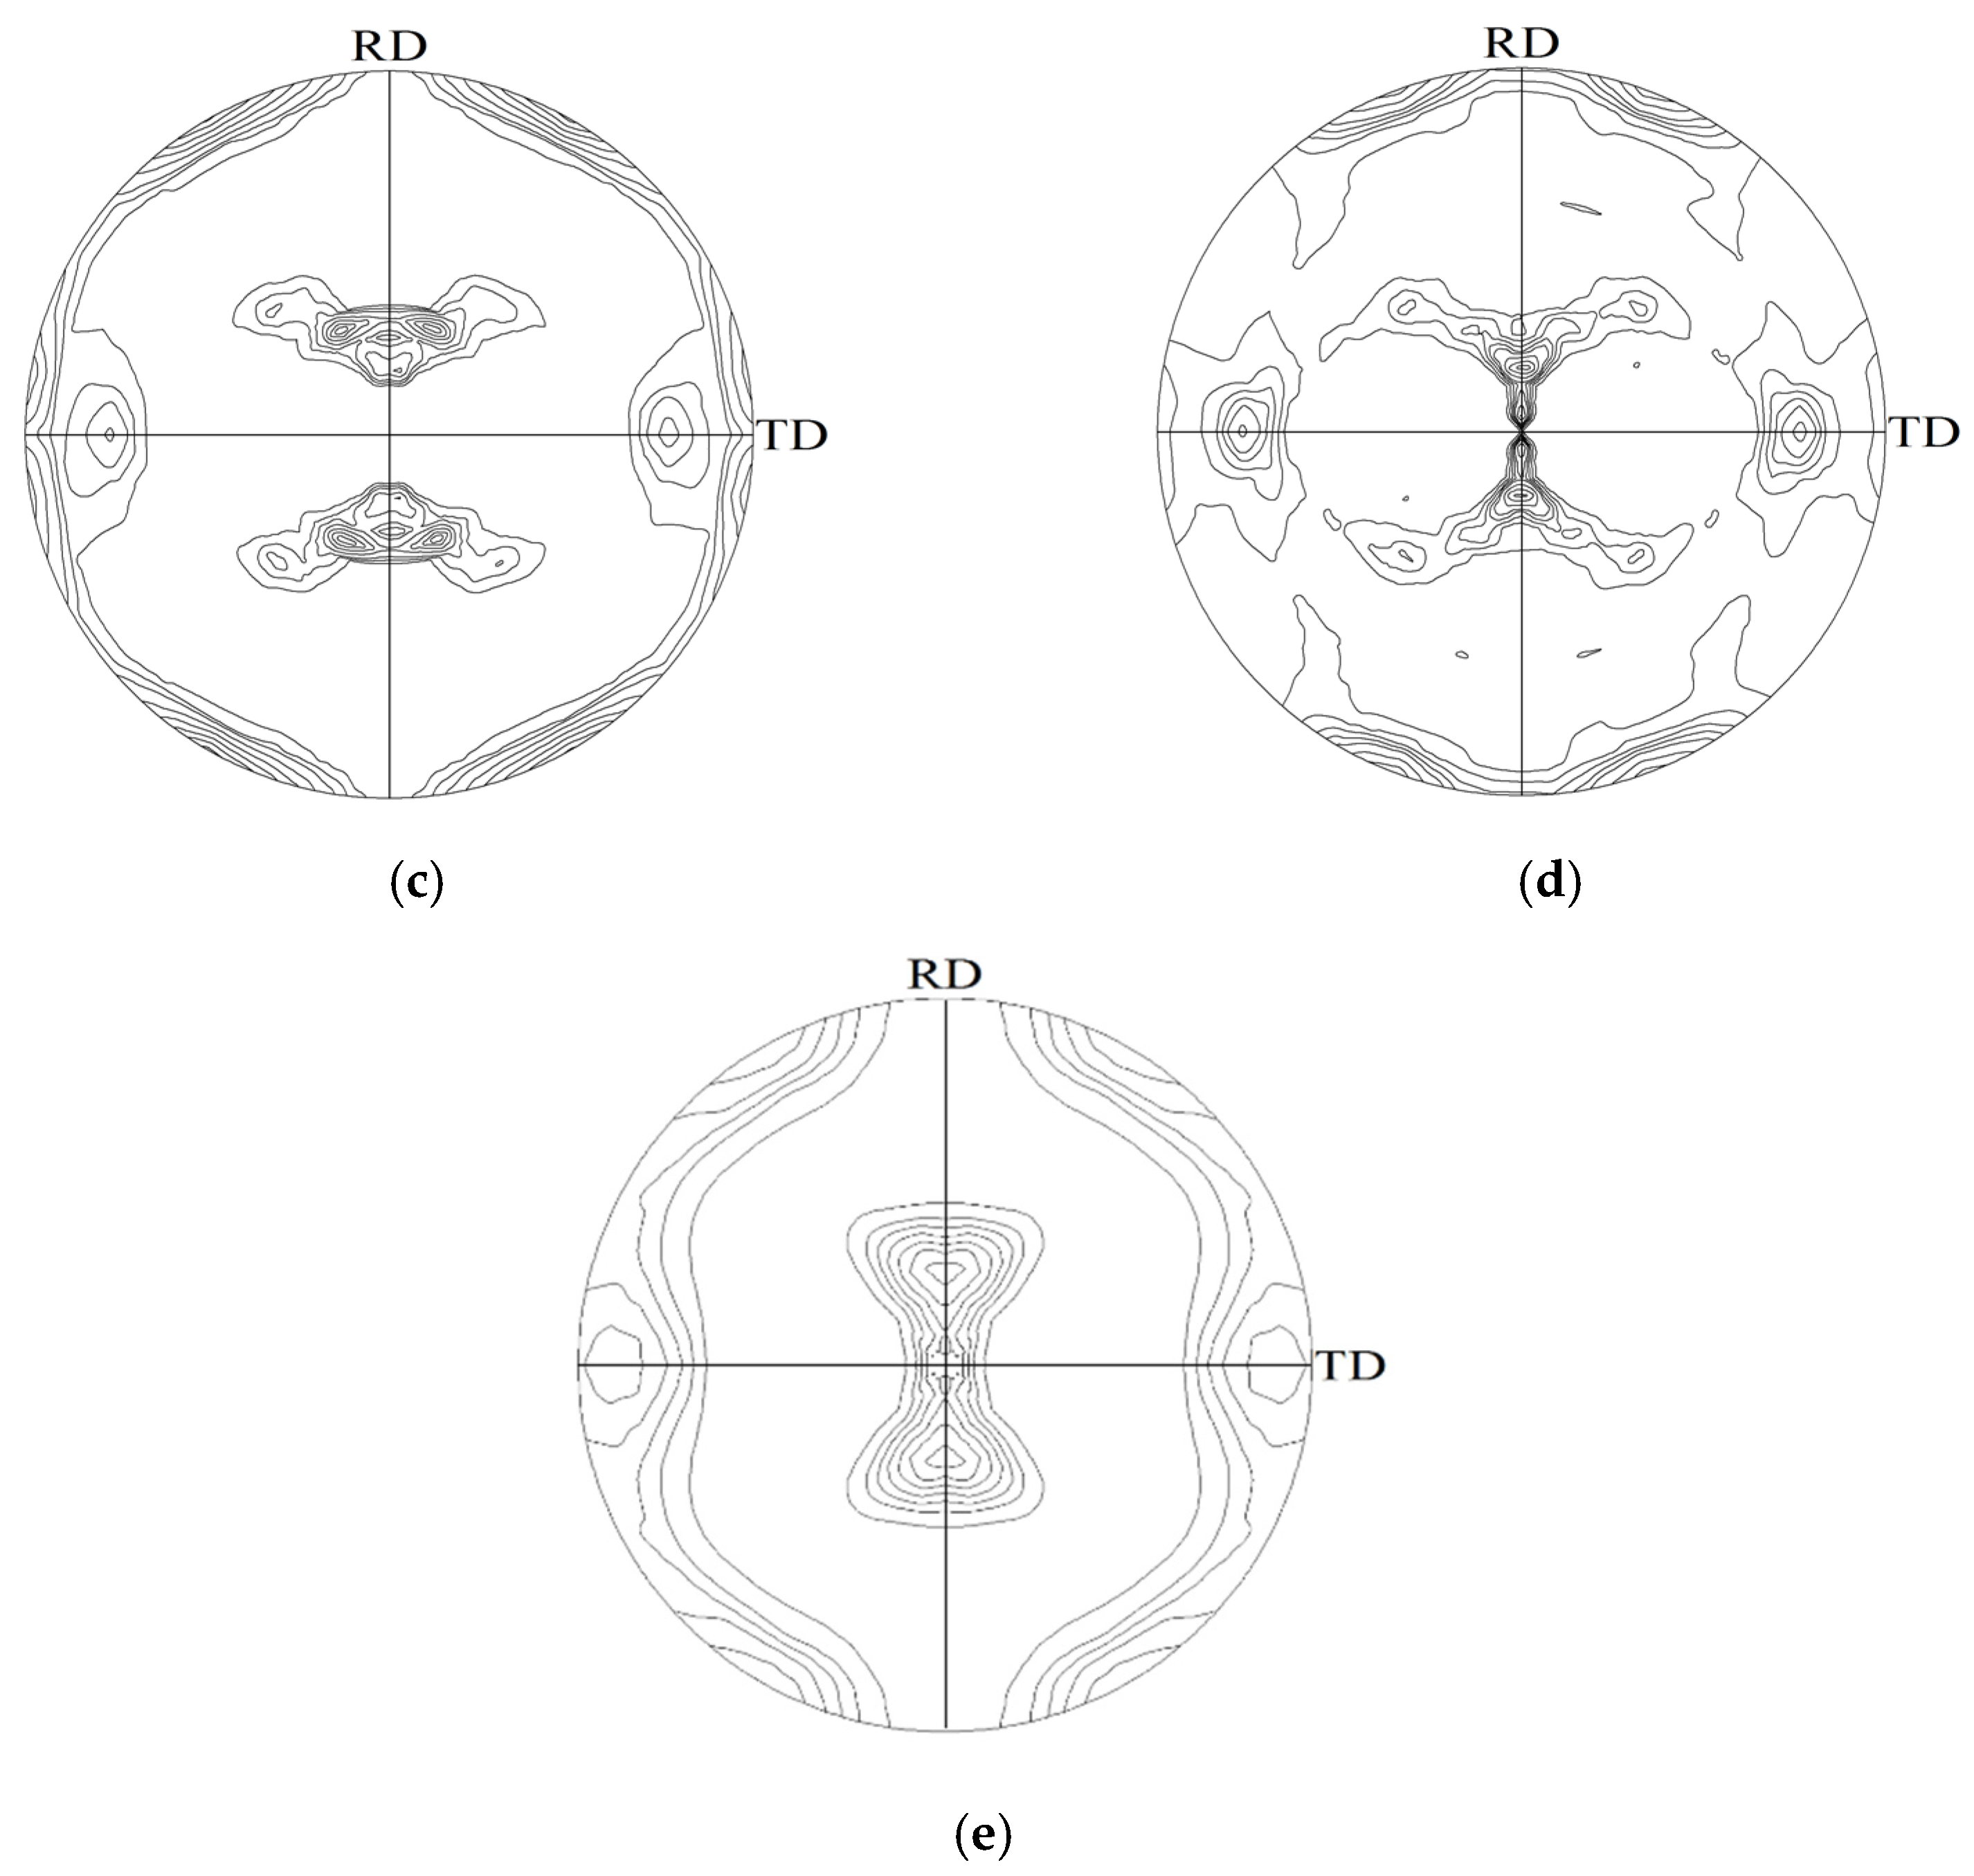
FC-, RC-, MT- and MTCS-models were applied to understand the influence of twinning on the rolling texture. The shear mechanism of FC- and RC-models is related to pure slip, and that of MT- and MTCS-models is related to a combination of partial slip and twin. The {1 1 1} pole figures of FC-, RC-, MT-, and MTCS-models are shown in Figure 3a–e, presenting the {1 1 1} pole figure of Cu–30%Zn obtained from XRD measurements after 90% cold rolling. The {1 1 1} pole figures of FC- and RC-models belong to a typical copper texture, and those of MT and experiment show a typical brass texture. In addition, the {1 1 1} pole figure of MTCS-model indicates a combination of copper and brass textures.
ODFs were obtained from simulation and experiment to quantify the orientation distributions of four models. As shown in Figure 4, the blue symbols indicate the orientations of C{1 1 2} <1 1 1>, S{1 2 3} <6 3 4>, B{1 1 0} <1 1 2>, and G{1 1 0} <0 0 1>, and the red symbols indicate the orientations of T{2 5 5} <5 1 1>, Y{1 1 1} <1 1 2>, and Z{1 1 1} <1 1 0>. Table 2 shows the preferred orientations simulated by the four models. The FC- and RC-models predict a β-fiber after cold rolling in Figure 4a,b, the MT-model shows an α-fiber, and the MTCS-model exhibits a combination of α- and β-fibers in Figure 4c,d. Comparison of pole figures and ODFs revealed that the FC- and RC-models show β-fiber, the MT-model reveals α-fiber, and the MTCS-model indicates α-and β-fibers.
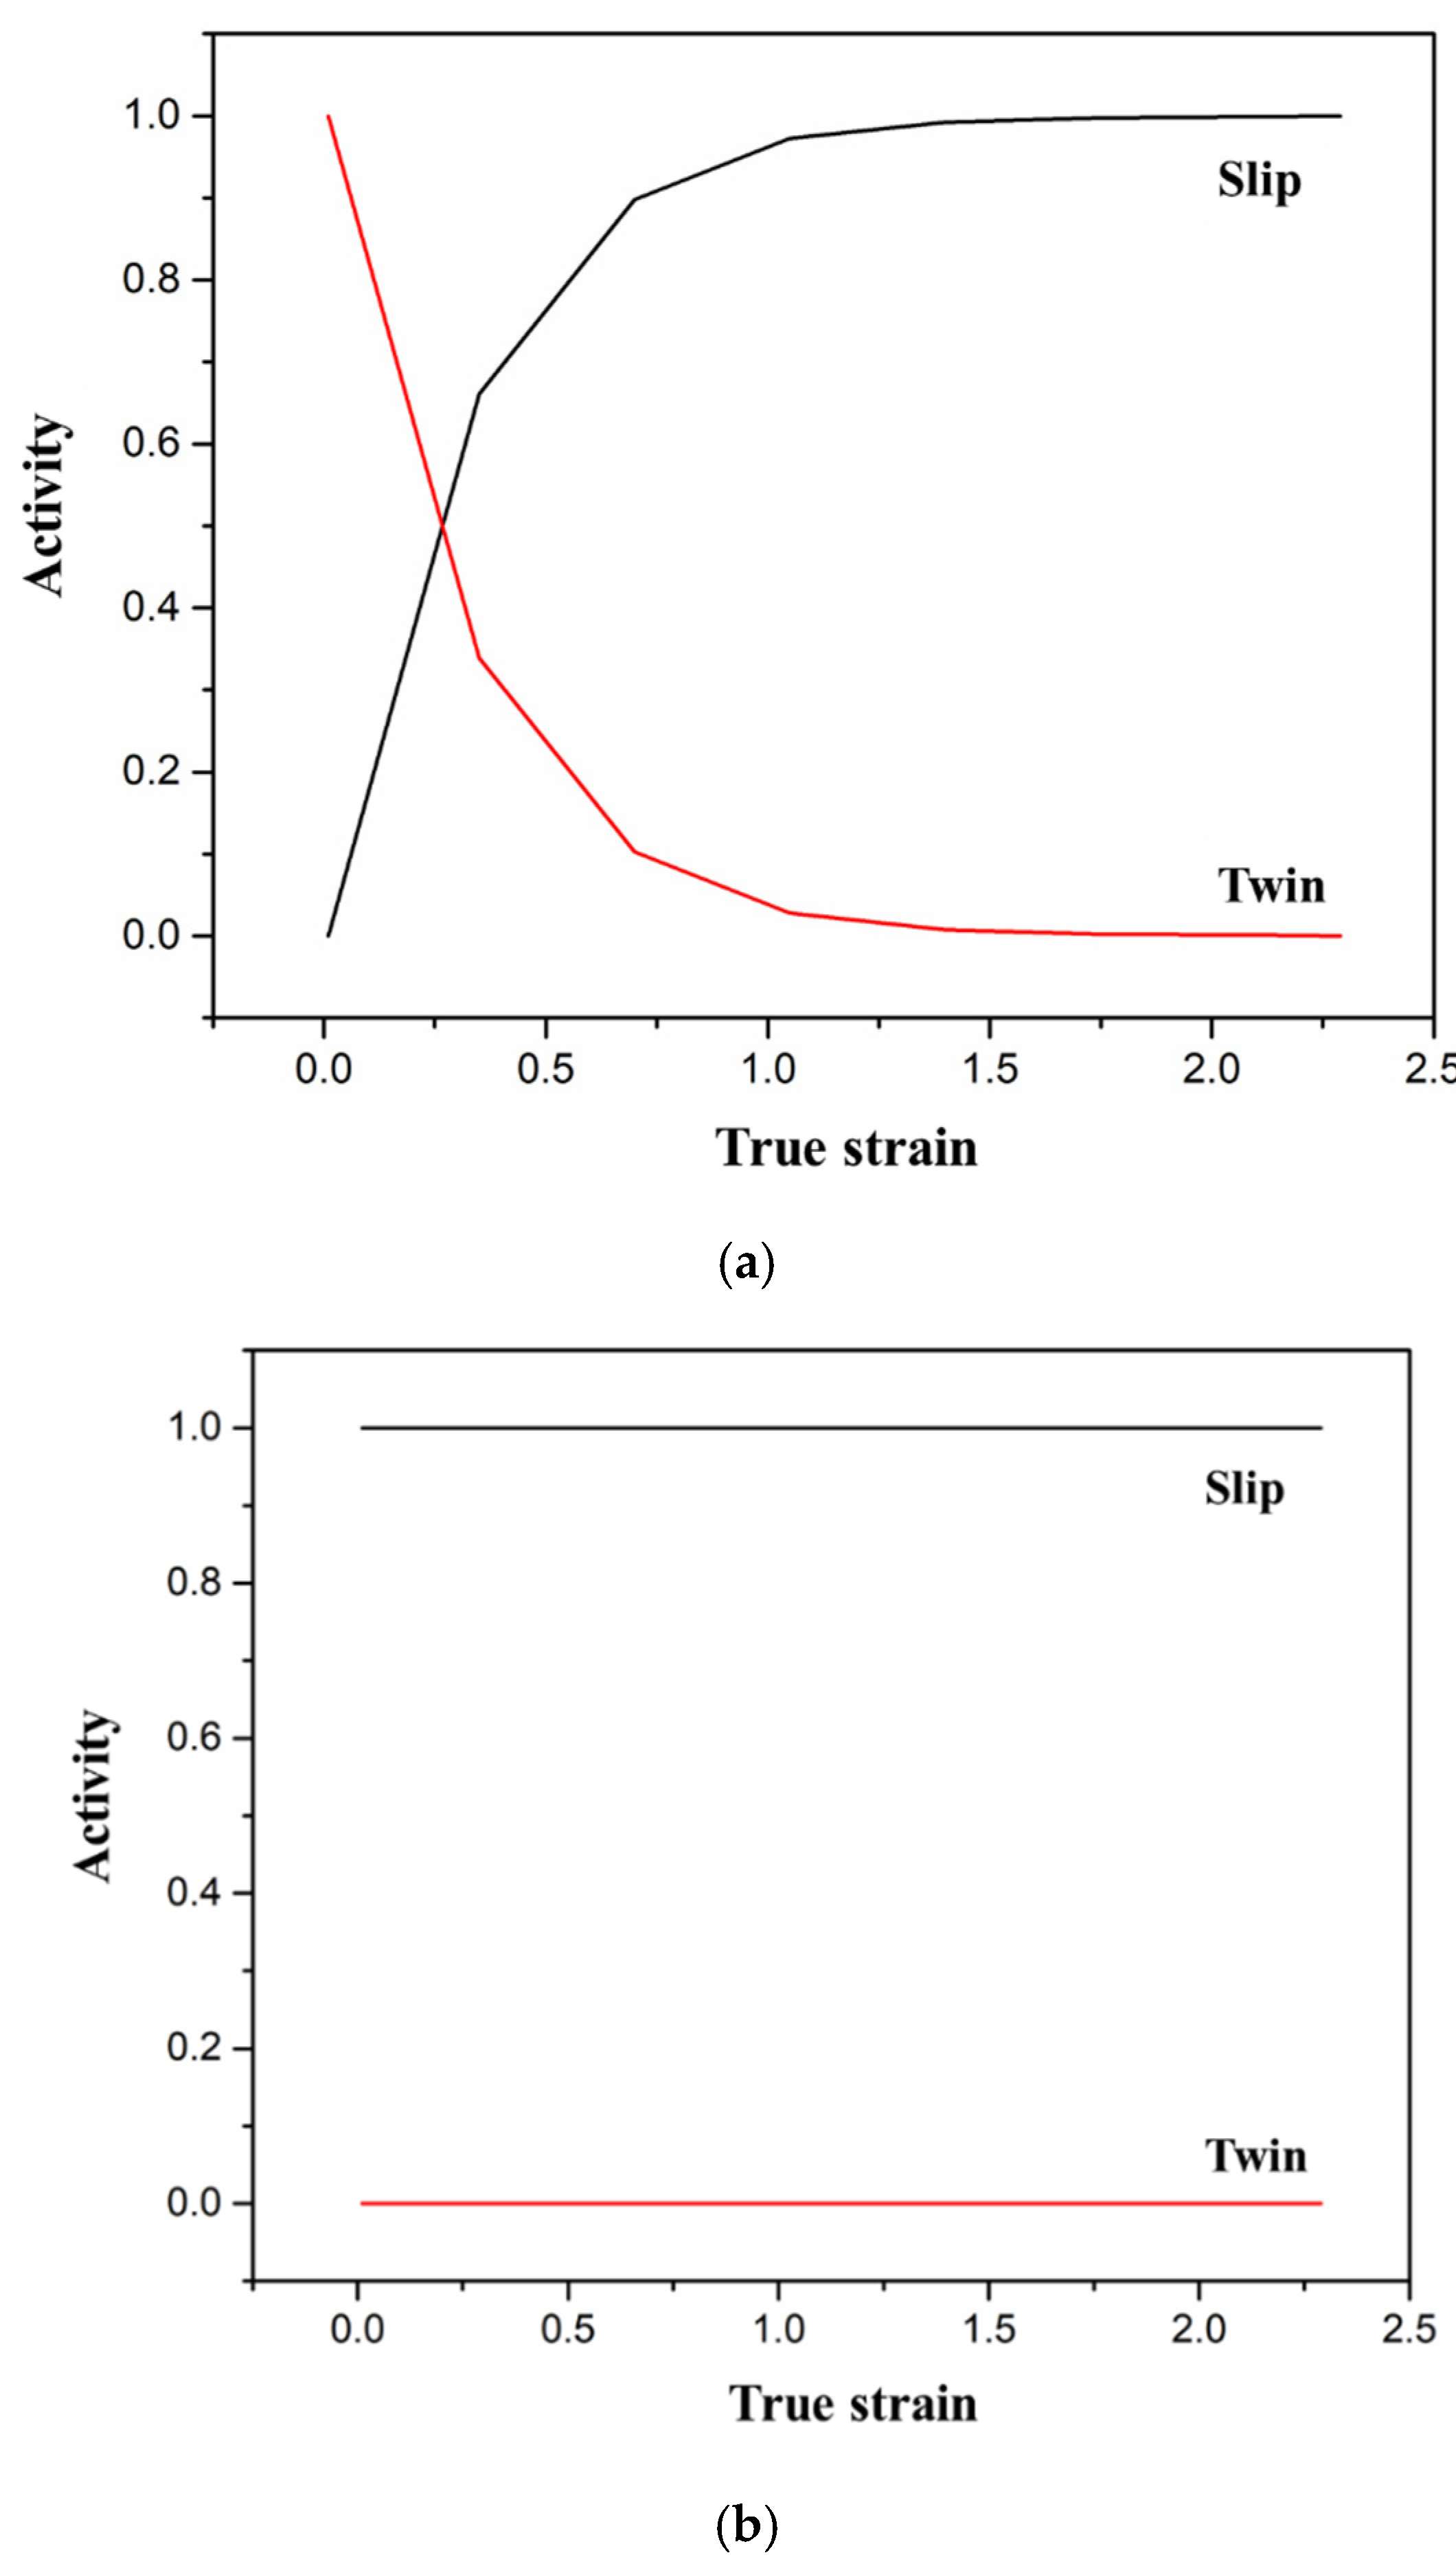
The relative activities of the slip and twin systems were analyzed. Figure 5 shows the relative activity of the systems as a function of deformation strain for the slip or twin systems considered in the MT and MTCS models. The relative activities of slip and twin systems for each step of simulation are determined using Equations (21) and (22), respectively [28].
In the case of the RC-model, only slip systems were activated, that is, the activity of slip has a constant value of 1. In addition, the activity of the 12 slip systems generally ranges from 8% to 9% throughout the simulation.
In the case of the MT-model, the activity of the twin system calculated from the simulation results is larger than that of the slip system at ; by contrast, the activity of the slip system is greater than that of the twin system at . These results indicate that the deformation mechanism of the MT-model is dominated by twinning at . Under the condition of , the deformation mechanism of the MT-model is dominated by the twinning of slip system TS1. The deformation mechanism of the MT-model is dominated by the slipping of slip systems SS4 and SS5 at and by the slipping of slip systems SS1 and SS2 at . At , the activities of the slip and twin systems are stabilized in the MT-model. Overall, in the case of the MT-model, the respective activated shear fractions of the dominant slip systems of SS4 and SS5 are 24.5% and 24.5% of the slip and twin contribution, corresponding to 27.9% and 27.9% of the slip contribution, respectively. The activated shear fraction of the dominant twin system of TS1 is 12.3% of the slip and twin contribution, which corresponds to 99.9% of the twin contribution.
The deformation mechanism of the MTCS-model is dominated by the slipping of slip systems SS1 and SS2, which show similarly stable activities of approximately 50% throughout the simulation. The activity of twin systems is close to zero throughout the simulation (i.e., ~10−18) because of the model’s assumption of restricted secondary twinning (i.e., twinning may occur only once). Madhavan et al. [35] reported that the evolution of Cu-type rolling textures after up to 95% reduction may be completely attributed to slip. Overall, in the case of the MTCS-model, the activated shear fractions of the dominant slip systems of SS1 and SS2 are approximately 50% and 50%, respectively, of the slip and twin contributions; these values correspond to approximately 50% of the slip contribution. The activated shear fraction of the dominant twin system of TS11 is 0% of the slip and twin contribution, which corresponds to 33.2% of the twin contribution.
The volume fraction of major components was calculated to quantify the orientation components of the four models. Given their pure slip mechanism, the volume fractions of C and S orientations are 15.52% and 11.81% for FC-model and 13.07% and 12.56% for RC-model, as shown in Figure 6a,b. In both cases of FC- and RC- models, the volume fraction of B and G components are relatively low because twinning mechanism was not considered. When considering partial slip and twinning for the MT-model, the volume fraction of C and S are reduced to 0.75% and 8.04%, while the volume fraction of brass-type components, B and G components, increase. Furthermore, taking the coplanar slip mechanism into account in the MTCS-model, the C and S orientations are stabilized due to the restriction of secondary twinning, which leads to higher volume fractions than those in MT-model. The major volume fraction of 10.95% calculated from MTCS-model in Figure 6d reveals the S orientation, while in the case of MT-model in Figure 6c that of 11.36% is the B orientation. This observation suggests that the deformation mechanism of coplanar slip may lead to the orientation change from B to S orientation because the deformation mechanism of coplanar slip is considered in the MTCS-model. Furthermore, the volume fraction of T orientation is 0.37% for MT-model (in Figure 6c), and those of T, Y, and Z orientations are 1.64%, 2.34%, and 2.36%, respectively, for the MTCS-model (in Figure 6d). The results reveal that the difference between MT- and MTCS-models lies on the orientation prediction of Y and Z, where the volume fractions of both orientations are small.
Wassermann et al. [7] observed that on cold-rolled α-brass, the twin orientation T{5 5 2} <1 1 5> is formed after twinning and consequently rotates to B{1 1 0} <1 1 2>. Hirsch et al. [4] observed that in the low SFE Cu–Zn alloys, texture transition occurs at the intermediate of high strains; a decrease in C orientation leads to an increase in T orientation. The experimental result indicates the onset of twinning by the decrease of C orientation and the increase of G. After 70% reduction, the G orientation is stable and the rest of T orientation shifts toward Y. Madhavan et al. [35] observed the texture evolution of cold-rolled Ni–40%Co. At the early stage, the deformation is achieved by slip and MT. At higher reductions, high fraction of Cu-type shear bands was observed, which leads to final G orientation with high volume fraction.
For FC- and RC-models, we only assume that the plastic deformation results from slipping on the slip systems. For MT- and MTCS-models, we consider that deformation occurs due to MT. This finding suggests that the deformation mode, either due to slip or twinning, changes the texture. The MTCS-model can predict the orientation components of Y and Z with the initial random orientations.
With the use of a single crystal, the development and formation of Y and Z orientations were successfully estimated. Thus, the MTCS-model in combination with the initial orientations of C and S’ was employed in the following sections.
4.2. Formation of Y Orientation
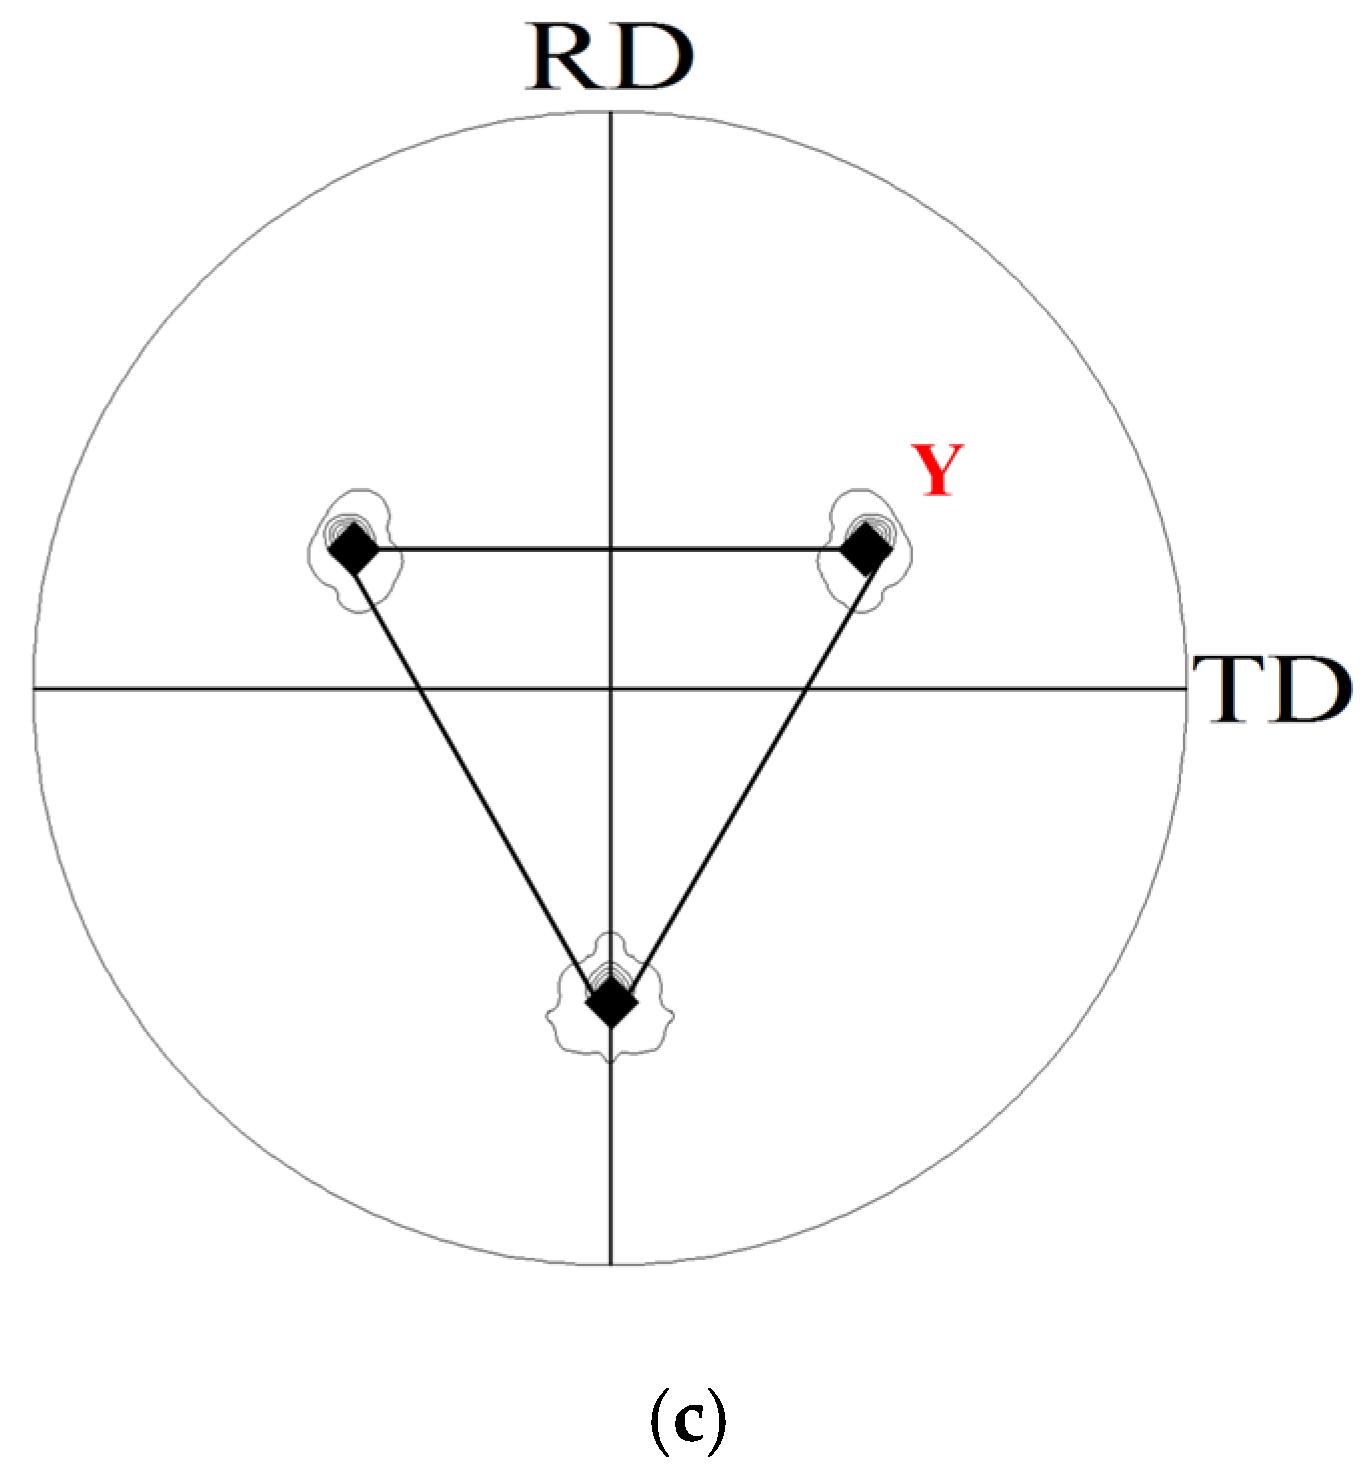
Hirsch et al. [4] reported that the T orientation is formed at low strain of <60% reduction due to the twin mechanism in Cu–30%Zn. At 70% reduction, this T orientation rotates oppositely to Y orientation due to coplanar slip instead of rotating toward G. Duggan et al. [2] observed that the T orientation and the matrix orientation of C rotate toward Y orientation. On this basis, the present work used the MTCS-model with the C orientation of to understand the development of Y orientation. Figure 7 and Figure 8 show the simulated {1 1 1} and {2 0 0} pole figures of 30%, 60%, and 90% reductions with initial single C orientation using the MTCS-model.
At 30% reduction, some of the initial C orientations either stay close to the C orientation of (90°, 37.7°, 45°) with 2.7° [1 0 1] misorientation or rotate to the orientation (270°, 69°, 45°) near T with 5.2° [1 0 1] misorientation due to twinning. The rotation angle and axis between simulated C and T is 60.0° [9 8 9] after 30% reduction.
At 60% reduction, most of the orientations rotate close to Y(270°, 63.6°, 45°) with a misorientation of 8.9° from the Y orientation because of slip. According to Asbeck et al. [36] and Hirsch et al. [4], the orientation of (270°, 74.2°, 45°)rotates toward the Y orientation of (270°, 54.7°, 45°) instead of moving toward the G orientation of (270°, 90°, 45°). The simulation results obtained from the MTCS-model are in agreement with those reported by Asbeck et al. and Hirsch et al. After 90% reduction, the major orientations rotate toward the Y orientation of (270°, 57.1°, 45°) with a misorientation of 2.4°. This path of orientation change is in agreement with the study of Hirsch et al. [4]. In summary, the C orientation of (1 1 2)[] rotates to the T orientation on (1 1 1) plane due to twinning at 30% reduction. After 60% reduction, the T orientation rotates toward Y orientation, which requires the coplanar slip systems of SS1(1 1 1)[], SS2(1 1 1)[], and SS3(1 1 1)[0] on the (1 1 1) plane. This change in orientation is shown in Figure 9.
4.3. Formation of Z Orientation
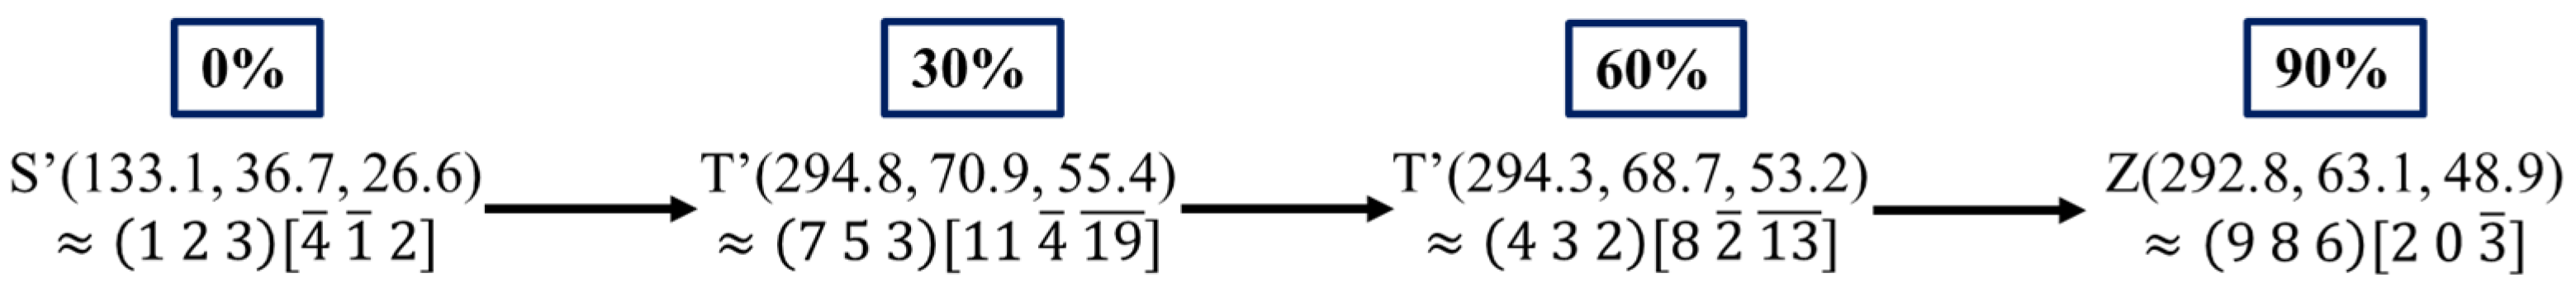
The formation of Z orientation is attributed to the twinning of S’(133.1°, 36.7°, 26.6°), which is close to S(121.0, 36.7, 26.6). Hirsch et al. [4] reported that after twinning, the S’ orientation leads to T’(313.1°, 36.7°, 26.6°), one of the symmetrically equivalent variants of S’. As a result, the TS’ and S’ orientations rotate toward Z orientation by coplanar slip. Thus, the MTCS-model with the S’ orientation of was used to understand the development of Z orientation. Figure 10 and Figure 11 show the simulated {1 1 1} and {2 0 0} pole figures of 30%, 60%, and 90% reductions with an initial single S’ orientation using the MTCS-model. After 30% reduction, some of the initial S’ orientations remain near S’(131.3°, 38.8°, 26.7°) with 2.9° [4 3 5] from the initial orientation. Owing to twinning, the other orientations rotate near T’(294°, 70.9°, 55.4°) with 4.0° [9 6 11] from the S’ orientation. The rotation angle and axis between simulated S’ and T’ is 60.0° [9 8 9] after 30% reduction. At 60% reduction, the S’ orientation of (127.5°, 38.7°, 26.8°) is still observed, and the other orientation is close to T’(294.3°, 68.7°, 53.2°). The former has a misorientation of 5.3° away from the S’ orientation, and the latter has a misorientation of 6.9° away from the T’ orientation. With increasing reduction from 30% to 60%, the T’ orientation rotates toward Z and decreases the misorientations from 18.7° to 16.3°.
At 90% reduction, most of the orientations rotate close to Z(292.8°, 63.1°, 48.9°) with a misorientation of 10.4°, and the orientation of S’ is still found. The increase in reduction from 60% to 90% decreases the misorientations between T’ and Z. Hirsch et al. [4] observed that the peak shift of S orientation leads to a large angle and a small angle. In the present simulation of the MTCS-model, the angle increases from the initial 26.7° to 31.5°, and the angle decreases from the initial 133.1° to 116.9°. This trend is in agreement with the observation of Hirsch et al.
The S’ orientation of rotates to the T’ orientation because of twinning on the twin plane of (1 1 1) at 30% reduction. At above 30% reduction, the T’ orientation rotates toward the final Z orientation as explained by the coplanar slip of SS1(1 1 1)[], SS2(1 1 1)[], and SS3(1 1 1)[ 0] further gliding on the (1 1 1) plane. This change in orientation is shown in Figure 12. Therefore, the combination of MT and coplanar slip in the TML region can be successfully simulated by the Taylor model to reveal the formation of Y and Z orientations observed in the experiments.
5. Conclusions
Conventional Taylor models including FC- and RC-models considering pure slip mechanism simulate strong copper-type textures. Both FC- and RC-models display preferred orientations close to C, S and B. Among the components, the volume fraction of C orientations is 2.45% higher in FC-model. With consideration of MT mechanism, the condition of partial slip and twinning leads to partial brass-type textures. Significantly decreased volume fraction of C and S were determined with 12.32% and 4.52%. In the meantime, the increased volume fraction of B and G with 8.53% and 2.11% indicates the formation of brass-type texture.
Considering MT and coplanar slip in the TML region in this study, a Taylor-based MTCS-model is proposed to simulate the rolling texture of Cu–30%Zn. Comparing with the results of MT-model, the volume fraction of C and S orientations was determined with 2.87% and 2.91% increase, respectively. In the meantime, the decreased volume fraction of B with 5.31% indicates the instability of B orientation. In addition to the β-fibers, the simulated results of the MTCS-model display the experimentally observed texture components including T, Y, and Z orientations, with corresponding volume fractions of 1.62%, 2.34%, and 2.36%, respectively.
Furthermore, we can successfully predict the reorientations of C-Y-T and S’-T’-Z by additionally considering twinning and then coplanar slip in the proposed MTCS-model. The Y and Z orientations, however, were not observed in the FC-, RC- and MT-models, but were found in the MTCS-model. Evolution of single C and S’ orientations further suggests the texture transition from copper-type to brass-type texture. The texture transitions from C to Y and from S’ to Z reveal the following. Considering the texture transition from C to Y, the C orientation of rotates toward T because of twinning after 30% reduction, after which the T orientation rotates toward Y and Y because of continued coplanar slip after reductions of 30% and 60%, respectively. In the case of the texture transition from S’ to Z, the S’ orientation of rotates toward T’ by twinning after 30% reduction, after which the T’ orientation rotates toward Z and Z because of continued coplanar slip after reductions of 30% and 60%, respectively.
Author Contributions
Conceptualization, S.-C.H. and J.-C.K.; methodology, S.-C.H., S.-Y.L. and J.-C.K.; software, S.-C.H., S.-Y.L. and P.-Y.H.; validation, S.-C.H. and J.-C.K.; formal analysis, S.-C.H.; investigation, S.-C.H., S.-Y.L. and J.-C.K.; resources, S.-C.H., S.-Y.L. and H.-J.C.; data curation, S.-C.H. and J.-C.K.; writing—original draft preparation, S.-C.H.; writing—review and editing, S.-C.H.; visualization, S.-C.H.; supervision, J.-C.K.; project administration, J.-C.K.; funding acquisition, J.-C.K. All authors have read and agreed to the published version of the manuscript.
Funding
This research was funded by Ministry of Science and Technology (Taiwan), grant number MOST 107-2221-E-006-018 and MOST 109-2221-E-006-131-MY2.
Data Availability Statement
Data available on request due to restrictions. The data presented in this study may be available on request from the corresponding author. The data are not publicly available due to the large amount of the data.
Acknowledgments
The authors would gratefully like to thank the Ministry of Science and Technology for supporting the fund of the project under MOST 107-2221-E-006-018 and MOST 109-2221-E-006-131-MY2.
Conflicts of Interest
The funders had no role in the design of the study; in the collection, analyses, or interpretation of data; in the writing of the manuscript, or in the decision to publish the results.
References
- Engler, O.; Randle, V. Introduction. In Introduction to Texture Analysis: Macrotexture, Microtexture, and Orientation Mapping, 2nd ed.; CRC Press: Boca Raton, FL, USA, 2010; pp. 5–7. [Google Scholar]
- Duggan, B.J.; Hatherly, M.; Hutchinson, W.B.; Wakefield, P.T. Deformation structures and textures in cold-rolled 70: 30 brass. Met. Sci. 1978, 12, 343–351. [Google Scholar] [CrossRef]
- Fargette, B.; Whitwham, D. Plastic Deformation of the Brass CuZn 30 by Heavy Rolling Reductions. Mem. Sci. Rev. Metall. 1976, 73, 197–206. [Google Scholar]
- Hirsch, J.; Lücke, K.; Hatherly, M. Overview no. 76: Mechanism of deformation and development of rolling textures in polycrystalline fcc metals—III. The influence of slip inhomogeneities and twinning. Acta Metall. 1988, 36, 2905–2927. [Google Scholar] [CrossRef]
- Hatherly, M.; Malin, A. Shear bands in deformed metals. Scr. Metall. 1984, 18, 449–454. [Google Scholar] [CrossRef]
- Malin, A.; Hatherly, M. Microstructure of cold-rolled copper. Met. Sci. 1979, 13, 463–472. [Google Scholar] [CrossRef]
- Wassermann, G. Der einfluss mechanischer zwillingsbildung auf die entstehung der walztexturen kubisch flachenzentrierter metalle. Z. Metallkunde 1963, 54, 61–65. [Google Scholar]
- Paul, H.; Morawiec, A.; Piątkowski, A.; Bouzy, E.; Fundenberger, J.J. Brass-type shear bands and their influence on texture formation. Metall. Mater. Trans. A 2004, 35, 3775–3786. [Google Scholar] [CrossRef]
- Paul, H.; Driver, J.H.; Maurice, C.; Jasieński, Z. Shear band microtexture formation in twinned face centred cubic single crystals. Mater. Sci. Eng. A 2003, 359, 178–191. [Google Scholar] [CrossRef]
- Sevillano, J.G.; van Houtte, P.; Aernoudt, E. Large strain work hardening and textures. Prog. Mater. Sci. 1980, 25, 69–134. [Google Scholar] [CrossRef]
- Van Houtte, P. A comprehensive mathematical formulation of an extended Taylor–Bishop–Hill model featuring relaxed constraints, the Renouard–Wintenberger theory and a strain rate sensitivity model. Texture Stress Microstruct. 1988, 8, 313–350. [Google Scholar] [CrossRef]
- van Houtte, P. On the equivalence of the relaxed Taylor theory and the Bishop-Hill theory for partially constrained plastic deformation of crystals. Mater. Sci. Eng. 1982, 55, 69–77. [Google Scholar] [CrossRef]
- Leffers, T.; Ray, R. The brass-type texture and its deviation from the copper-type texture. Prog. Mater. Sci. 2009, 54, 351–396. [Google Scholar] [CrossRef]
- Hirsch, J.; Lücke, K. Overview no. 76: Mechanism of deformation and development of rolling textures in polycrystalline fcc metals—II. Simulation and interpretation of experiments on the basis of Taylor-type theories. Acta Metall. 1988, 36, 2883–2904. [Google Scholar] [CrossRef]
- Leffers, T. The brass-type texture–how close are we to understand it. Mater. Sci. Forum 2012, 702, 216–223. [Google Scholar] [CrossRef]
- van Houtte, P. Simulation of the rolling and shear texture of brass by the Taylor theory adapted for mechanical twinning. Acta Metall. 1978, 26, 591–604. [Google Scholar] [CrossRef]
- Chin, G.; Hosford, W.; Mendorf, D. Accommodation of constrained deformation in fcc metals by slip and twinning. Proc. R. Soc. Lond. Ser. A 1969, 309, 433–456. [Google Scholar]
- Kallend, J.S. Quantitative Analysis of Texture Data; Cambridge University Press: Cambridge, UK, 1971. [Google Scholar]
- Leffers, T. The brass-type texture once again. In Proceedings of the 11th International Conference on Textures of Materials, Xian, China, 16–20 September 1996; International Academic Publishers: Beijing, China, 1996; pp. 299–306. [Google Scholar]
- Leffers, T. On the development of the brass-type texture. Textures Microstruct. 1970, 22, 53–58. [Google Scholar] [CrossRef] [Green Version]
- Kalidindi, S.R. Incorporation of deformation twinning in crystal plasticity models. J. Mech. Phys. Solids 1998, 46, 267–290. [Google Scholar] [CrossRef]
- Kalidindi, S.R. Modeling anisotropic strain hardening and deformation textures in low stacking fault energy fcc metals. Int. J. Plast. 2001, 17, 837–860. [Google Scholar] [CrossRef]
- Lebensohn, R.A.; Tomé, C. A self-consistent viscoplastic model: Prediction of rolling textures of anisotropic polycrystals. Mater. Sci. Eng. A 1994, 175, 71–82. [Google Scholar] [CrossRef] [Green Version]
- Lebensohn, R.A.; Tomé, C.; Castaneda, P.P. Self-consistent modelling of the mechanical behaviour of viscoplastic polycrystals incorporating intragranular field fluctuations. Philos. Mag. 2007, 87, 4287–4322. [Google Scholar] [CrossRef]
- Toth, L.S.; Haase, C.; Allen, R.; Lapovok, R.; Molodov, D.A.; Cherkaoui, M.; el Kadiri, H. Modeling the effect of primary and secondary twinning on texture evolution during severe plastic deformation of a twinning-induced plasticity steel. Materials 2018, 11, 863. [Google Scholar] [CrossRef] [Green Version]
- Chalapathi, D.; Sivaprasad, P.; Kanjarla, A.K. Role of deformation twinning and second phase on the texture evolution in a duplex stainless steel during cold rolling: Experimental and modelling study. Mater. Sci. Eng. A 2020, 780, 139–155. [Google Scholar] [CrossRef]
- Leffers, T.; Bilde-Sørensen, J. Intra-and intergranular heterogeneities in the plastic deformation of brass during rolling. Acta Metall. Mater. 1990, 38, 1917–1926. [Google Scholar] [CrossRef]
- Duggan, B.; Hutchinson, W.; Hatherly, M. Recrystallization studies in 70: 30 brass using a high voltage electron microscope. Scr. Metall. 1978, 12, 293–295. [Google Scholar] [CrossRef]
- Hutchinson, W.; Duggan, B.; Hatherly, M. Development of deformation texture and microstructure in cold-rolled Cu–30Zn. Met. Technol. 1979, 6, 398–403. [Google Scholar] [CrossRef]
- Donadille, C.; Valle, R.; Dervin, P.; Penellel, R. Development of texture and microstructure during cold-rolling and annealing of FCC alloys: Example of an austenitic stainless steel. Acta Metall. 1989, 37, 1547–1571. [Google Scholar] [CrossRef]
- Paul, H.; Morawiec, A.; Driver, J.H.; Bouzy, E. On twinning and shear banding in a Cu–8 at.% Al alloy plane strain compressed at 77 K. Int. J. Plast. 2009, 25, 1588–1608. [Google Scholar] [CrossRef]
- van Houtte, P.; Aernoudt, E. Considerations on crystal and strain symmetry in calculation of deformation textures with taylor theory. Mater. Sci. Eng. 1976, 23, 11–22. [Google Scholar] [CrossRef]
- Taylor, G.I. Plastic strain in metals. J. Inst. Metals 1938, 62, 307–324. [Google Scholar]
- Hirsch, J.; Lucke, K. Mechanism of Deformation and Development of Rolling Textures in Polycrystalline, F.C.C. Metals. I. Description of Rolling Texture Development in Homogeneous CuZn Alloys. Acta Metall. 1988, 36, 2863–2882. [Google Scholar] [CrossRef]
- Madhavan, R.; Ray, R.K.; Suwas, S. Texture transition in cold-rolled nickel–40 wt.% cobalt alloy. Acta Mater. 2014, 74, 151–164. [Google Scholar] [CrossRef]
- Asbeck, H.; Mecking, H. Influence of friction and geometry of deformation on texture inhomogeneities during rolling of Cu single crystals as an example. Mater. Sci. Eng. 1978, 34, 111–119. [Google Scholar] [CrossRef]
Figure 1.
Flowchart of subroutine in MT-model.
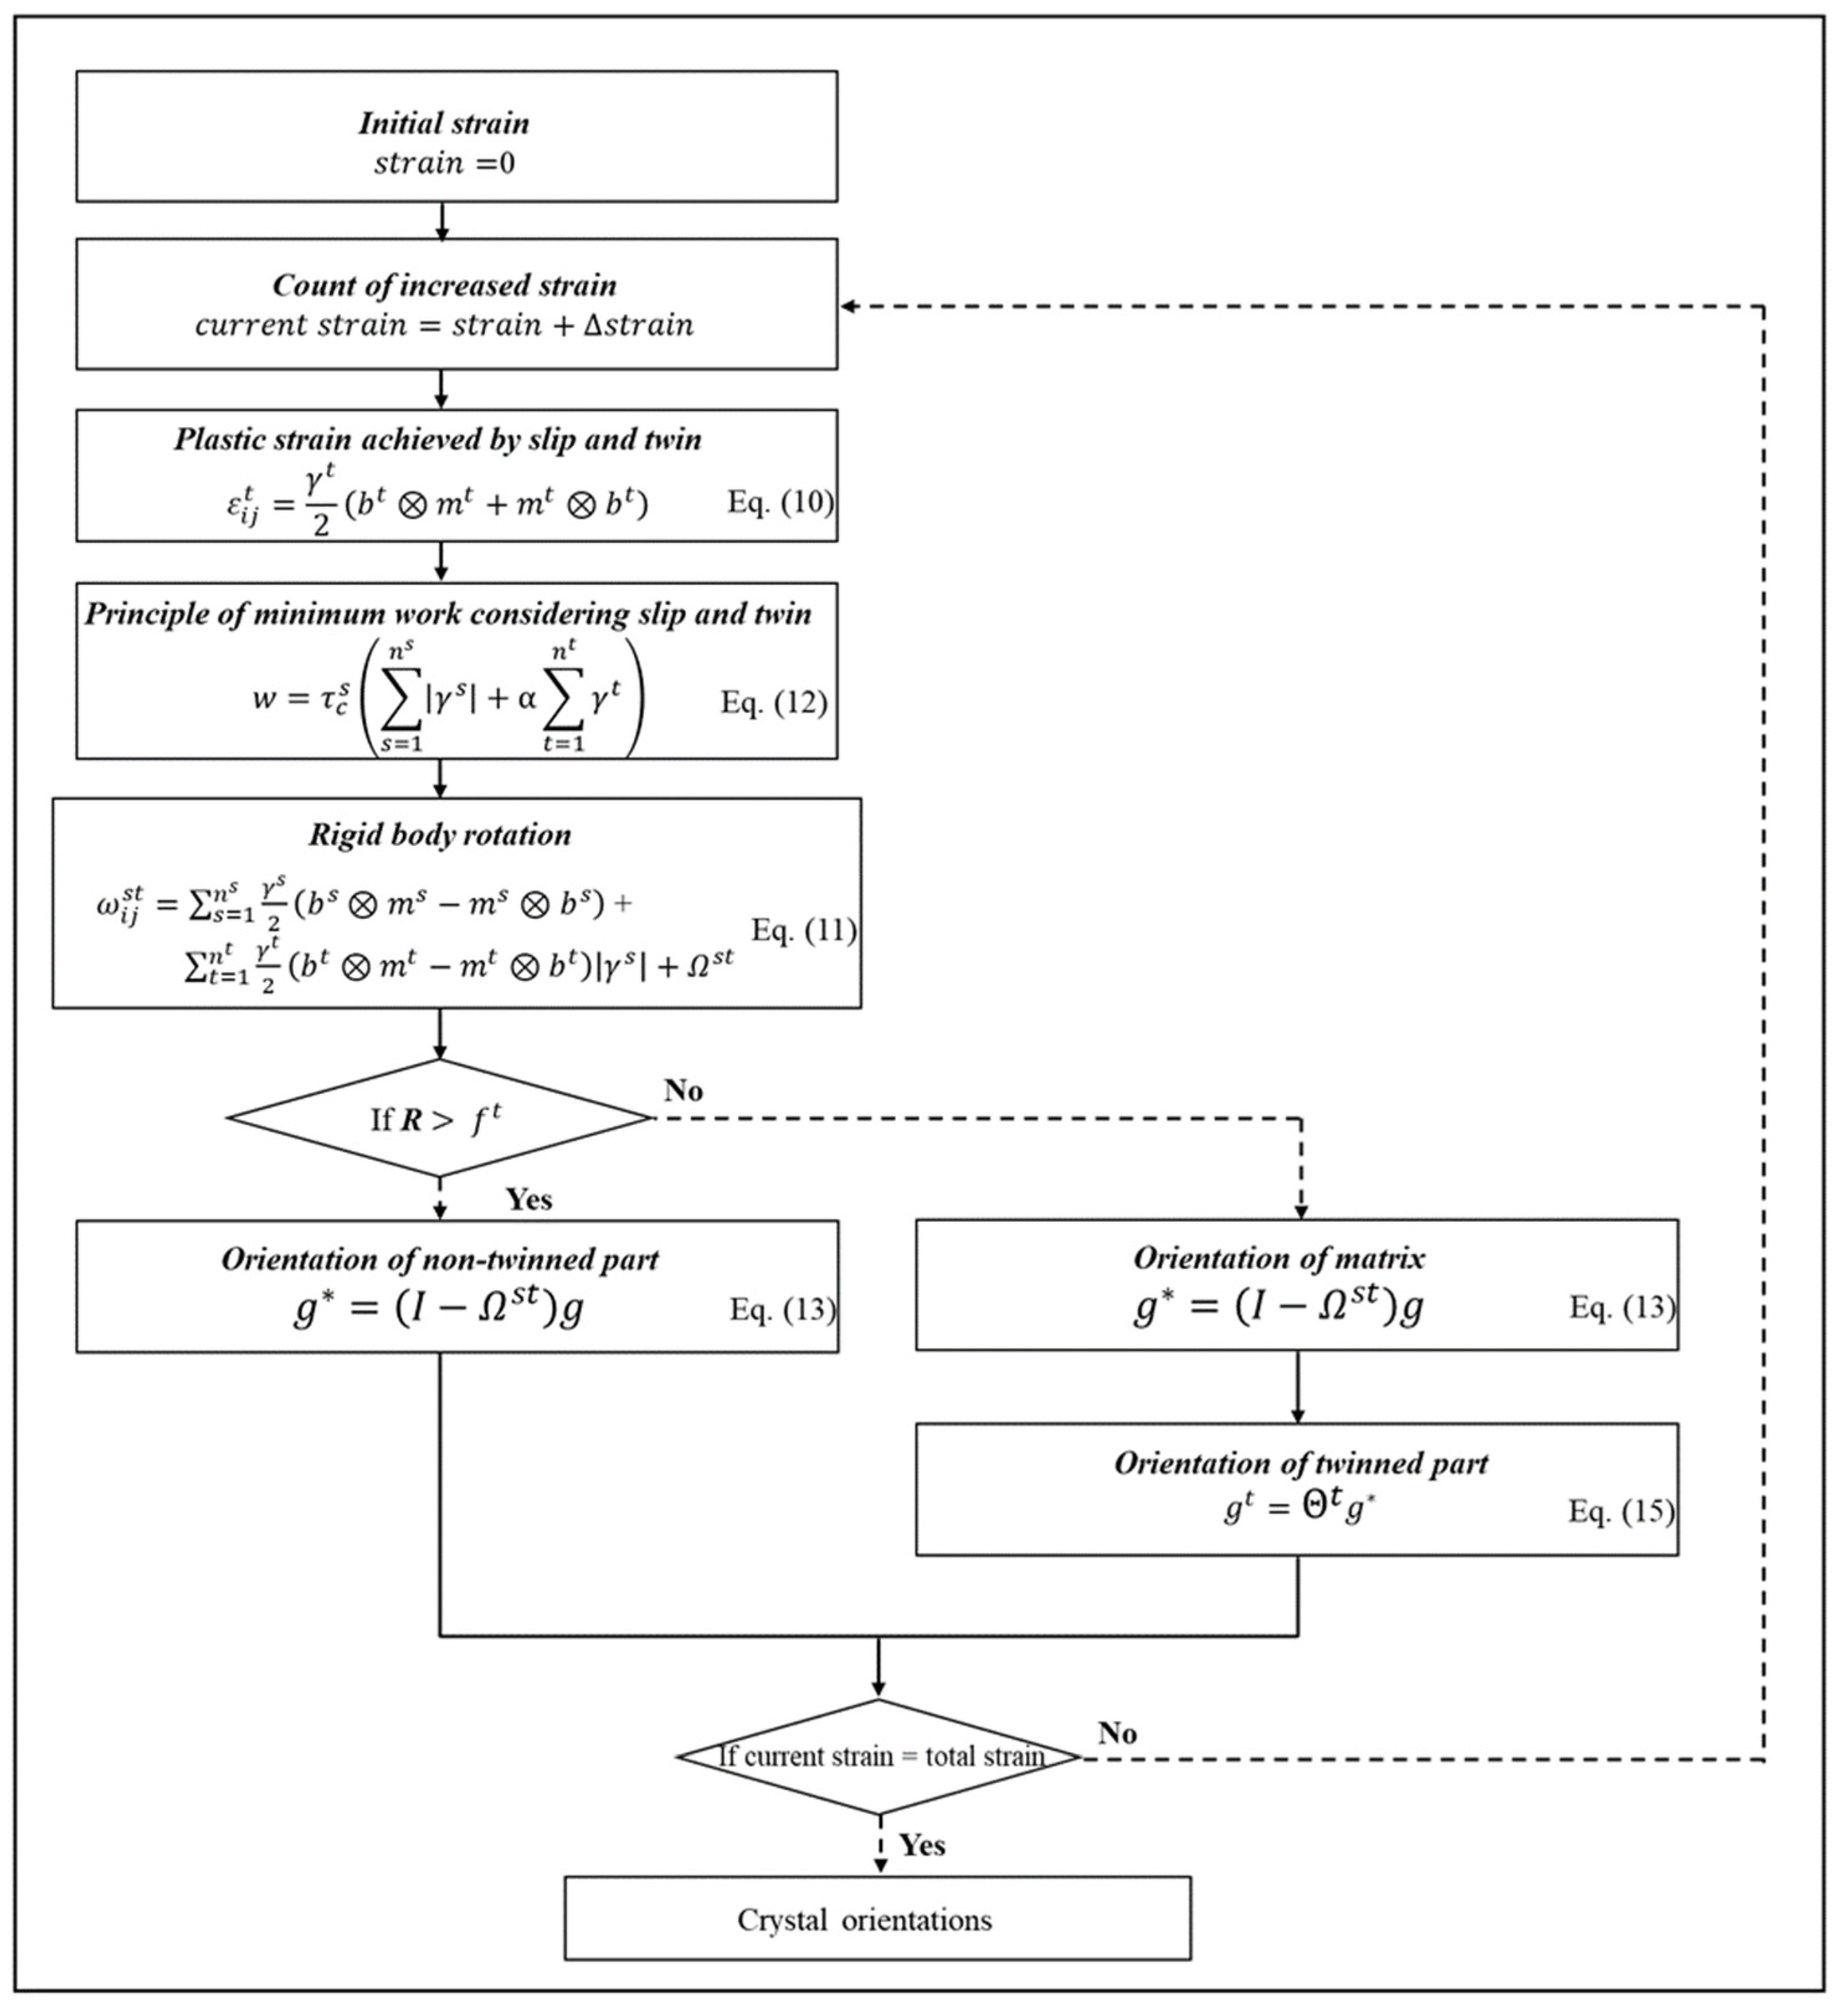
Figure 2.
Flowchart of subroutine in MTCS-model.
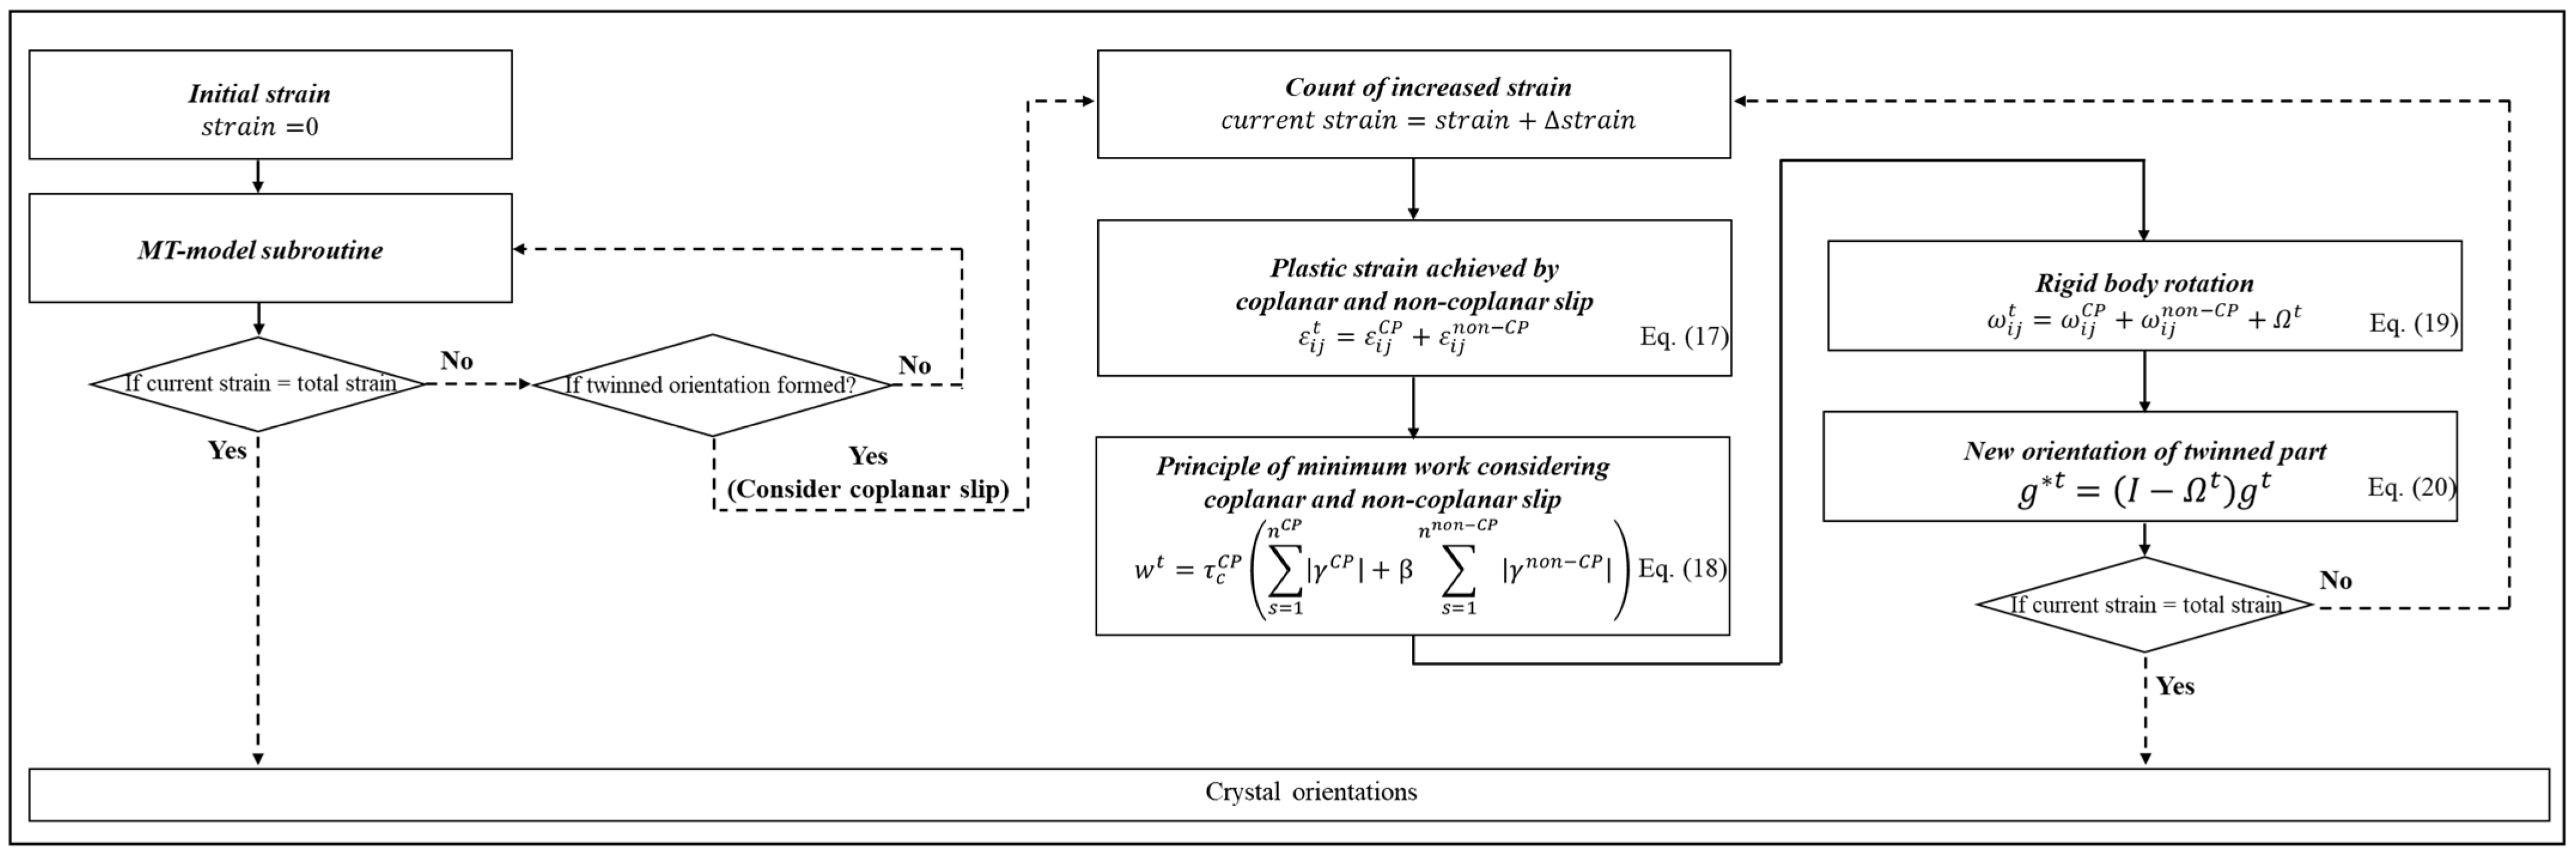
Figure 3.
The {1 1 1} pole figures of fcc metals simulated using (a) FC-, (b) RC-, (c) MT-, and (d) MTCS-models with random orientations up to 90% reduction and (e) after 90% cold-rolled in Cu–30%Zn alloy obtained from XRD measurements.
Figure 3.
The {1 1 1} pole figures of fcc metals simulated using (a) FC-, (b) RC-, (c) MT-, and (d) MTCS-models with random orientations up to 90% reduction and (e) after 90% cold-rolled in Cu–30%Zn alloy obtained from XRD measurements.
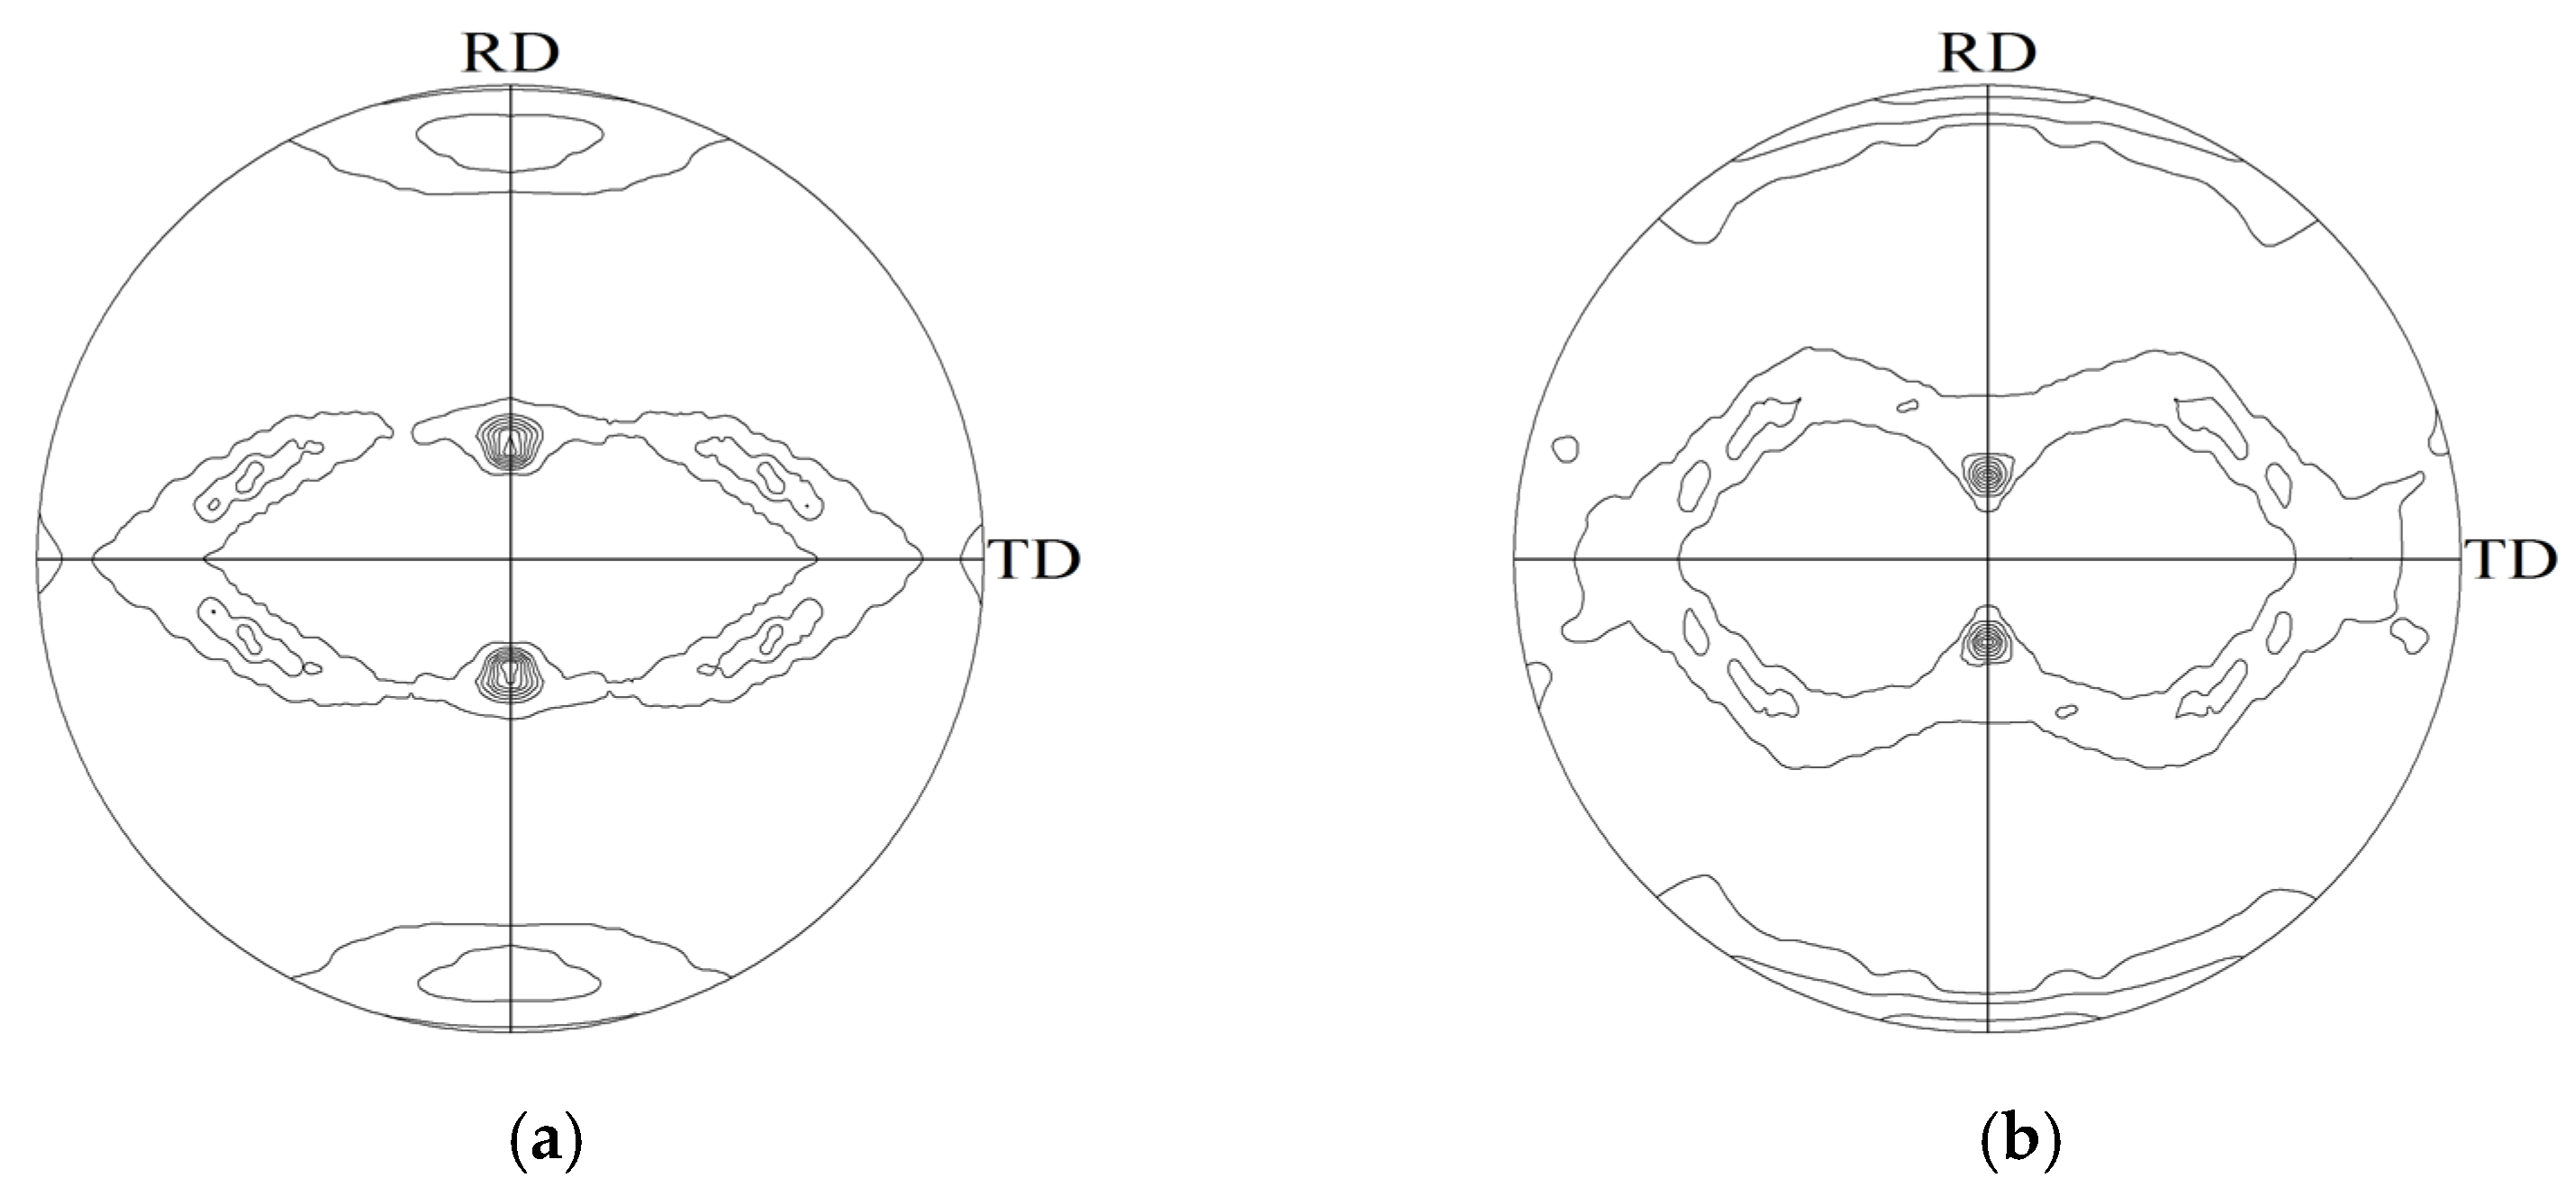

Figure 4.
ODFs of fcc metals simulated using (a) FC-, (b) RC-, (c) MT-, and (d) MTCS-models with random orientations to 90% reduction. (e) ODF of 90% cold-rolled Cu–30%Zn from XRD measurements. The letters indicate specific orientations.
Figure 4.
ODFs of fcc metals simulated using (a) FC-, (b) RC-, (c) MT-, and (d) MTCS-models with random orientations to 90% reduction. (e) ODF of 90% cold-rolled Cu–30%Zn from XRD measurements. The letters indicate specific orientations.
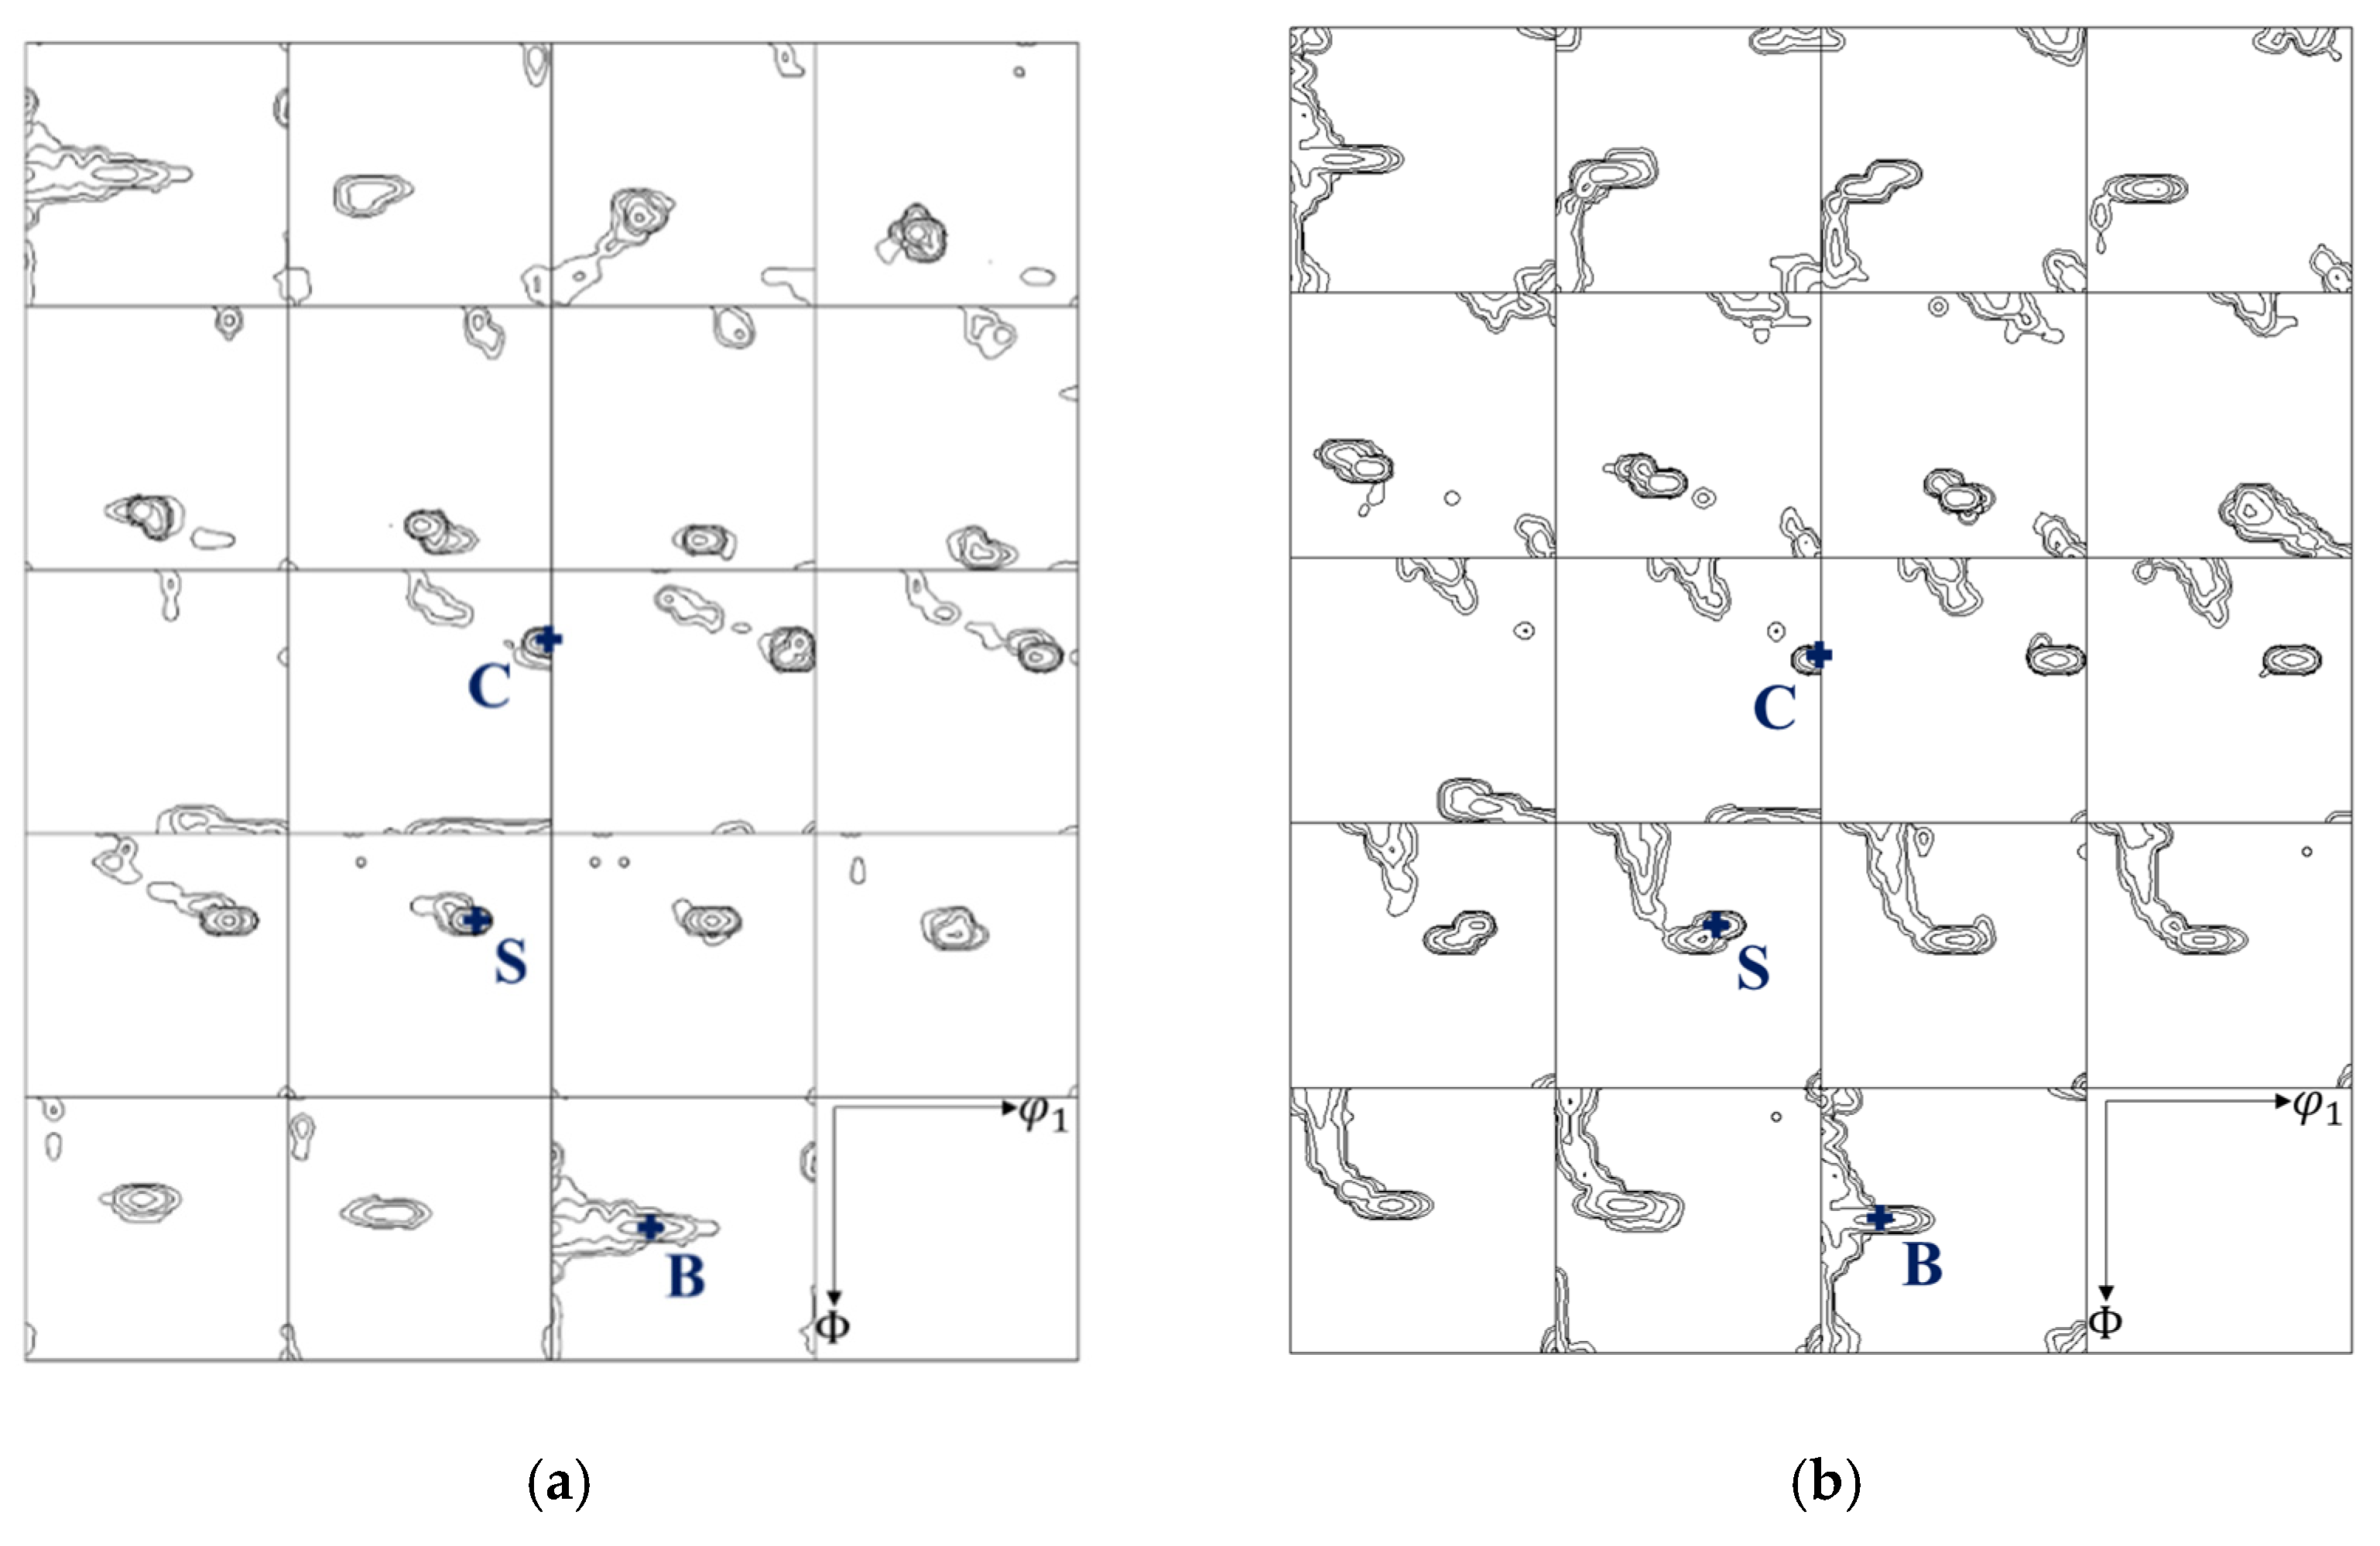
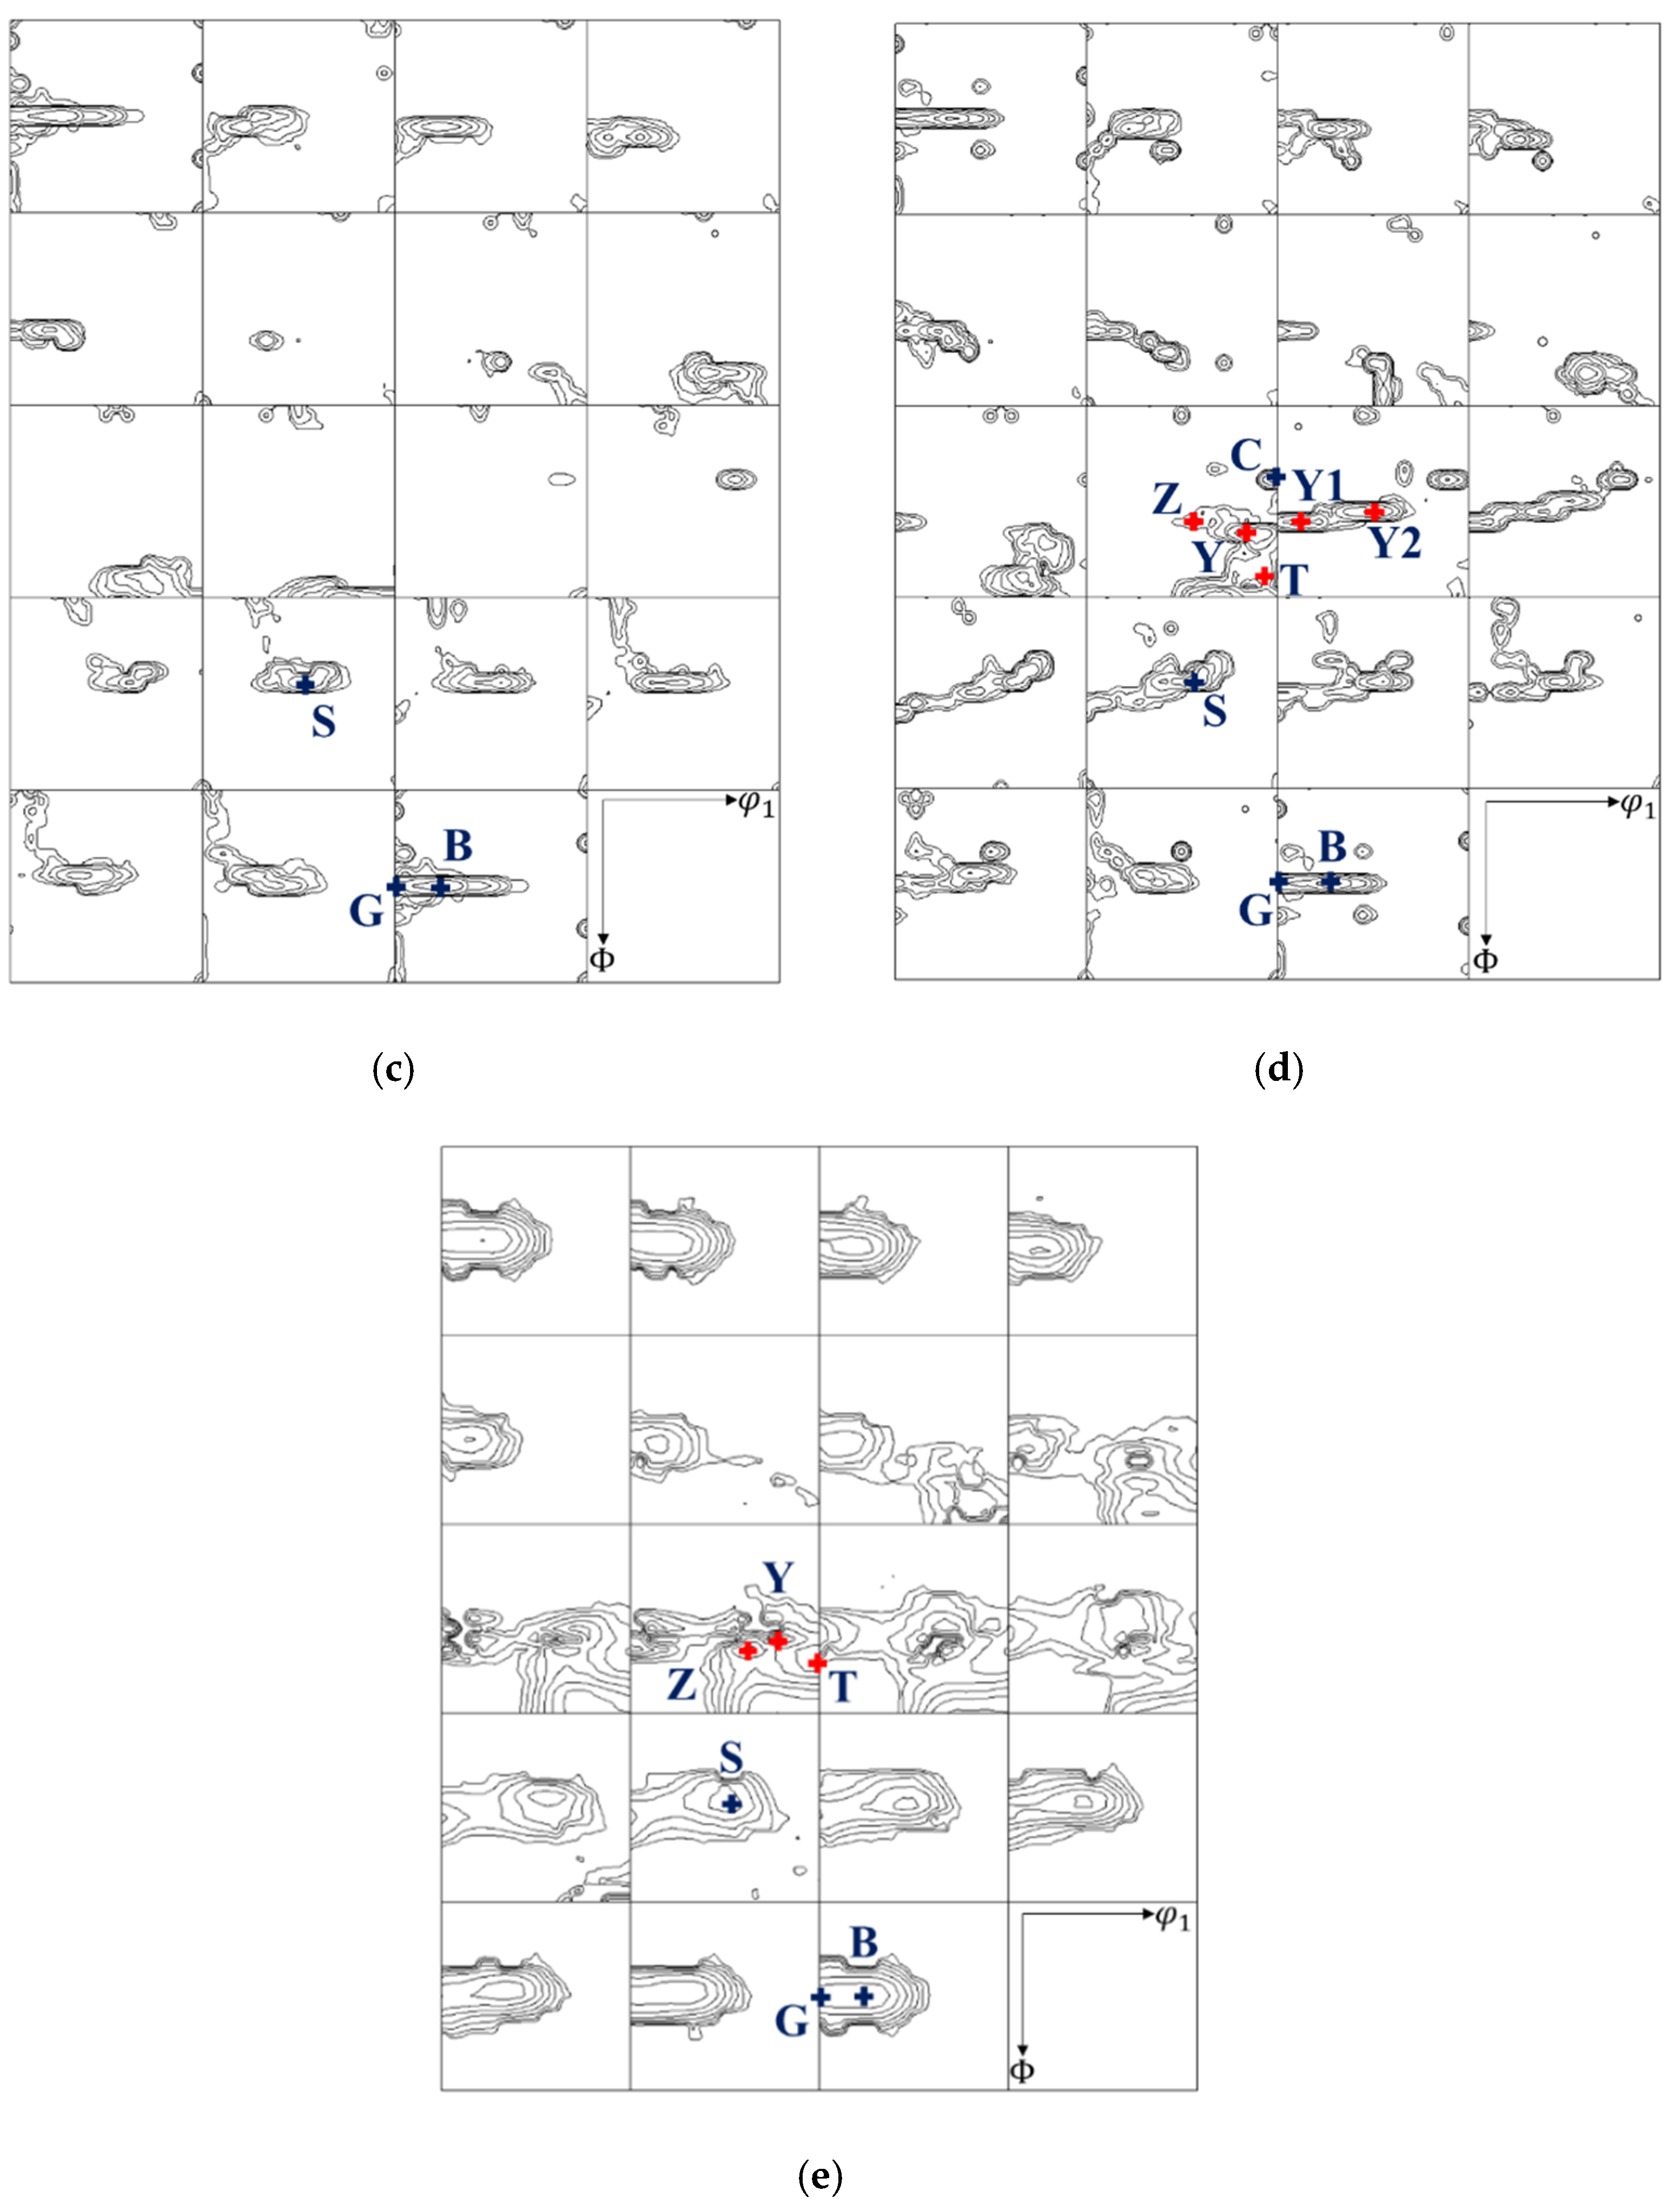
Figure 5.
The activity plot of the slip and twin systems for (a) MT-model and (b) MTCS-model.

Figure 6.
Volume fractions of specific orientations of rolling texture simulated using (a) FC-, (b) RC-, (c) MT-, and (d) MTCS-models and (e) from XRD measurements in Cu–30%Zn alloy after 90% reduction.
Figure 6.
Volume fractions of specific orientations of rolling texture simulated using (a) FC-, (b) RC-, (c) MT-, and (d) MTCS-models and (e) from XRD measurements in Cu–30%Zn alloy after 90% reduction.
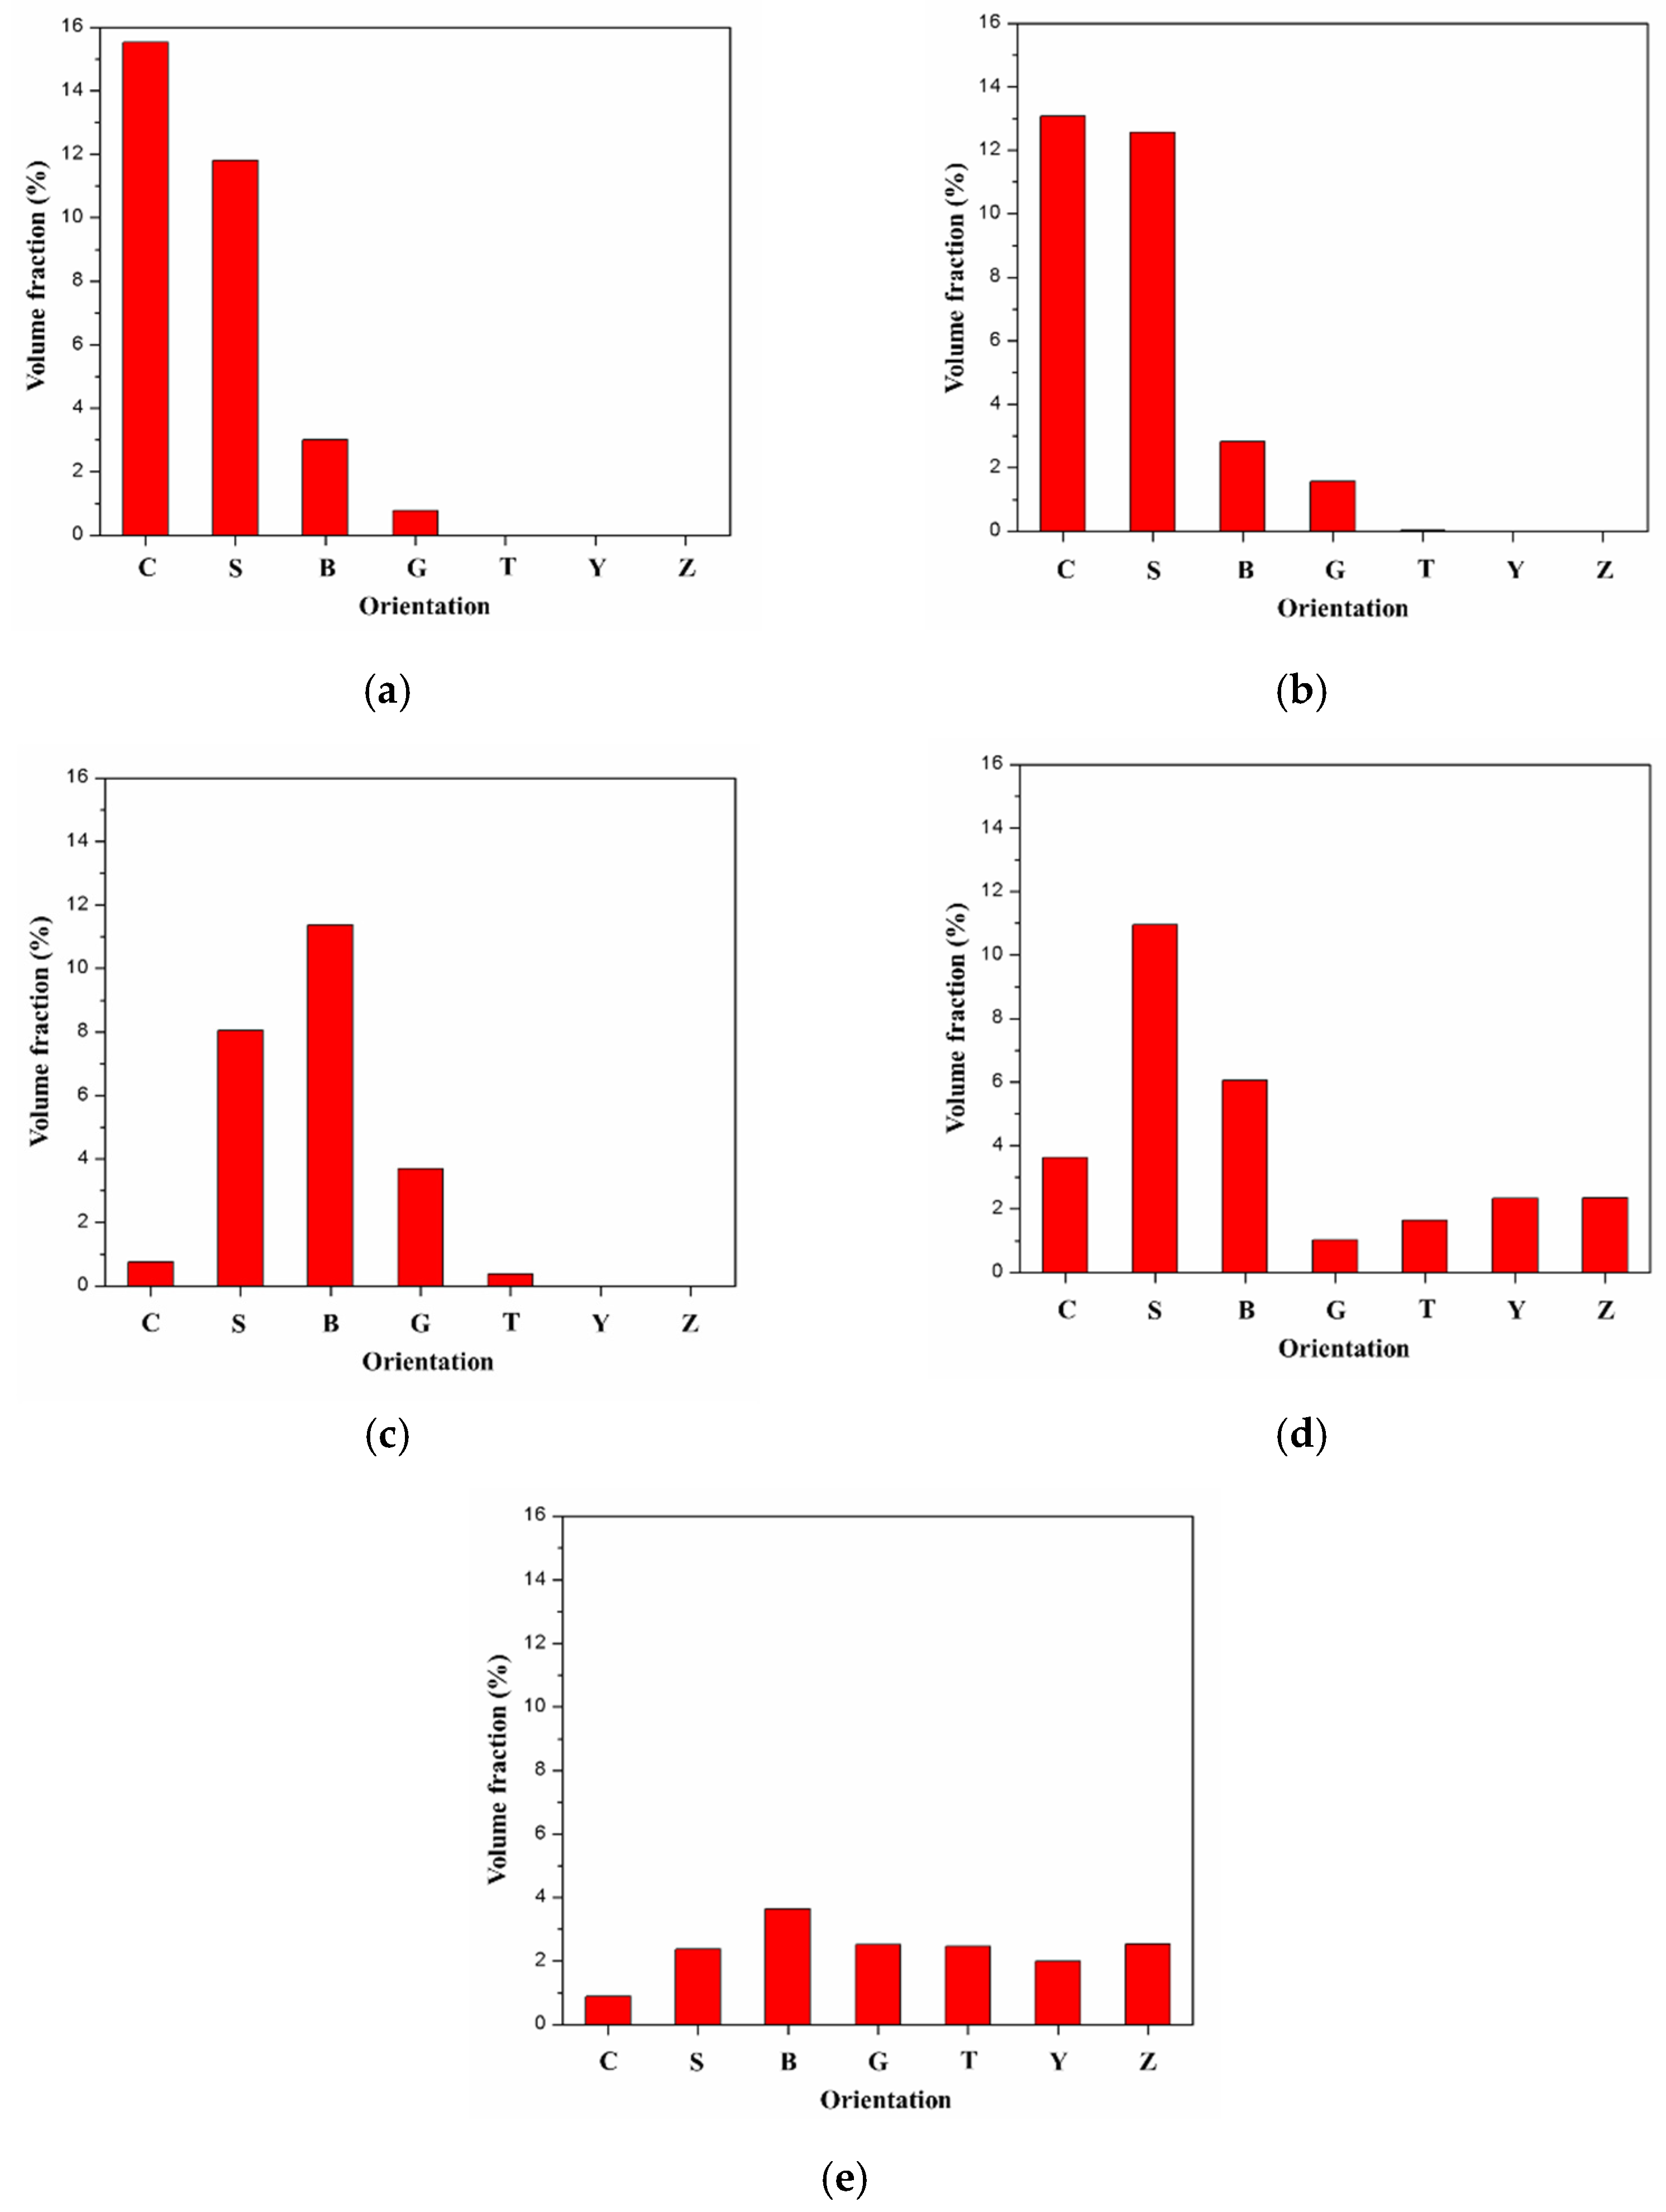
Figure 7.
The {1 1 1} pole figures of fcc metals simulated using MTCS-model with single C orientation after the reduction ratios of (a) 30%, (b) 60%, and (c) 90%. △, ▲, and ◆ are the pole positions on {1 1 1} pole figure of the orientation close to C, T, and Y, respectively.
Figure 7.
The {1 1 1} pole figures of fcc metals simulated using MTCS-model with single C orientation after the reduction ratios of (a) 30%, (b) 60%, and (c) 90%. △, ▲, and ◆ are the pole positions on {1 1 1} pole figure of the orientation close to C, T, and Y, respectively.
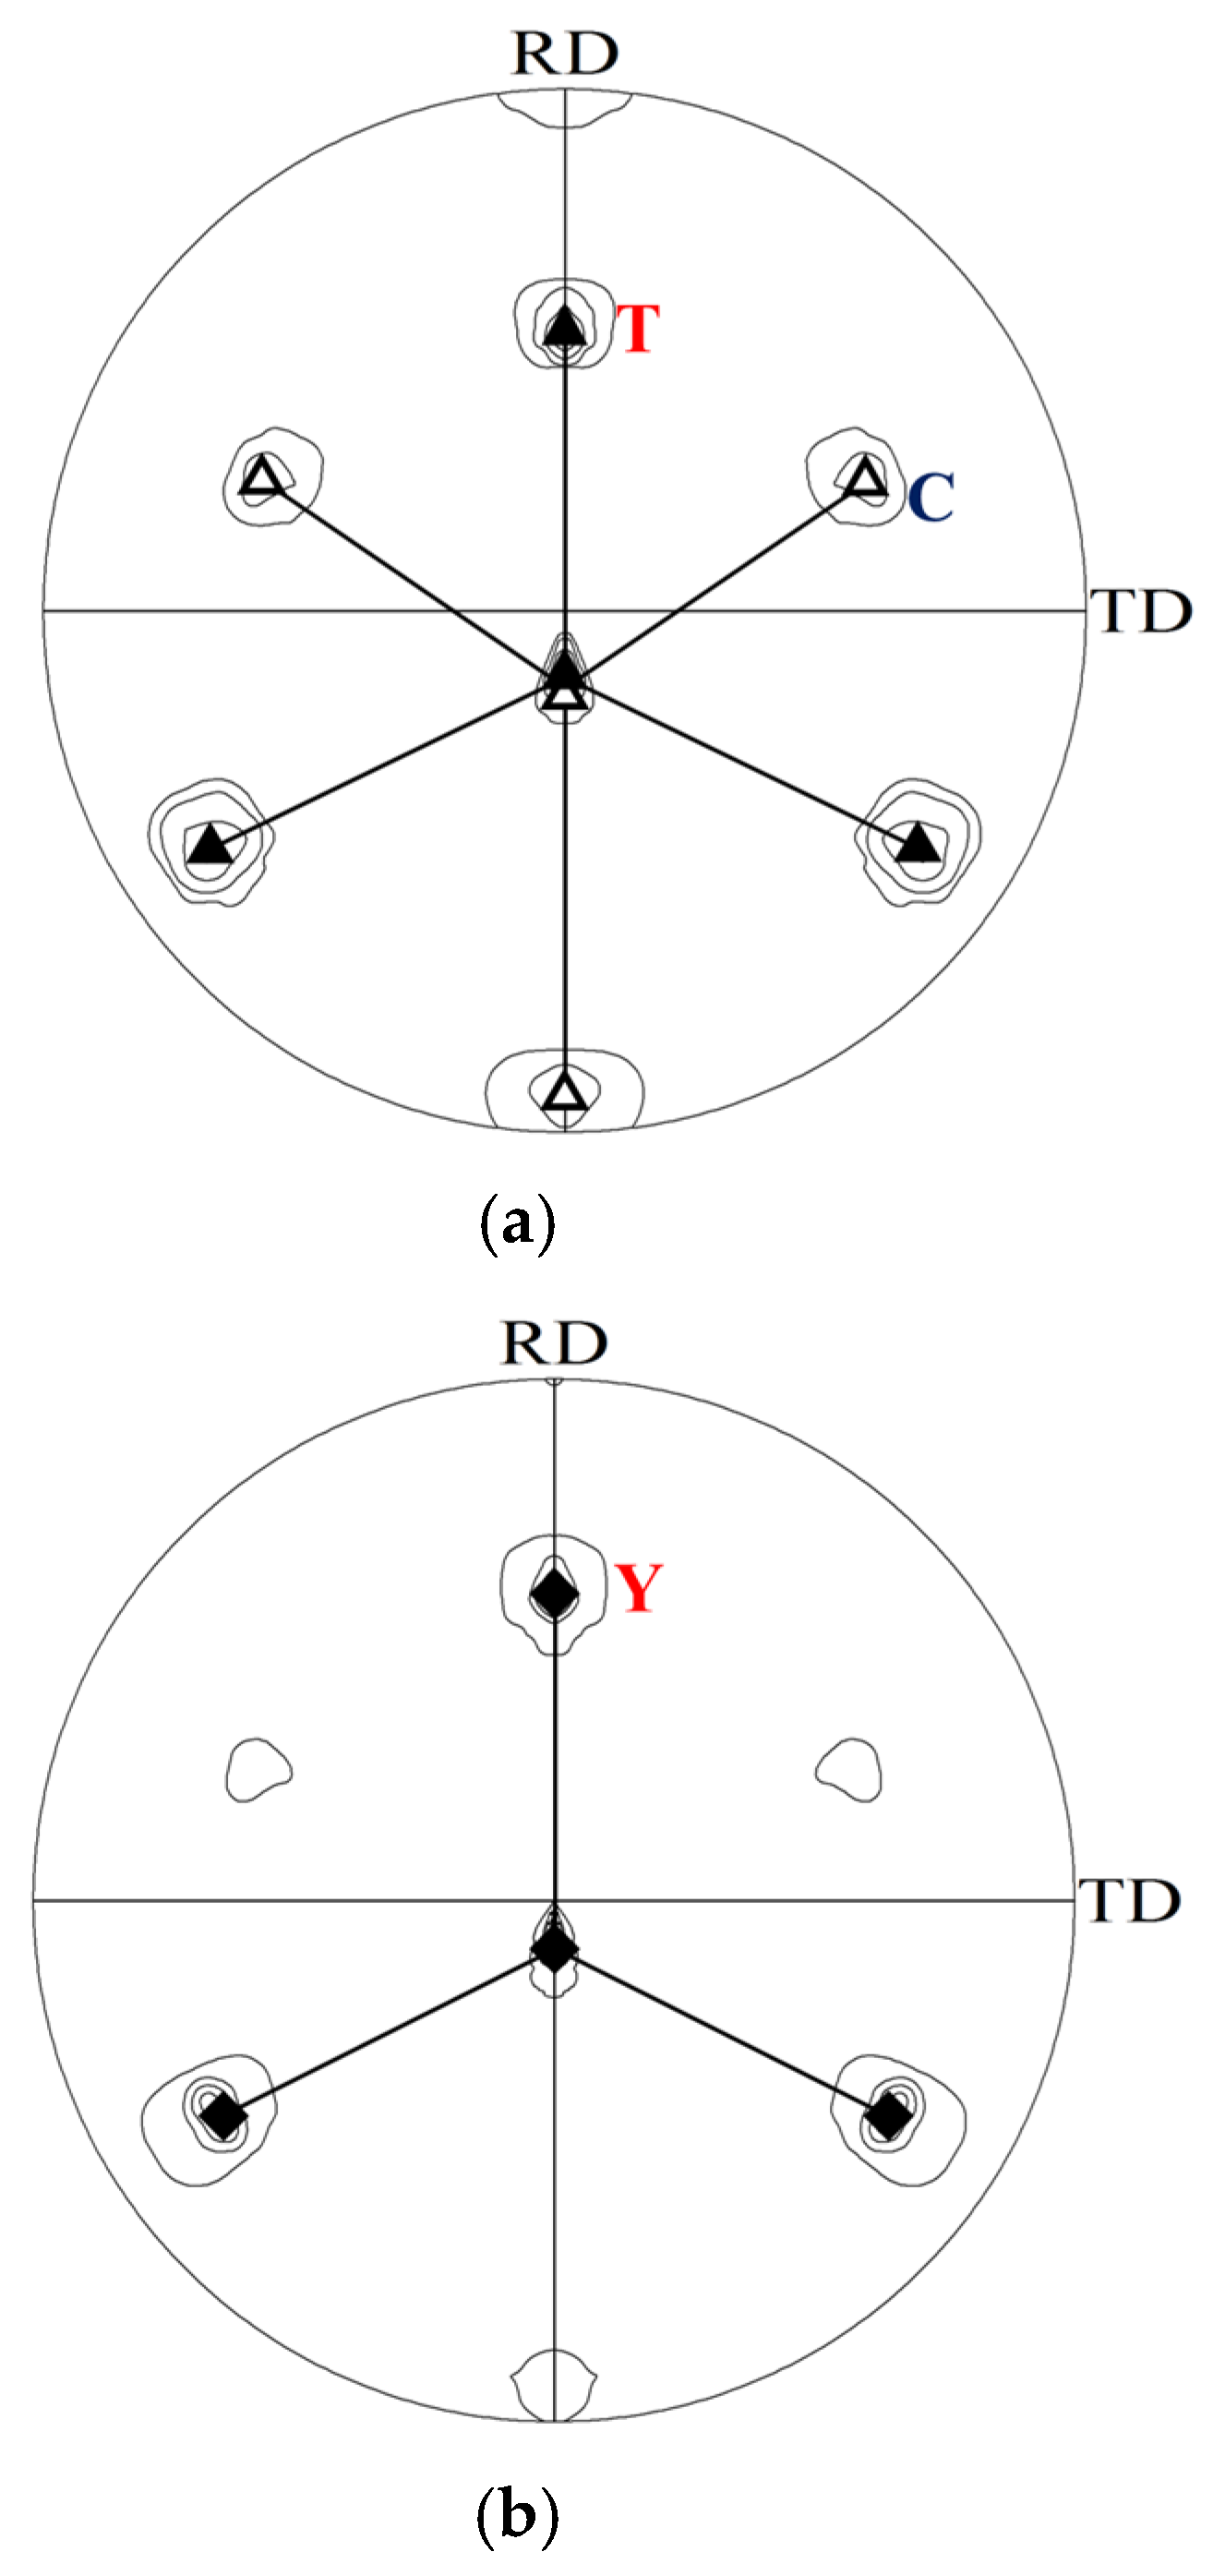
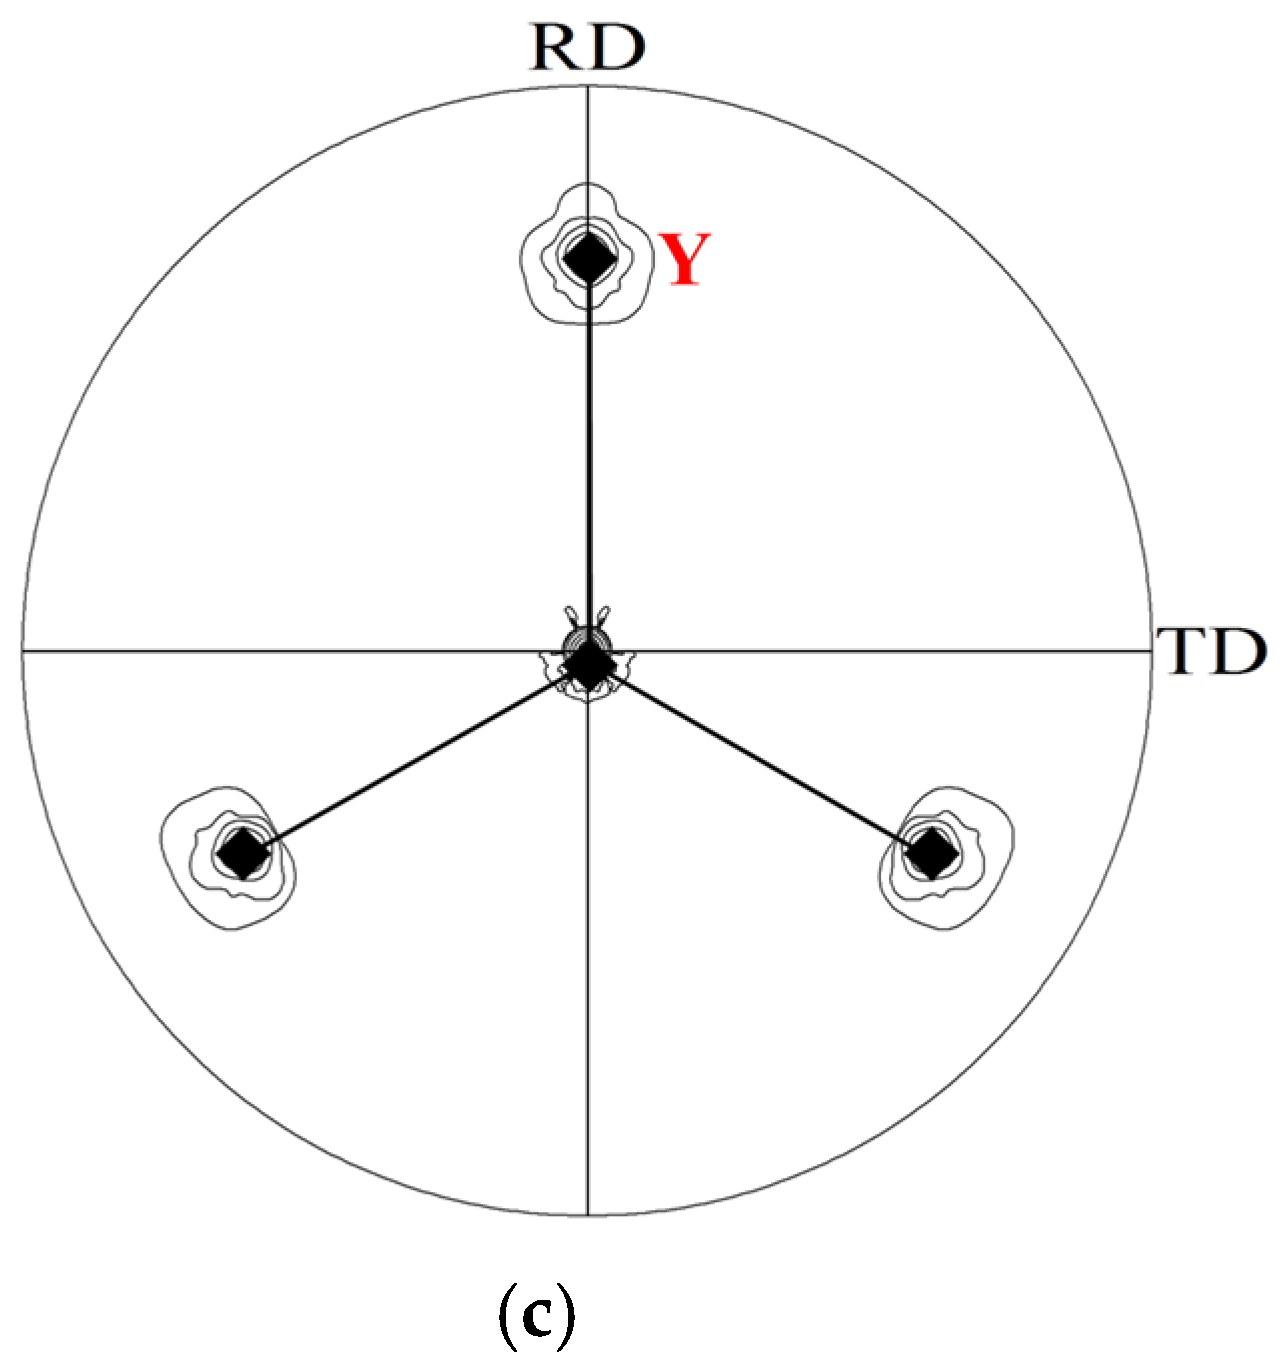
Figure 8.
The {2 0 0} pole figures of fcc metals simulated using MTCS-model with single C orientation after the reduction ratios of (a) 30%, (b) 60%, and (c) 90%. △, ▲, and ◆ are the pole positions on {2 0 0} pole figure of the orientation close to C, T, and Y, respectively.
Figure 8.
The {2 0 0} pole figures of fcc metals simulated using MTCS-model with single C orientation after the reduction ratios of (a) 30%, (b) 60%, and (c) 90%. △, ▲, and ◆ are the pole positions on {2 0 0} pole figure of the orientation close to C, T, and Y, respectively.


Figure 9.
Orientation evolution of Y orientation simulated with MCTS-model.
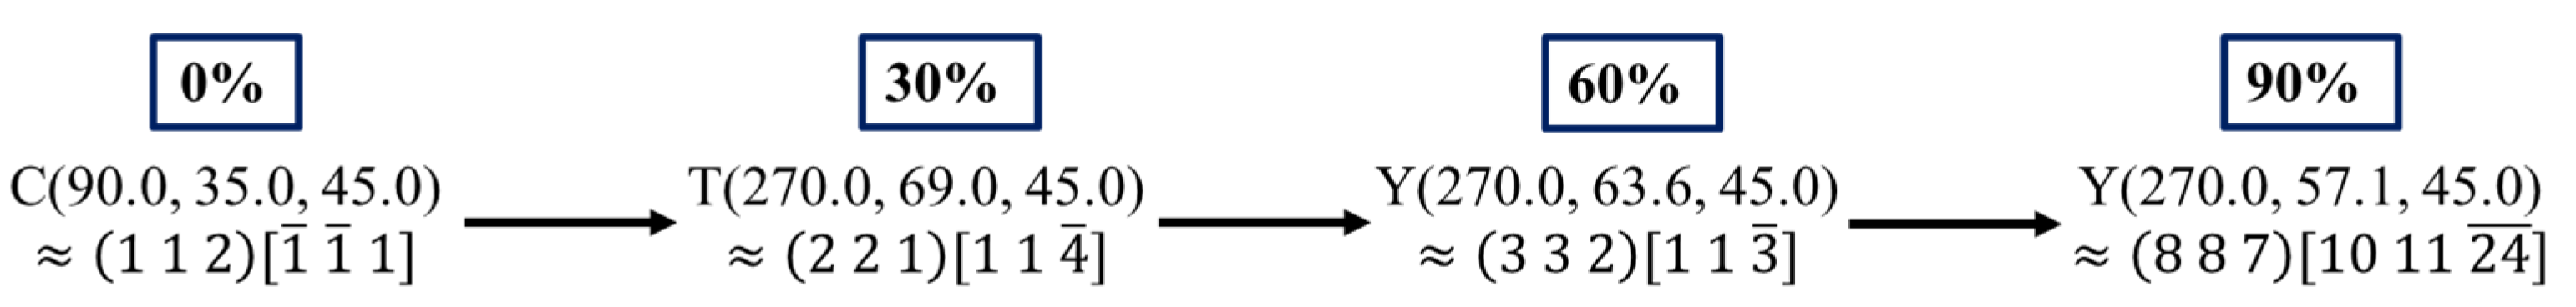
Figure 10.
The {1 1 1} pole figures of fcc metal simulated using MTCS-model with single S’ orientation after the reduction ratios of (a) 30%, (b) 60%, and (c) 90%. ○, ●, and ■ are the pole positions on {1 1 1} pole figure of the orientation close to S’, T’, and Z, respectively.
Figure 10.
The {1 1 1} pole figures of fcc metal simulated using MTCS-model with single S’ orientation after the reduction ratios of (a) 30%, (b) 60%, and (c) 90%. ○, ●, and ■ are the pole positions on {1 1 1} pole figure of the orientation close to S’, T’, and Z, respectively.

Figure 11.
The {2 0 0} pole figures of fcc metal simulated using MTCS-model with single S’ orientation after the reduction ratios of (a) 30%, (b) 60%, and (c) 90%. ○, ●, and ■ are the pole positions on {2 0 0} pole figure of the orientation close to S’, T’, and Z, respectively.
Figure 11.
The {2 0 0} pole figures of fcc metal simulated using MTCS-model with single S’ orientation after the reduction ratios of (a) 30%, (b) 60%, and (c) 90%. ○, ●, and ■ are the pole positions on {2 0 0} pole figure of the orientation close to S’, T’, and Z, respectively.
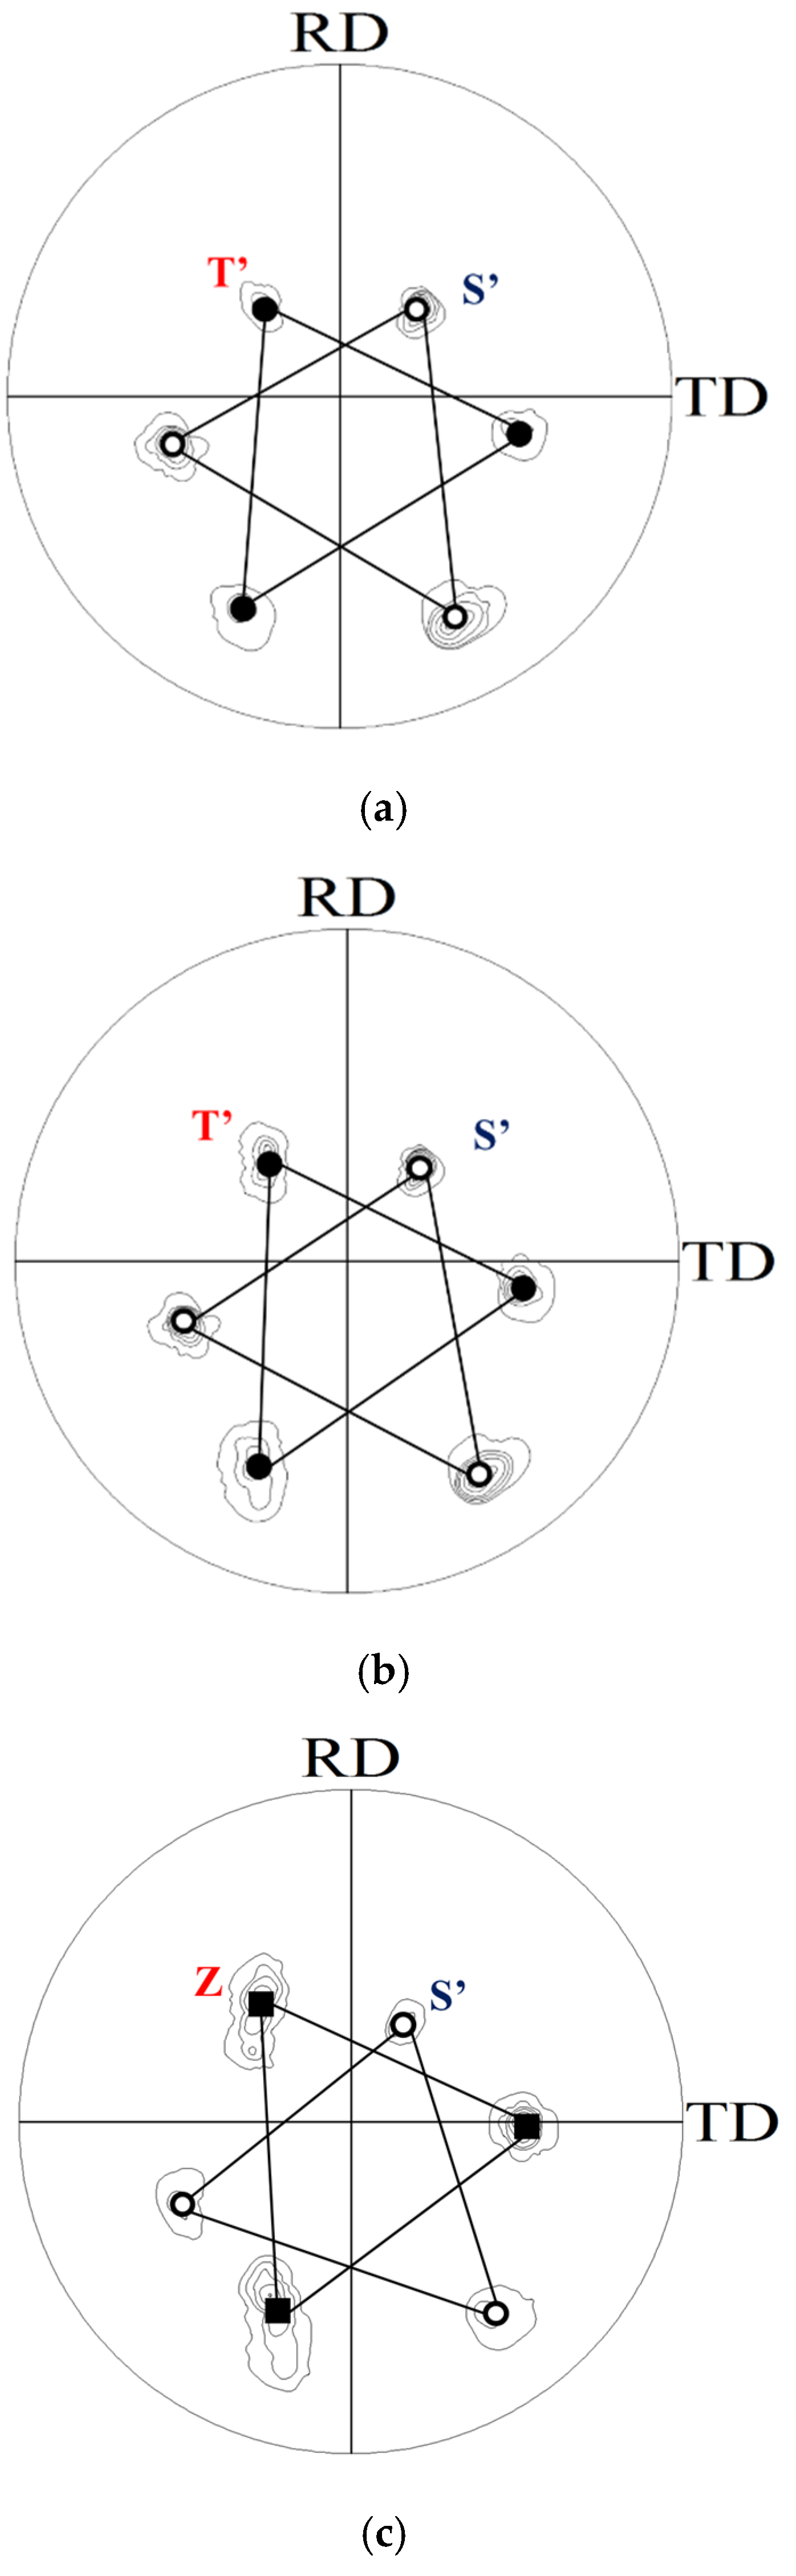
Figure 12.
Orientation evolution of Z orientation simulated with MCTS-model.


Table 1.
Twelve slip and twin systems of fcc metals used in the models.
| Slip System | Slip Plane | Slip Direction | Twin System | Twin Plane | Twin Direction |
|---|---|---|---|---|---|
| SS1 | (1 1 1) | TS1 | |||
| SS2 | TS2 | ||||
| SS3 | TS3 | ||||
| SS4 | TS4 | ||||
| SS5 | TS5 | ||||
| SS6 | TS6 | ||||
| SS7 | TS7 | ||||
| SS8 | TS8 | ||||
| SS9 | TS9 | ||||
| SS10 | TS10 | ||||
| SS11 | TS11 | ||||
| SS12 | TS12 |
Table 2.
Major orientation components predicted with random orientations using FC-, RC-, MT-, and MTCS-models after 90% reduction.
Table 2.
Major orientation components predicted with random orientations using FC-, RC-, MT-, and MTCS-models after 90% reduction.
| Reduction | Model | Preferred Orientation | |||||
|---|---|---|---|---|---|---|---|
| C | S | B | T | Y | Z | ||
| 90% | FC | (90.0, 24.9, 45.0) | (64.9, 30.0, 65.0) | (34.6, 45.2, 0.0) | - | - | - |
| RC | (90.0, 35.1, 45.0) | (54.9, 35.1, 65.0) | (19.8, 45.1, 90.0) | - | - | - | |
| MT | - | (50.1, 40.0, 65.0) | (24.8, 45.0, 90.0) | - | - | - | |
| MTCS | (90.0, 35.2, 45.0) | (50.8, 40.0, 65.0) | (25.2, 45.1, 90.0) | (85.1, 80.1, 45.0) | (75.4, 60.2, 45.0) | (49.8, 55.1, 45.0) | |
Publisher’s Note: MDPI stays neutral with regard to jurisdictional claims in published maps and institutional affiliations. |
© 2021 by the authors. Licensee MDPI, Basel, Switzerland. This article is an open access article distributed under the terms and conditions of the Creative Commons Attribution (CC BY) license (https://creativecommons.org/licenses/by/4.0/).
Share and Cite
MDPI and ACS Style
Hsiao, S.-C.; Lin, S.-Y.; Chen, H.-J.; Hsieh, P.-Y.; Kuo, J.-C. Rolling Texture of Cu–30%Zn Alloy Using Taylor Model Based on Twinning and Coplanar Slip. Crystals 2021, 11, 1351. https://doi.org/10.3390/cryst11111351
AMA Style
Hsiao S-C, Lin S-Y, Chen H-J, Hsieh P-Y, Kuo J-C. Rolling Texture of Cu–30%Zn Alloy Using Taylor Model Based on Twinning and Coplanar Slip. Crystals. 2021; 11(11):1351. https://doi.org/10.3390/cryst11111351
Chicago/Turabian StyleHsiao, Shih-Chieh, Sin-Ying Lin, Huang-Jun Chen, Ping-Yin Hsieh, and Jui-Chao Kuo. 2021. "Rolling Texture of Cu–30%Zn Alloy Using Taylor Model Based on Twinning and Coplanar Slip" Crystals 11, no. 11: 1351. https://doi.org/10.3390/cryst11111351
Note that from the first issue of 2016, this journal uses article numbers instead of page numbers. See further details here.