Review

Review and Recalculation of Growth and Nucleation Kinetics for Calcite, Vaterite and Amorphous Calcium Carbonate

by
Luke Bergwerff
1 and
Leon A. van Paassen
2,*
1
Faculty of Civil Engineering and Geosciences, Delft University of Technology, Stevinweg 1, 2628 CN Delft, The Netherlands
2
School of Sustainable Engineering and the Built Environment, Arizona State University, 650 E Tyler Mall, Tempe, AZ 85287-3005, USA
*
Author to whom correspondence should be addressed.
Crystals 2021, 11(11), 1318; https://doi.org/10.3390/cryst11111318
Submission received: 22 July 2021 / Revised: 19 October 2021 / Accepted: 20 October 2021 / Published: 28 October 2021

Abstract

:
The precipitation of calcium carbonate is well studied in many fields of research and industry. Despite the fact that, or perhaps because of the fact that, it is well studied in many fields, different approaches have been used to describe the kinetics of the precipitation process. The aim of this study was to collect and compare the data available in the literature and find a consistent method to describe the kinetics of growth and nucleation of the various polymorphs of calcium carbonate. Inventory of the available data showed that a significant number of the literature sources were incomplete in providing the required information to recalculate the kinetic constants. Using a unified method, we obtained a unique set of parameters to describe the kinetics for growth for calcite, vaterite and amorphous calcium carbonate (ACC) and nucleation for vaterite and ACC. Recalculation of the kinetic constants demonstrated that calcite confirmed there are two growth mechanisms within one polymorph, namely pure spiral growth and spiral growth mixed with surface nucleation. The spiral growth does not show second-order growth, which is typically attributed to it. Re-evaluation of the available nucleation data confirmed the suggested existence of a second pure ACC polymorph with a solubility product between 10−5.87 and 10−5.51 mol2 kgw−2.

1. Introduction

Calcium carbonate precipitation is a widespread phenomenon and a relevant topic for many fields of research and industry. Theories have been developed to describe the growth and nucleation kinetics of calcium carbonate minerals that may be used to determine the size, shape and number of crystals for a given solution composition and environmental conditions. Because calcium carbonate precipitation is such a prevalent phenomenon, much of the literature is dedicated to the kinetics of calcium carbonate precipitation. However, despite, or perhaps because of, the vast amount of the literature available, various approaches have been used to describe the kinetics and determine the kinetic constants, which may lead to inconsistencies when comparing the different datasets and make it difficult to develop a unified approach which fits all available data. It may very well be possible that the relevance to the different fields has contributed to the wide variety of approaches. The fact that calcium carbonate crystals have multiple polymorphs complicates the already abstruse situation even further.
Inconsistencies in the literature can have multiple sources. The first source is an inconsistent use of definitions. For example, the (super-)saturation, S, which is at the core of any theory on mineral precipitation kinetics, is not always used consistently. Although the definition of saturation is, in most cases, the same, the way saturation is used in the equations varies significantly depending on the application or research field. Saturation and supersaturation are used interchangeably, and sometimes supersaturation index is used. It is not always clear which polymorph is referred to, and supersaturation is often confused with a driving force (e.g., ln(S), (c−c*) or (√S−1)). Another example leading to errors is the ambiguous usage of the mathematical operator “log”. It is not always clear when results are plotted on a logarithmic scale whether “log10” or “ln” is meant (e.g., in [1,2,3]). We will discuss definitions in the methods section.
The second source of inconsistencies is the methodology to calculate saturation. Solutions containing calcium and dissolved inorganic carbon tend to form complexes, and it is therefore important to take ion speciation into account. Additionally, activity corrections are required to account for the non-ideal behavior of aqueous solutions. The calculation of speciation and activity corrections depend on each other in a non-linear way and are subject to many considerations. For speciation calculations, the concentrations of ions and ion complexes that are very small are sometimes neglected. For activity corrections, many different methods are available, such as the extended Debye–Hückel method, the Davies method, the specific ion interaction theory (SIT) and the Pitzer equations, among many others. These methods always have a limited application for a specific range of ionic strengths of the solution and sometimes a limited validity for the amount or valency of ions present in solution. Both the limited application of activity correction methods and the occurrence of certain ion complexations are not always considered and may lead to significant deviations in the calculated saturation and consequent precipitation kinetics.
The third source of inconsistencies is related to variations, errors and omissions in the reported experimental procedures that limit the interpretation and reproducibility of published results. In some cases, methods are not always clearly described, and units or values of required parameters are not always provided (e.g., [4,5]). It is not always possible to reproduce solutions from a materials section when they are not described completely or accurately.
These kinds of inconsistencies may not be a problem for a single study dealing with growth or nucleation of a single polymorph only. However, they make it difficult to check or reproduce the results and can result in significant variations when trying to combine the results of various studies, as we demonstrate here in this review.
This study aimed to review the available data in the literature describing the kinetics for growth and nucleation of calcium carbonate and develop a unified approach to compare all available datasets. The study was performed based on observations during experimental studies on Microbially Induced Carbonate Precipitation (MICP) by urea hydrolysis, which showed that size, shape, and type of the calcium carbonate crystals varied significantly depending on the hydrolysis rate and available surface area for crystal growth [6,7]. Based on Scanning Electron Microscope (SEM) and X-ray Diffraction (XRD) analysis, three different polymorphs were identified: calcite, vaterite and amorphous calcium carbonate (ACC). Other polymorphs (aragonite, ikaite and calcium carbonate monohydrate) were not included in the study, as these were not observed in the experiments and are considered uncommon in freshwater environments or at the relevant temperature range [8,9]. We used all relevant data in the literature that we could find, as well as the reported solution compositions and equations from the Theory section described below, to recalculate saturation values in a single consistent manner, so that all data could be compared with each other. The resulting saturation data were used to determine growth and nucleation parameters for calcite, vaterite and amorphous calcium carbonate (ACC). The kinetic parameters obtained in this way will enable us to describe the crystal precipitation kinetics consistently, as long as the same definitions and methods are used.

2. Theory

In this section, we present the equations and definitions used in this study to recalculate the crystal growth nucleation rates from the solution compositions.
Firstly, the activity of an ion is determined by the following:
a i = γ i m i
where ai is the activity of ion i in mol kgw−1 (kgw is kg of solution, in this case water), γi is the unitless activity coefficient of ion i and is determined by an activity correction method and mi is the molality of ion i in mol kgw−1.
The activities of the calcium ions and carbonate ions are then used to calculate the ionic activity product of calcium carbonate to give the saturation for the various polymorphs. The saturation definition [10] used in this study is as follows:
S j = I A P K j = a i ν i K j
where Sj is the saturation of crystal j, IAP is the ionic activity product in molν kgw−ν, Kj is the equilibrium constant of crystal j in molν kgw−ν and νi is the stoichiometry of ion i in the crystal roster of crystal j.
In this study, we used the software PhreeqC (version 3.3.8-11728) [11] with the default database to determine the ionic activity products with respect to calcium carbonate of solutions. This software is flexible with the input consisting of varying ion types, which is ideal in comparing different studies. Additionally, the software estimates the conversion of molarities into molalities, and this also helps in comparing different studies. The raw saturation output of PhreeqC is in log10(S) instead of the saturation shown in Equation (2).
It is imperative to calculate the ionic activity product correctly for crystals with multiple polymorphs, such as calcium carbonate. When the ionic activity product increases enough, a less stable polymorph that grows and nucleates faster will take over. Given time, these less stable polymorphs will transform in a more stable polymorph, through a process referred to as Ostwald ripening [12]. The polymorphs considered in this study are in order of decreasing stability calcite, vaterite and amorphous calcium carbonate (ACC).
A general crystal growth equation for a crystal with two types of ions was derived [13].
m c t = k A c ( S 1 ν 1 ) g             S 1  
where mc is the crystal mass in mol, t is time in s, k is a growth rate constant in mol m−2 s−1, Ac is the available crystal surface for growth in m2, ν is the total mol of ions per mol of crystal and g is a unitless growth order parameter.
According to Davies, g, the unitless growth order, was derived to be equal to ν. However, later it was found that g could also have a different value depending on the type of growth mechanism [14]. Equation (3) is a bulk growth description. Another possibility is to study the growth of individual crystals. In such a case, the crystal-face growth speed is used:
r c t = k r ( S 1 ν 1 ) g               S 1
where rc is the crystal radius in m, and kr is the growth constant in m s−1. The bulk growth rate and the individual growth rate are directly related to each other if the bulk growth rate is used for crystals of uniform size and shape. In this case, they are correlated by the following:
k r = A f 3 V m V f k
where Af and Vf are unitless shape factors, and Vm is the inverse molar volume in mol m−3. The shape factors depend on the crystal shape and relate the crystal radius to the crystal surface area, Ac, in m2 and crystal volume, Vc, in m3. Assuming spherical crystals (which is the most common assumption), Af is 4 π and Vf is 4/3 π. For a single crystal, mc, Ac and Vc can be calculated by using the following:
A c = A f r c 2
V c = V f r c 3
m c = V m V c
Several nucleation types exist. Nucleation can occur homogeneously by itself or heterogeneously by using other material as nucleation point. Furthermore, nucleation can occur in the solution, the so-called bulk nucleation, or on a surface, the so-called surface nucleation. In this study we consider homogeneous bulk crystal nucleation rates. The most common equation to describe the nucleation rate found in the literature is as follows:
J = A n e x p ( B n l n 2 ( S )   )                     S 1
where J is the nucleation rate in m−3 s−1, An is a rate constant in m−3 s−1 and Bn is a unitless constant related to the nucleation energy barrier. The nucleation parameters An and Bn were theoretically derived and given by Kashchiev [10]. He also demonstrated that the nucleation rate differs for a diffusion limited nucleation and kinetically limited nucleation, which could be described by using the following:
J = A n d i f f S l n S   e x p ( B n l n 2 ( S )   )                     S 1  
J = A n k i n S e x p   ( B n l n 2 ( S )   )                                       S 1
in which constants A n d i f f ,  A n k i n and Bn are calculated by following Equations (12)–(14). We have updated these equations from Kaschiev [10] to incorporate the shape factors of Equations (6) and (7). It is important to realize that nuclei are likely to have different properties (e.g., shape and density) as matured crystals. Nevertheless, some assumptions about these properties must be made to have a working description of the mechanics:
A n d i f f = 1 2 π A f D V m N A 2 K 1 ν k b T γ
A n k i n = ( 1 162 π ) 1 3 A f 3 2 V f D V m 1 3 N A 4 3 K 1 ν γ k b T
B n = 4 27 A f 3 V f 2 1 ( V m N A ) 2 γ 3 ( k b T ) 2
where D is a diffusion constant in m2 s−1, NA is the Avogadro constant in mol−1, kb is the Boltzmann constant in J K−1, T is the temperature in K and γ is the specific surface energy of the crystal in J m−2.
Most studies investigating nucleation phenomena focus on the induction time. The induction time is the time between when the solution becomes oversaturated and the time of the first nucleus appearing. These nuclei are very small and are therefore hard to detect. Depending on the detection method of the experiment, nuclei may need to grow before being able to be detected. This can lead to a significant variability in the experimentally determined and reported induction times.
The induction time depends not only on the saturation of the solution, but also on the volume of the solution. The classical nucleation theory describes the chance that a nucleus larger than a critical nucleus appears and starts growing. This means that, for more molecules present in the solution, this is likely to happen sooner. Therefore, if the volume increases while the concentrations remain the same, the induction time becomes shorter.
While the induction time is mostly reported, the dependency on the volume makes it difficult to directly compare studies. Therefore, we will use the nucleation rate, which gives the rate per volume, rather than induction times. To obtain the nucleation rate from studies which reported induction times, the reported induction times needed to be converted to nucleation rates. The induction time equals an expected amount of nuclei of exactly one. Therefore, the relation becomes the following:
J = 1 V τ i n d
where V is the solution volume in m3, and τind is the induction time in s.
Another process in crystal development is dissolution. When a crystal is in a solution that is unsaturated, it will dissolve. The rate of dissolution requires different parameters than growth. For a polymorphic crystal such as calcium carbonate, the balance of growth and dissolution leads to the crystal mass eventually transforming from a less stable polymorph into the most stable phase. This process is called Ostwald ripening and was placed outside the scope of this study.

3. Results and Discussion

3.1. Recalculating Saturation Values

Growth parameters, nucleation parameters and equilibrium constants all depend on temperature and pressure. Therefore, only the literature data were used that originate from experiments performed at 25 °C and atmospheric pressure, unless stated otherwise. We used the software PhreeqC (version 3.3.8-11728) [11] with the default database to determine the ionic activity products and compare them with the solubility products of the various calcium carbonate polymorphs. This software is flexible, with the input consisting of varying ion types, and this is ideal when comparing different studies. Additionally, the software converts molarities into molalities, and this also helped us compare the different studies. The saturation output of PhreeqC is in log10(S) instead of the saturation shown in Equation (1).

3.2. Kinetics of Growth

Reported growth rate constants for calcite and vaterite (Table 1) cover a broad range of values and units depending on the definitions and experimental conditions used [1,4,5,15,16,17,18,19,20,21,22,23,24,25,26,27,28,29,30,31,32,33]. The growth order, g, for calcite varies between 0.91 and 4.71 in these publications. Additionally, several parameters for alternative growth models [34,35,36] are reported. The growth order, g, for vaterite varies between 2 and 2.02 in these publications. For both calcite and vaterite, some of these parameters are reported to depend on ionic strength, ratio of calcium and carbonate or pH (e.g., in [28,30,36]).
Some of the variation in reported parameters can be explained by the usage of different definitions, units and driving forces in the different publications. However, even when the rate constants are recalculated by using the same definitions and units, the values of the parameters can vary by multiple orders of magnitude from each other. Hence, there is a need to investigate the cause of these variations in order to obtain single unified parameters.
However, the observations in attempting to unify the data from many publications are striking. Firstly, there is a large amount of papers where reported growth rates cannot be correlated to solution compositions [1,18,23,24,25,26,27,29,32,33,34,35,37,38,39,40]. The correlation was not possible because either the solution composition was not defined clearly enough, the growth rates was not reported clearly, the saturation calculation was not reported clearly enough, the specific surface of the crystals was not measured or reported, or the solution was bubbled with CO2 so that the actual carbonate concentration is hard to determine exactly.
Secondly, a large number of publications that studied calcite growth in calcite seeded experiments used solutions that were either all oversaturated for vaterite [2,3,19,21,41,42,43,44,45,46,47,48,49,50] or a part of the solutions used that were oversaturated for vaterite [15,22,28,51,52]. When a solution is oversaturated for vaterite, vaterite growth is preferred over calcite growth, as we show in this paper. This means that most results from these papers that specifically study calcite are moot.
Luckily, several studies remained that contained at least one useful point of data where the solution composition could be correlated with the growth rate (shown in Figure 1) in which the growth rate is plotted against a recalculated ionic activity product for calcium carbonate [15,22,28,30,31,51,52,53].
When comparing all reported growth rate data, we found that there is not a clear direct correlation between the ionic activity product and the reported growth rates. Therefore, we took a critical look at the methodologies and environmental conditions that resulted in these data. These methods and conditions are summarized in Table 2.
Firstly, three studies [22,28,52] allowed or expedited the transfer of gaseous CO2 into the solutions. In the case of gaseous CO2 transfer, it is difficult to determine the exact carbonate concentration, as the pCO2 and gas transfer rate may vary depending on bubble size and mass transfer coefficients. Because there was not enough information to back-calculate the pCO2 and gas transfer rate, and because the data of these publications show higher rates than the data from other publications, it is assumed that the actual carbonate concentration and consequent IAP in these experiments were higher than reported. As a result, the data points from these publications should be shifted to the right in Figure 1. Based on this uncertainty, the data from these studies were not used to recalculate the kinetic parameters.
Lastly, the data of Spanos [31] were disregarded, since, in this study, the specific surface area of the crystals could not be recalculated. The specific surface area used in the calculation of these growth rates was considered equal in seeded and unseeded experiment, and this outcome is implausible. Newly formed nuclei have a specific surface which is orders of magnitude larger than crystal seeds. Therefore, the reported growth rates are expected to vary from the actual growth rates.
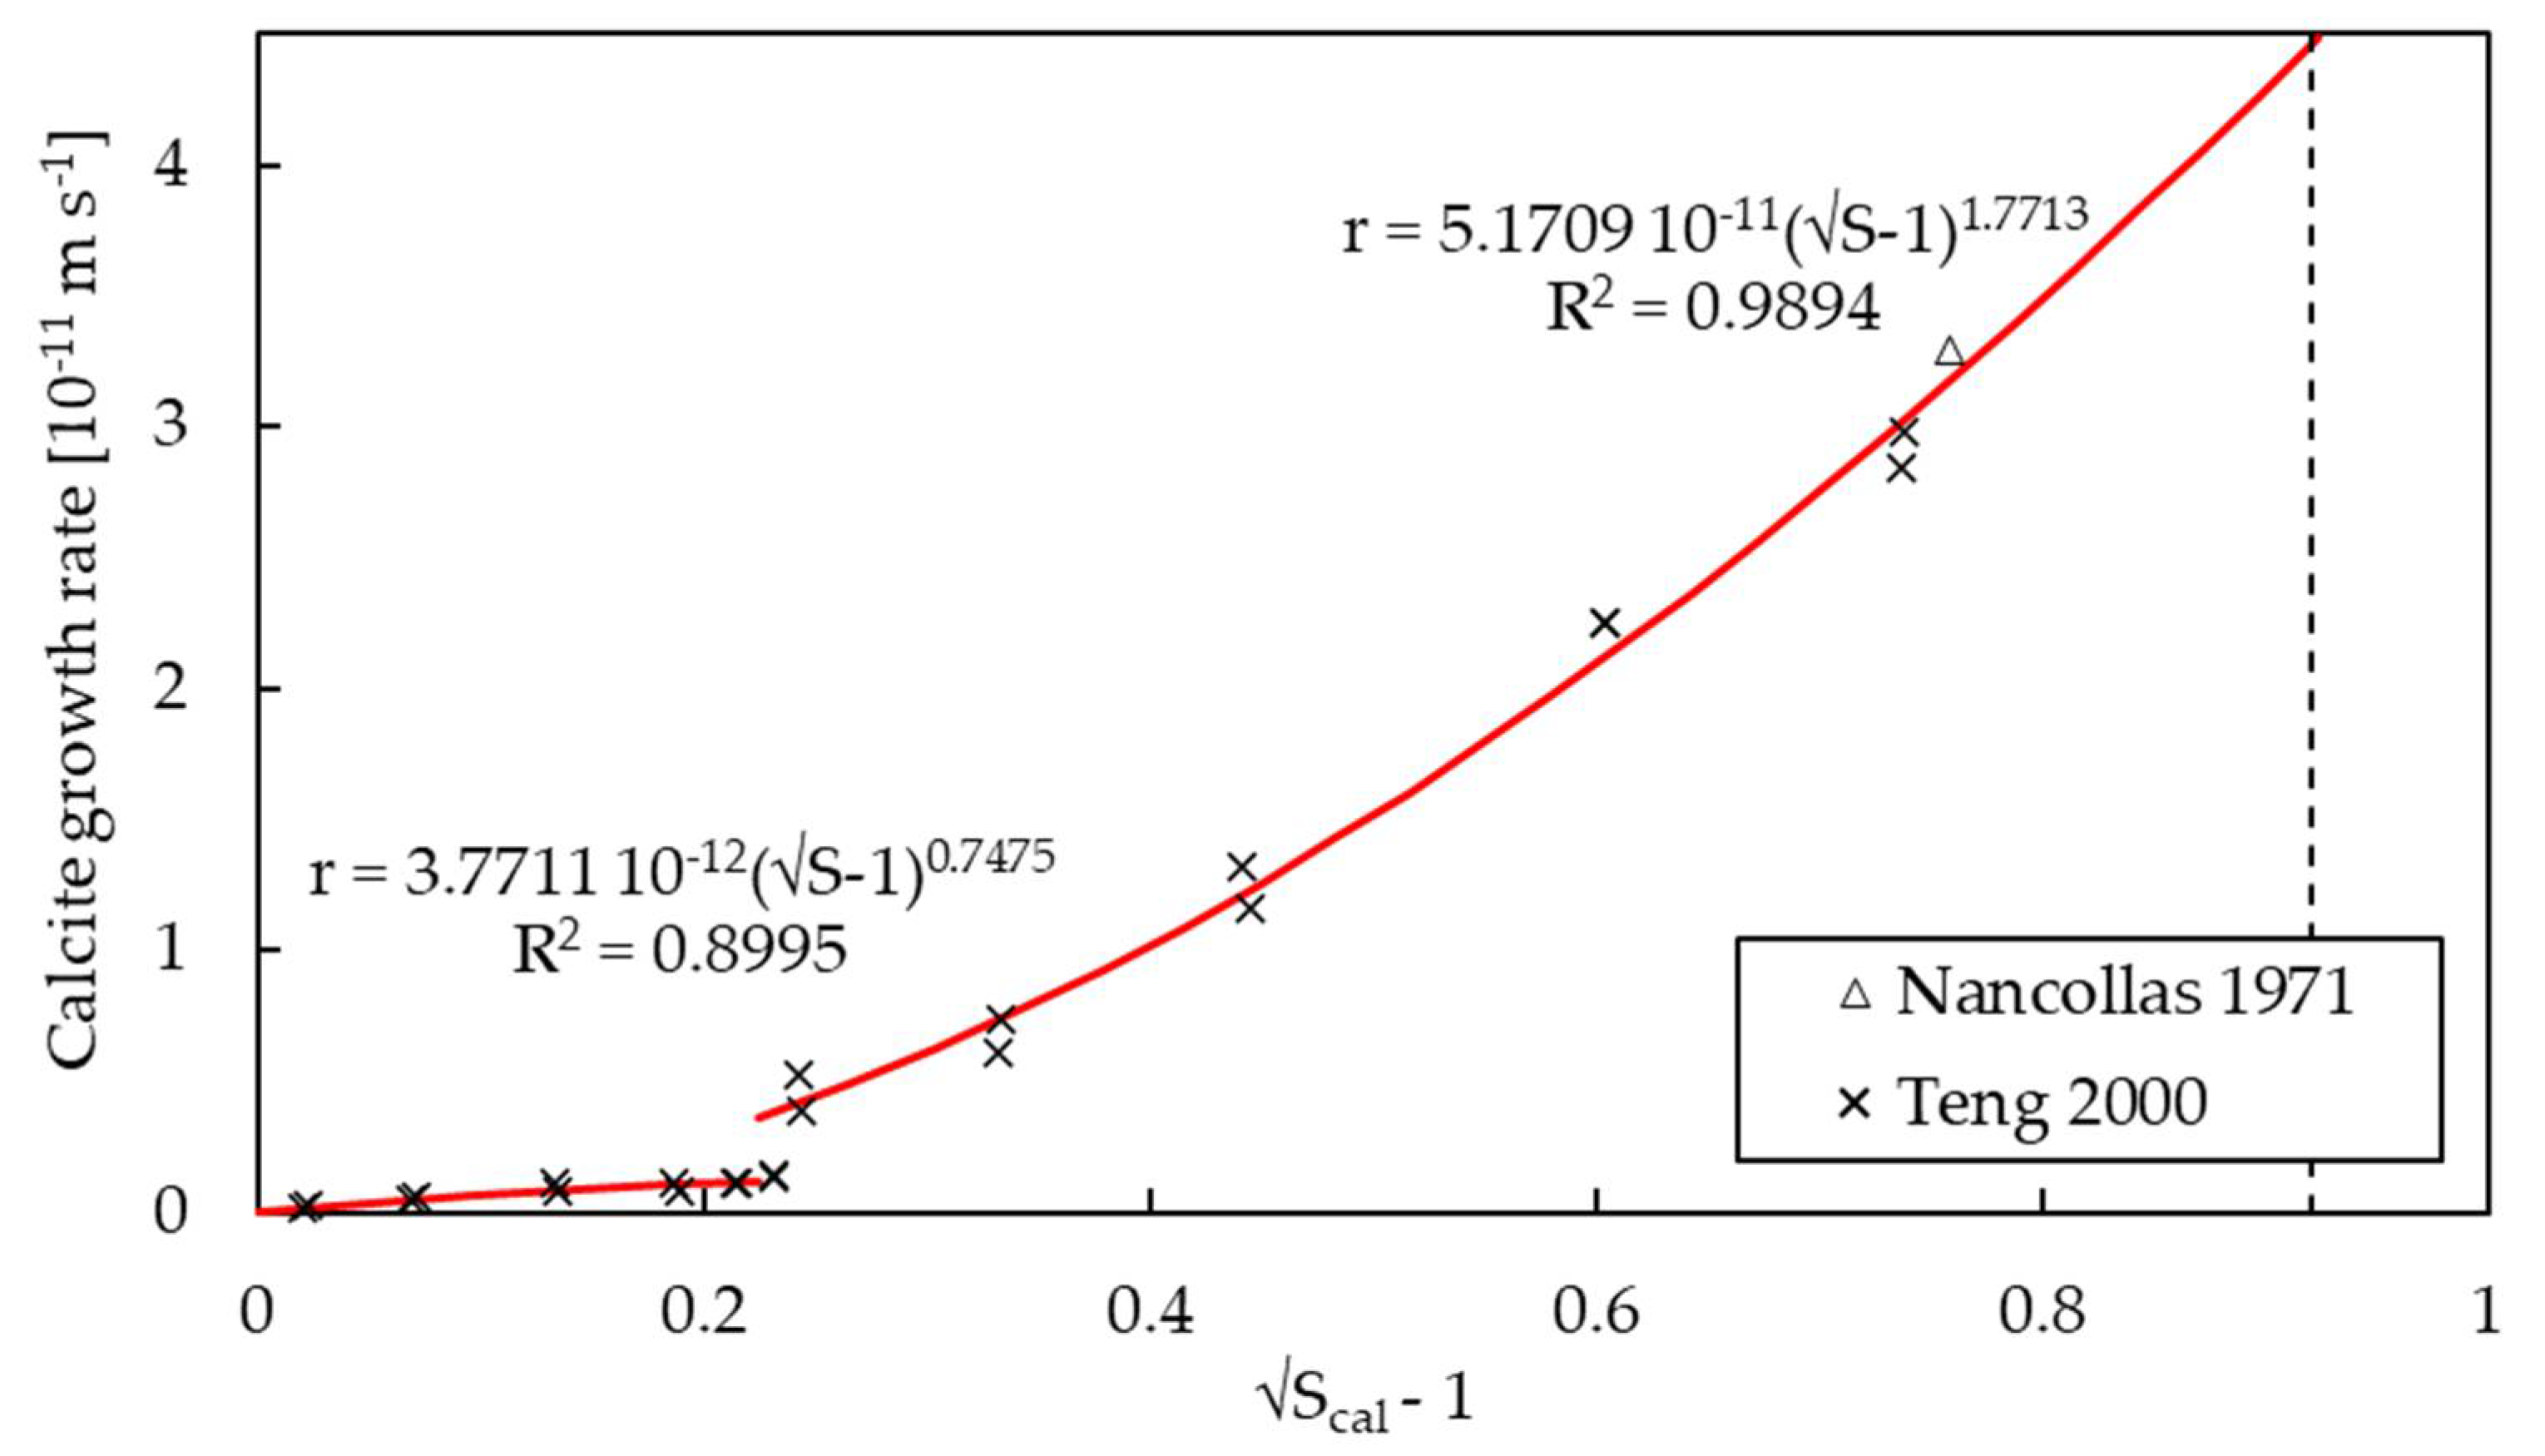
The remaining data were used to recalculate the growth-rate constants for each polymorph, starting with calcite. The study that provides the most and most interesting data about calcite growth shows several growth regimes within the calcite polymorph [51]. Using fluid cell atomic force microscopy (AFM), the study demonstrated that, depending on the solution composition, there is either no growth, spiral growth, mixed growth consisting of spiral growth and surface nucleation, or surface nucleation only.
After recalculating the saturation values reported in that study, the solution that showed no growth was undersaturated for calcite, and the solution that showed surface nucleation only was supersaturated for vaterite. The observation that the changes in growth kinetics correspond with the calculated saturations for calcite and vaterite is a strong confirmation that the current method for calculating saturation values is accurate. Fascinatingly, this still gives two growth mechanisms with distinct kinetics within the calcite polymorph, which is visualized in Figure 2.
Interestingly, the spiral growth of calcite at low supersaturation does not show the second-order growth that is typically attributed to calcium carbonate [30,51]. On the other hand, the mixed growth is much closer to a second-order growth. The results also show how important it is to carefully report and design experimental setups and methodologies. While Nancollas [15] only provides one point of data, it strongly agrees with the data of Teng [51].
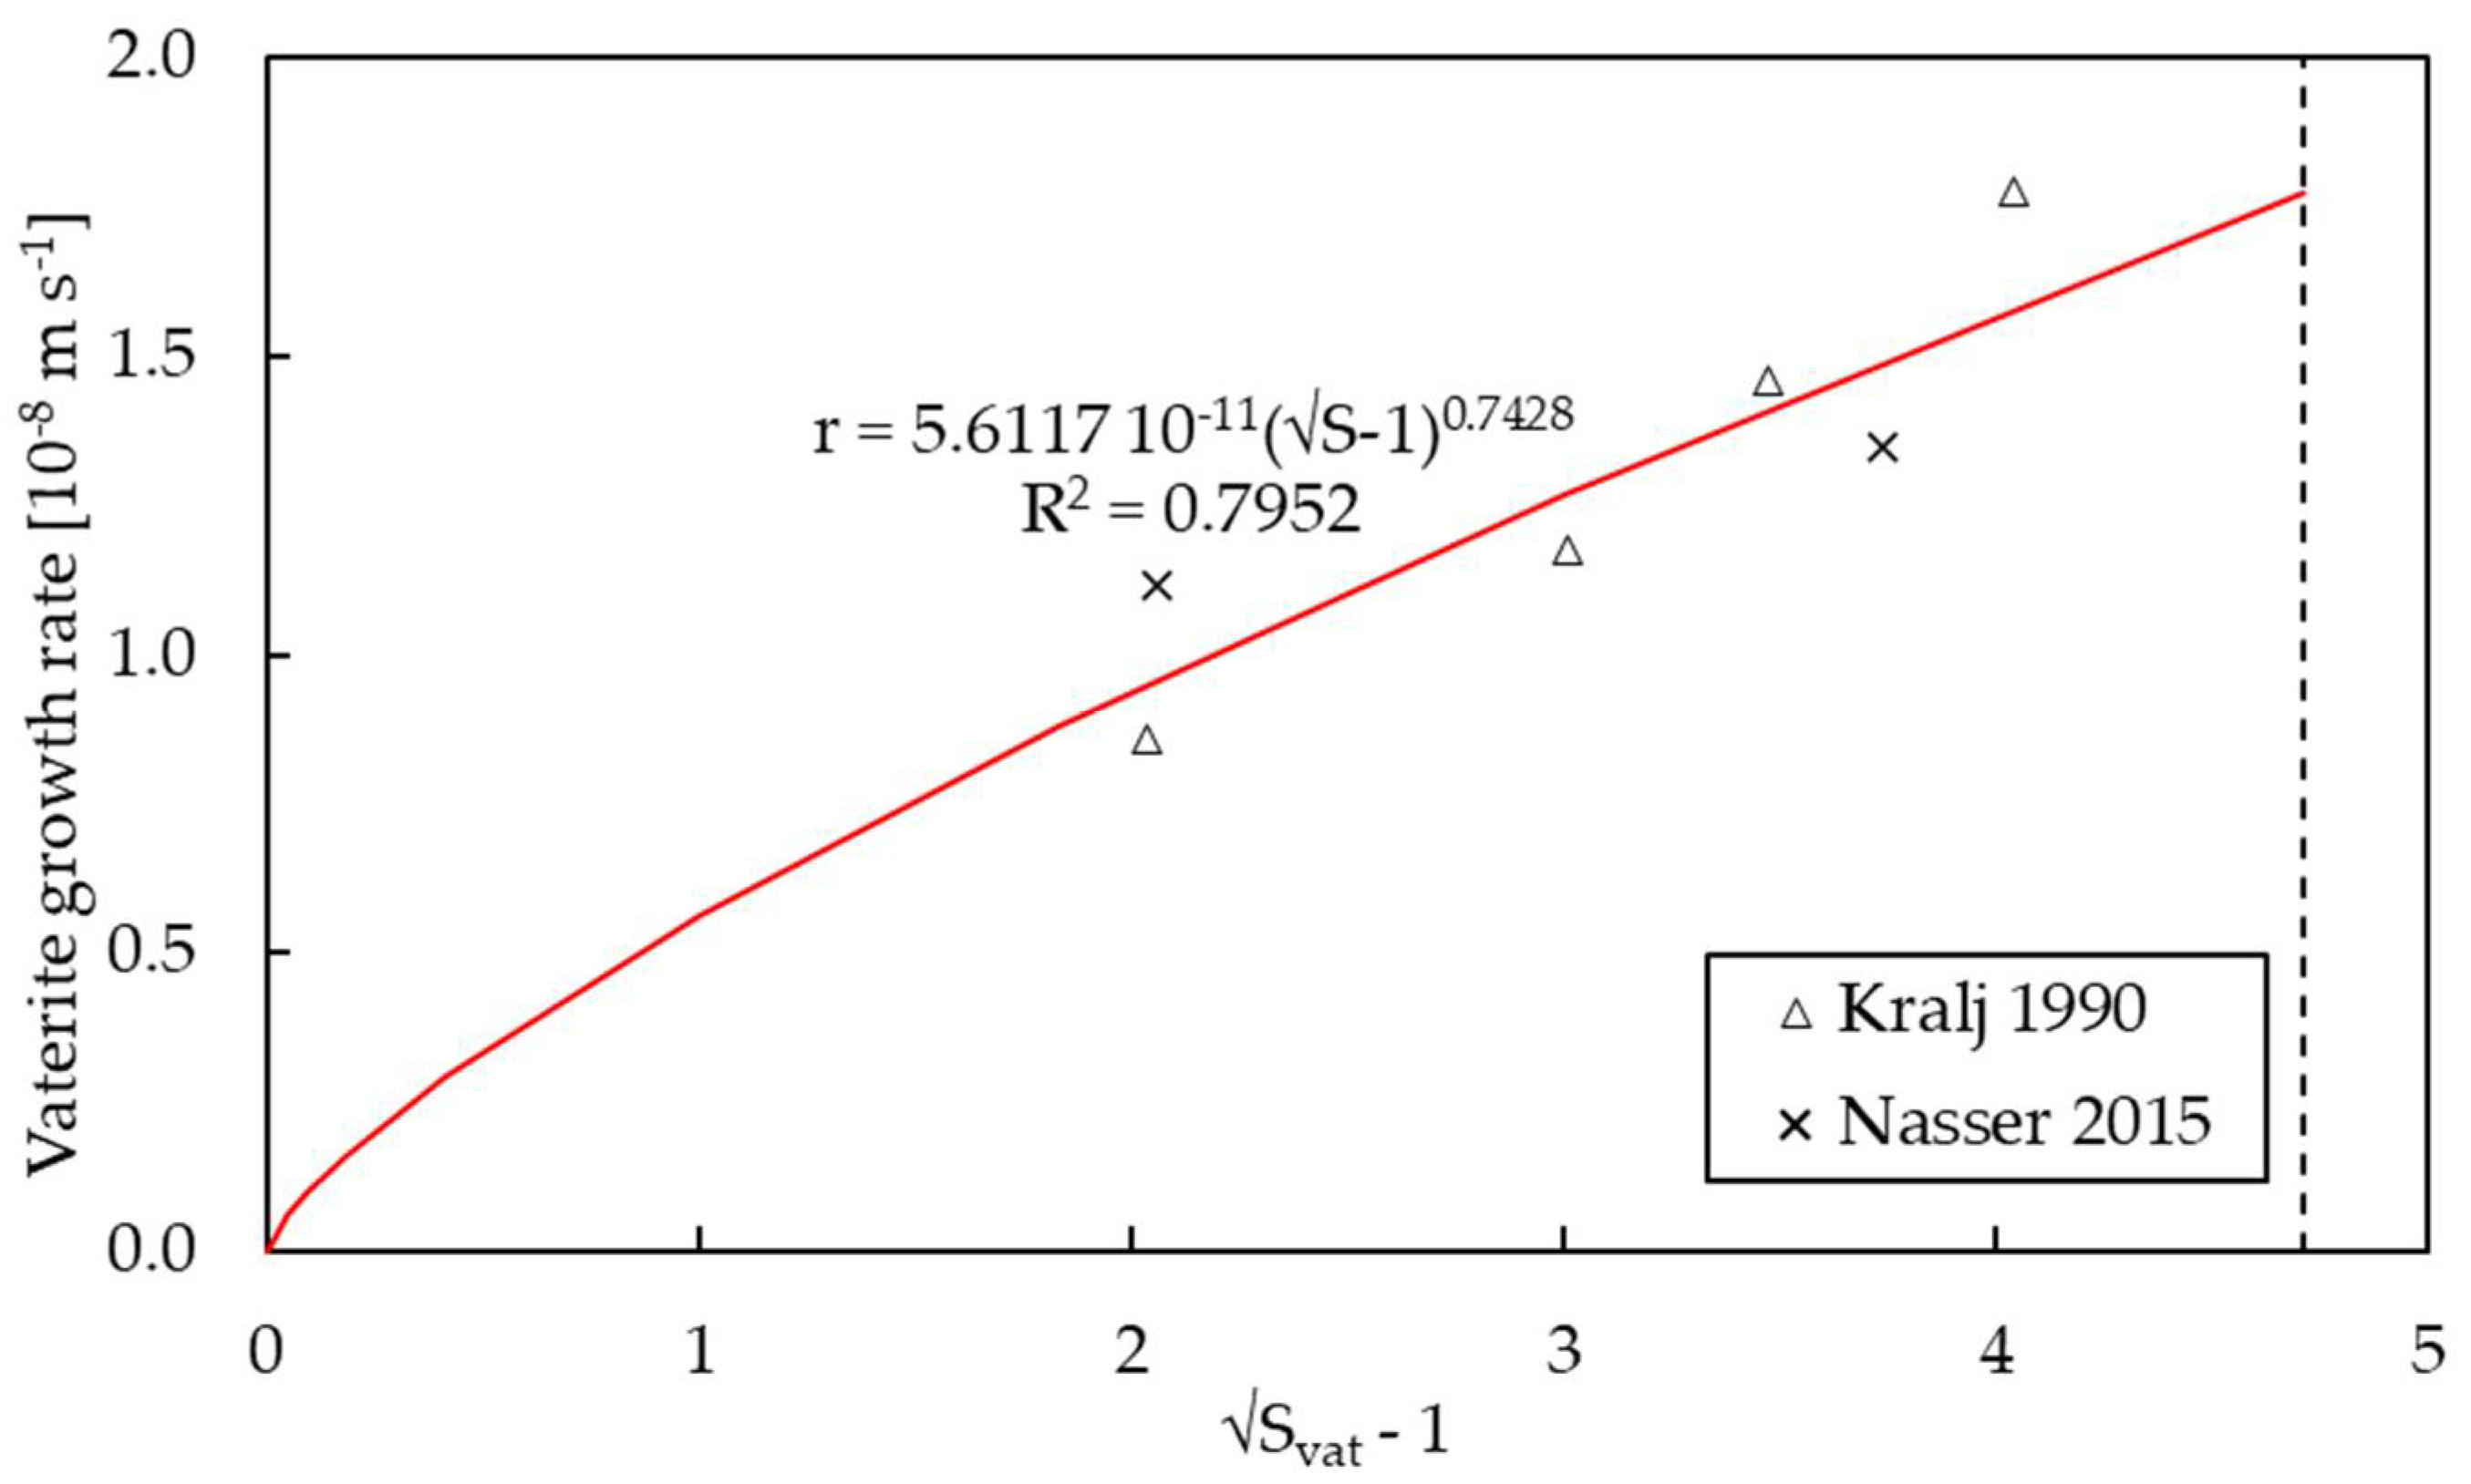
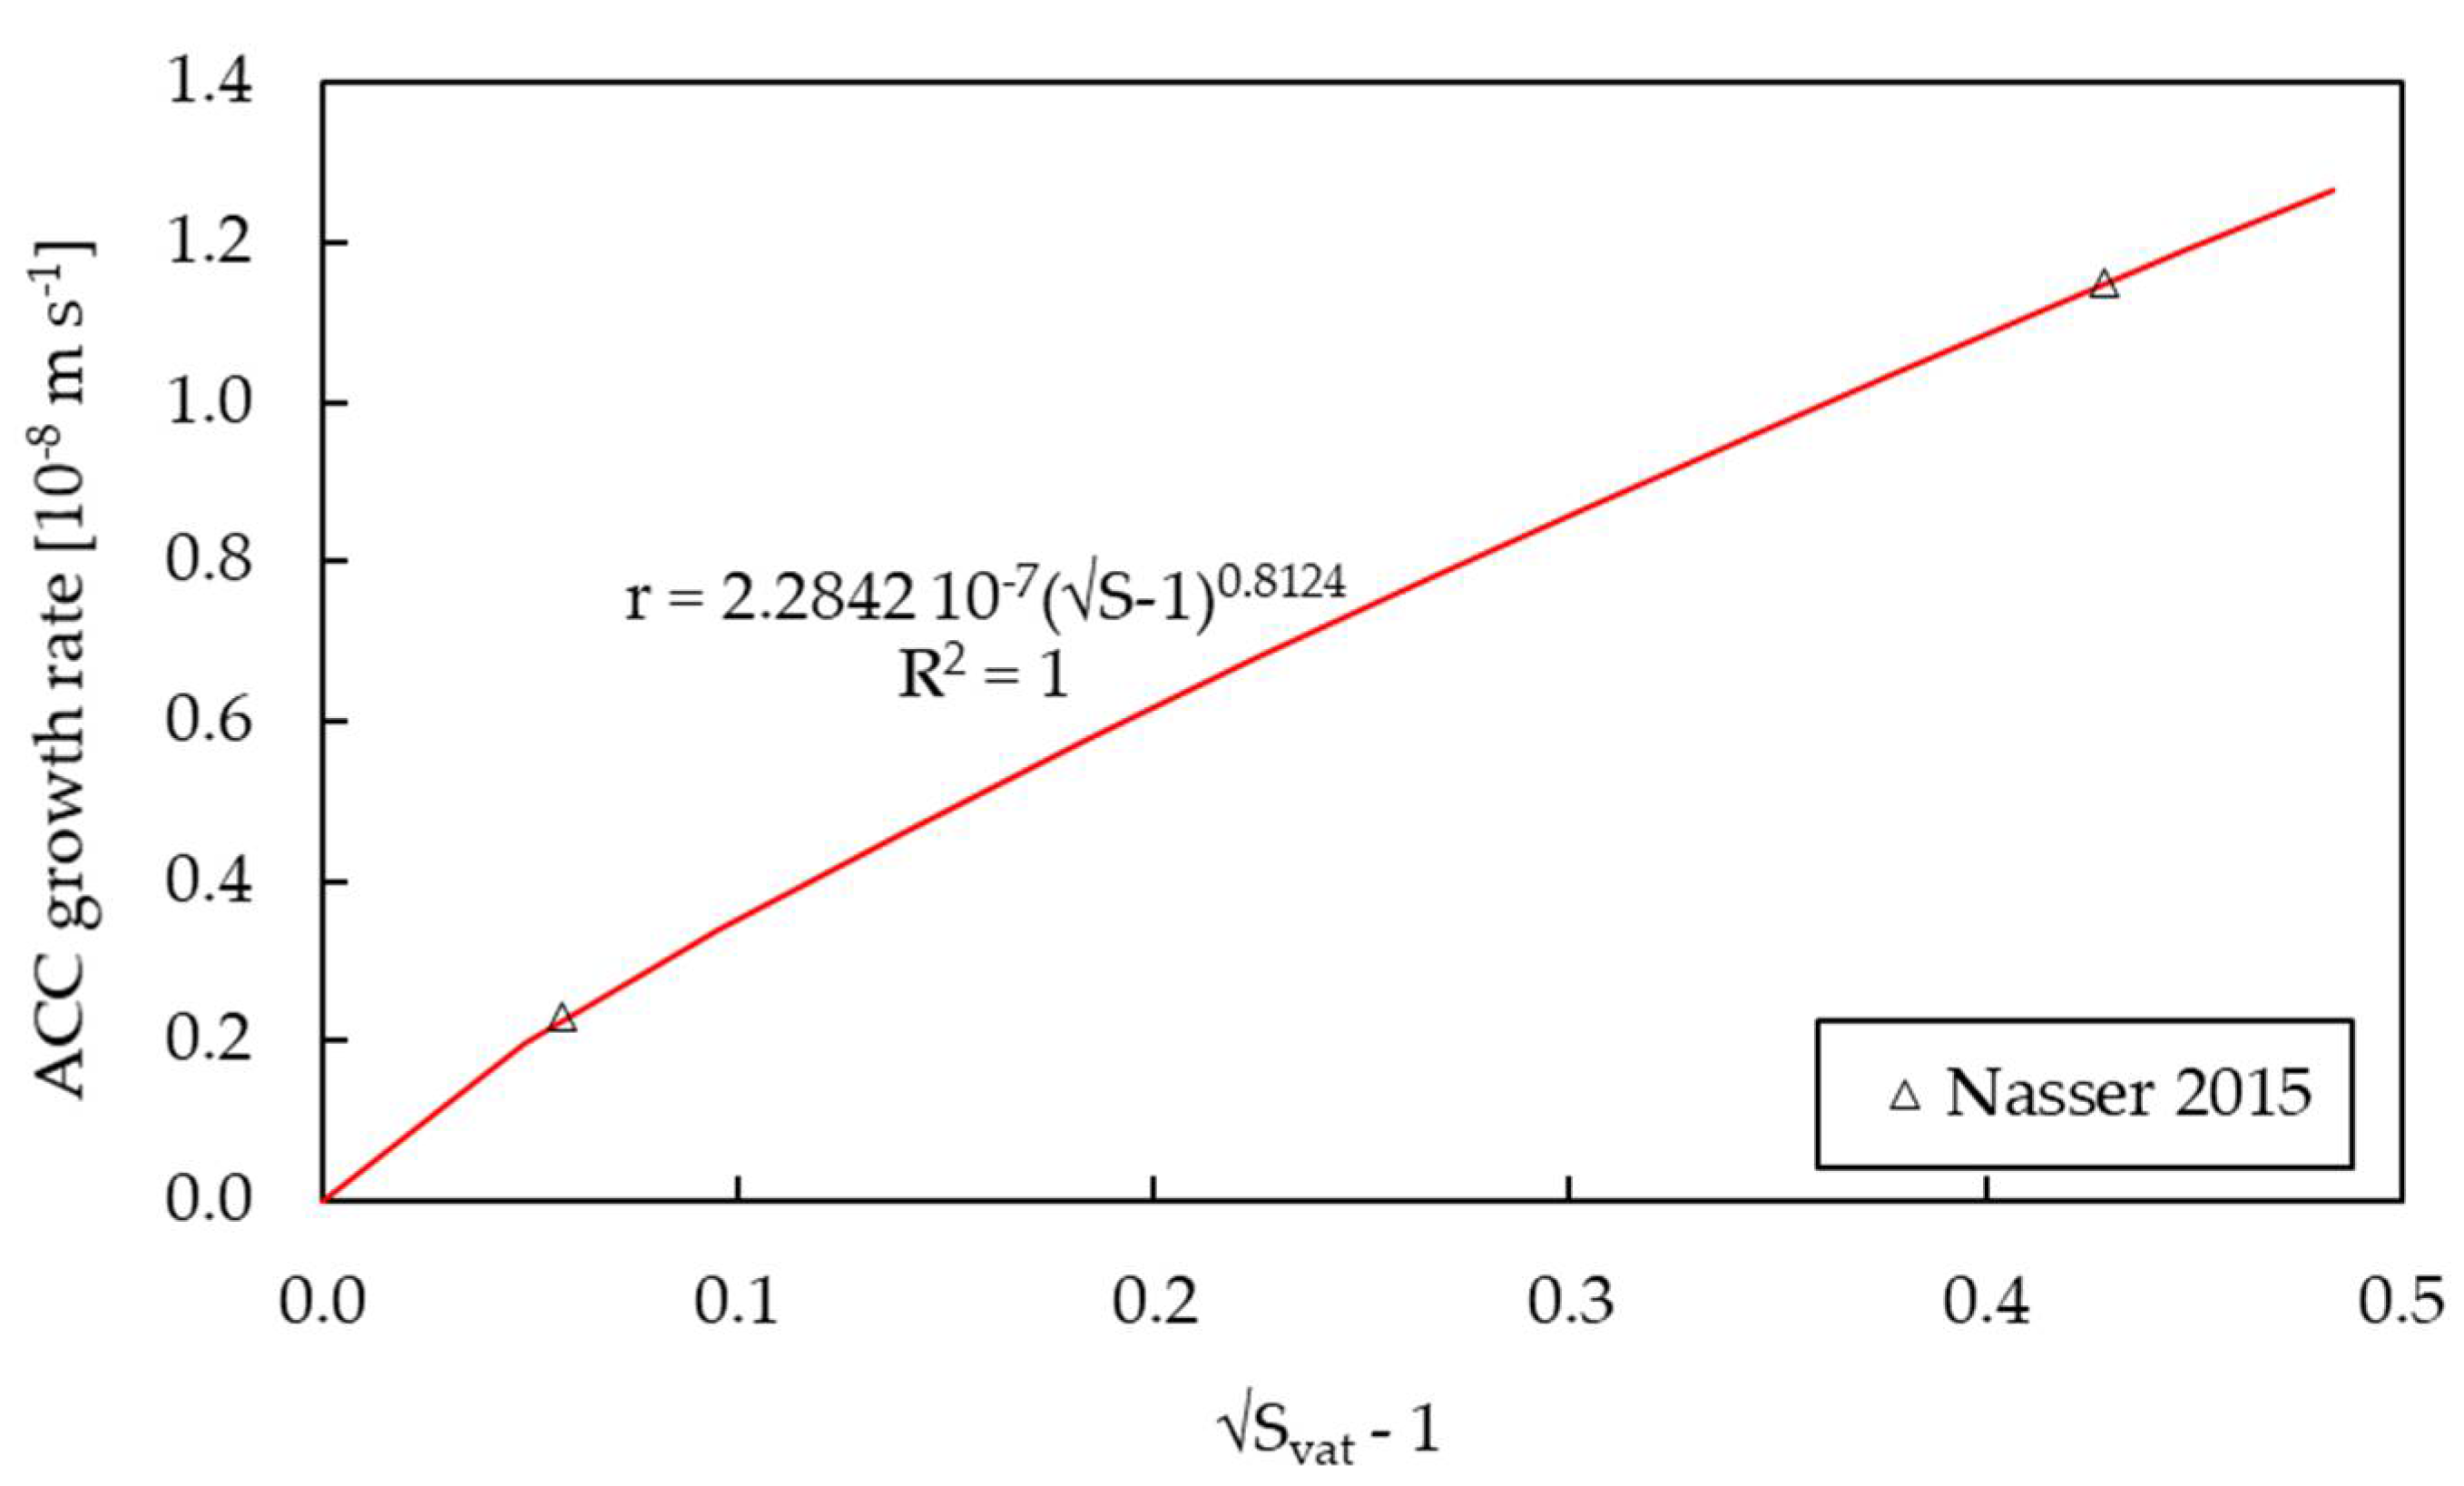
The growth data for vaterite are provided by Kralj [30] and Nasser [53]. Kralj originally reported the growth constant as a function of ionic strength, but neglected many ionic species for the saturation calculation. Nasser provides data for both the vaterite and the ACC polymorph. Their method continuously keeps track of crystal sizes, providing an appropriate growth rate regardless of polymorph. The results for vaterite are shown in Figure 3, and the data of Nasser, which are the only data available for ACC, are shown in Figure 4.
We found that the kinetic data for the various polymorphs from various studies agree with each other after carefully screening the data and recalculating the saturation values. As these selected datasets vary in terms of concentration ratio, acidity and ionic strength, it can be concluded that these factors do not need to be included in a growth equation. It is worth mentioning that all data used only have sodium and chloride as background electrolytes and that some other electrolytes (e.g., magnesium) or presence of complexing ions or polymers can have an inhibiting effect on calcium carbonate growth [50,54] and therefore do need to be considered when determining the growth kinetics in more complex solutions.

3.3. Kinetics of Nucleation

Reported values for all forms of An in Equations (9)–(11) for unseeded homogeneous nucleation of vaterite or vaterite–calcite mixtures range from 109.45 to 1036 m−3 s−1 [31,38,55]. Reported values for Bn are 12.2 for vaterite [55] and 63.7 for a vaterite–calcite mixture [38]. No nucleation parameters were found for pure calcite and ACC polymorphs. Values reported for the specific surface energy range from 15 to 94 mJ m−2 for vaterite [31,55,56] and 41 to 98 mJ m−2 for vaterite–calcite mixtures [38,57,58]; and the value is 31 mJ m−2 for calcite [59]. Similar to the growth parameters, these parameters have a broad range and are therefore a source of uncertainty in the predicted nucleation rate.
As with the growth kinetics, several publications [20,58,60,61] were disregarded either because the volume of the solution was not reported, or the solution composition was insufficiently described. Fortunately, this leaves plenty of other publications where nucleation rates can be correlated with the solution composition [31,38,42,55,56,57,59,62]. The experimental conditions and nucleation type are summarized in Table 3. For several of these publications, one of the solute concentrations had to be estimated for a correct pH or ionic strength, as the experimental conditions were not entirely clear.
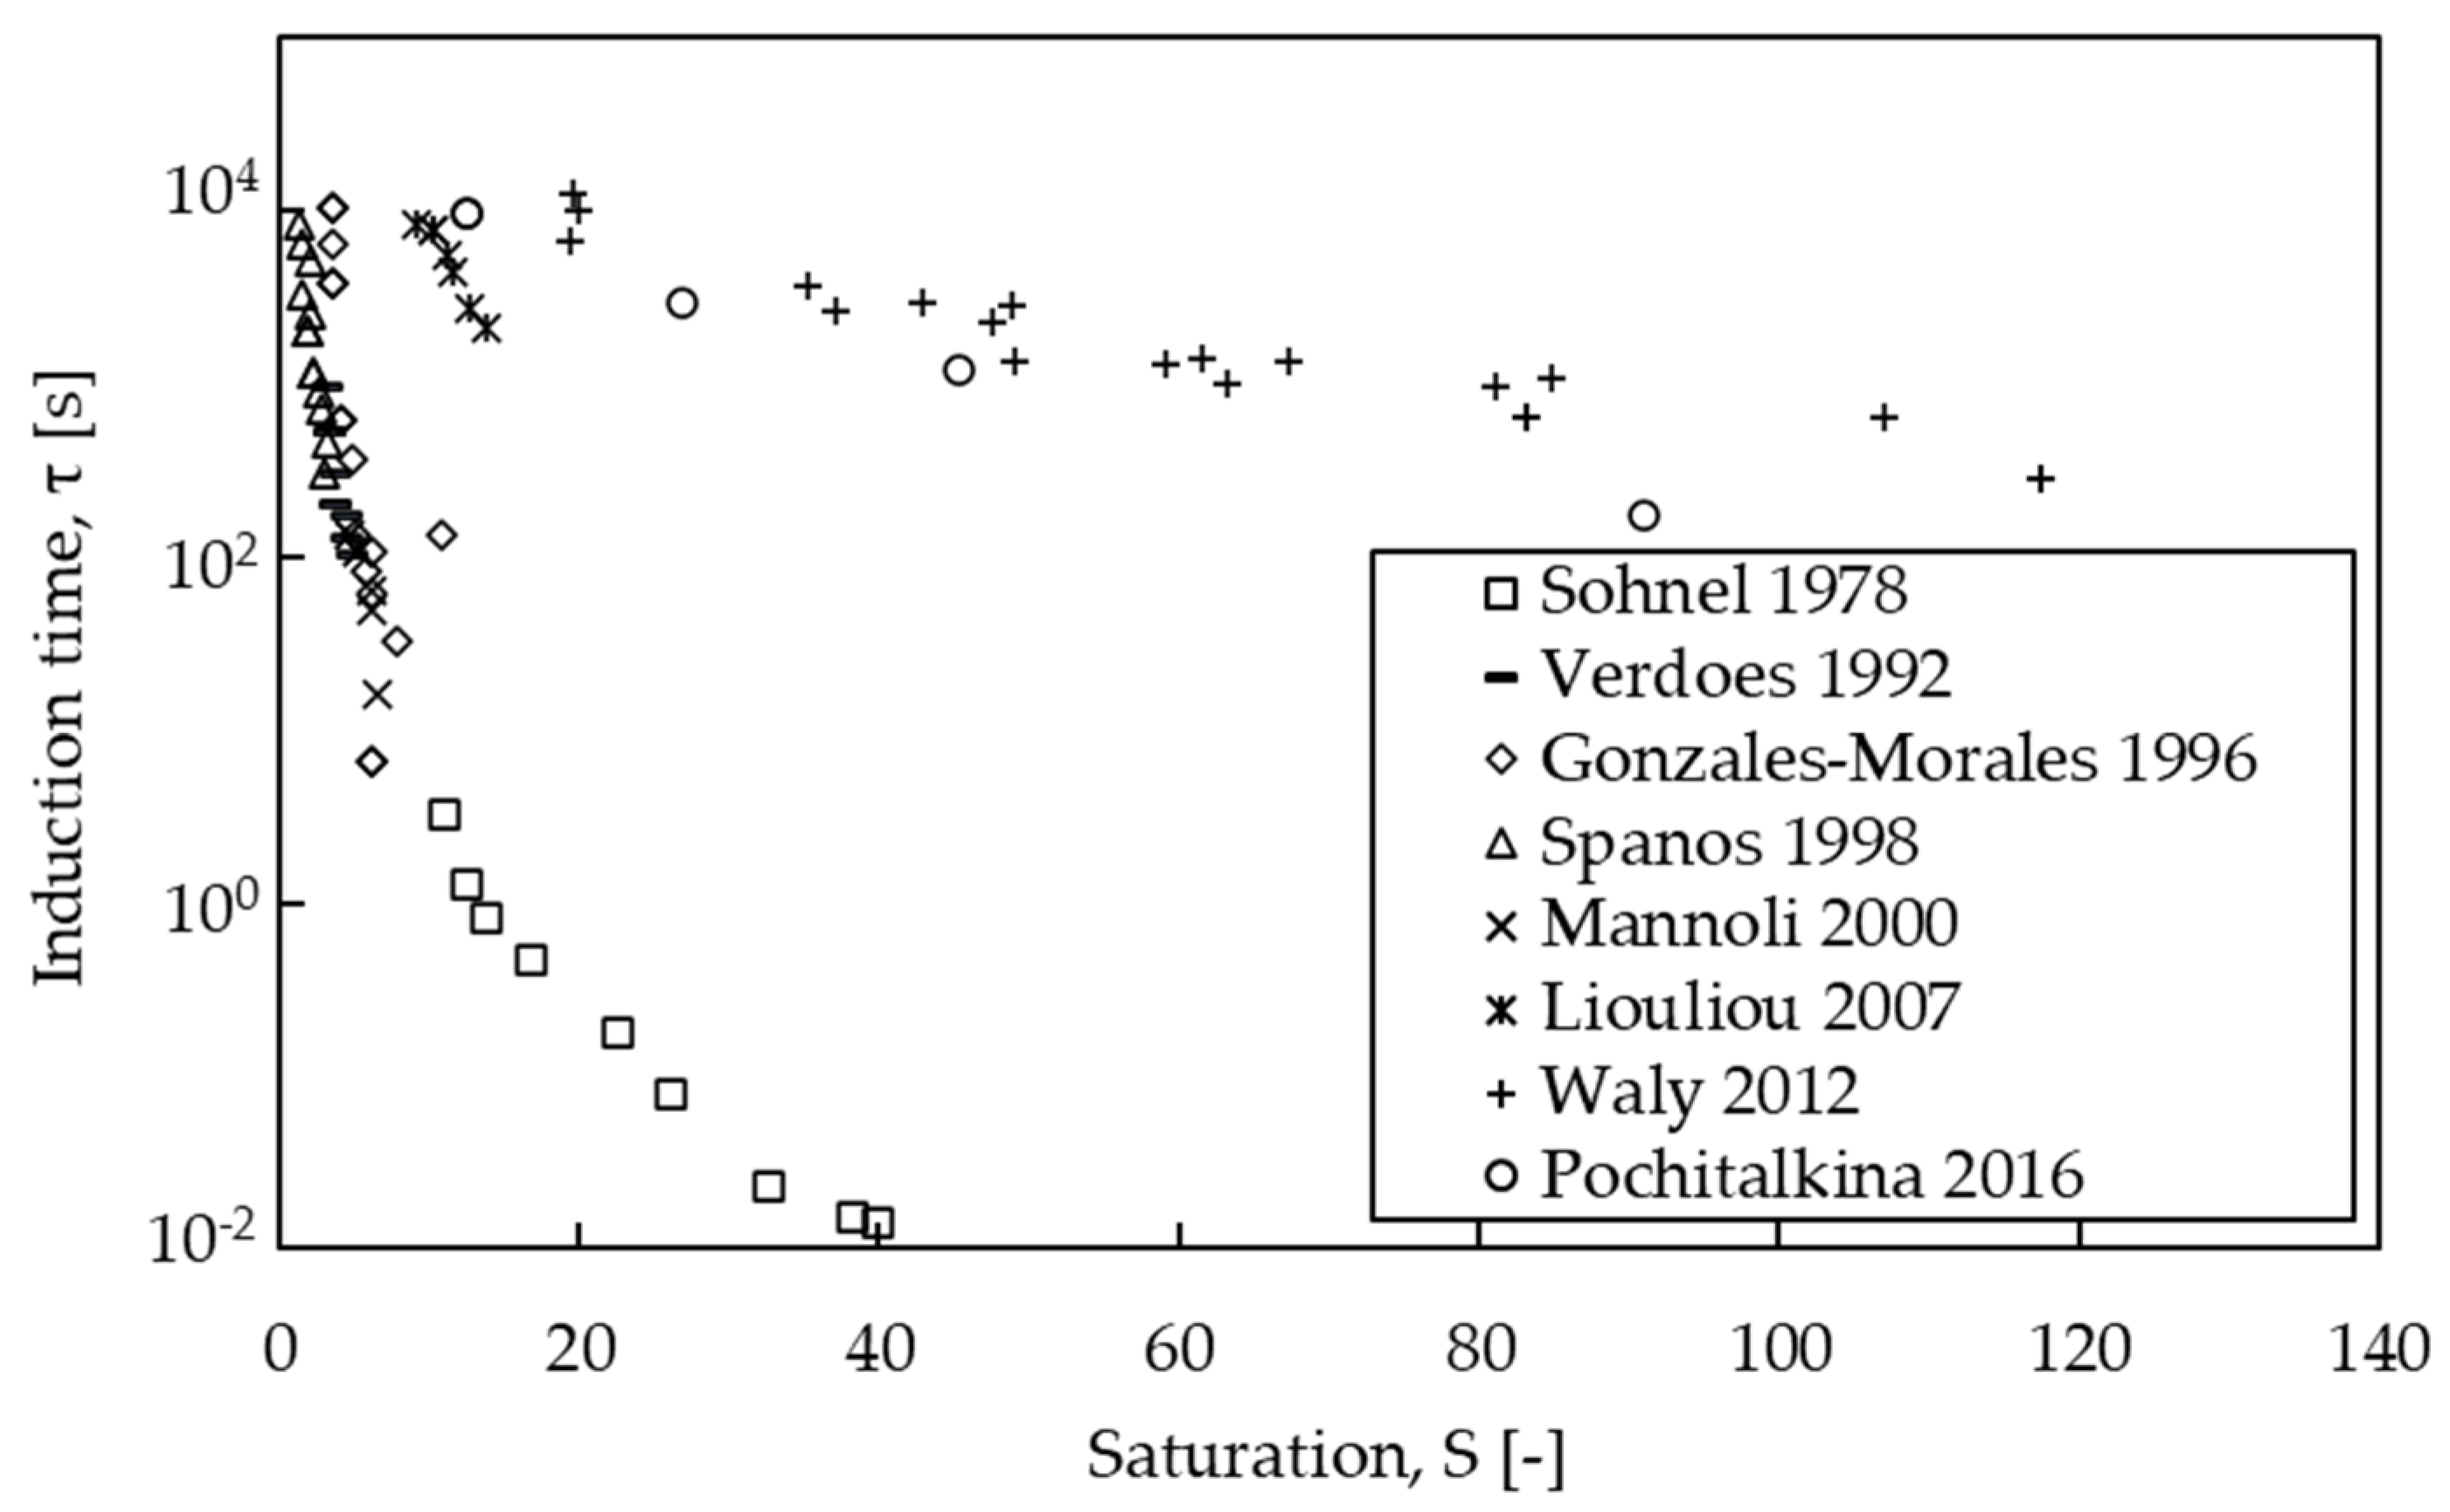
The induction time that is reported in these studies is visualized in Figure 5. As discussed before, induction times depend on solution volume and are normalized or converted to a nucleation rate according to Equation (16). Following Equation (11), the nucleation parameters for kinetically limited nucleation can then be obtained by linearizing the equation into the following:
l n   ( J S ) = l n   ( A n k i n ) B n l n 2 ( S )  
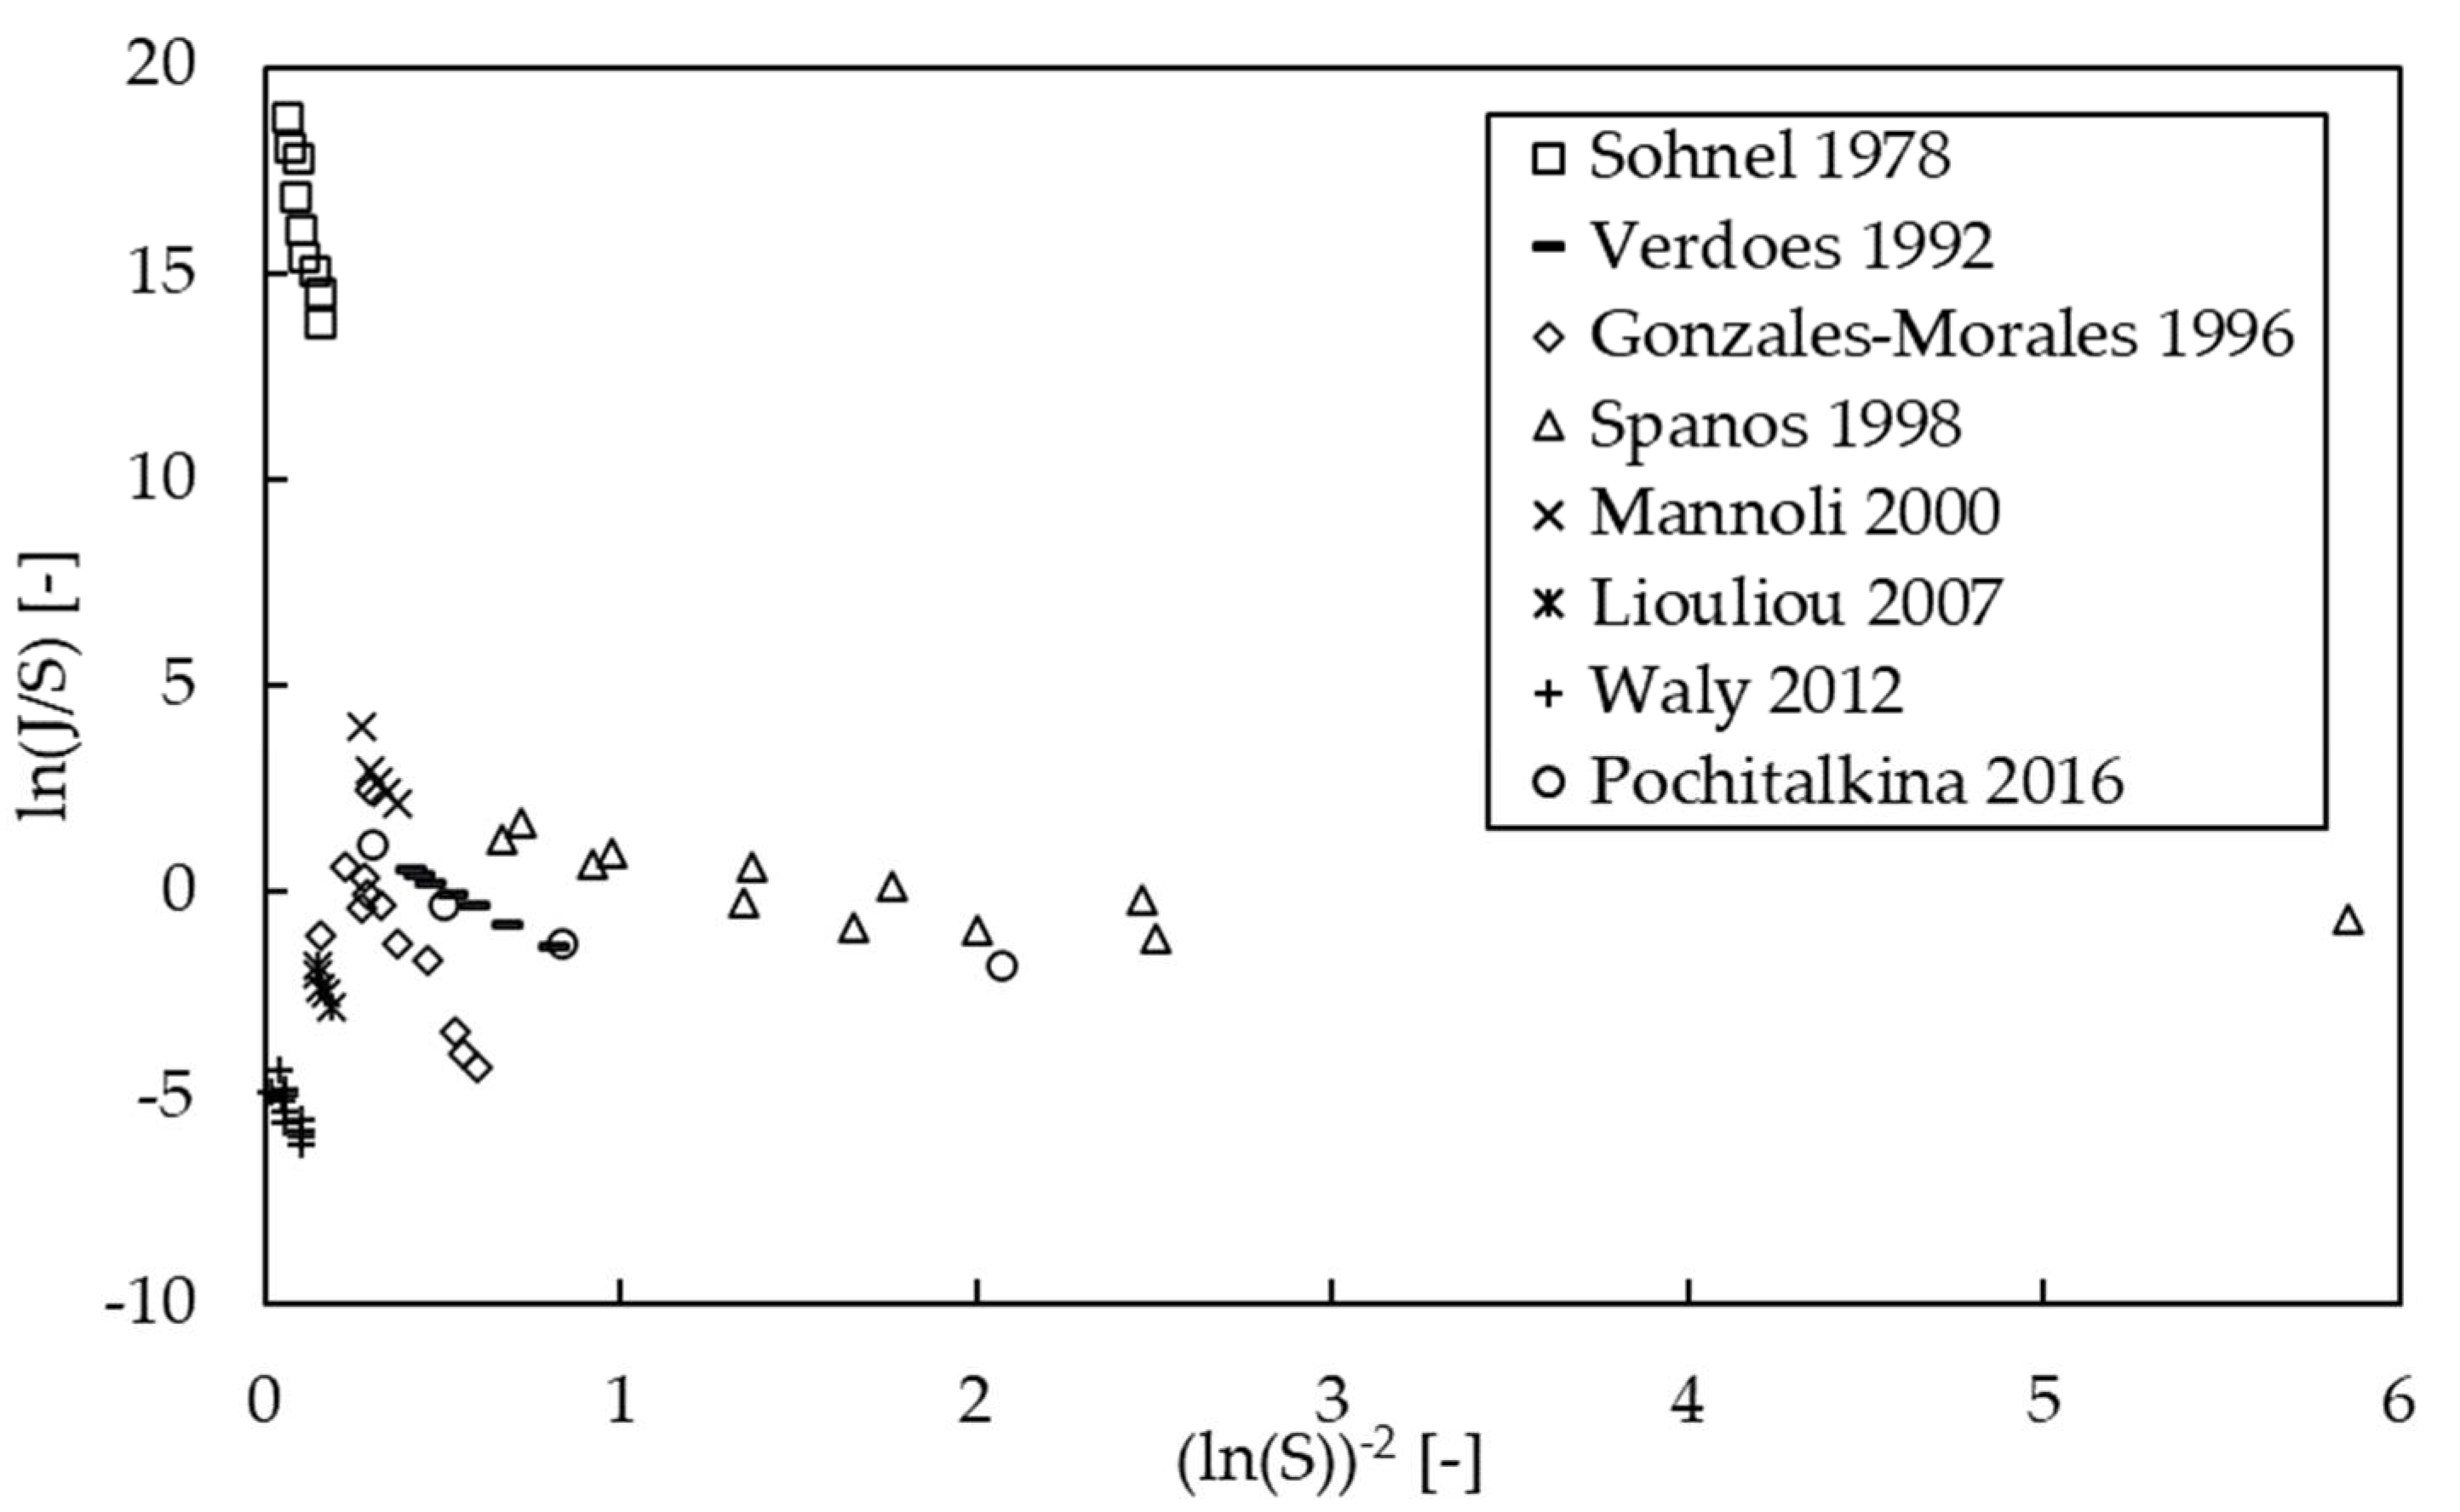
This relation is plotted in Figure 6, and a linear relation is expected. Indeed, most individual studies show linear behavior, but they do not agree with each other at all, due to the varying saturation calculations and solution volumes in these studies. Figure 7 shows the same data with recalculated saturation values.
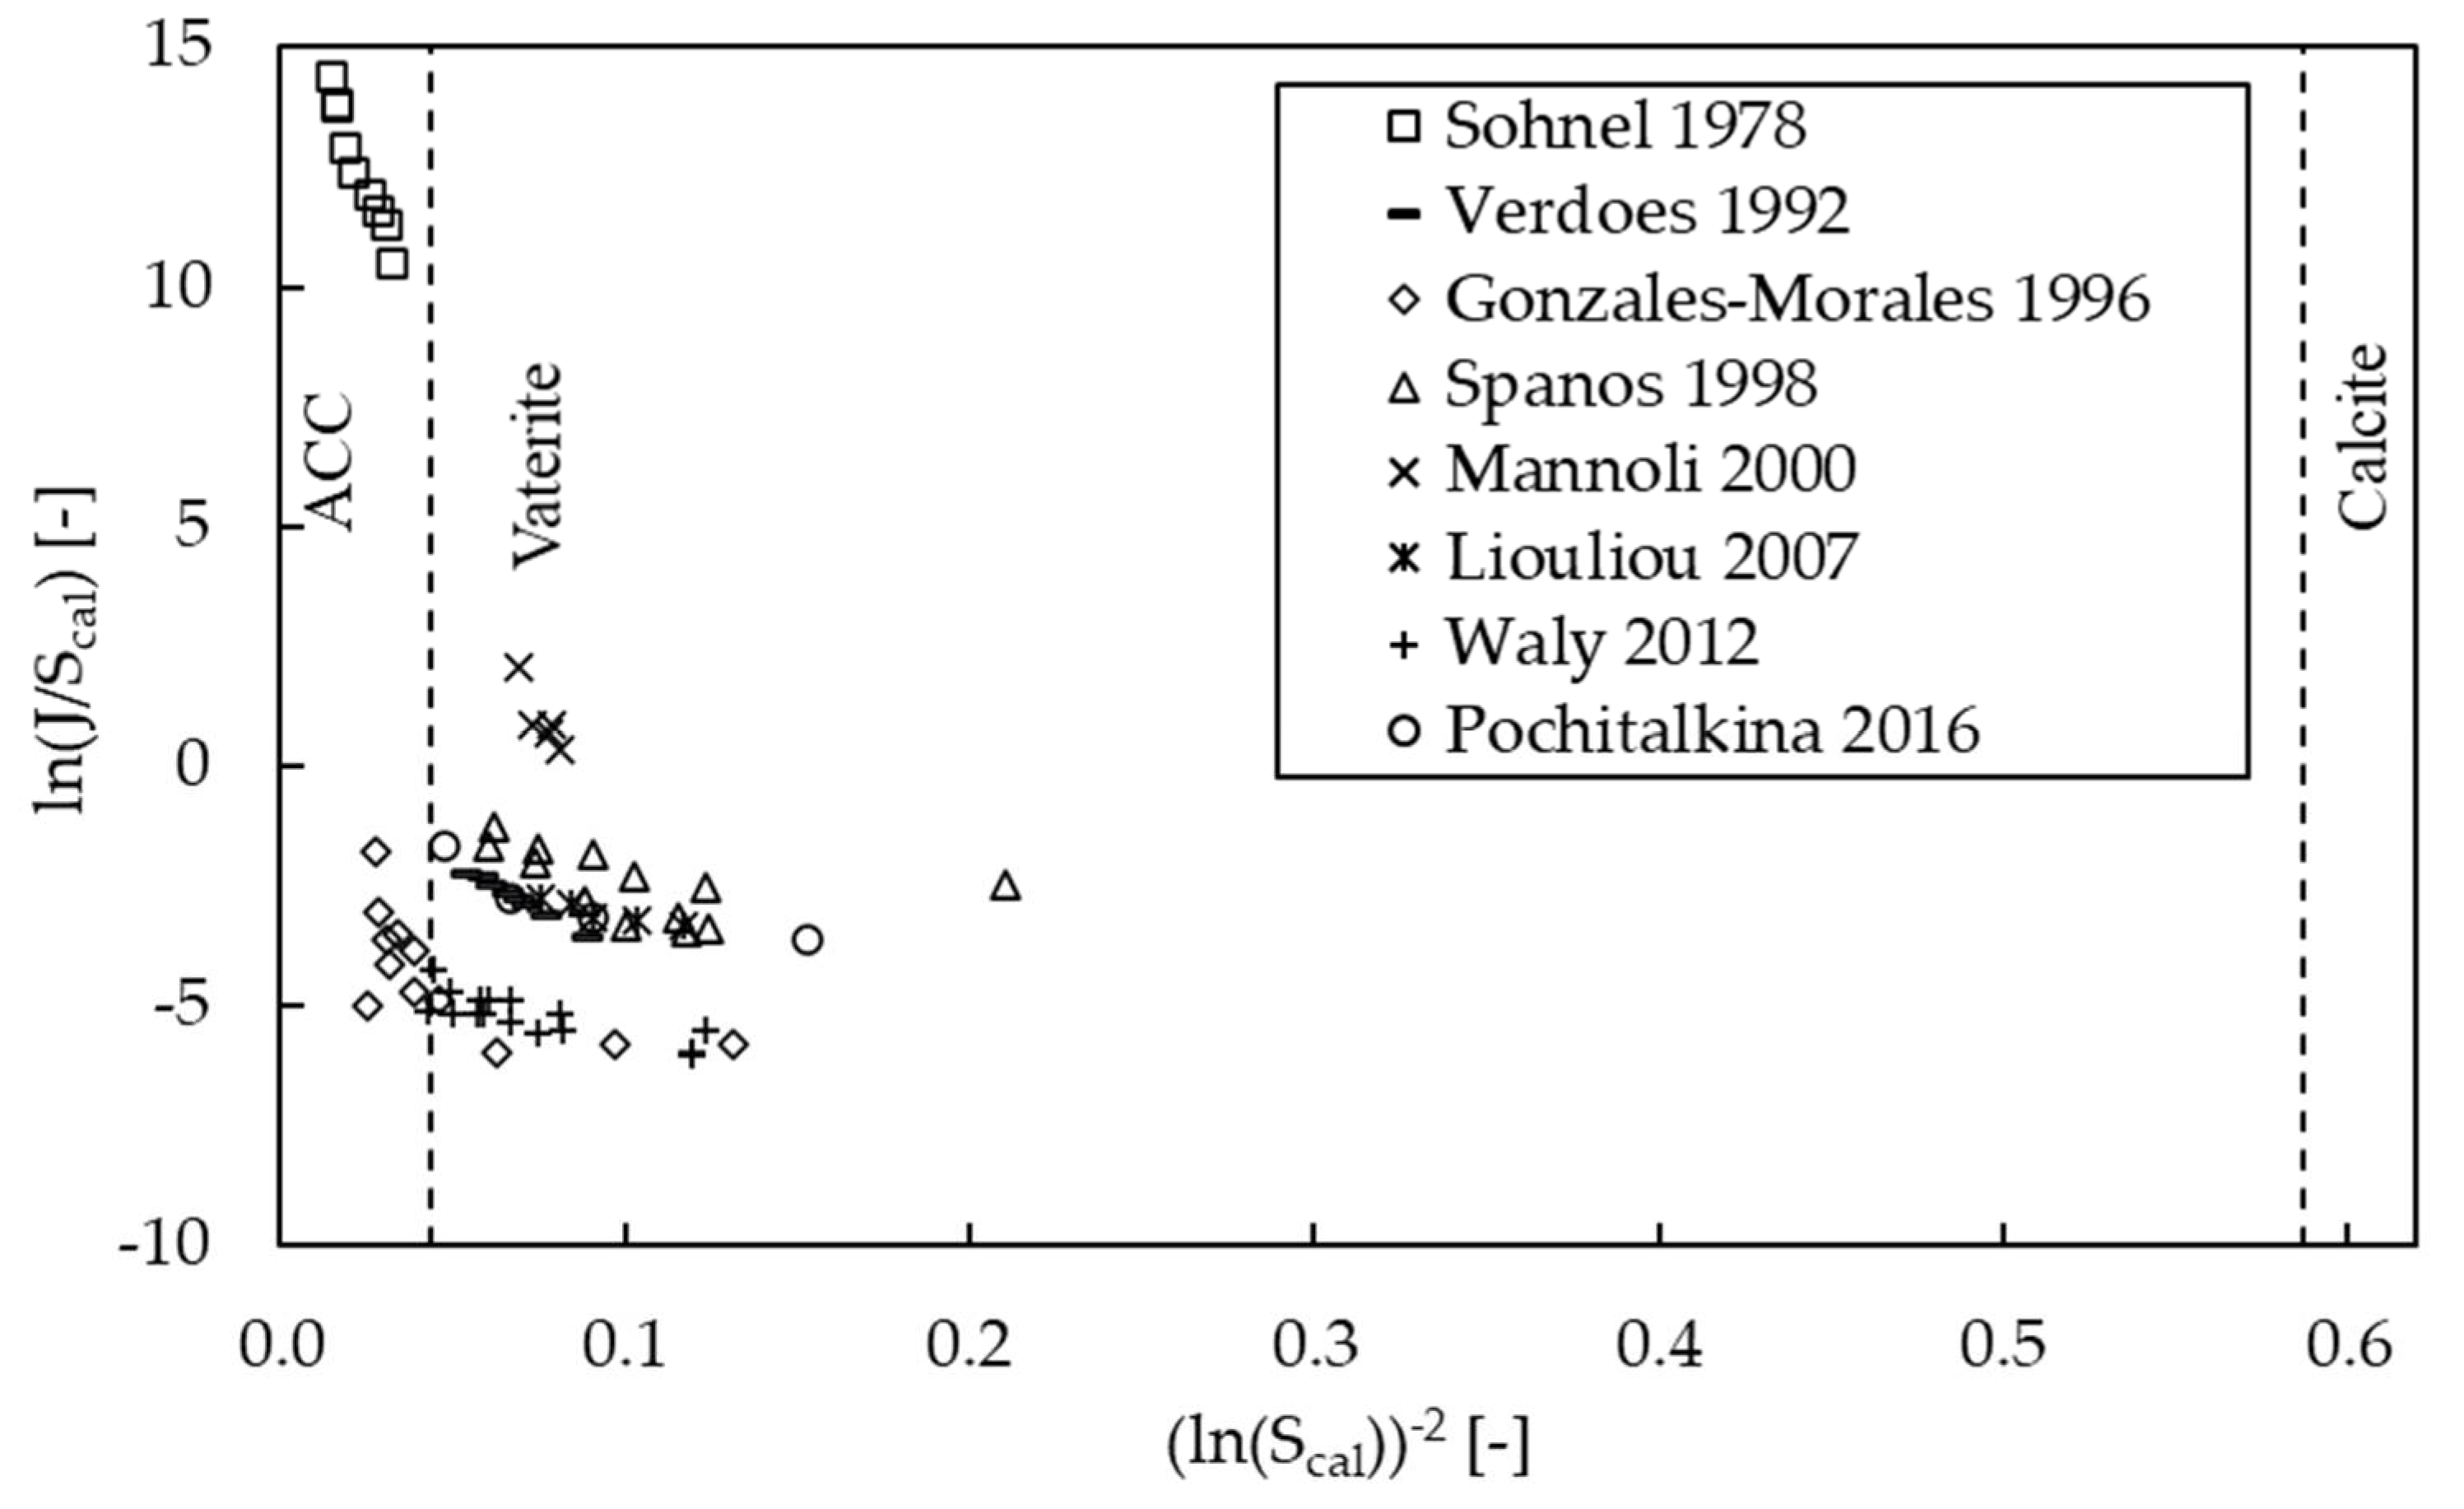
The nucleation data in Figure 7 can now be divided into three groups. The group that is completely in the ACC regime [57], the group that is completely in the vaterite regime [31,42,55,59] and the group that is in both regimes [38,56]. By recalculating the proper saturation values, it now becomes clear that the nucleation rates reported by Söhnel [57] are so high because he regards the ACC polymorph.
The group that has data for both polymorphs [38,56] does not show such high nucleation rates in the ACC regime. This is likely caused by the detection method used in these studies. The induction time is measured by a pH electrode in the study of Gomez-Morales. Their pH results show an increasing pH drift for a significant portion of their experiments. This should not happen after mixing CaCl2 and K2CO3 solutions. This means that the observed induction times are likely significantly longer than the actual induction times. The induction time in the study of Waly is defined as 2% to 3% of the total amount of carbonate precipitated. This is significantly more mass than that of a new crystal nucleus, and therefore the nucleation rate is significantly underestimated. These observations may explain why the data of Gomez-Morales and Waly show lower nucleation rates for both polymorphs when compared to the data of other studies.
Most of the vaterite nucleation data [31,42,55,59,62] are grouped together, but they do not entirely agree. Mannoli expedited the transfer of gaseous CO2 into the liquid and shows, similar to the studies that did this for growth, higher rates and should therefore not be considered for determining the nucleation parameters. The induction time in Verdoes was determined with a Ca2+ electrode, which is significantly less sensitive than a pH electrode, meaning that the measured induction time is likely longer than the actual induction time. Lastly, the data of Spanos are not used for the determination of the parameters. Although the methodology seems fine, the data for growth are significantly different from the other studies, and this holds true for the nucleation data, as well. This leaves three studies with data for the nucleation kinetics [57,59,62].
The remaining nucleation data for vaterite are plotted in Figure 8 as a function of vaterite saturation to obtain the proper trend. One of the data points of Pochitalkina is very close to the ACC regime and is therefore disregarded for the fit, as the classical nucleation theory starts to become less valid for small nuclei sizes. The fit gives values of 0.2820 m−3 s−1 for Ankin and 1.8337 for Bn. By using Equation (13), we obtain a specific surface energy of 16.9 mJ m−2 for vaterite, which is within the reported range. Additionally, using Equation (10), the diffusion rate parameter Andiff is predicted to be 0.0208 m−3 s−1. These values for the An parameters are in a completely different order of magnitude than the previously reported values, and this is the result of using the proposed method to calculate the saturation values, as well as using nucleation rates instead of induction times.
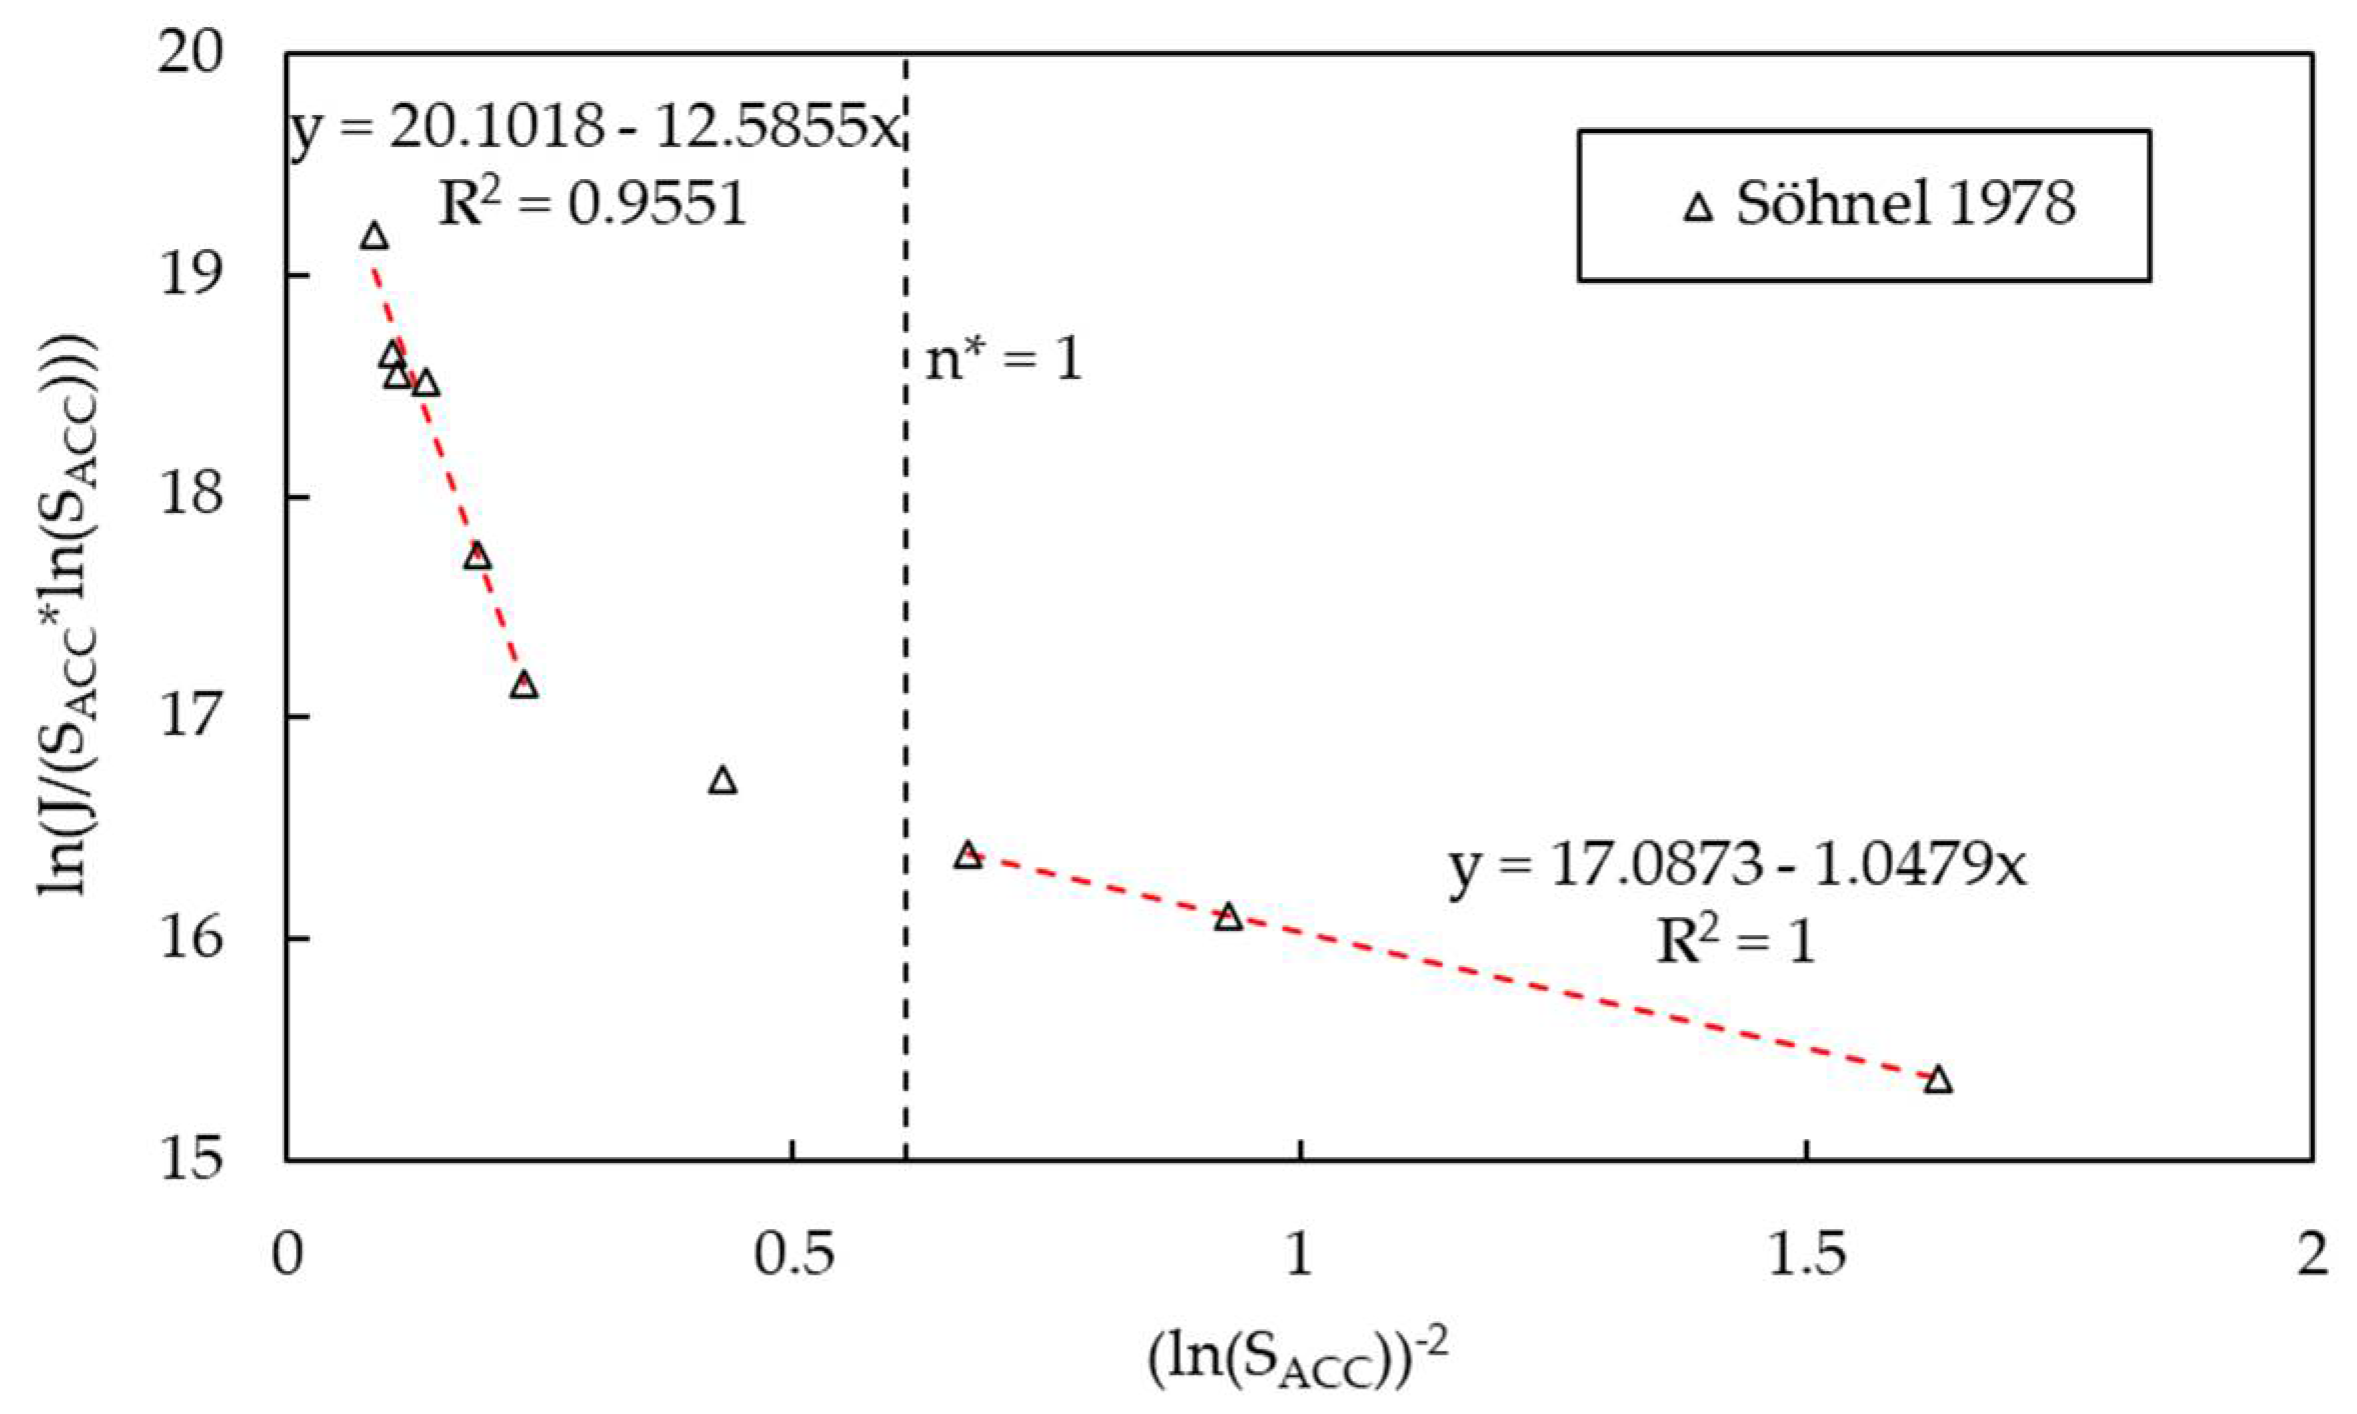
Before plotting the nucleation data of amorphous calcium carbonate (ACC), some consideration to the solubility constant must be given. ACC is an unstable polymorph, thus making it hard to study. Several values for solubility constants of ACC are reported. Two values are reported at 25 °C, namely 10−6.40 mol2 L−2 [63] and 10−6 mol2 L−2 [12]. For an unspecified temperature and without activity corrections, values of 10−7.50 and 10−7.42 are reported [64]. Brecivic provides solution compositions and a recalculation with PhreeqC that shows indeed a value of 10−6.40 mol2 L−2 for the equilibrium constant. ACC nucleation kinetic parameters can now be determined by plotting the data of Söhnel [57] with this equilibrium solubility constant, as shown in Figure 9.
The data in Figure 9 show two linear relations, indicating that the data might include two ACC polymorphs. One possible explanation of the two behaviors is the way the measured volume is approximated. However, even when the volume correction is neglected or exaggerated, the two distinct behaviors remain. Therefore, it is more likely that this behavior can be explained by two different polymorphs. It has been shown that, without additives, there are at least two forms of ACC [65]. Various forms of ACC may have different levels of hydration by including water molecules in the crystal lattice [66,67]. This would require an adjustment of the IAP with the water activity. As Söhnel did not discuss the identity of the ACC, we assumed that there is no water in the crystal roster.
The presence of two polymorphs is further substantiated by the calculation of nucleus size following classical nucleation theory. When the critical nucleus size, given by Equation (17) [10], becomes too small, stable nuclei cannot form anymore, and it is likely that another polymorph with higher solubility becomes dominant. The ionic activity product for a critical nucleus size of one molecule is calculated to be 10−5.84 for ACC, which clearly separates the two polymorphs in Figure 9. This does not mean that the value of the solubility of the second ACC polymorph, which we here call ACC2, equals this value. Realistically, this value lies somewhere in the transition zone and has therefore a value between 10−5.87 and 10−5.51 and may change further depending on the degree of hydration of this polymorph.
n * = ( 2 γ A f 3 k b T l n 2   S   ( V f V m N A ) 2 3 ) 3
where n* is the amount of molecules in a critical nucleus size.
For now, the parameters of both ACC and ACC2 are both determined with the solubility product of ACC. The nucleation rate parameter for diffusion limitation Andiff is 2.64 × 10⁷ m−3 s−1, the nucleation parameter Bn is 1.0479 and the specific surface energy is 10.2 mJ m−2. Alternatively, by using Equation (16), the kinetic rate parameter Ankin is predicted to be 2.96 × 10⁸ m−3 s−1. The values for ACC2 are Andiff is 5.37 × 10⁸ m−3 s−1 and Bn is 12.59 as a function of the solubility constant of ACC.
All the parameters determined in this study were summarized in Table 4. About half of the parameters in this study are based on data from at least two different sources. It is desirable to base all parameters on more data, especially the parameters that are based on very few data points.
The results from this study show the importance of correctly determining the saturation value, especially to at least determine the correct dominant polymorph for a solution. Many studies work with incorrectly or incompletely reported experimental conditions to study the right polymorph or report the morphology of a different polymorph. This situation is complicated further, as metastable polymorphs can transform into a more stable polymorph (e.g., ACC to vaterite or vaterite into calcite) after they are formed and before the existence of the polymorph is confirmed by, for example, X-ray diffraction.
As a result, several studies try to explain the discrepancies currently in the literature with alternative parameters, such as the calcium-to-carbonate ratio, the pH, or the ionic strength. However, we have shown in this study that the kinetic behavior of the various polymorphs of calcium carbonate can be described correctly by the classical growth and nucleation theory, i.e., if the saturation is calculated correctly and if experiments are conducted with the properly reported, controllable, measurable, and reproducible environmental conditions.

4. Conclusions

The aim of this study was to find consistent parameters from the data available in the literature to describe the kinetics of growth and nucleation of the various polymorphs of calcium carbonate.
The amount of and variance in both parameters and methods to study the kinetics of calcium carbonate crystallization currently in the literature are large. While any method can work for a given process or experiment and produce associated parameters, problems arise when combining different processes, such as growth and nucleation, or when comparing data from different sources, as was shown in this study.
When comparing the kinetic data from the different sources, we had to disregard the majority of studies reporting kinetic parameters either because the solution composition and reported rates were not reported clearly enough and could not be correlated to each other or because the experimental setup and methodology could not identify the correct polymorph. After careful screening of the studies and a consistent and meticulous recalculation of saturation values, a set of parameters for growth and nucleation were determined. The newly derived kinetic parameters identified various growth and nucleation mechanisms and allowed us to predict the correct rates and polymorphs for designing processes and experiments.
Growth parameters were determined for the calcite, vaterite and amorphous calcium carbonate (ACC) polymorphs. Within the calcite polymorph, two different growth mechanisms were identified, namely the spiral growth mechanism and the mixed growth mechanism, consisting of both spiral growth and surface nucleation. Interestingly, the spiral growth was not second order, even though being second order is typically attributed to it.
In the nucleation kinetics, a second amorphous calcium carbonate polymorph was found, with a recalculated solubility constant between 10−5.87 and 10−5.51 mol2 kgw−2, but these values should be adapted for the correct level of hydration of this polymorph. The parameters for the nucleation, as well as the specific surface energy of vaterite and amorphous calcium carbonate, were determined.

Author Contributions

Conceptualization, methodology, formal analysis, investigation, writing—original draft preparation and visualization, L.B.; writing—review and editing, supervision, project administration and funding acquisition, L.A.v.P. All authors have read and agreed to the published version of the manuscript.

Funding

This research was funded by the Dutch Ministry of Economic Affairs, through ‘STW perspectief’ program BioGeoCivil, under the project BioFix: Bio-mediated ground improvement to mitigate liquefaction and piping of granular sediments (11337).

Data Availability Statement

No new data were created or analyzed in this study. Data sharing is not applicable to this article. All recalculated data are reported in the article.

Conflicts of Interest

The authors declare no conflict of interest.

References

  1. Zuddas, P.; Mucci, A. Kinetics of calcite precipitation from seawater: I. A classical chemical kinetics description for strong electrolyte solutions. Geochem. Cosmochem. Acta 1994, 58, 4353–4362. [Google Scholar] [CrossRef]
  2. Tai, C.Y.; Chang, M.C. Growth of calcite seeds in a magnetized environment. J. Cryst. Growth 2014, 389, 5–11. [Google Scholar] [CrossRef]
  3. Chhim, N.; Kharbachi, C. Inhibition of calcium carbonate crystal growth by organic additives using the constant composition method in conditions of recirculating cooling circuits. J. Cryst. Growth 2017, 472, 35–45. [Google Scholar] [CrossRef] [Green Version]
  4. Reddy, M.M.; Nancollas, G.H. The Crystallization of Calcium Carbonate 1. Isotopic Exchange and Kinetics. J. Colloid Interface Sci. 1971, 36, 166–172. [Google Scholar] [CrossRef]
  5. Alamdari, A.; Alamdari, A.; Mowla, D. Kinetics of calcium carbonate precipitation through CO2 absorption from flue gas into distiller waste of soda ash plant. J. Ind. Eng. Chem. 2014, 20, 3480–3486. [Google Scholar] [CrossRef]
  6. Van Paassen, L.A. Biogrout, Ground Improvement by Microbial Induced Carbonate Precipitation. Ph.D. Thesis, Delft University of Technology, Delft, The Netherlands, 2009. [Google Scholar]
  7. Kim, D.H.; Mahabadi, N.; Jang, J.; van Paassen, L.A. Assessing the kinetics and pore-scale characteristics of biological calcium carbonate precipitation in porous media using a microfluidic chip experiment. Water Resour. Res. 2021, 56, e2019WR025420. [Google Scholar] [CrossRef]
  8. Busenberg, E.; Plummer, L.N. A comparative study of the dissolution and crystal growth kinetics of calcite and aragonite. Stud. Diagenesis USGS Bull. 1986, 1578, 139–168. [Google Scholar]
  9. Plummer, L.N.; Busenberg, E. The solubilities of calcite, aragonite and vaterite in CO2-H2O solutions between 0 and 90 C, and an evaluation of the aqueous model for the system CaCO3-CO2-H2O. Geochim. Cosmochim. Acta 1982, 46, 1011–1040. [Google Scholar] [CrossRef]
  10. Kaschiev, D.; Rosmalen, G.M. Review: Nucleation in solutions revisited. Cryst. Res. Technol. 2003, 38, 555–574. [Google Scholar] [CrossRef]
  11. Parkhurst, D.L. User’s Guide to PHREEQC: A Computer Program for Speciation, Reaction-Path, Advective-Transport and Inverse Geochemical Calculations; United States Geological Survey: Lakewood, CO, USA, 1995.
  12. Ogino, T.; Suzuki, T.; Sawada, K. The formation and transformation mechanism of calcium carbonate in water. Geochem. Cosmochim. 1987, 51, 2757–2767. [Google Scholar] [CrossRef]
  13. Davies, C.W.; Jones, A.L. The precipitation of silver chloride from aqueous solutions. Trans. Faraday Soc. 1955, 51, 812–817. [Google Scholar] [CrossRef]
  14. De Yoreo, J.J.; Vekilov, P. Principles of crystal nucleation and growth. In Biomineralization; Reviews in Mineralogy and Geochemistry; Dove, P.M., de Yoreo, J.J., Eds.; Mineralogical Society of America: Washington, DC, USA, 2003; pp. 57–93. [Google Scholar]
  15. Nancollas, G.H.; Reddy, M.M. The Crystallization of Calcium Carbonate 2. Calcite Growth Mechanism. J. Colloid Interface Sci. 1971, 37, 824–830. [Google Scholar] [CrossRef]
  16. Mucci, A. Growth kinetics and composition of magnesian calcite overgrowths precipitated from seawater: Quantitative influence of orthophosphate ions. Geochim. Cosmochim. Acta 1986, 50, 2255–2265. [Google Scholar] [CrossRef]
  17. Mucci, A.; Canuel, R.; Zhong, S. The solubility of calcite and aragonite in sulfate-free seawater and the seeded growth kinetics and composition of the precipitates at 25 °C. Chem. Geol. 1989, 74, 309–320. [Google Scholar] [CrossRef]
  18. Dromgoole, E.L.; Walter, L.M. Inhibition of calcite growth rates by Mn2= in CaCl2 solutions at 10, 25, and 50 C. Geochim. Cosmochim. Acta 1990, 54, 2991–3000. [Google Scholar] [CrossRef]
  19. Gutjahr, A.; Dabringhaus, H.; Lacmann, R. Studies of the growth and dissolution kinetics of the CaCO3 polymorphs calcite and aragonite I. Growth and dissolution rates in water. J. Cryst. Growth 1996, 158, 296–309. [Google Scholar] [CrossRef]
  20. Gomez-Morales, J.; Torrent-Burgues, J. Precipitation of calcium carbonate from solutions with varying Ca2+/carbonate ratios. J. Cryst. Growth 1996, 166, 1020–1026. [Google Scholar] [CrossRef]
  21. Kralj, D.; Brecivic, L. Vaterite growth and dissolution in aqueous solution III. Kinetics of transformation. J. Cryst. Growth 1997, 177, 248–257. [Google Scholar] [CrossRef]
  22. Van der Weijden, R.D.; van der Heijden, A.E. The influence of total clacium and total carbonate on the growth rate of calcite. J. Cryst. Growth 1997, 171, 190–196. [Google Scholar] [CrossRef]
  23. Zhang, Y.; Dawe, R. The kinetics of calcite precipitation. Appl. Geochem. 1998, 13, 177–184. [Google Scholar] [CrossRef]
  24. Zuddas, P.; Mucci, A. Kinetics of calcite precipitaiton from seawater: II. The influence of the ionic strength. Geochim. Cosmochim. Acta 1998, 62, 757–766. [Google Scholar] [CrossRef]
  25. Lebron, I.; Suarez, D.L. Calcite nucleation and precipitation kinetics as affected by dissolved organic matter at 25 C and pH > 7.5. Geochem. Cosmochem. 1996, 60, 2765–2776. [Google Scholar] [CrossRef]
  26. Nilsson, Ö.; Sternbeck, J. A mechanistic model for calcite crystal growth using surface speciation. Geochim. Cosmochim. Acta 1999, 63, 217–225. [Google Scholar] [CrossRef]
  27. Parsiegla, K.I.; Katz, J.L. Calcite growth inhibition by copper(II) I. Effect of supersaturation. J. Cryst. Growth 1999, 200, 213–226. [Google Scholar] [CrossRef]
  28. Van der Weijden, C.H.; van der Weijden, R.D. Calcite growth: Rate dependence on saturation, on ratios of dissolved calcium and (bi)carbonate and on their complexes. J. Cryst. Growth 2014, 394, 137–144. [Google Scholar] [CrossRef]
  29. Zhu, G.; Li, H. Crystallization behavior and kinetics of calcium carbonate in highly alkaline and supersaturated system. J. Cryst. Growth 2015, 428, 16–23. [Google Scholar] [CrossRef]
  30. Kralj, D.; Brecivic, L. Vaterite growth and dissolution in aqueous solution I. Kinetics of crystal growth. J. Cryst. Growth 1990, 104, 793–800. [Google Scholar] [CrossRef]
  31. Spanos, N.; Koutsoukos, P.G. Kinetics of Precipitation of Calcium Carbonate in Alkaline pH at Constant Supersaturation. Spontaneous and Seeded Growth. J. Phys. Chem. B 1998, 102, 6679–6684. [Google Scholar] [CrossRef]
  32. Olderoy, M.O.; Xie, M. Growth and Nucleation of Calcium Carbonate Vaterite Crystals in Presence of Alginate. Cryst. Growth Des. 2009, 9, 5176–5183. [Google Scholar] [CrossRef]
  33. Andreassen, J.P.; Hounslow, M.J. Growth and Aggregation of Vaterite in Seeded-Batch Experiments. AIChE J. 2004, 50, 2772–2782. [Google Scholar] [CrossRef]
  34. Wolthers, M.; Nehrke, G. Calcite growth kinetics: Modeling the effect of solution stoichiometry. Geochim. Cosmochim. Acta 2012, 77, 121–134. [Google Scholar] [CrossRef] [Green Version]
  35. Andersson, M.P.; Dobberschütz, S. A Microkinetic Model of Calcite Step Growth. Angew. Chem. Int. Ed. 2016, 55, 11086–11090. [Google Scholar] [CrossRef]
  36. Sand, K.K.; Tobler, D.J. Calcite Growth Kinetics: Dependence on Saturation Index, Ca2+:CO32− Acitvity Ratio, and Surface Atomic Structure. Cryst. Growth Des. 2016, 16, 3602–3612. [Google Scholar] [CrossRef]
  37. Kavanagh, A.M.; Rayment, T. Inhibitor Effects on Calcite Growth at Low Supersaturations. J. Chem. Soc. Faraday Trans. 1990, 86, 965–972. [Google Scholar] [CrossRef]
  38. Gomez-Morales, J.; Torrent-Burgues, J. Nucleation of calcium carbonate at different initial pH conditions. J. Cryst. Growth 1996, 169, 331–338. [Google Scholar] [CrossRef]
  39. Lin, R.; Zhang, J.Y. Nucleation and growth kinetics in synthesizing nanometer calcite. J. Cryst. Growth 2002, 245, 309–320. [Google Scholar] [CrossRef]
  40. Sugiura, Y.; Onuma, K. Growth dynamics of vaterite in relation to the physico-chemical properties of its precursor, amorphous calcium carbonate, in the Ca-CO3-PO4 system. Am. Mineral. 2016, 101, 289–296. [Google Scholar] [CrossRef]
  41. Lorens, R.B. Sr, Cd, Mn and Co distribution coefficients in calcite as a function of calcite precipitation rate. Geochim. Cosmochim. Acta 1981, 45, 553–561. [Google Scholar] [CrossRef]
  42. Manoli, F.; Dalas, E. The effect of sodium alginate on the crystal growth of calcium carbonate. J. Mater. Sci. Mater. Med. 2002, 13, 155–158. [Google Scholar] [CrossRef]
  43. Tai, C.Y.; Chang, M.C. Magnetic effects on crystal growth rate of calcite in a constant-composition environment. J. Cryst. Growth 2008, 310, 3690–3697. [Google Scholar] [CrossRef]
  44. Vavouraki, A.I.; Putnis, C.V. An Atomic Force Microscopy study of the growth of calcite in the presence of sodium sulfate. Chem. Geol. 2008, 253, 243–251. [Google Scholar] [CrossRef]
  45. Perdikouri, C.; Putnis, C.V. An Atomic Force Microscopy Study of the Growth of a Calcite Surface as a Function of Calcium/Total Carbonate Concentration Ratio in Solution at Constant Supersaturation. Cryst. Growth Des. 2009, 9, 4344–4350. [Google Scholar] [CrossRef]
  46. Ruiz-Agudo, E.; Putnis, C.V. Specific effects of background electrolytes on the kinetics of step propagation during calcite growth. Geochim. Cosmochim. Acta 2011, 75, 3803–3814. [Google Scholar] [CrossRef]
  47. Ruiz-Agudo, E.; Putnis, C.V. Effect of pH on calcite growth at constant aCa2+/aCO32- ratio and supersaturation. Geochim. Cosmochim. Acta 2011, 75, 284–296. [Google Scholar] [CrossRef]
  48. Gebrehiwet, T.A.; Reddem, G.D. The Effect of the CO32− to Ca2+ Ion activity ratio on calcite precipitation kinetics and Sr2+ partitioning. Geochem. Trans. 2012, 13, 1. [Google Scholar] [CrossRef]
  49. Hong, M.; Teng, H.H. Implications of solution chemistry effects: Direction-specific restraints on the step kinetics of calcite growth. Geochim. Cosmochim. Acta 2014, 141, 228–239. [Google Scholar] [CrossRef]
  50. Nielsen, M.R.; Sand, K.K. Inhibition of Calcite Growth: Combined Effects of Mg2+ and SO42−. Cryst. Growth Des. 2016, 16, 6199–6207. [Google Scholar] [CrossRef]
  51. Teng, H.H.; Dove, P.M. Kinetics of calcite growth: Surface processes and relationships to macroscopic rate laws. Geochim. Cosmochim. Acta 2000, 64, 2255–2266. [Google Scholar] [CrossRef]
  52. Bracco, J.N.; Grantham, M.C. Calcite Growth Rates As a Function of Aqueous Calcium-to-Carbonate Ratio, Saturation Index, and Inhibitor Concentration: Insight into the Mechanism of Reaction and Poisoning by Strontium. Cryst. Growth Des. 2012, 12, 3540–3548. [Google Scholar] [CrossRef]
  53. Nasser, W.N.; Al Salhi, F.H. Kinetics determination of calcium carbonate precipitation behavior by inline techniques. Powder Technol. 2015, 270, 548–560. [Google Scholar] [CrossRef]
  54. Mucci, A.; Morse, J.W. The incorporation of Mg2+ and Sr2+ into calcite overgrowths: Influences of growth rate and solution composition. Geochim. Cosmochim. Acta 1983, 47, 217–233. [Google Scholar] [CrossRef]
  55. Verdoes, D.; Kashchiev, D. Determination of nucleation and growth rate froms induction times in seeded and unseeded precipitation of calcium carbonate. J. Cryst. Growth 1992, 118, 401–413. [Google Scholar] [CrossRef]
  56. Waly, T.; Kennedy, M.D. On the induction time of CaCO3: Effect of ionic strength. Desalination Water Treat. 2012, 39, 55–69. [Google Scholar] [CrossRef]
  57. Söhnel, O.; Mullin, J.W. A method for the determination of precipitation induction periods. J. Cryst. Growth 1978, 44, 377–382. [Google Scholar] [CrossRef]
  58. Söhnel, O.; Mullin, J.W. Precipitation of calcium carbonate. J. Cryst. Growth 1982, 60, 239–250. [Google Scholar] [CrossRef]
  59. Liouliou, M.G.; Paraskeva, C.A. Heterogeneous nucleation and growth of calcium carbonate on calcite and quartz. J. Colloid Interface Sci. 2007, 308, 421–428. [Google Scholar] [CrossRef]
  60. Flaten, E.M.; Seiersten, M. Induction time studies of calcium carbonate in ethylene glycol and water. Chem. Eng. Res. Des. 2010, 88, 1659–1668. [Google Scholar] [CrossRef]
  61. He, S.; Kan, A.T. Inhibition of calcium carbonate precipitation in NaCl brines from 25 to 90 °C. Appl. Geochem. 1999, 14, 17–25. [Google Scholar] [CrossRef]
  62. Pochitalkina, I.A.; Kekin, P.A. Crystallization Kinetics of Calcium Carbonate at a Stoichiometric Ratio of Components. Russ. J. Phys. Chem. A 2016, 90, 2346–2351. [Google Scholar] [CrossRef]
  63. Brecivic, L.; Nielsen, A.E. Solubility of amorphous calcium carbonate. J. Cryst. Growth 1989, 98, 504–510. [Google Scholar] [CrossRef]
  64. Gebauer, D.; Cölfen, H. Prenucleation clusters and non-classical nucleation. Nano Today 2011, 6, 564–584. [Google Scholar] [CrossRef] [Green Version]
  65. Cartwright, J.H.E.; Checa, A.G. Calcium carbonate polymorphism and its role in biomineralisation: How many ACCs are there? Angew. Chem. Int. Ed. 2012, 51, 11960–11970. [Google Scholar] [CrossRef] [PubMed]
  66. Bots, P.; Benning, L.G. Mechanistic Insights into the Crystallization of Amorphous Calcium Carbonate (ACC). Cryst. Growth Des. 2012, 12, 3806–3814. [Google Scholar] [CrossRef]
  67. Saharay, M.; Yazaydin, A.O. Dehydration-Induced Amorphous Phases of Calcium Carbonate. J. Phys. Chem. B 2013, 117, 3328–3336. [Google Scholar] [CrossRef] [PubMed]
Figure 1. Selected growth data for the three polymorphs of calcium carbonate (from left to right calcite, vaterite and amorphous calcium carbonate (ACC)) plotted against the ionic activity product of calcium carbonate. The data of Nancollas, Kralj, Teng and Nasser were used to fit kinetic parameters, as shown in Figure 2, Figure 3 and Figure 4. From left to right, the growth types are calcite spiral growth, calcite mixed growth, vaterite growth and ACC growth. As the ionic activity product increases, less stable polymorphs become the dominant growth type. The red lines are the trend lines, which were fitted by using the selected data for each growth mechanism or mineral type, as shown in Figure 2, Figure 3 and Figure 4.
Crystals 11 01318 g001
Figure 2. Calcite growth separated in spiral growth (Scal ≤ 1.514) and mixed growth (Scal ≥ 1.549). The dashed black line indicates where vaterite becomes supersaturated. This gives two sets of parameters, one for each of the different calcite growth mechanisms.
Crystals 11 01318 g002
Figure 3. Growth data calculated from Kralj and Nasser, providing a growth rate that is near first order. The dashed line indicates where the supersaturation of ACC starts.
Crystals 11 01318 g003
Figure 4. Growth data calculated from Nasser. Because there are only two data points, the calculated parameters should be used carefully.
Crystals 11 01318 g004
Figure 5. Induction times and saturation values as they are reported in the literature. There seem to be two trends for the data, and no clear correlation between saturation and induction time can be made between different experimental setups.
Crystals 11 01318 g005
Figure 6. Linearized nucleation rates plotted against saturation values reported in the literature. Linear behavior is expected and shown by most individual studies, but there is no agreement between studies.
Crystals 11 01318 g006
Figure 7. Linearized nucleation rates plotted against the recalculated calcite saturation. Most data are now centered in three groups. One completely in the vaterite regime, one completely in the ACC regime and one group passing over this polymorph change. There are no nucleation data for the calcite regime, although several publications report about calcite nucleation.
Crystals 11 01318 g007
Figure 8. Linearized fit of the kinetically limited nucleation rate for vaterite. The black dashed line indicates where supersaturation for ACC begins. The data point of Pochitalkina close to ACC supersaturation is not used for the fit, as the classical nucleation theory starts to break down for small critical nuclei.
Crystals 11 01318 g008
Figure 9. Linearized nucleation data of amorphous calcium carbonate (ACC) assuming diffusion limitation. The data show two linear relations which can be attributed to two separate calcium carbonate nucleation morphologies. The dashed line indicates where the classical nucleation theory predicts a critical nucleus size of one molecule for the first ACC polymorph. This indicates a shift of the solubility constant towards a different polymorph can be expected.
Crystals 11 01318 g009
Table 1. Reported growth rate constants in the literature.
PolymorphGrowth Rate Constant UnitReference
Calcite4.0–8.8L mol−1 s−1 (gseed L−1)−1[4,15]
6.48 × 10⁴L2 mol−1 m−2 s−1[25]
1.43 × 10⁻¹⁰–1.08 × 10⁻⁹mol m−2 s−1[16,17]
5.37 × 10⁻⁷–2.34 × 10⁻⁶mol m−2 s−1[18]
2.91 × 10⁻⁹–1.39 × 10⁻⁶mol m−2 s−1[1]
1.64 × 10⁻⁷–2.81 × 10⁻⁷mol m−2 s−1[19]
2.21 × 10⁻⁸–7.48 × 10⁻⁴mol m−2 s−1[24]
3.42 × 10⁻⁷mol m−2 s−1[26]
6.64 × 10⁻⁸–7.80 × 10⁻⁷mol m−2 s−1[27]
5.8 × 10⁻⁷–3.35 × 10⁻⁶mol m−2 s−1[28]
8.56 × 10⁻⁸–2.65 × 10⁻⁷mol m−2 s−1 kgw−1[23]
4.05 × 10⁻¹¹–1.98 × 10⁻¹⁰ m s−1[20]
5.0 × 10⁻¹⁰m s−1[21]
1.1 × 10⁻¹⁰m s−1[22]
1.13 × 10⁻¹⁰–9.2 × 10⁻¹⁰m s−1[6]
8.08 × 10⁻²⁶ m3 s−1[29]
Vaterite5.60 × 10−10–6.10 × 10⁻¹⁰m s−1[30]
1.06–1.17 × 10⁻¹⁰m s−1[31]
1.71 × 10⁻⁹m s−1[32]
5.27 × 10⁻¹⁰m s−1[33]
Table 2. Experimental conditions for the selected data points in Figure 1.
Nancollas 1971 [15]Kralj
1990 [30]
Van der Weijden
1997 [22]
Spanos
1998 [31]
Teng
2000 [51]
Bracco
2012 [52]
Van der Weijden
2014 [28]
Nasser
2015 [53]
Reported
morphology
CalciteVateriteCalciteVateriteCalciteCalciteCalciteCalcite,
Vaterite, ACC
Growth rate constant4.0–8.85.60–6.10 × 10−101.1 × 10−101.06–1.17 × 10⁻¹⁰--5.8 × 10⁻⁷–3.35 × 10⁻⁶-
UnitL mol−1 s−1 (gseed L−1)−1m s−1m s−1m s−1--mol m−2 s−1-
Temperature (°C)2525222525252225
pH8.539.57–9.857.56–8.909–108.58.25–9.357.56–8.907.62–7.84
Total calcium
concentration
(mM)
0.1492.50.35–0.970.4–2.50.16–0.340.035–0.820.25–0.9710–50
Total carbonate concentration
(mM)
10.12.56.4–680.4–2.55.00–10.11.25–20.06.4–6810–50
Gaseous CO2
exchange
UnknownNoYesNoNoYesYesNo
Ionic strength (mM)15.811.2–317751–8561.85–11.6106–1123.51–22.20.75–0.8638.4–184
Other ions Na, ClNa, ClK, ClNa, K, NO3Na, ClNa, ClK, ClNa, Cl
Table 3. Experimental details of studies on the nucleation of calcium carbonate.
Söhnel
1978 [57]
Verdoes 1992 [55]Gomez-Morales
1996 [38]
Spanos
1998 [31]
Mannoli
2000 [42]
Liouliou
2007 [59]
Waly
2012 [56]
Pochitalkina
2016 [62]
Reported
morphology
UnspecifiedVateriteVaterite + CalciteVateriteVateriteCalciteVaterite + CalciteCalcite
Working
volume (L)
Variable a1.320.20.20.220.3
pH range10.6–10.9107.8–109-108.58.57.8–8.810
Total calcium
concentration (mM)
3.2–330.2–0.5100.4–34–4.753.82–5.4816.9–23.71.1–3.3
Total carbonate
concentration
(mM)
32–3328.3100.4–34–4.753.82–5.483.43–4.801.1–3.3
Ionic strength (mM)12.9–10649.0–49.1503–5070.68–11.6156–18489.5–93.052–1446157–166
Detection methodConducto-metricCa2+
electrode
pH measurementpH measurementpH measurementpH measurementpH measurementLaser optical
Limitationdiffusionunknownkinetickineticunknownkinetickinetickinetic
Other ions
present
Na, ClNa, ClK, ClNa, NO3, KNa, NO3, KNa, NO3, KNa, ClNa, Cl
a This nucleation experiment was performed in a diffusion-limited scenario; therefore, the “detected” volume depends on the measured induction time.
Table 4. Summary of parameters calculated for growth and nucleation Equations (2), (3), (9) and (10) for calcium carbonate polymorphs at 25 °C.
CalciteVateriteACC1ACC2
Kmol2 kgw−210−8.4810−7.91310−6.4010−5.87–10−5.51 e
km s−13.7711 × 10⁻¹² a
5.1709 × 10⁻¹¹ a
5.6117 × 10−92.2842 × 10−7 fn/a
g-0.7475 a
1.7713 a
0.74280.8124 fn/a
Ankinm−3 s−1n/a0.2822.96 × 108 bcn/a
Andiffm−3 s−1n/a0.0208 b2.64 × 107 c5.37 × 108 cd
Bn-n/a1.83371.0479 c12.59 cd
γmJ m−2n/a16.910.2 cn/a
a The first constants are valid for calcite spiral growth up to an IAP of 10−8.30 mol2 kgw−2. The second constants are valid for mixed growth from an IAP of 10−8.29 mol2 kgw−2. b These values are predicted based on theory. c These values are determined under several assumptions, such as mixing time and detected volume, which may influence the actual values of these parameters. Additionally, these parameters were determined under the assumption that no water molecules are present in the crystal roster. d These are tentative values based on the solubility of ACC and should be updated when the exact solubility of ACC2 is determined. e Assuming no water molecules in the crystal roster. f These parameters were determined with only two data points and are therefore uncertain.
Publisher’s Note: MDPI stays neutral with regard to jurisdictional claims in published maps and institutional affiliations.