Article

The Different Inclusions’ Characteristics between Natural and Heat-Treated Tanzanite: Evidence from Raman Spectroscopy

1
School of Gemmology, China University of Geosciences, Beijing 100083, China
2
National Gemstone Testing Center, Shenzhen 518020, China
*
Author to whom correspondence should be addressed.
Crystals 2021, 11(11), 1302; https://doi.org/10.3390/cryst11111302
Submission received: 30 September 2021 / Revised: 18 October 2021 / Accepted: 23 October 2021 / Published: 26 October 2021
(This article belongs to the Special Issue Gem Crystals)

Abstract

:
In this paper, Raman spectroscopy experiments were used to distinguish the characteristics of inclusions (calcite, anatase, graphite etc.) between natural and heat-treated tanzanite. These characteristics were preliminarily divided according to their pleochroism. In natural unheated tanzanite (N5), calcite inclusion is often interspersed with dolomite and has Raman shifts around 156, 283, 710, and 1087 cm−1. In other high temperature treatment samples, the baseline of calcite increased and their Raman peaks gradually shifted towards lower frequencies. Anatase inclusions in natural tanzanite (N5) have four characteristic Raman peaks around 146, 394, 514, and 641 cm−1. Because of the longer Ti-O bond and the wider bond angle distribution caused by high temperature, fewer Raman peaks were observed and the peaks’ intensities were weakened in the heat-treated T7 sample. The black graphite inclusions are often scattered or have a dotted distribution. The most obvious difference between natural and heat-treated samples is that the latter lack the characteristic 1350 cm−1 Raman peak of graphite, thus representing the order and structural incompleteness of graphite. In addition, there are other inclusions in natural unheated tanzanite, such as lead-grey molybdenite with strong metallic luster, randomly scattered prehnite with white dots, orange-yellow rounded rutile, and metallic luster hematite.

1. Introduction

Tanzanite is a blue-violet vanadium-containing zoisite, which was discovered in 1967 [1] and is a form of calcium-aluminum silicate, with an idealized formula of CaAl3Si2O7[SiO4]O(OH) [2]. In addition to being colorless, zoisite has many colors, such as pink, green, yellow, and brown; however, only blue-violet and violet-red crystals can be called tanzanite.
Until now, the Merelani area in northeastern Tanzania is the only producer of gem-quality tanzanite in the world. These deposits are mainly located in metamorphic rocks, marble, and schist of the Neoproterozoic Mozambique Metamorphic Belt (NMMB) [3]. The NMMB extends from Eastern Antarctica to East Africa, and enters the Arabian–Nubian region, which was formed by a series of tectonic and metamorphic events about 900–450 million years ago [4]. Tanzanite and tsavorite are the results of vanadium (and chromium) replacing aluminum in crystal structures, and the formation of tanzanite seems to be related to tsavorite. Following the formation of tsavorite in quartz veins in the anticlinal folds, crystalized tanzanite is formed in the retrograde metamorphism in pockets and lens forms [5,6,7]. The tanzanite mineralization occurs in pressure shadows created by the filling of hydrothermal fissures and boudinage, and the whole process is controlled by the boudinage in the graphite gneiss [8]. According to their fission track dating study, Naeser and Saul determined that tanzanite crystals were formed 585 ± 28 million years ago [9]. Tanzanite often occurs as euhedral colored crystals, associated with low-grade metamorphic mineral assemblages, such as prehnite, calcium zeolites (chabazite, heulandite, mesolite, laumontite), axinite, and blue apatite [10]. In addition, some minerals are frequently associated with tanzanite, e.g., other colored zoisite (brown and yellow), graphite, diopside, pyrite, quartz, grossular (tsavorite), dolomite, and calcite [11].
Natural high-quality blue-violet tanzanite is scarce, which indicates most of the bright blue tanzanite circulating in the market has undergone heat treatment. It has been verified that pleochroism of tanzanite changes from characteristic trichroism (blue, purple, and yellow-green) to dichroism (blue and purple) after high temperature treatment [12].
There are limited inclusions in tanzanite. The most common inclusions are graphite, calcite, actinolite, diopside, anatase, etc. Sometimes, other inclusions such as green tremolite, xenotime, rutile, and hematite can be found [13,14,15]. Another rare and interesting inclusion, merelaniite, was found in tanzanite, which is a new molybdenum-essential member of the cylindrite group and occurs individually or in clusters as dark gray metallic whiskers of circular cross-sections [16,17]. When the growth process of tanzanite is interrupted by the whiskers of merelaniite, growth blockages occur, which are fluid filled and contain dark solids [16]. Some researchers have deduced about whether tanzanite has been heat-treated based on the fluid inclusions. Castillo et al. revealed the presence of intact fluid inclusions is an indicator that the tanzanite has not undergone heat treatment [16]. Malisa proposed that tanzanite had been heated to 240 °C because decrepitation of the fluid inclusion was observed [13]. Olivier deduced tanzanite had been heated to 600 °C from the presence and size of H2S inclusions [6].
At present, there are limited studies about the differences in mineral inclusions between natural and heat-treated tanzanite. The available investments are frequently distinguished by pleochroism or infrared spectroscopy to see if the sample has been heat treated. Raman techniques have been mainly used in the exploration of fluid and solid inclusions in gemstones [15]. Therefore, in this study we used Raman spectroscopy, which is nondestructive, fast, and effective, to investigate inclusions of tanzanite and to observe the differences in spectra between natural and heat-treated tanzanite inclusions. It is hoped that this will provide a new means of identifying heat-treated tanzanite to enrich the knowledge in this area.

2. Materials and Methods
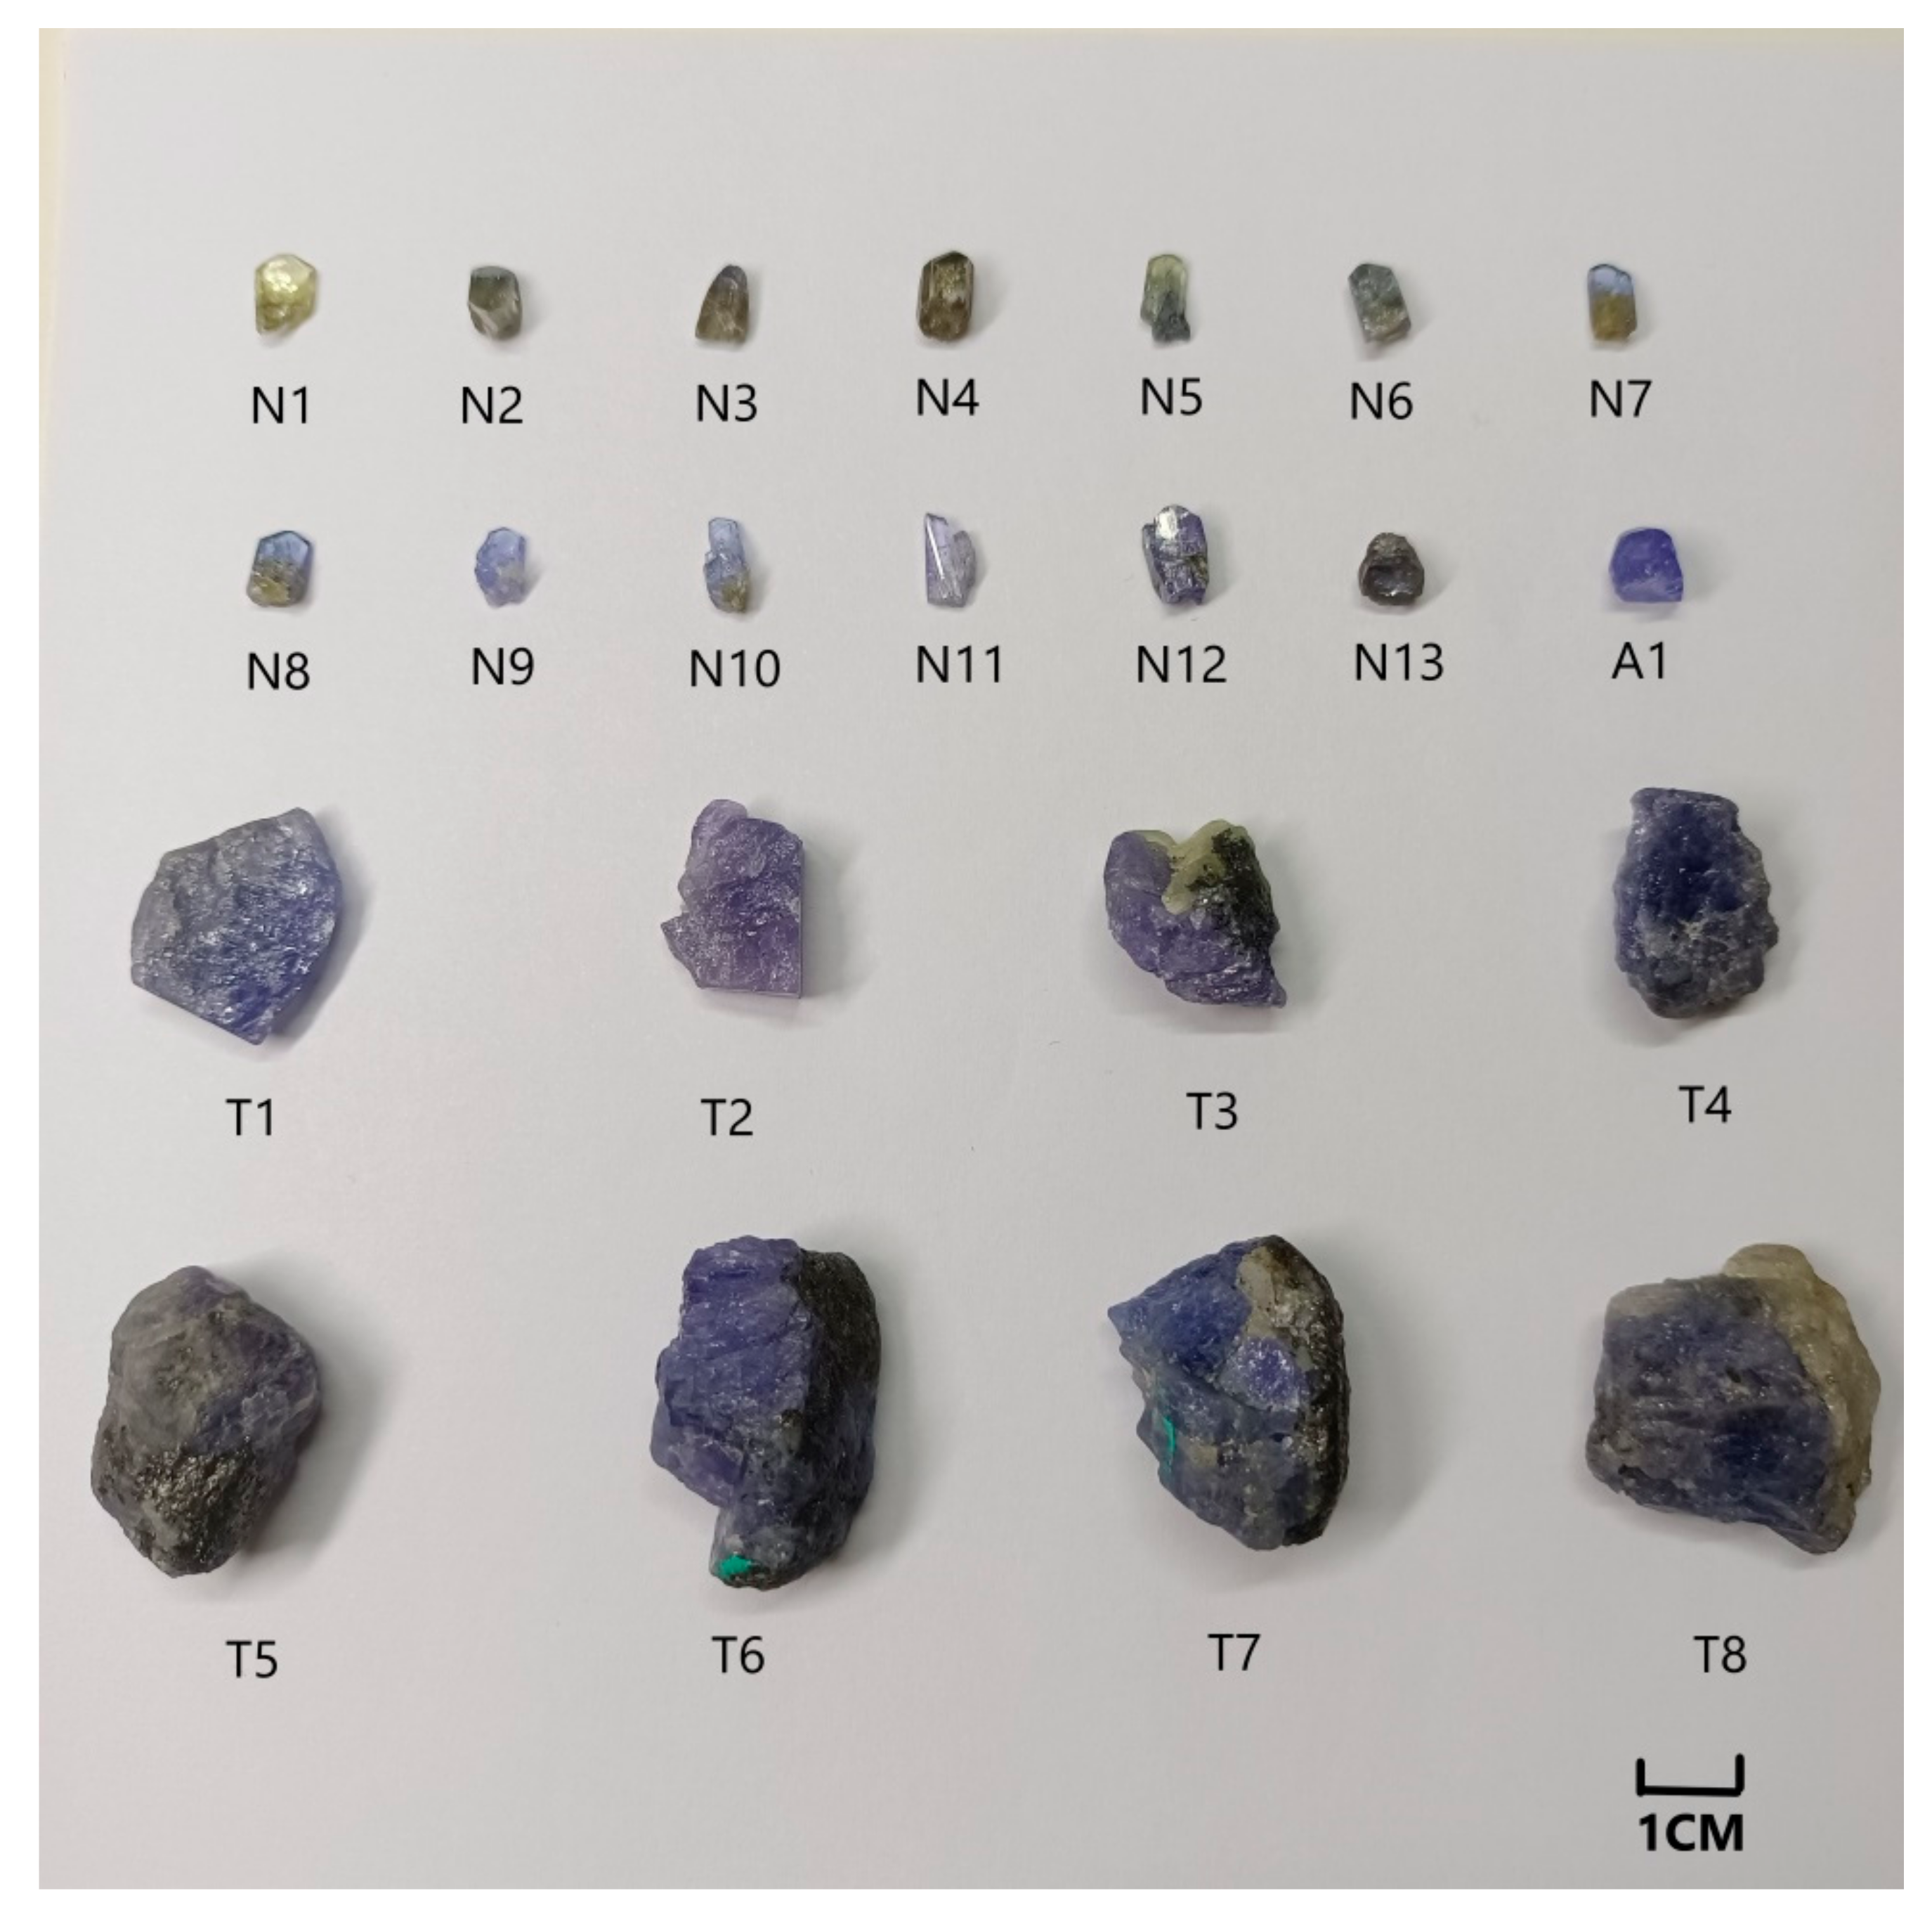
2.1. Materials

Twenty-two samples of natural tanzanite were selected in this study (Figure 1), comprising thirteen unheated samples (N1–N13) and nine heat-treated samples (A1, T1–T8). The detailed characteristics of these samples are described in Table 1. The A1 sample is a translucent tanzanite with a vivid violet-blue color. T1–T8 samples are opaque raw crystals with country rock, and N1–N13 samples are rough stones with different color and transparency.

2.2. Methods

Conventional gemological properties were determined at the Gemological Experimental Teaching Center, School of Gemmology, China University of Geosciences (Beijing) (CUGB). The refractive index was measured by point measurement using a gemstone refractometer. The specific gravity was measured using the hydrostatic weighing method. The pleochroism was observed with a dichroscope and the hardness was determined with Mohs hardness scale. Microscopic observation was carried out using the GI-MP22 gemological photographic microscope.
Raman spectra were collected with two different instruments. One was the LabRAM HR Evolution micro-Raman spectroscope, in the Gem Testing Laboratory at the School of Gemmology, CUGB. The excitation laser was 532 nm and scanning range was 50–2000 cm−1. Two accumulations of 3 s were acquired for each point.
The other spectra analysis was undertaken using an alpha300R confocal Raman microscope (Manufactured by WITec, Germany, laser of 532 nm) at the Laboratory of the Institute of Geology and Geophysics, Chinese Academy of Sciences, Beijing, China. The spectra were collected from three accumulations of 10 s integration.

3. Results

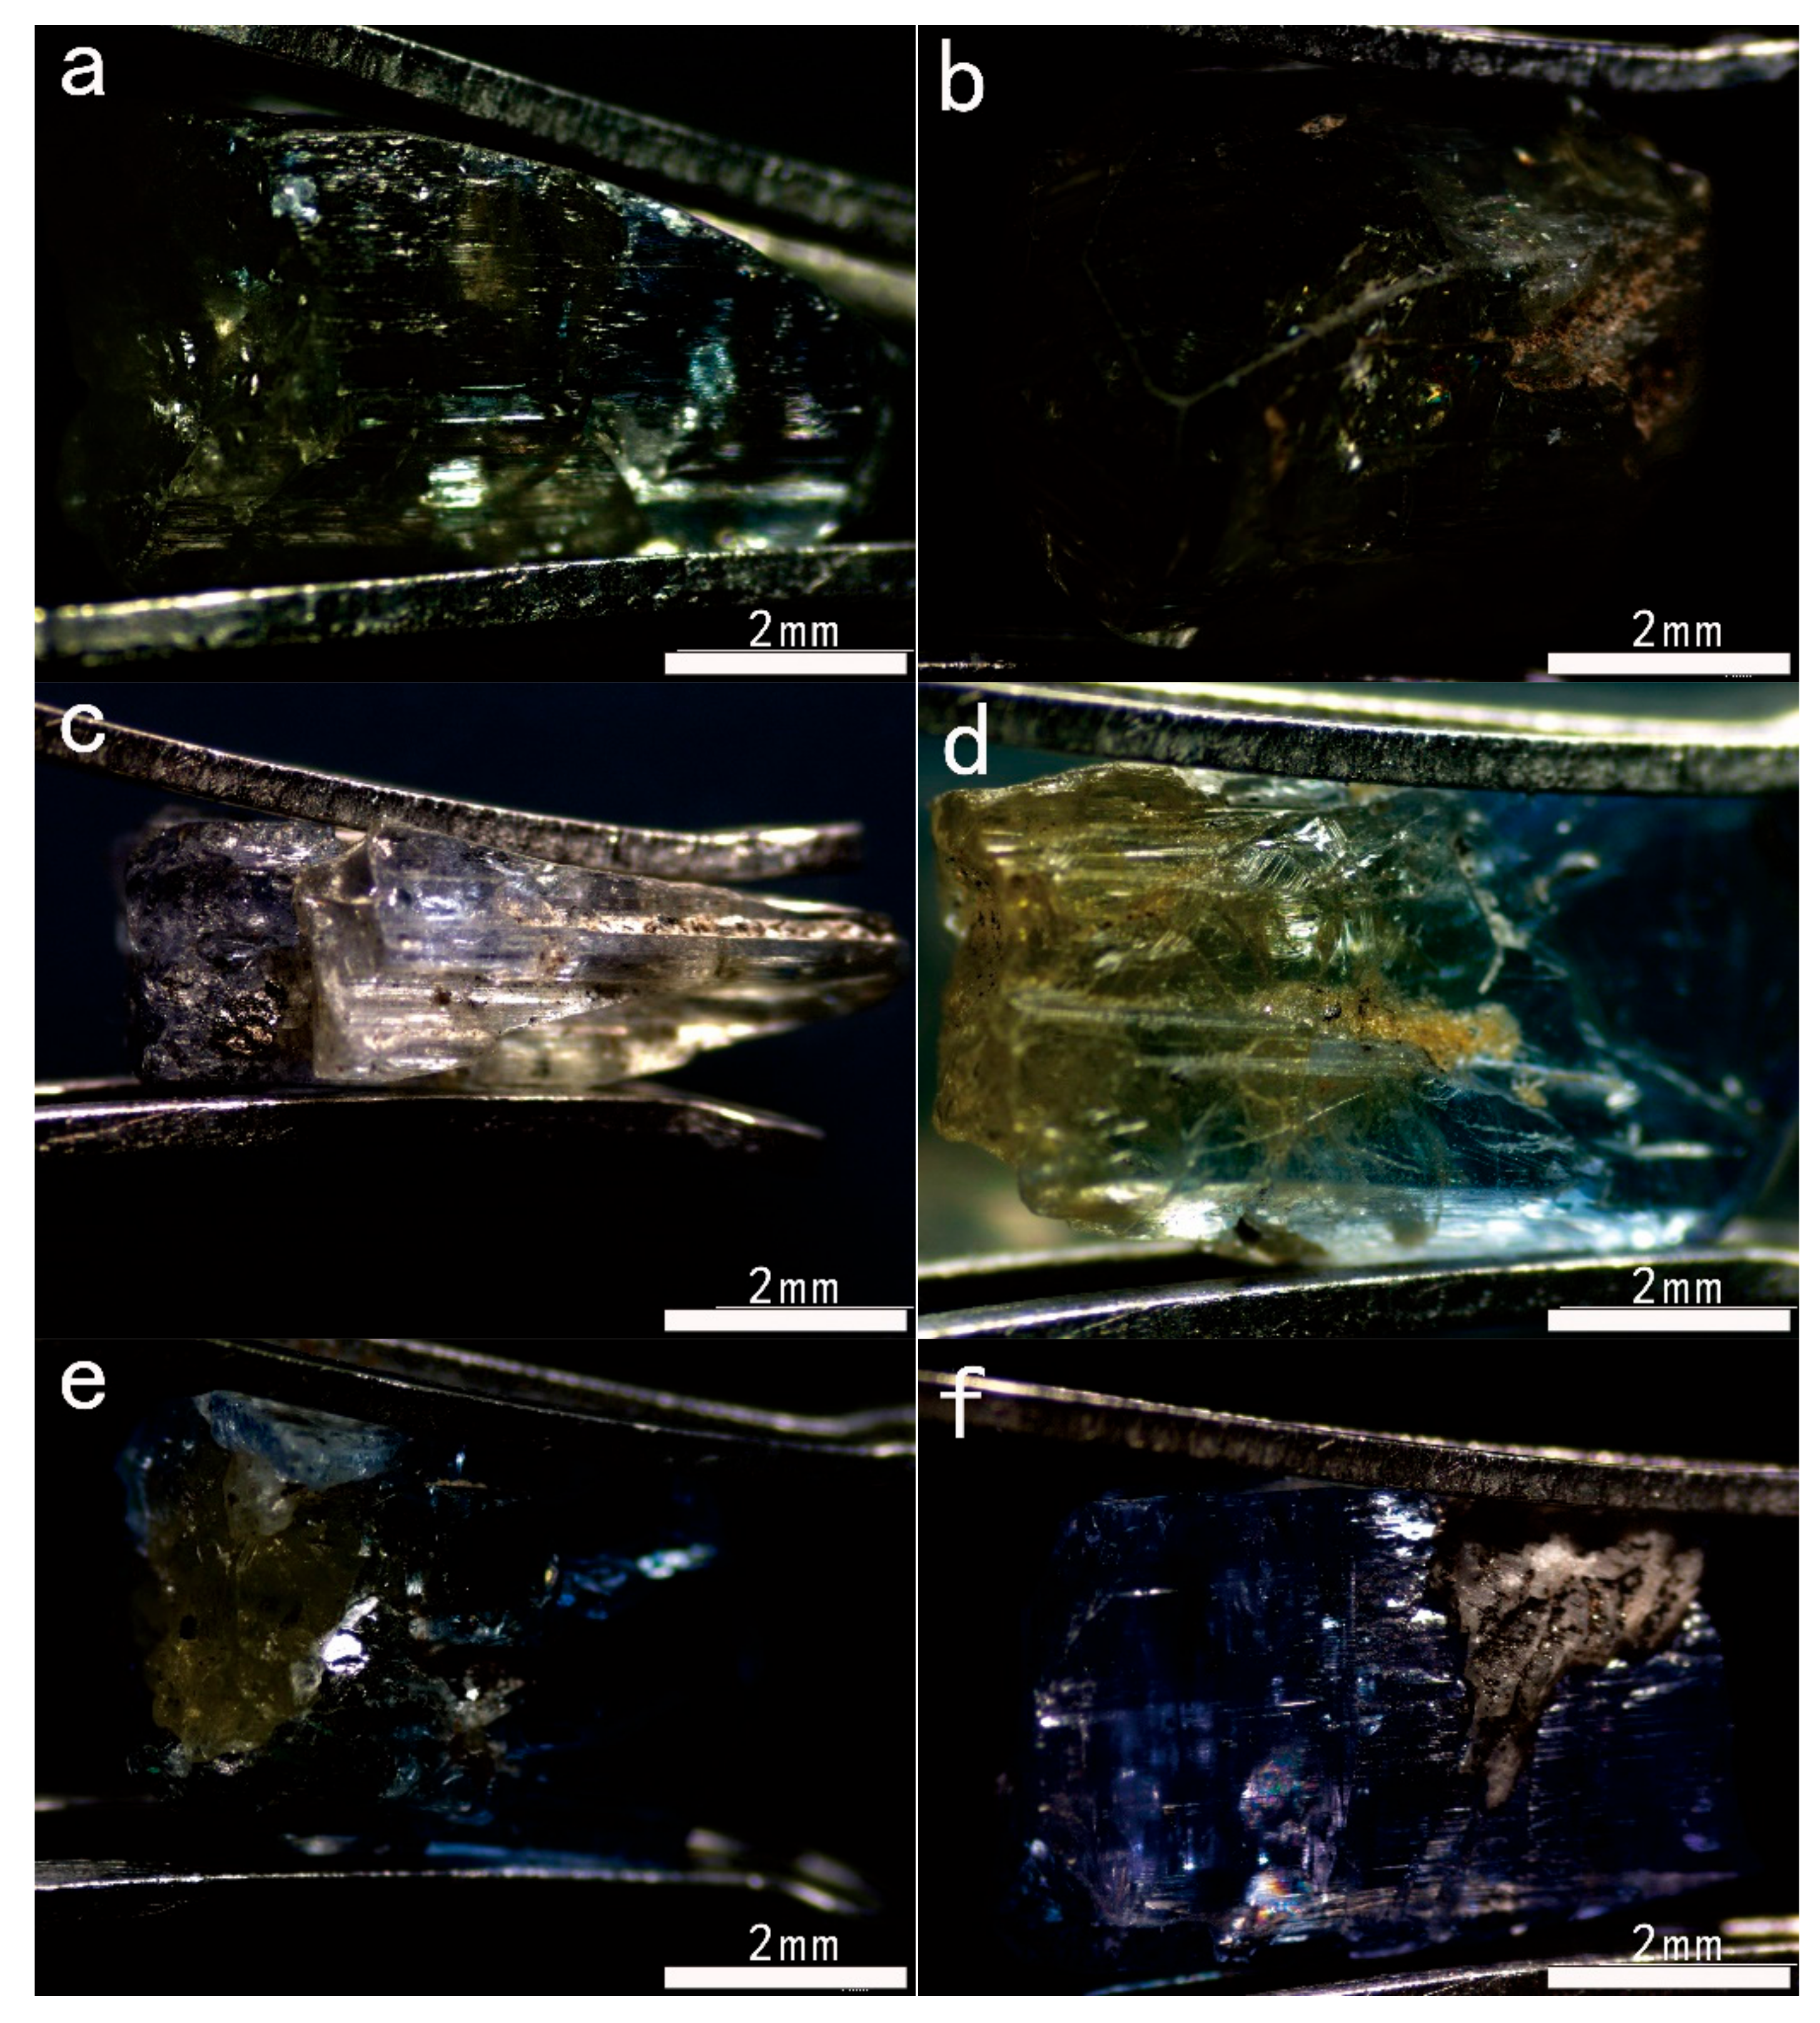
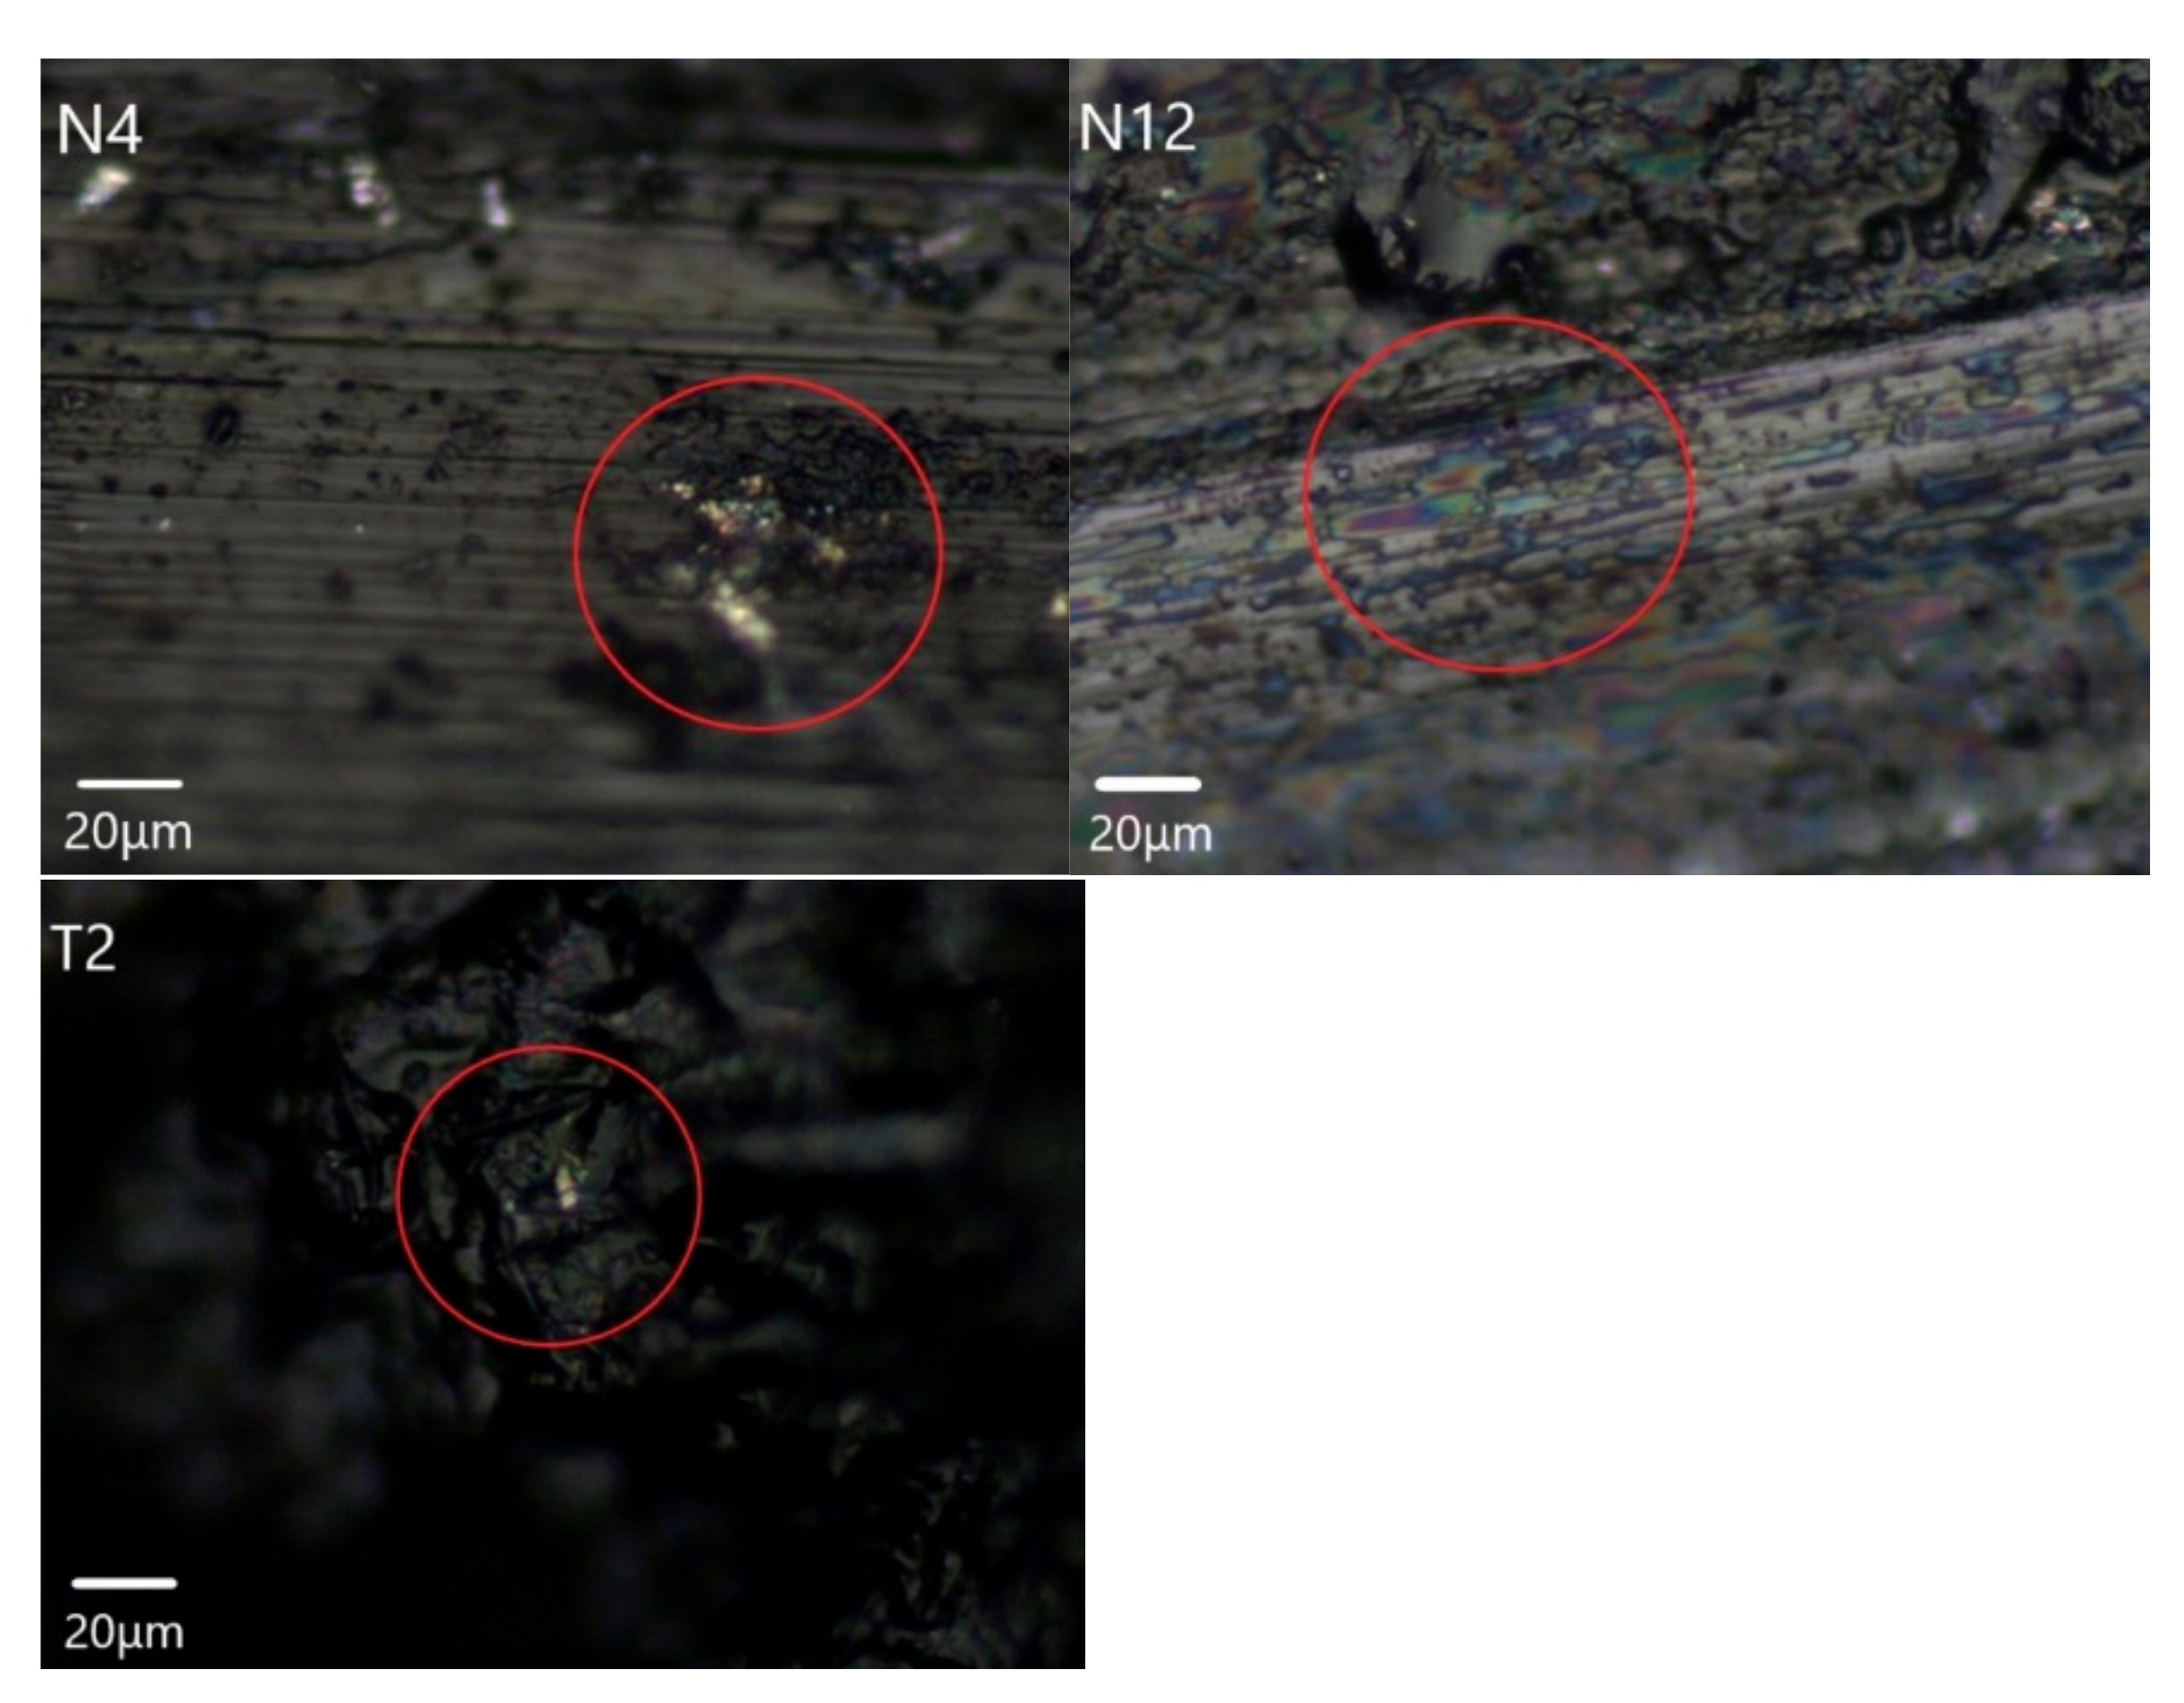
3.1. Conventional Gemological Features

The refractive indices of twenty-two tanzanites were found to range from 1.69 to 1.71, with 6–7 Mohs hardness values and average specific gravity of 3.35. The specific gravity values of samples T1–T8 are not very accurate because they contain country rock.
Eight samples (T1–T8) are all opaque masses with a vitreous luster and blue-violet body color. They have obvious striations parallel to the columnar surface and contain abundant dotted black inclusions. Tanzanite samples T1 and T2 have a few white country rocks, while white country rocks of samples T3–T7 are covered by a large amount of metallic luster minerals (Figure 1).
Natural untreated blue tanzanite has a characteristic blue-violet, violet-blue, and yellow-green trichroism, whereas heat treatment removes the brown-green to grey-yellow color of tanzanite, giving it a blue-violet dichroism visible to the naked eye. Many authors [2,18,19] have studied the polychromism of tanzanite and concluded that the change in polychromism is a valid, reliable, and rapid method of identifying whether tanzanite has been heated. Pluthametwisute et al. [2] also found that there are different color changes after heat treatment. The blue-violet color changes to violet along the a-axis, the green-blue color changes to blue-violet on the b-axis, and yellow-orange changes to violet along the c-axis. The most remarkable change occurs along the c-axis. These changes are attributed to the increased edge energy of vanadium after high temperature treatment, which leads to the disappearance of the blue absorption band at 460 nm and prompts a blue-violet dichroism color in tanzanite [2]. Therefore, as shown in Table 1, there were thirteen natural unheated (N1–N13) and nine heat-treated (A1, T1–T8) forms of tanzanite in our samples. These results were consistent with those obtained by Fourier Transform Infrared Spectroscopy (FTIR). The detailed FTIR results can be found in Ye’s [20] paper.
Figure 2 illustrates the magnified pictures of some tanzanite samples. The internal of the N3 sample is clean and obvious yellow-green, blue, and light violet trichroism can be seen under the gemological microscope (Figure 2a). There are a large number of fissures in the N4 sample and yellow glitter can sometimes be observed under the microscope (Figure 2b). This occurs as an iridescent effect, which is a series of crystalline optical phenomena caused by the splitting of crystal faces inside tanzanite. Blue glitters are also visible within the N3 sample due to its own blue-light yellow body color.
The tanzanite sample N5 has a complete plate-columnar morphology and a distinct grey-violet-blue color division. Numerous dotted black inclusions can also be observed after magnification (Figure 2c). The color distribution in the N7 sample is uneven, especially in the yellow to blue area, where the yellow color is concentrated at fissures (Figure 2d). In the N8 sample, massive, dark inclusions with metallic lusters and obvious crystal cleavage can be seen in the yellow and blue parts, respectively (Figure 2e). Striations are obvious on the crystal surface of the N12 sample. There are also some black internal inclusions and metallic luster minerals in the country rock (Figure 2f).
After comparing the samples under the microscope, it was obvious that it was difficult to identify the inclusions. Therefore, further Raman experiments are necessary to distinguish the natural and heat-treated tanzanites.

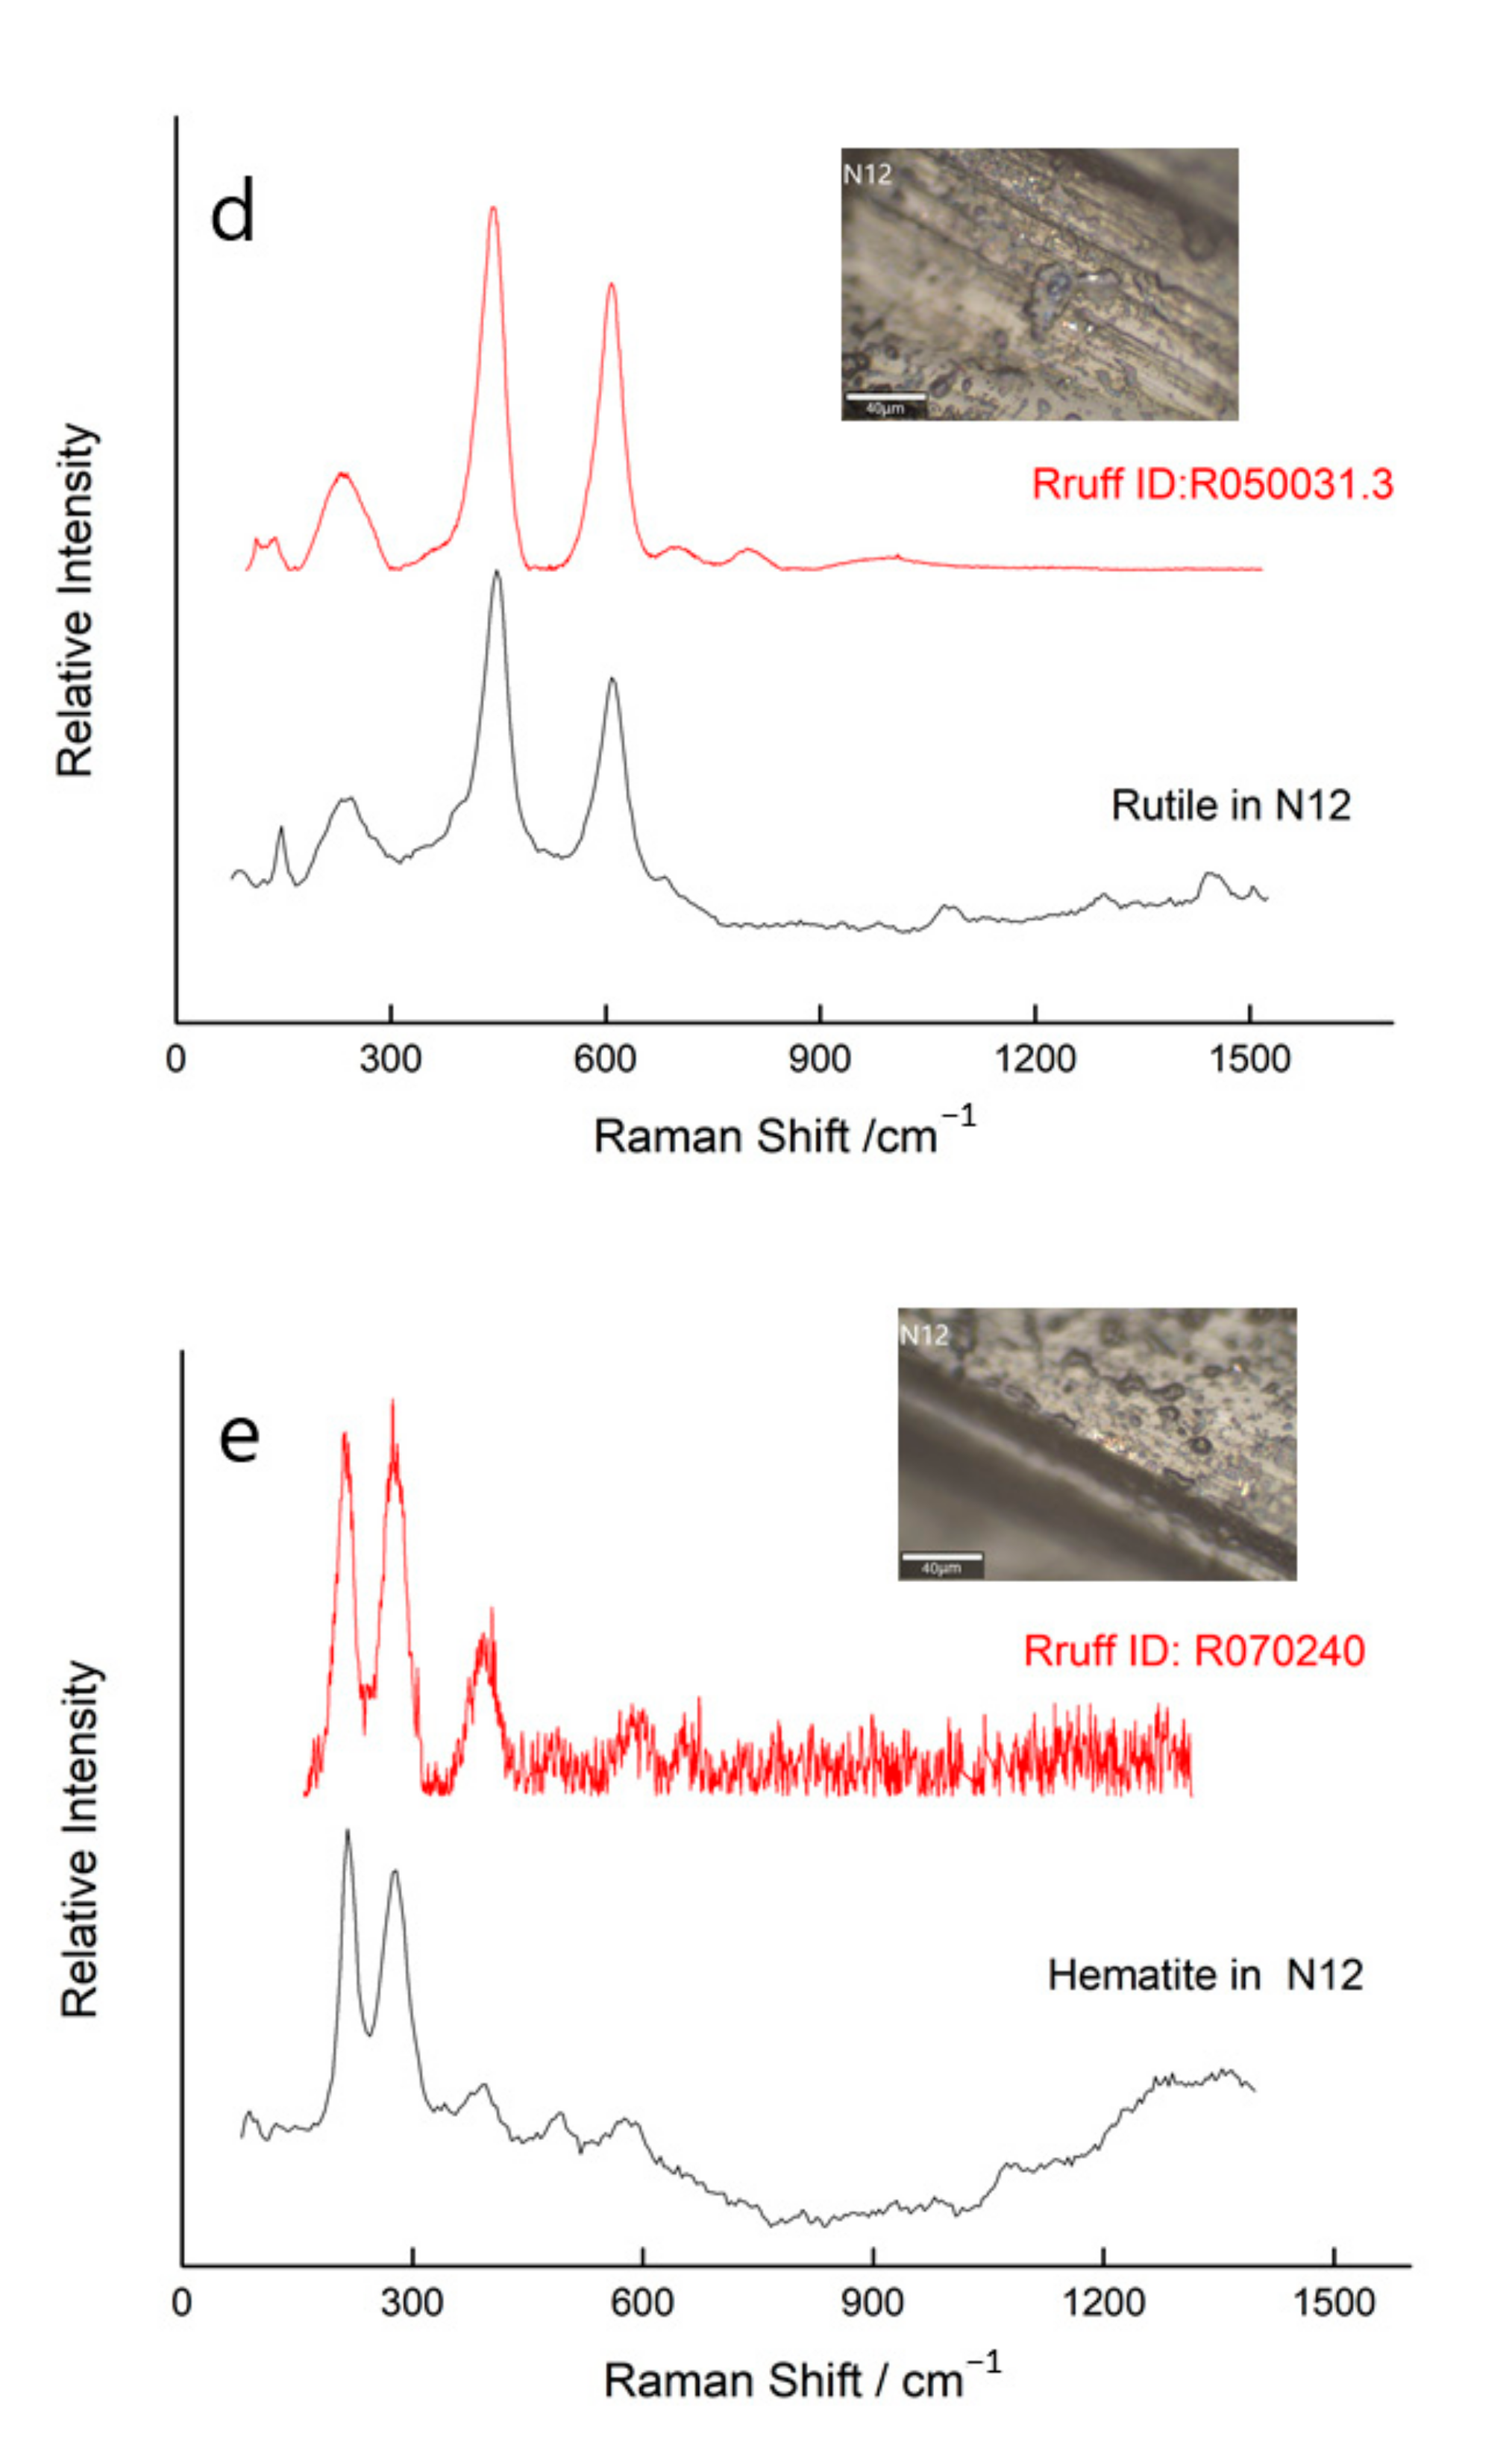
3.2. Raman Spectra Comparison of Inclusions between Natural and Heat-treated Tanzanite

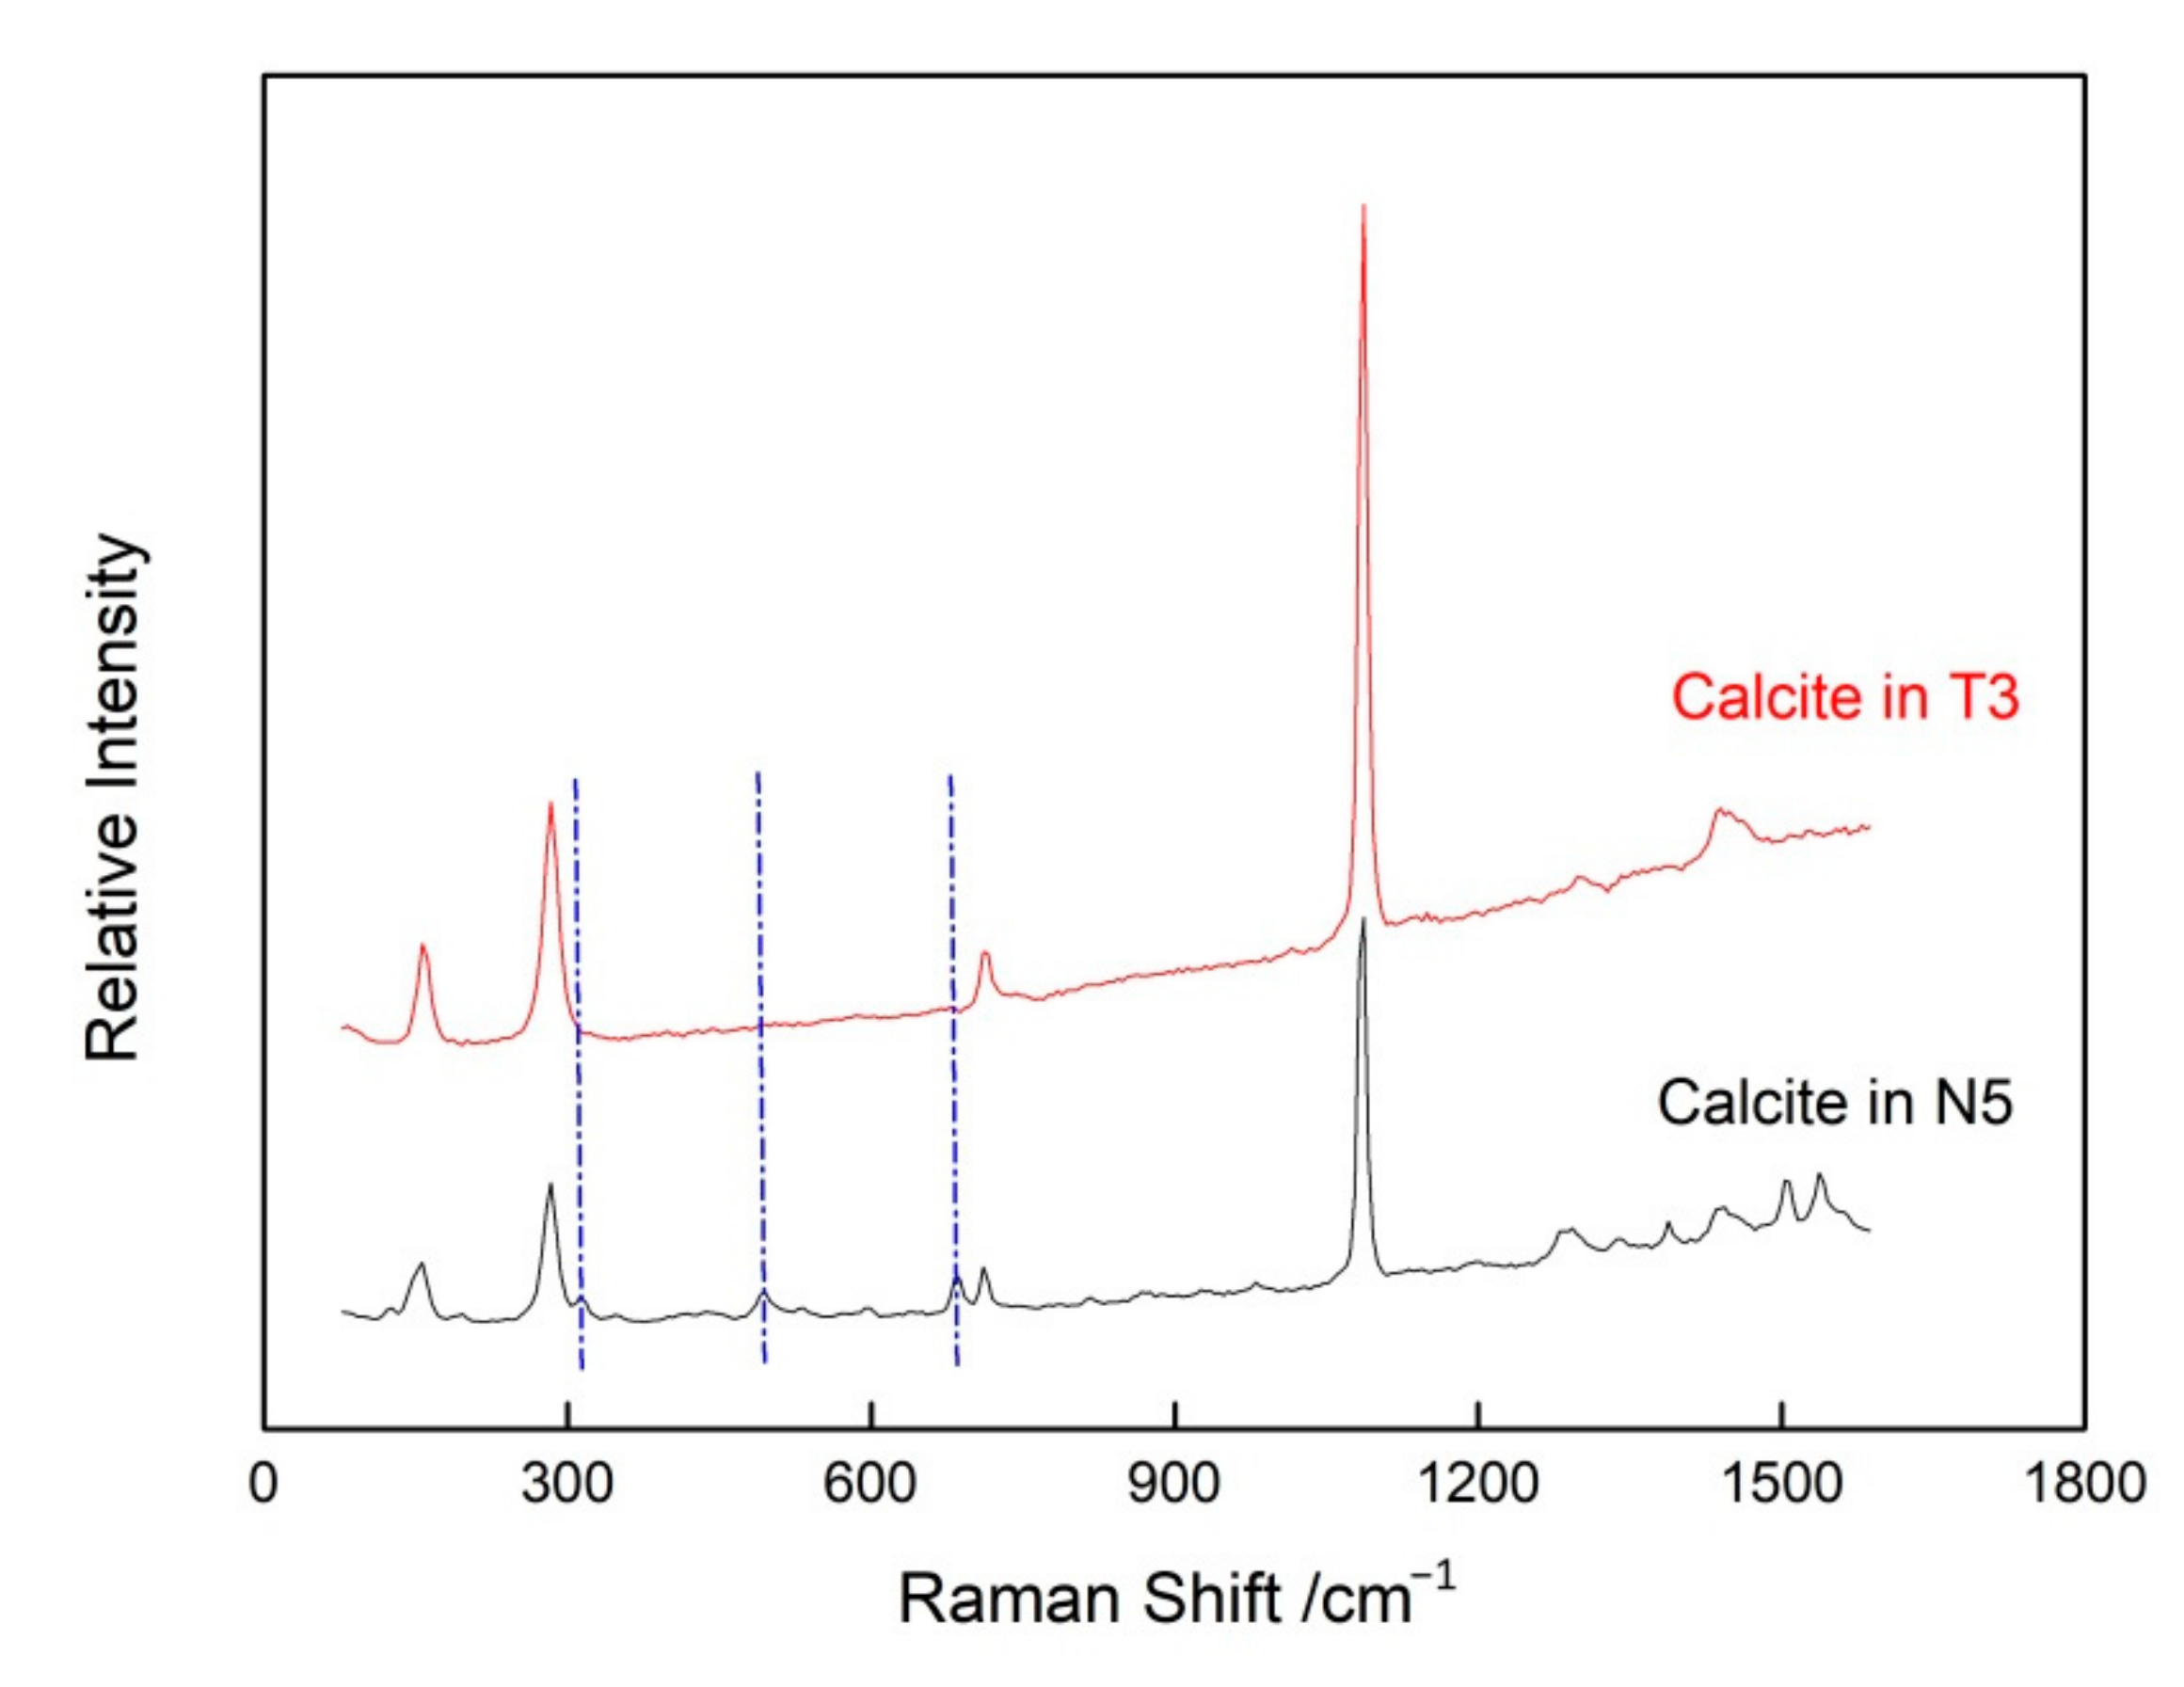
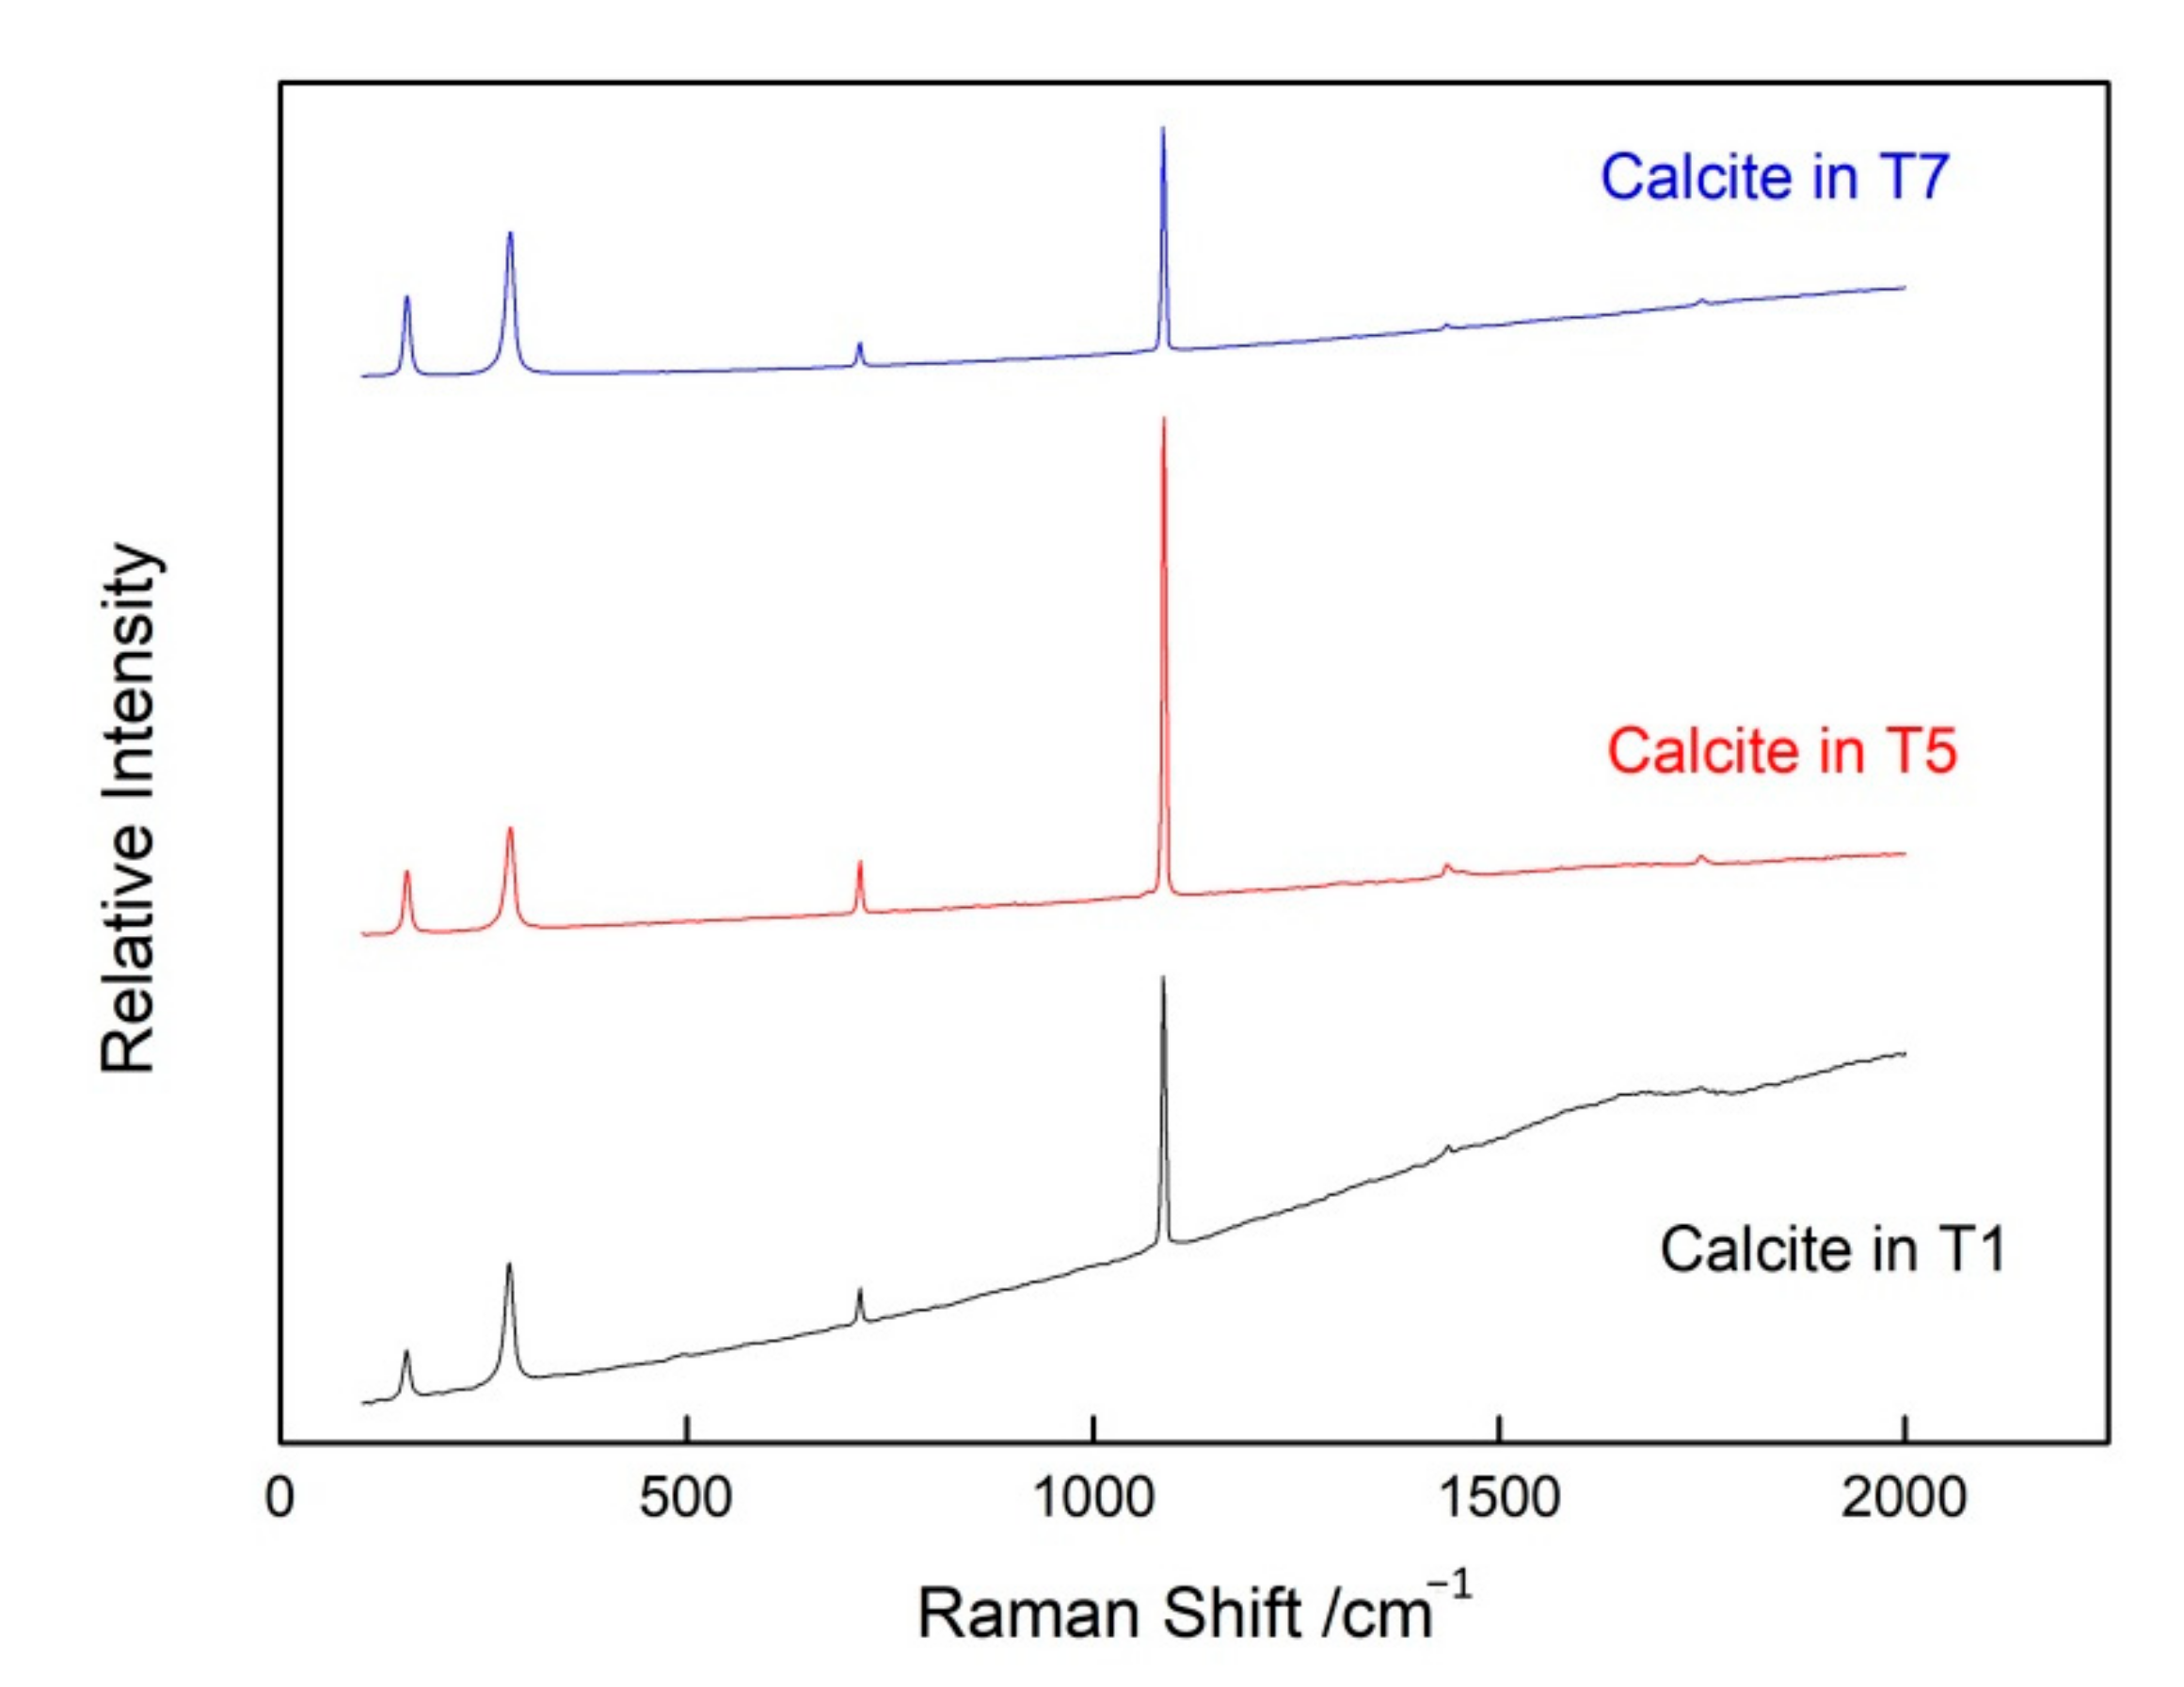
3.2.1. Calcite Inclusions

Calcite inclusions were detected in the N5 and T3 samples. Figure 3 and Figure 4 illustrate their locations, morphological sizes, and Raman spectra under confocal Raman microspectroscopy, respectively. The characteristic Raman shifts at 156 and 283 cm–1 of calcite are attributed to Ca cations; the 710 cm–1 shift corresponds to the in-plane bending vibrations of the [CO3]2– group; the strongest 1087 cm–1 peak indicates the C-O symmetric stretching vibration of the [CO3]2– group; and the 1444 cm–1 shift matches the anti-symmetric stretching vibration of the [CO3]2– group [21].
Raman shifts in the N5 sample of natural tanzanite are more numerous and sharper than those in the heat-treated T3 sample, whereas there is little difference between their relative intensities and peak positions (Figure 4). The Raman shifts around 312, 495, and 683 cm–1 of calcite in the natural N5 sample are missing in the heat-treated T3 sample. Liu and Fu’s [22,23] experiments revealed that the absorption peak near 1087 cm–1 becomes sharper, which is also observed in Figure 4. These phenomena are caused by the lengthening of the C-O bond and the reduced energy as the temperature increases. Another interesting phenomenon is the Raman peaks around 156 and 283 cm−1 of calcite in the heat-treated tanzanite, which are shifting toward low wavenumbers. The absorption at 710 cm−1, which is essentially due to the static in-plane bending vibration of the [CO3]2− group, has an obvious change in frequency. Gillet et al. proposed that site symmetry of the [CO3]2− group is decided by the cationic environment, which has less influence on the in-plane bending vibration than the other free groups’ vibrations (e.g., symmetric stretching, asymmetric stretching, and planar bending) [24].
In addition, calcite inclusions have also been detected in the other heat-treated samples of T1, T5, and T7 using micro-Raman spectroscopy (Figure 5). Fu and Zheng observed a similar Raman increase in the baseline and shift in the peaks towards lower frequencies with increased temperature [22]. These previous findings are in good agreement with the observations of the current study, which reveal these samples had undergone heat treatment.

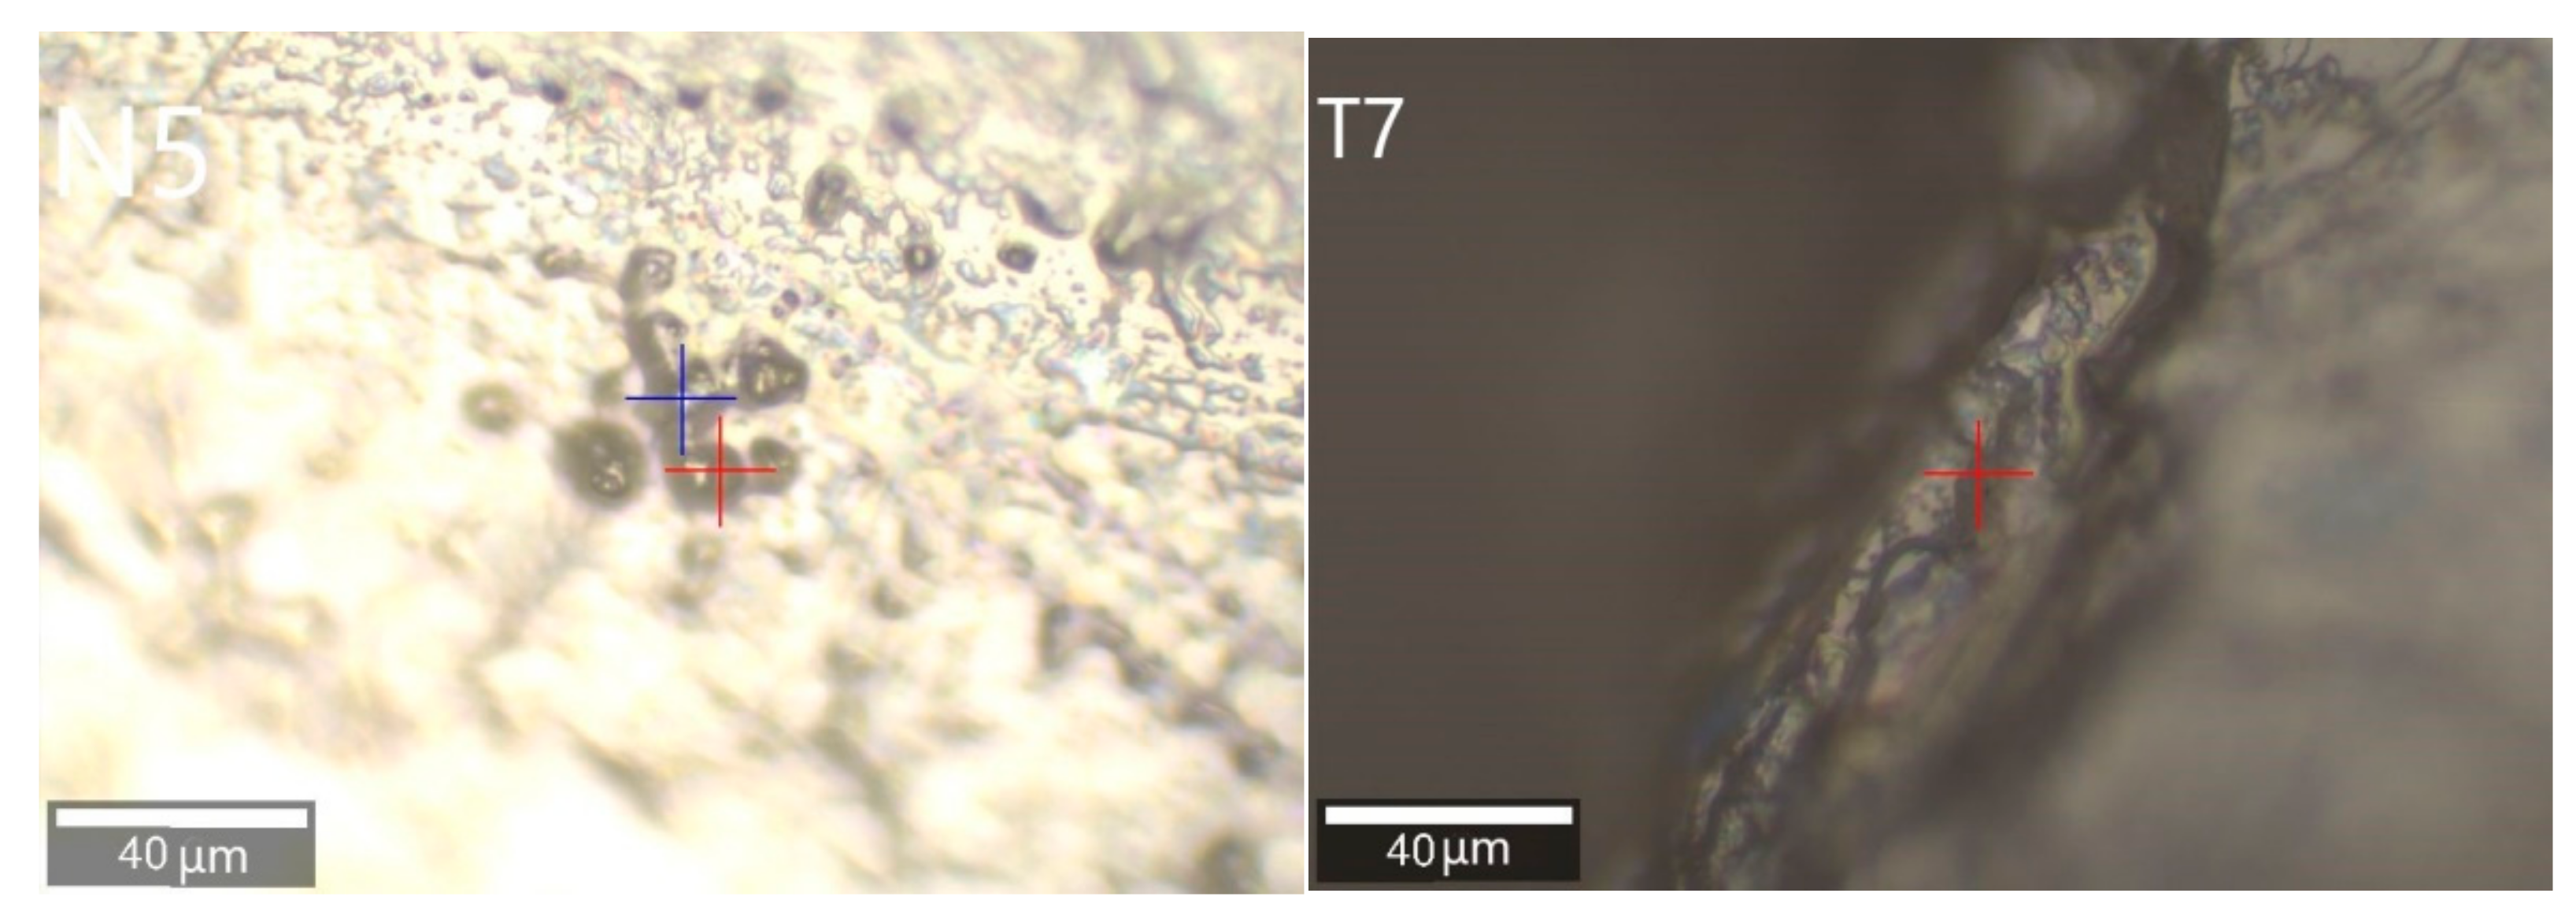
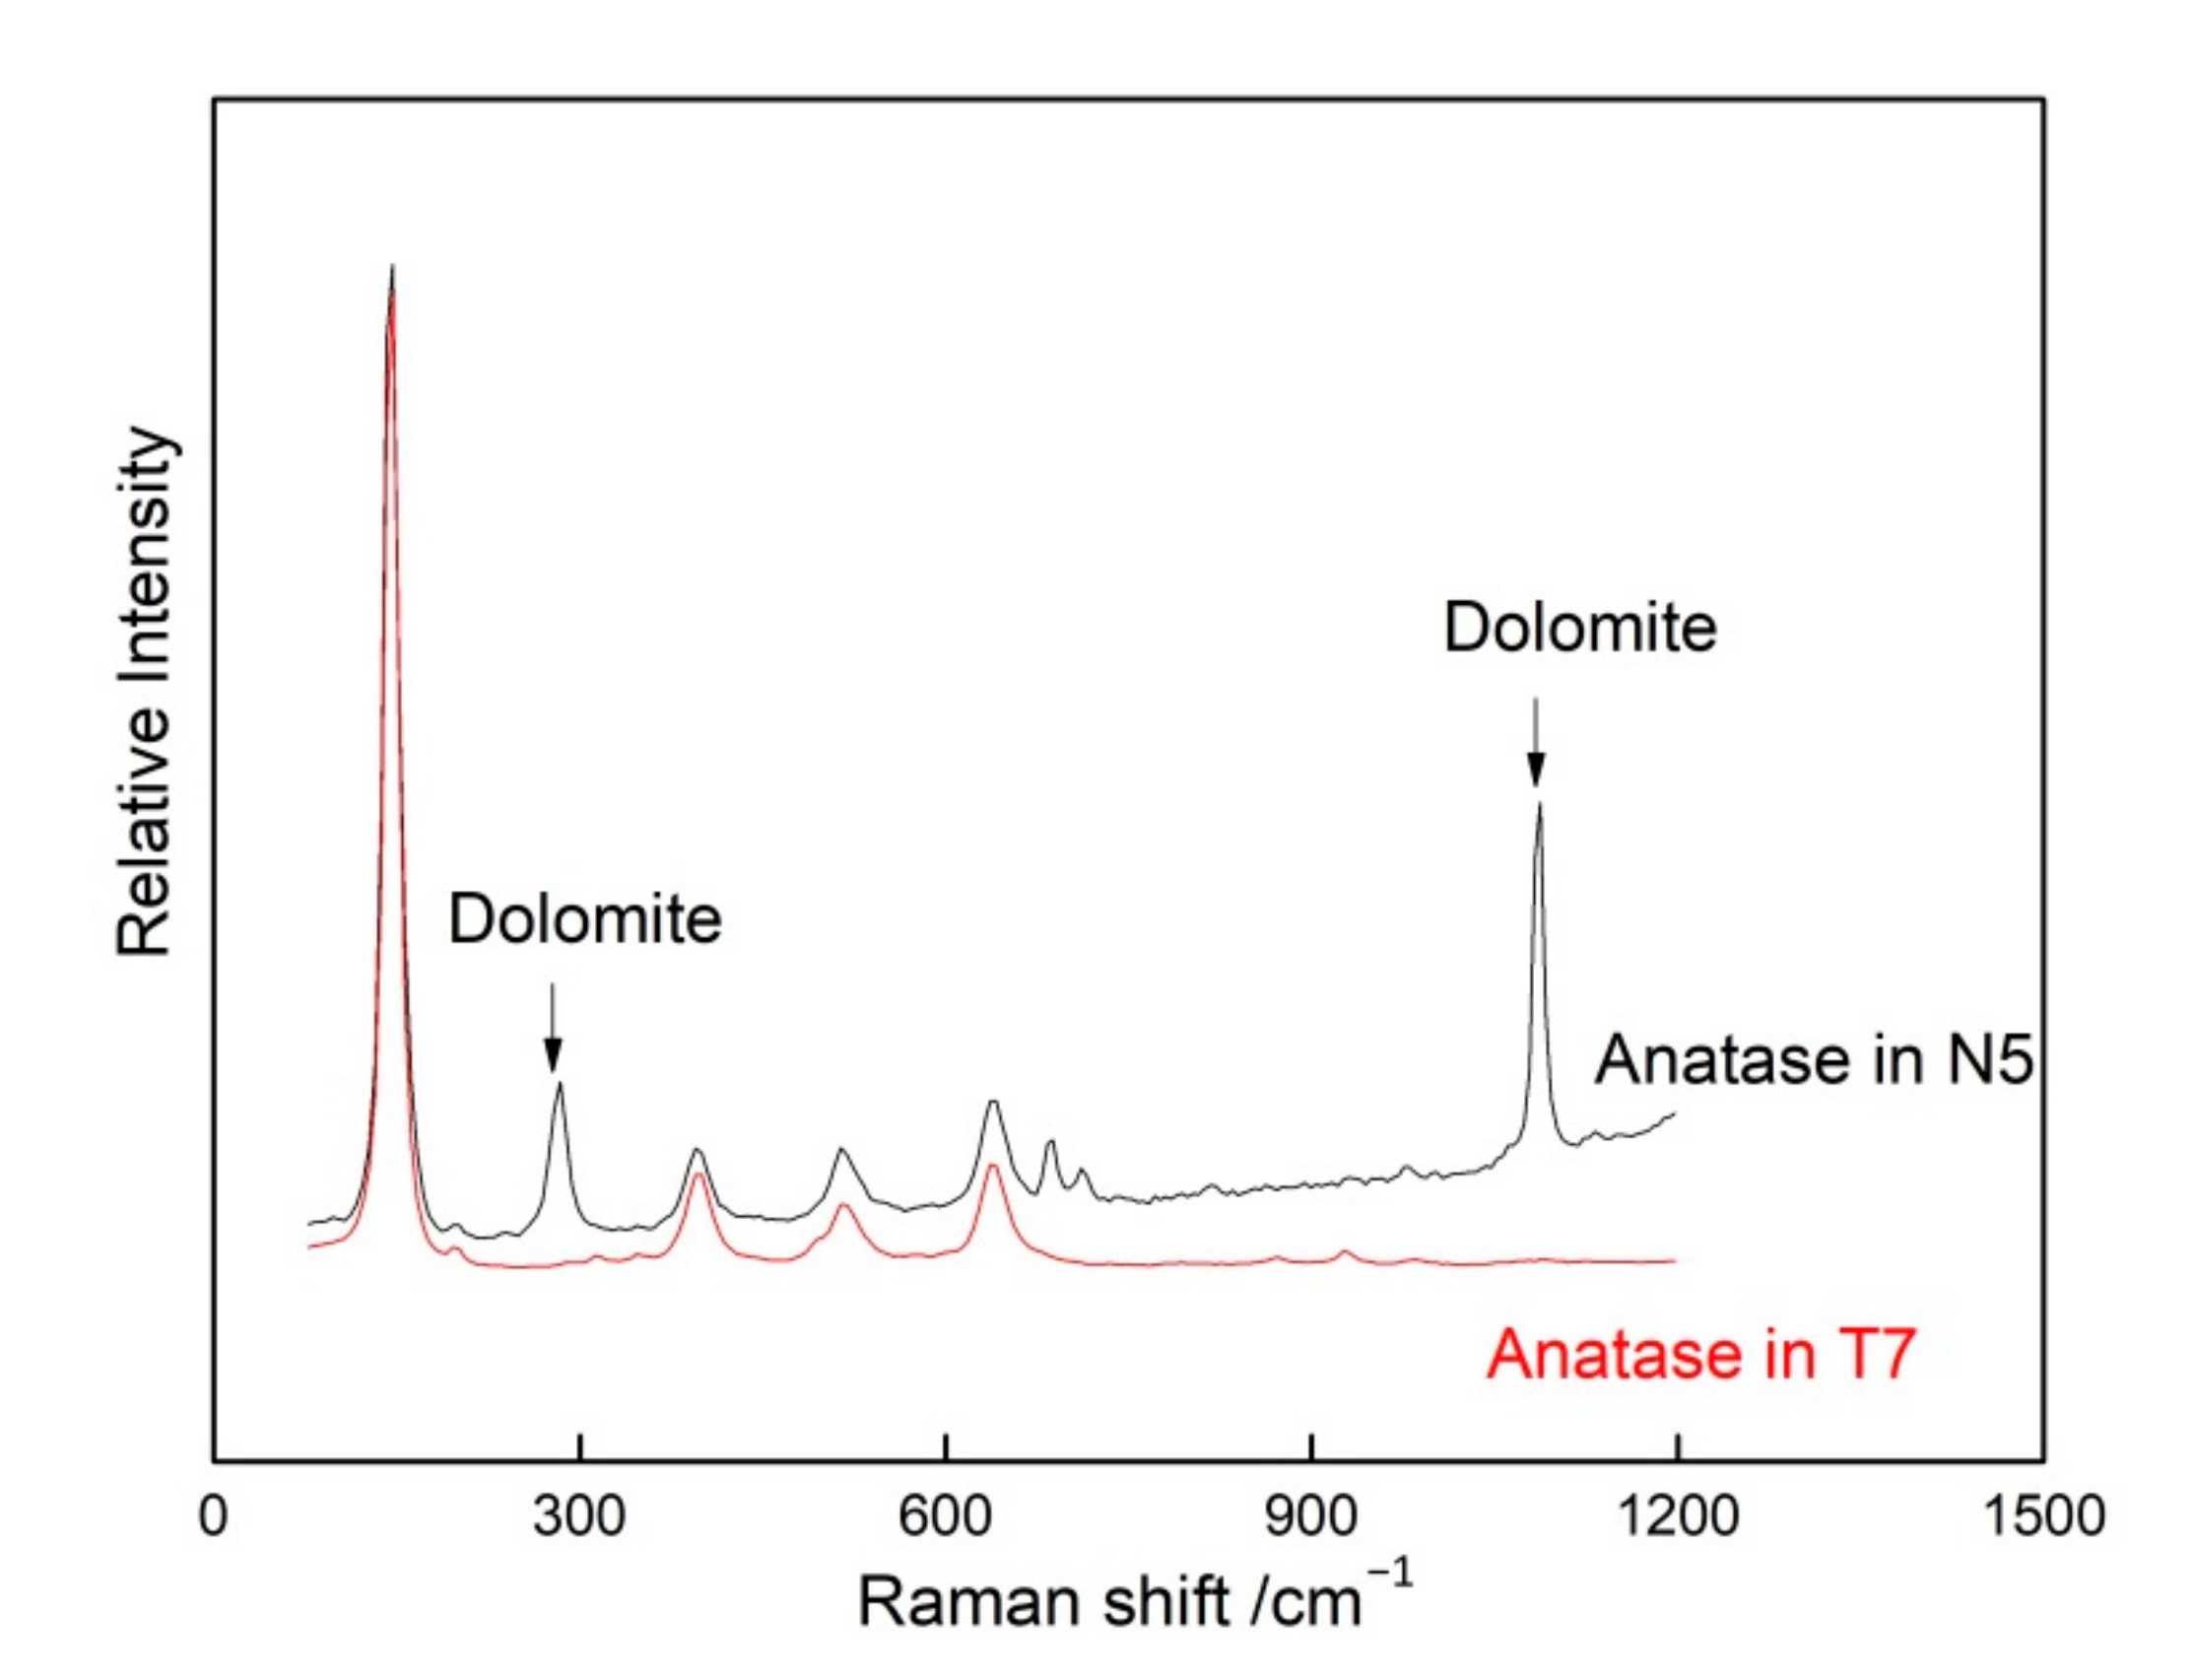
3.2.2. Anatase Inclusions

Ding et al. proposed that anatase is sensitive to temperature and can be used as a typomorphic mineral, which can indicate its formation temperature, generation relationship of minerals, and even the evolution history of F-bearing hydrothermal fluids [25]. Figure 6 and Figure 7 give the location and Raman spectra of anatase inclusions in the N5 and T7 tanzanite samples observed by an accurate confocal Raman microscope.
The Raman data for anatase inclusions of the N5 and T7 tanzanite samples were normalized and the Raman spectrum are shown in Figure 7. The anatase inclusions in the natural N5 sample has a strong Raman shift at 145 cm−1, three moderate Raman shifts around 396, 514, and 640 cm−1, and a weak Raman shift around 198 cm−1. Similarly, inclusion in the heat-treated T7 sample has a strong Raman shift at 146 cm−1, three moderate Raman shifts around 396, 514, and 636 cm−1, and a weak Raman shift around 200 cm−1 [26].
In addition, it was calculated that the ratios of half-width to width intensities of the absorption peaks of anatase inclusions in the natural N5 sample were 0.72%, 0.10%, 0.13%, and 0.15 % around the 146, 396, 514, and 640 cm−1 Raman shifts, respectively. By comparison, the ratios of anatase in the heat-treated sample T7 were 0.47%, 0.07%, 0.03%, and 0.04%, correspondingly. Therefore, characteristic Raman absorption peaks of anatase become weaker and gradually broaden after heat treatment. Previous researchers proposed that this is mainly due to the fact that the bond length of Ti-O bond becomes longer and the bond angle distribution becomes wider after heating at a high temperature [27]. As a result, the number of particles that can be excited to jump is reduced, resulting in a significantly weaker Raman signal [27].
Furthermore, Chang and Huang’s experiments revealed that Raman spectra of anatase show an obvious temperature effect [28]. Their studies discovered that the intensity and frequency of the 146 cm−1 anatase absorption were strongly influenced by temperature and shifted towards high frequencies upon heating. When heated in the range from room temperature to 100 °C, the intensity of the 146 cm−1 peak decreased slowly. When the temperature was above 200 °C, its intensity rapidly decreased. At around 550 °C, its intensity dropped to approximately one-third of the initial level [28]. Therefore, with increasing temperature, the absorption peak at 146 cm−1 eventually becomes a broad small bump [28]. In Figure 8, the intensity of the 146 cm−1 Raman shift of anatase for heat-treated T7 sample shows little variation, so it is inferred that the heating temperature of T7 did not exceed 100 ℃. In addition, the Raman shift at 640 cm−1 moves towards lower frequencies at high temperature and constant pressure, which is mainly attributed to a pure volume contribution due to thermal expansion [29].
There are two Raman shifts at 282 and 1087 cm−1 in the natural N5 sample (Figure 7), which do not belong to anatase inclusions. The N5 sample contains dolomite inclusions, so the absorption peaks can be attributed to dolomite. Consequently, smaller inclusions of dolomite are also present in the vicinity of the anatase.

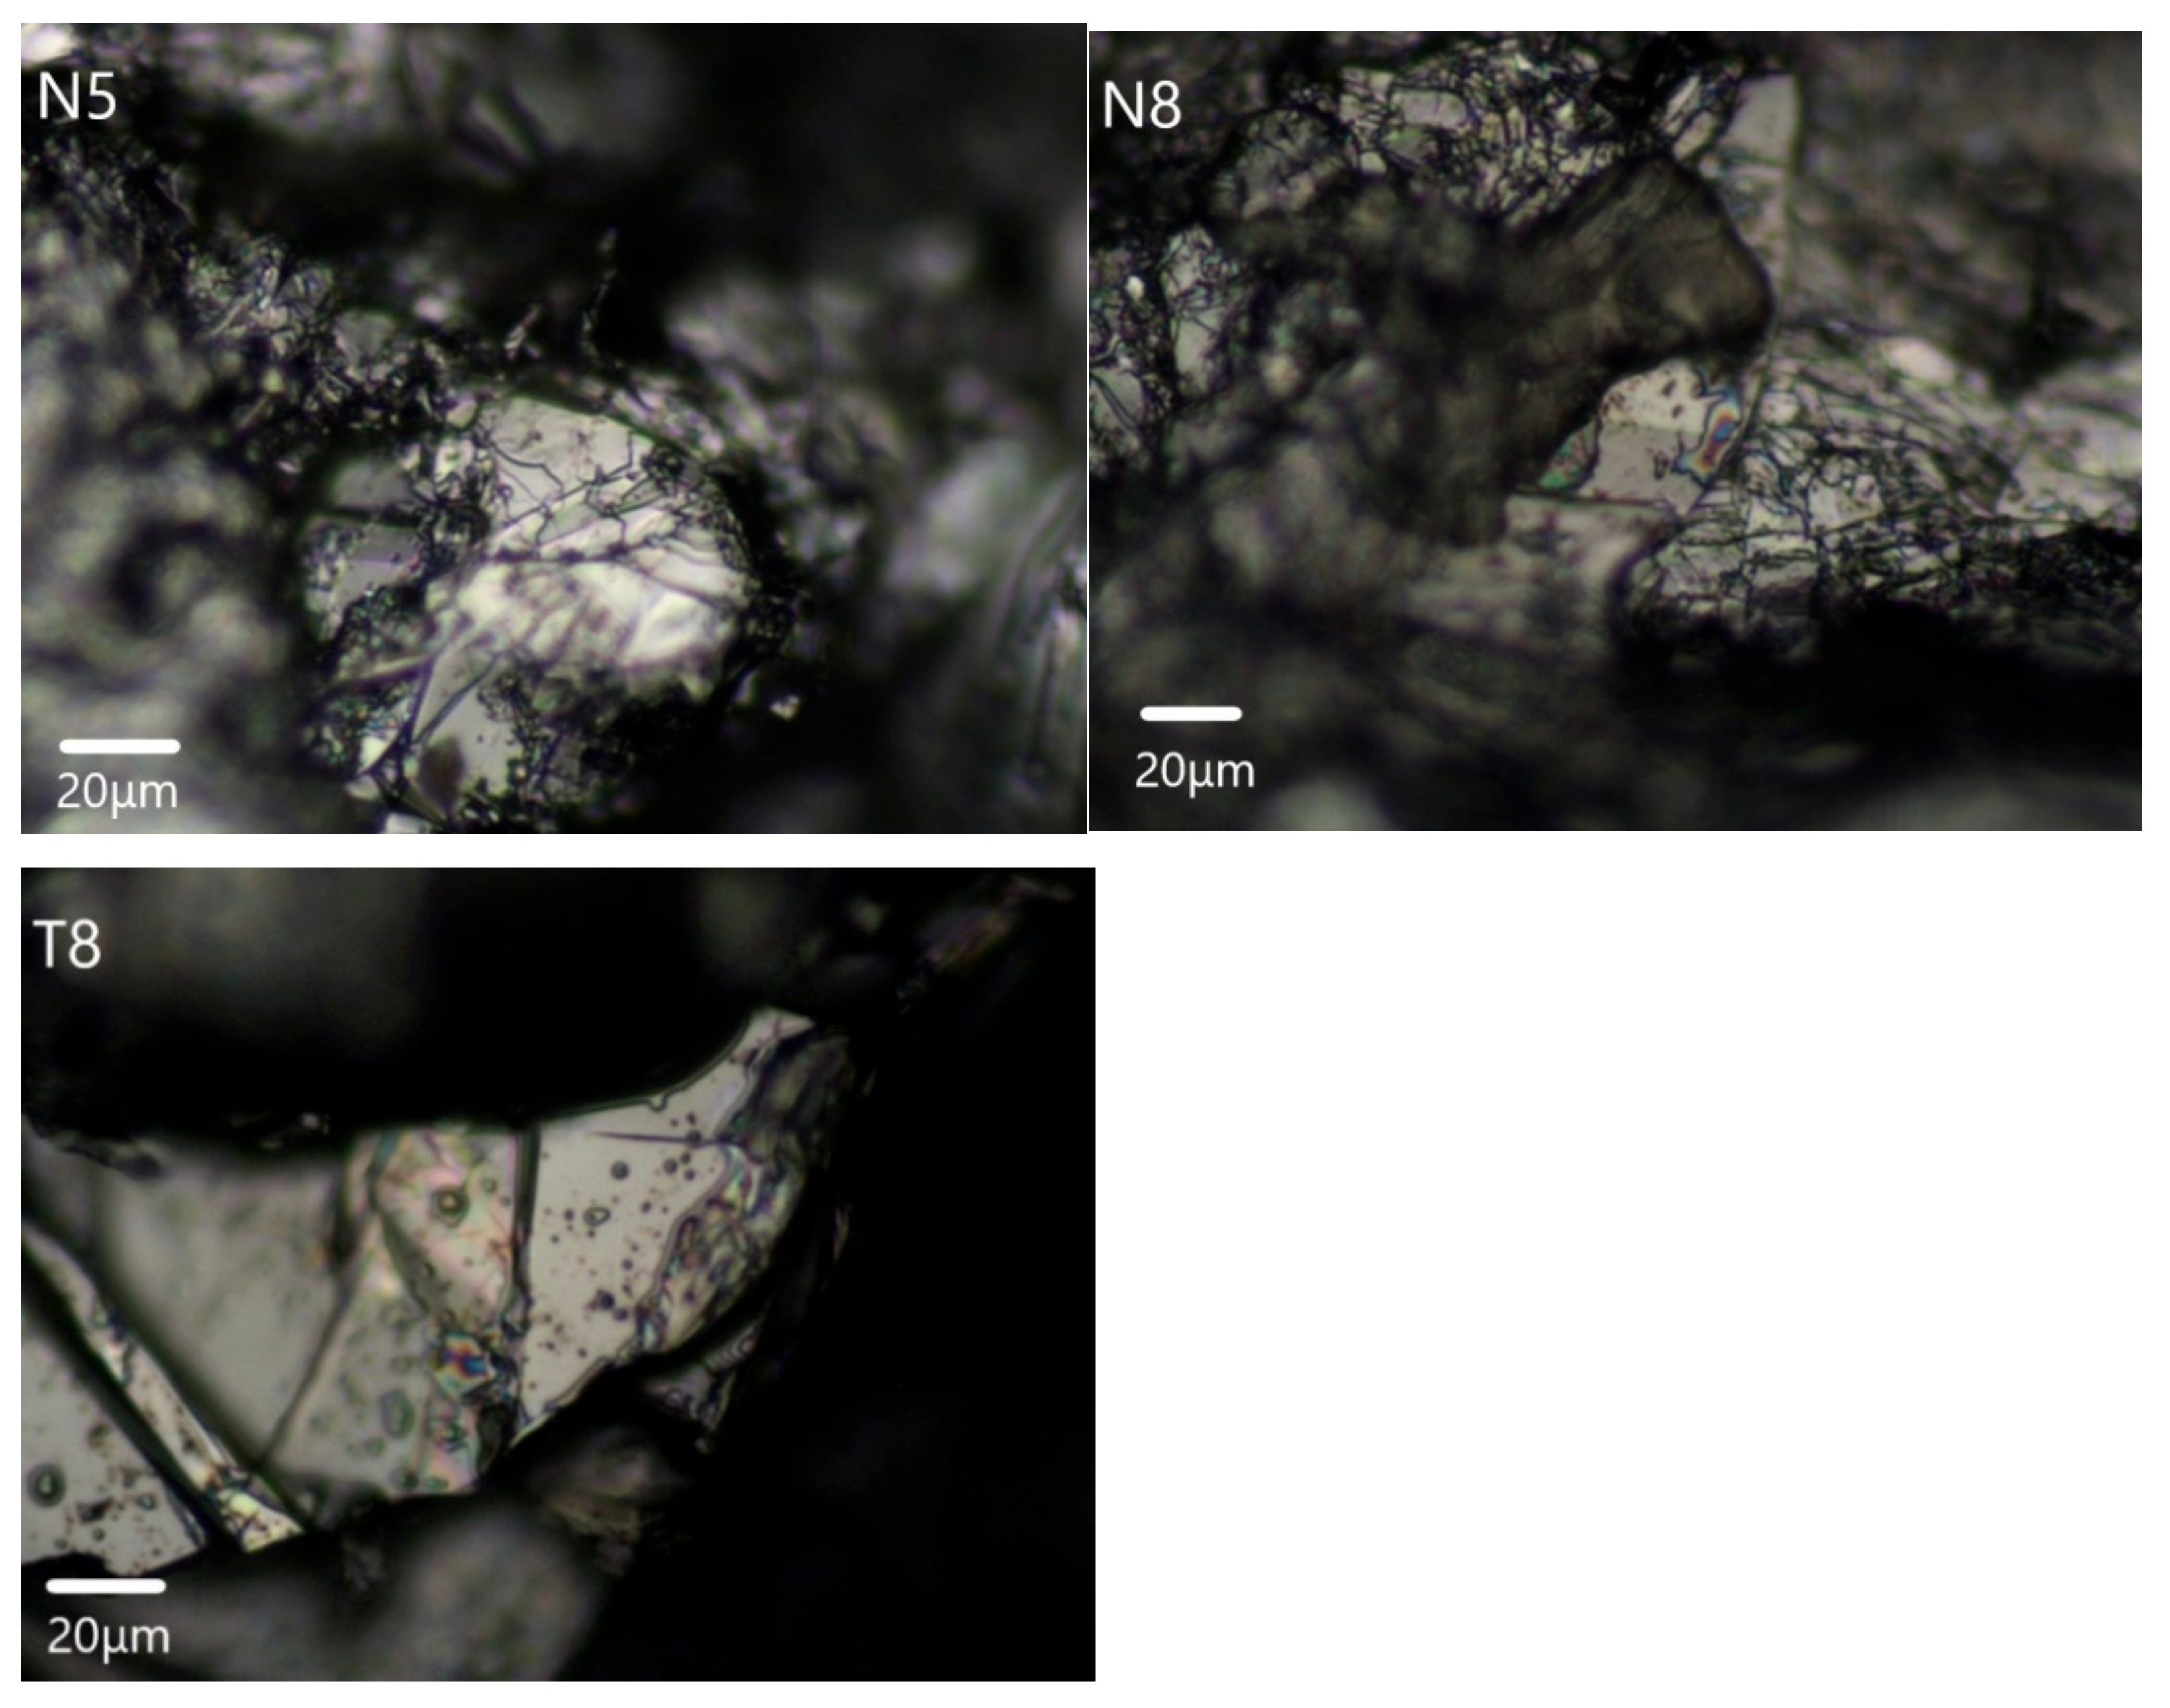
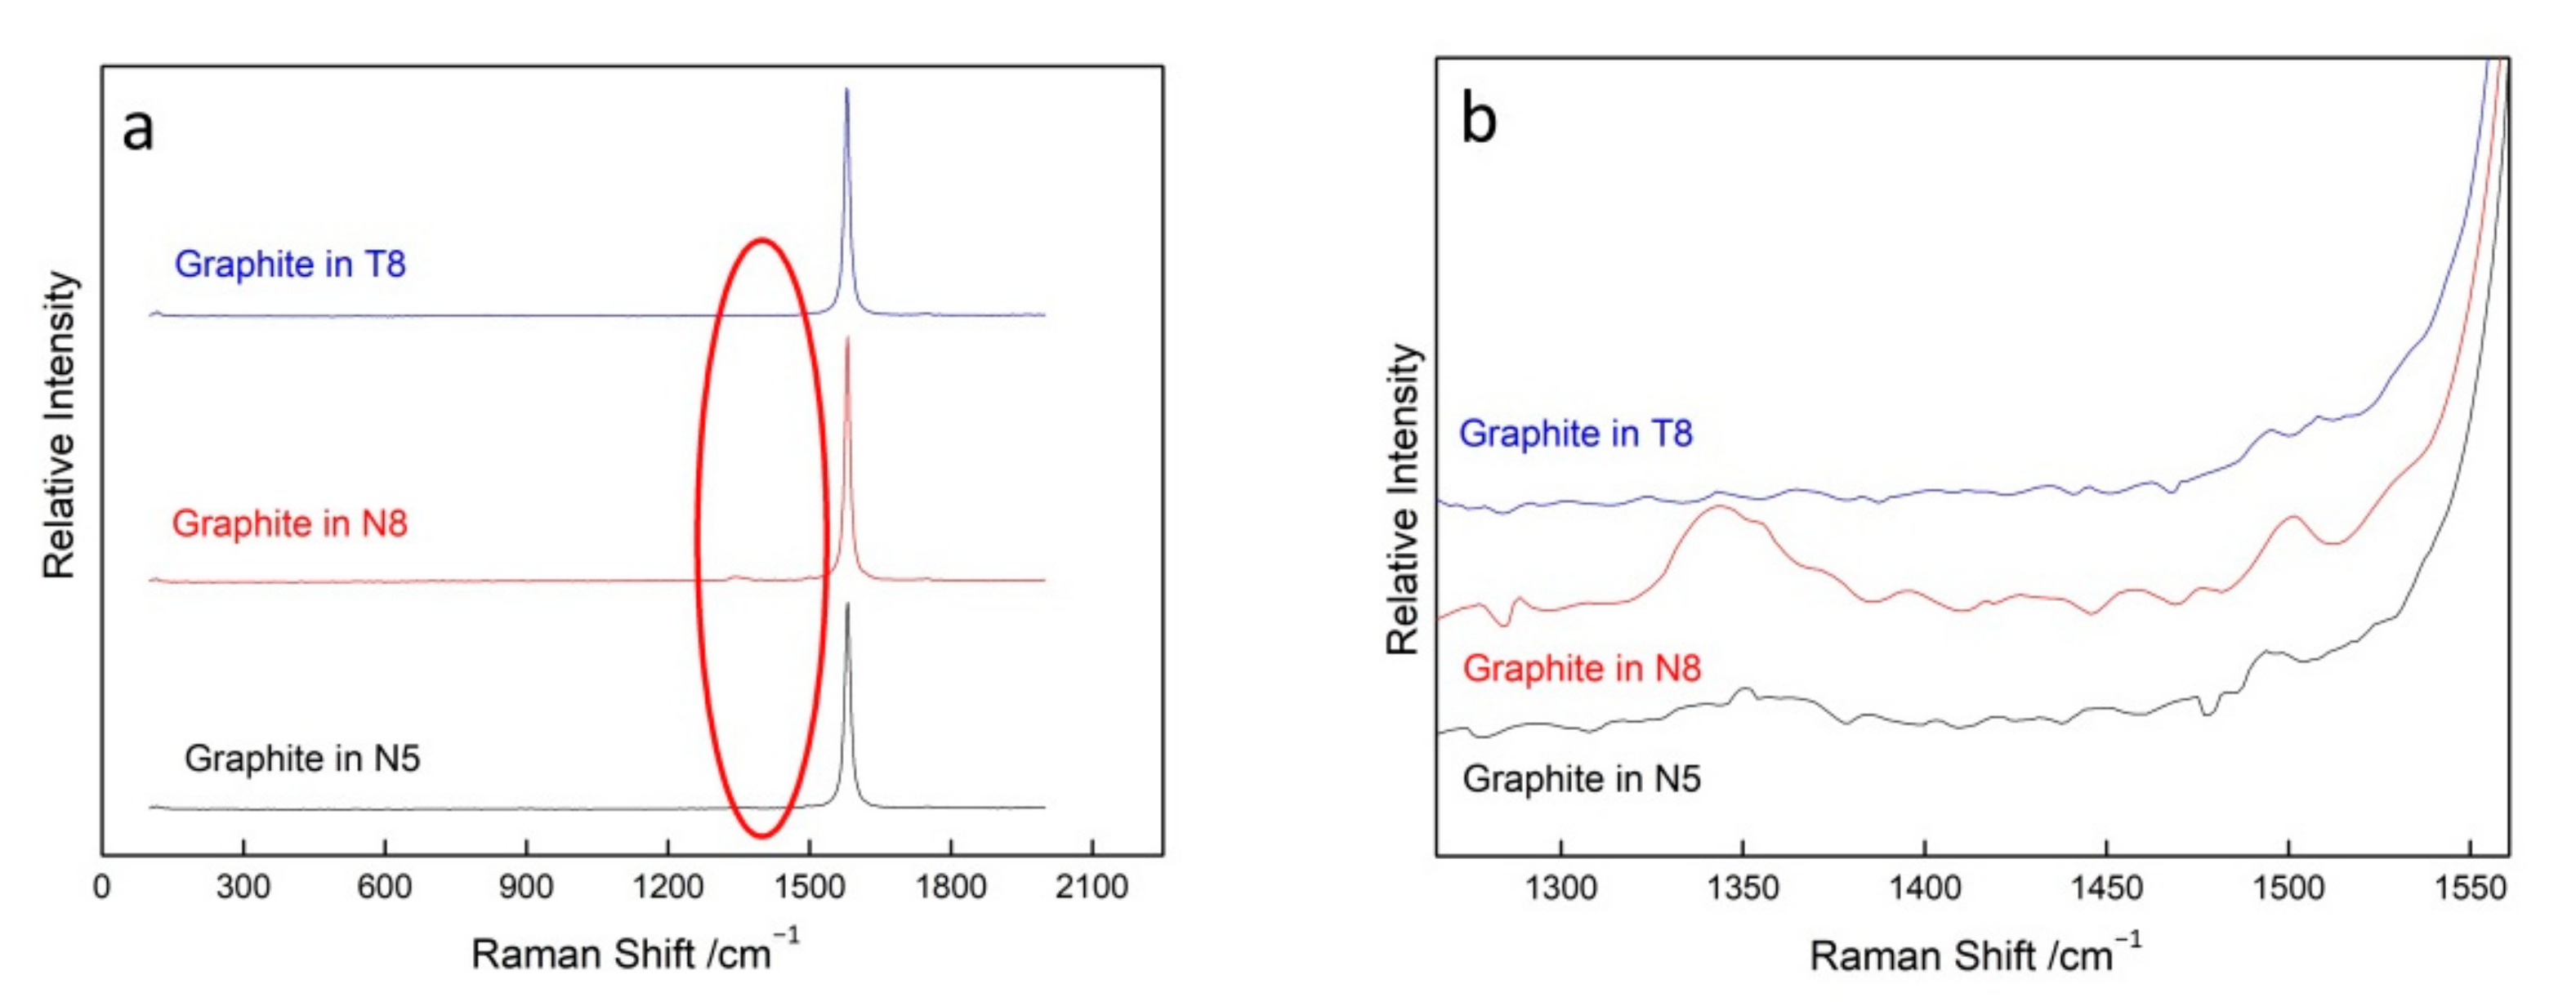
3.2.3. Graphite Inclusions

Graphite inclusions were found in the N2, N5, N8, N10, and T8 tanzanite samples using micro-Raman spectroscopy. Figure 8 illustrates three representative graphite inclusions in the N5, N8, and T8 samples. The black graphite inclusions are scattered and dotted in the visual field, with small graphite crystals attached around certain morphologically large graphite forms. Dunn [30] noticed a correlation between the direction of extension of the graphite inclusions and the morphology of tanzanite, in which the (0001) crystal plane of the graphite inclusions is parallel to the (010) plane of tanzanite.
The graphite inclusions between natural and heat-treated tanzanite have little difference in their Raman spectra (Figure 9a). Raman shifts in the N5, N8, and T8 samples all have a strong peak around 1580 cm−1, which is the characteristic absorption peak for highly symmetrical and ordered single crystal graphite [31]. The most obvious distinction of graphite between the heat-treated T8 sample and two natural samples (N5 and N8) is the lack of a weak Raman shift around 1350 cm−1 and the weakness of the Raman shift near 1500 cm−1 (Figure 9b). The Raman shift at 1350 cm−1 is a vibrational absorption peak induced by disorder in polycrystalline graphite [32]. Tuinstra and Koenig [33] believed this Raman line appears from resonances caused by defects, and its frequency may be related to the size and shape of the graphite.
In addition, the ID/IG ratio of graphite for the heat-treated T8 sample was reduced due to the absence of the D mode (1350 cm−1). The integral intensity ID/IG indicates the order and completeness of the graphite [31], where the G mode represents the Raman shift of the graphite at 1580 cm−1 and the D mode is the Raman shift at 1350 cm−1. The G mode indicates the order and symmetry of graphite and the D mode represents the order and structural incompleteness of graphite. Therefore, the decrease in ID/IG indicates that graphite in T8 tanzanite has good order and integrity [31,32].

3.2.4. Zoisite Inclusions

It is noted that iridescent inclusions, which are in patchy distributions, can be found in the N4, N12, and T2 samples (Figure 10). Iridescent colors can be seen at certain angles under a fiber-optic light, which is due to the optical alignment of crystals created by the tiny inclusions on the cleavage planes within tanzanite [34]. It has been analyzed that this phenomenon is mainly related to the matrix of tanzanite and unheated to the presence or absence of mineral inclusions within it. Therefore, Raman spectra of the yellow matrix in N4, the matrix in N12, and the white matrix in T2 country rock all showed that the main components were zoisite inclusions.
To determine that zoisite inclusions in the iridescent effect were not tanzanite itself, a Raman spectroscopic test was carried out on a thin section of heat-treated T2 tanzanite sample. As shown in Figure 11, although the T2 tanzanite sample’s thin section has characteristic Raman shifts at 496, 872, and 991 cm−1 of zoisite, its spectrum is clearly distinguished from the zoisite in iridescent inclusions in the N4, N12, and T2 tanzanite samples.
Raman spectra of zoisite in natural and heat-treated samples are generally consistent in the 50 to 1100 cm−1 range (Figure 11). Raman shifts at 334 cm−1 of N8, N12, and T2 samples are attributed to the rotational vibration of [SiO4] tetrahedra or the advective vibration of the metal M-O bond. Raman shifts of 493, 575, and 678 cm−1 are assigned to the bending vibration of the Si-O bond. Raman shifts of 872, 927, 984, and 1071 cm−1 attach to the stretching vibration of the Si-O bond [35].

3.3. Other Characteristics Inclusions in Natural Unheated Tanzanite

By comparing Raman spectra of inclusions with the RRUFF database, several other inclusions were found, including dolomite, molybdenite, prehnite, hematite and rutile.
Dolomite inclusions, which are often interspersed with calcite in tanzanite, were found in the natural N5 sample. Dolomite and calcite have similar structures and both belong to the calcite group. Therefore, their Raman spectra are similar, with Raman shifts around 156, 278, 683, 1087, and 1444 cm−1 (Figure 12a). Raman shifts at 156 and 278 cm−1 are caused by lattice vibrations of cations, and 1087 cm−1 is due to an in-plane bending vibration of the C-O bond [21].
Opaque molybdenite inclusion was observed in the natural N8 sample. Under a microscope, molybdenite has a lead-grey color with a strong metallic luster. There are five obvious Raman shifts in molybdenite around 280, 380, 404, 452, and 589 cm−1 (Figure 12b). The Raman shift near 280 cm−1 is very weak. The Raman shift at 380 cm−1 is attributed to the in-plane stretching vibration of the Mo-S bond, and the 404 cm−1 shift is the out-of-plane stretching vibration of the S atom [36].
Prehnite in different forms and sizes was found in the country rocks of the natural N12 sample. Prehnite is randomly dispersed as white dots with a granular morphology. When the lens is turned, prehnite inclusions can be observed to have raised granular shadows, with color and luminosity varying in different directions. Compared to prehnite in natural tanzanite, these inclusions in the country rocks are larger and more obvious, not only in terms of grain size, but also in terms of distribution. Raman shifts of prehnite are around 220, 242, 287, 319, 388, 522, 538, 609, 687, 781, 936, 990, and 1081 cm−1 (Figure 12c). The absorption peaks in the 900–1100 cm−1 range are caused by stretching vibrations of the Si-O bond of prehnite, the 400–800 cm−1 band are bending vibrations of the Si-O bond, and 319 and 388 cm−1 are due to [OH] vibrations [37].
Moreover, some yellow hematite and rutile inclusions are noted in the N12 sample. Rutile is in a rounded form on the surface of the tanzanite, and hematite has a metallic leaching vein phenomenon with a metallic luster. Rutile has characteristic Raman shifts near 146, 244, 447, and 608 cm−1 (Figure 12d) [38], and hematite has Raman shifts around 217, 278, 394, 490, and 575 cm−1 (Figure 12e) [15].

4. Conclusions

The differences between natural and heat-treated tanzanite were studied in terms of their inclusions by magnification and Raman spectroscopy. Fewer variations in their color, morphology, and sizes were found in the comparisons and observations under a magnification microscope. However, Raman spectra of some inclusions (calcite, graphite, and anatase) were different and informative for distinguishing between natural and heat treated samples.
After comparing the Raman spectra of calcite in different samples, it can be inferred that the missing Raman shifts at 312, 495, and 683 cm−1, and the sharper 1087 cm−1 peak of calcite in the heat-treated T3 sample, are caused by the lengthening of the C-O bond and the reduced energy as the temperature increased. The increase in the Raman baseline and the shift toward low wavenumbers are observed in calcite of the T3 sample, which can also imply the samples have been treated at a high temperature. Because anatase has a visible temperature effect, the variation of the 146 cm−1 Raman shift, which becomes weaker and wider, and moves toward high frequencies, is used as possible evidence of heat treatment. The 1350 cm−1 Raman shift of graphite in the heat-treated T8 sample was not seen, which indicates its order degree was improved after heat treatment.
Other inclusions were seen in the N5, N8, and N12 natural tanzanite samples. Dolomite was often interspersed with calcite. Molybdenite was lead grey with a strong metallic luster. Prehnite was abundant and randomly dispersed in white dots. Rutile was orange-yellow and hematite had a metallic luster with a halo color. In this paper, the Raman spectra of these inclusions are also discussed.

Author Contributions

Conceptualization, Y.L.; writing—original draft preparation, S.Y. and H.Y.; writing—review and editing, S.Y., H.Y. and Y.L.; data curation, H.Y.; formal analysis, S.Y. and Y.L.; methodology, Y.L. All authors have read and agreed to the published version of the manuscript.

Funding

This research was supported by the Fundamental Research Funds for the Central Universities (grant number 35832017033) to Y.L.

Acknowledgments

We are grateful to Gao for her support and technical guidance of the experiments from the Laboratory of Institute of Geology and Geophysics, Chinese Academy of Sciences. Thanks to reviewers and editors for their comprehensive and professional suggestions.

Conflicts of Interest

The authors declare no conflict of interest.

References

  1. Cairncross, B. The Where of Mineral Names: Tanzanite, A variety of Zoisite, Merelani Hills, Simanjiro District, Manyara Region, Tanzania. Rocks Miner. 2020, 95, 458–462. [Google Scholar] [CrossRef]
  2. Pluthametwisute, T.; Wanthanachaisaeng, B.; Saiyasombat, C.; Sutthirat, C. Cause of color modification in Tanzanite after heat treatment. Molecules 2020, 25, 4743. [Google Scholar] [CrossRef] [PubMed]
  3. He, X.M. Young magnificent blue “Heart of the Ocean”—Tanzanite. Sci. Cult. Pop. Land Resour. 2018, 02, 38–41. (In Chinese) [Google Scholar]
  4. Giuliani, G.; Feneyrol, J.; Ohnenstetter, D.; Marshall, D.; Walton, L.; Martelat, J.-E.; Fallick, A.E. Tsavorite and tanzanite deposits. Mineralogical association of canada short course series. In Geology of Gem Deposits, 2nd ed.; Groat, L.A., Ed.; The Mineralogical Association of Canada: Quebec, QC, Canada, 2014; pp. 217–246. [Google Scholar]
  5. Ccato, A.; Bersani, D.; Caggiani, M.C.; Mazzoleni, P.; Barone, G. Raman studies on zoisite and tanzanite for gemmological applications. J. Raman Spectrosc. 2021, 06, 1–13. [Google Scholar] [CrossRef]
  6. Olivier, B. The Geology and Petrology of the Merelani-Tanzanite Deposit, Northeast Tanzania. Ph.D. Thesis, University of Stellenbosch, Stellenbosch, South Africa, 2006. [Google Scholar]
  7. Switzer, G.S. Composition of green garnet from Tanzania and Kenya. Gems Gemol. 1974, 14, 296–297. [Google Scholar]
  8. Wilson, W.E.; Sau, J.M.; Pardieu, V.; Hughes, R.W. The Merelani Tanzanite mines, Lelatema mountains, Arusha Region, Tanzania. Mineral. Rec. 2009, 40, 347–408. [Google Scholar]
  9. Naeser, C.W.; Saul, J.M. Fission track dating of tanzanite. Am. Mineral. 1974, 59, 613–614. [Google Scholar]
  10. Feneyrol, J.; Giuliani, G.; Demaiffe, D.; Ohnenstetter, D.; Fallick, A.E.; Dubessy, J.; Martelat, J.E.; Rakotondrazafy, A.F.M.; Omito, E.; IchanG’I, D.; et al. Age and origin of the Tsavorite and Tanzanite mineralizing fluids in the Neoproterozoic Mozambique Metamorphic Belt. Can. Mineral. 2017, 55, 763–786. [Google Scholar] [CrossRef]
  11. Jaszczak, J.A.; Trinchillo, D. Miracle at Merelani: A remarkable occurrence of graphite, diopside, and associated minerals from the Karo mine, Block D, Merelani Hills, Arusha region, Tanzania. Rocks Miner. 2013, 88, 154–165. [Google Scholar] [CrossRef]
  12. Thongnopkun, P.; Chanwanitsakun, P. Effect of heat treatment on spectroscopic properties of Tanzanite. J. Phys. Conf. Ser. 2018, 1144, 012183. [Google Scholar] [CrossRef]
  13. Malisa, E.; Kinnunen, K.; Koljonen, T. Notes on fluid inclusions in vanadiferous Zoisite (Tanzanite) of the Merelani area, Tanzania. Bull. Geol. Soc. Finl. 1986, 58, 53–58. [Google Scholar] [CrossRef]
  14. Gubelin, E.J.; Weibel, M. Green vanadium grossular garnet from Lualenyi, near Voi, Kenya. Lapidary J. 1975, 29, 402–426. [Google Scholar]
  15. Giarola, M.; Mariotto, G.; Ajò, D. Micro-Raman investigations on inclusions of unusual habit in a commercial Tanzanite gemstone. J. Raman Spectrosc. 2012, 43, 556–558. [Google Scholar] [CrossRef]
  16. Castillo, A.; Smith, T. Merelaniite inclusions in tanzanite. Gems Gemol. 2018, 52, 226–227. [Google Scholar]
  17. Jaszczak, J.A.; Rumsey, M.S.; Bindi, R.L.; Hackney, S.A.; Wise, M.A.; Stanley, C.J.; Spratt, J. Merelaniite, Mo4Pb4VSbS15, a new molybdenum-essential member of the Cylindrite Group, from the Merelani tanzanite Deposit, Lelatema Mountains, Manyara region, tanzania. Minerals 2016, 6, 115. [Google Scholar] [CrossRef] [Green Version]
  18. Yu, J.D.; Lu, R. Color shift and pleochroism in tanzanite. Gemol. Technol.-China Int. Gems Jewel. Acad. Conf. 2015, 4, 130–133, (In Chinese with English Abstract). [Google Scholar]
  19. Barot, N.R.; Boehm, E.W. Gem-quality green zoisite. Gems Gemol. 1992, 28, 80–102. [Google Scholar] [CrossRef]
  20. Ye, H.J. Analysis and Research on Gemological and Mineralogical Characteristics of Tanzanite. Master’s Thesis, China University of Geosciences, Wuhan, China, 2020. (In Chinese). [Google Scholar]
  21. Du, G.P.; Fan, J.L. Characteristics of Raman spectral of calcite group minerals. Mineral. Petrol. 2010, 30, 32–35, (In Chinese with English Abstract). [Google Scholar]
  22. Fu, P.G.; Zheng, H.F. Raman spectra of aragonite and calcite at high temperature and high pressure. Spectrosc. Spectr. Anal. 2013, 33, 1557–1561, (In Chinese with English Abstract). [Google Scholar]
  23. Liu, C.J.; Zheng, H.F. In situ experimental study of phase transition of calcite by Raman spectroscopy at high temperature and high pressure. Spectrosc. Spectr. Anal. 2012, 32, 378–382, (In Chinese with English Abstract). [Google Scholar]
  24. Gillet, P.; Biellmann, C.; Reynard, B.; McMillan, P. Raman Spectroscopic Studies of Carbonates Part I: High-Pressure and High-Temperature Behaviour of Calcite, Magnesite, Dolomite and Aragonite. Phys. Chem. Miner. 1993, 20, 1–18. [Google Scholar] [CrossRef]
  25. Ding, X.; He, J.J.; Liu, Z.Y. Experimental studies on crystal growth of anatase under hydrothermal. Earth Sci. 2018, 43, 1763–1772, (In Chinese with English Abstract). [Google Scholar]
  26. Sekiya, T.; Ohta, S.; Kamei, S.; Hanakawa, M.; Kurita, S. Raman spectroscopy and phase transition of anatase TiO2 under high pressure. J. Phys. Chem. Solids 2011, 62, 717–721. [Google Scholar] [CrossRef]
  27. Pan, X.Y.; Ma, X.M.; You, J.L.; Zhu, L.H. Structural characterization of nanocrystalline TiO2 powders by X-ray diffractometer, transmission electron microscopy and high temperature Raman spectroscopy. J. Funct. Mater. 2003, 34, 192–193, (In Chinese with English Abstract). [Google Scholar]
  28. Chang, H.; Huang, P.J. Thermo-Raman studies on anatase and rutile. J. Raman Spectrosc. 1998, 29, 97–102. [Google Scholar] [CrossRef]
  29. Du, Y.L.; Deng, Y.; Zhang, M.S. Variable-temperature Raman scattering study on anatase titanium dioxide nanocrystals. J. Phys. Chem. Solids. 2006, 67, 2405–2408. [Google Scholar] [CrossRef]
  30. Dunn, P.J. Notes on inclusions in tanzanite and tourmalinated quartz. J. Gemmol. 1975, 14, 335–338. [Google Scholar] [CrossRef]
  31. Tan, P.H.; Yu, G.T.; Huang, F.M.; Zhang, S.L. A comparative Raman study of carbon nanotubes and the highly oriented pyrolytic graphite. Chin. J. Light Scatt. 1996, 8, 125–130, (In Chinese with English Abstract). [Google Scholar]
  32. Yang, J.G.; Wu, C.P. Raman spectra study on expanded graphite. Chin. J. Light Scatt. 2006, 17, 341–436, (In Chinese with English Abstract). [Google Scholar]
  33. Tuinstra, F.; Koenig, J.L. Raman spectrum of graphite. J. Chem. Phys. 1970, 53, 1126. [Google Scholar] [CrossRef] [Green Version]
  34. Sanchez, D. Iridescent Inclusion in Tanzanite. Gems Gemol. 2016, 52, 312–313. [Google Scholar]
  35. Fan, J.L.; Guo, S.G.; Mao, J.; Shi, L.Y. Study on Raman Spectra of Zoisite and Its Similar Gemstones. Appl. Laser 2007, 27, 209–212, (In Chinese with English Abstract). [Google Scholar]
  36. Qiang, J.Y.; Chuan, X.Y. Oxidation modification of natural molybdenite using concentrated sulfuric acid and its electrocatalytic properties. Acta Sci. Nat. Univ. Pekin. 2018, 54, 579–584, (In Chinese with English Abstract). [Google Scholar]
  37. Chen, X.Y.; Dai, H.; Cao, S.Q.; Yu, L.; Jiang, X.P. Study on the spectral characteristics of yellow prehnite. Geol. Anhui 2018, 28, 154–156, (In Chinese with English Abstract). [Google Scholar]
  38. Balachandran, U.; Eror, N.G. Raman-spectra of titanium-dioxide. J. Solid State Chem. 1982, 42, 276–282. [Google Scholar] [CrossRef]
Figure 1. Twenty-two different samples of tanzanite.
Crystals 11 01302 g001
Figure 2. (a) Magnified image of tanzanite sample N3; (b) magnified image of tanzanite sample N4; (c) magnified image of tanzanite sample N5; (d) magnified image of tanzanite sample N7; (e) magnified image of tanzanite sample N8; (f) magnified image of tanzanite sample N12.
Crystals 11 01302 g002
Figure 3. Location and morphology of calcite inclusions in tanzanite samples N5 and T3.
Crystals 11 01302 g003
Figure 4. Raman spectra of calcite inclusions in tanzanite sample N5 and T3.
Crystals 11 01302 g004
Figure 5. Micro-Raman spectra of calcite inclusions in tanzanite samples T1, T5 and T7.
Crystals 11 01302 g005
Figure 6. Location and morphology of anatase inclusions in tanzanite samples N5 and T7.
Crystals 11 01302 g006
Figure 7. Raman spectra of anatase inclusions in tanzanite samples N5 and T7.
Crystals 11 01302 g007
Figure 8. Location and morphology of graphite inclusions in tanzanite samples N5, N8 and T8.
Crystals 11 01302 g008
Figure 9. (a) Micro-Raman spectra of graphite inclusions in tanzanite samples N5, N8, and T8; (b) micro-Raman spectra of graphite inclusions in samples N5, N8, and T8 in the range of 1300–1500 cm−1.
Crystals 11 01302 g009
Figure 10. Location and morphology of zoisite inclusions in tanzanite samples N4, N12 and T2.
Crystals 11 01302 g010
Figure 11. Micro-Raman spectra of zoisite inclusions in tanzanite samples N4, N12 and T2.
Crystals 11 01302 g011
Figure 12. (a) Raman spectra of dolomite inclusions in tanzanite sample N5; (b) Raman spectra of molybdenite inclusions in tanzanite sample N8; (c) Micro-Raman spectra of prehnite inclusions in tanzanite sample N12; (d) Raman spectra of Rutile inclusions in tanzanite sample N12; (e) Raman spectra of hematite inclusions in tanzanite sample N12.
Crystals 11 01302 g012aCrystals 11 01302 g012b
Table 1. Conventional gemological properties of tanzanite samples.
Sample NumberColorTransparencyRefractive IndexSpecific GravityPleochroism
A1blue-violettranslucent1.693.36blue, violet
N1yellowtransparent1.713.35yellow, light grey-blue, light violet
N2yellow-bluetransparent1.713.35dark blue, yellow, light violet
N3light yellow-bluetransparent1.713.35yellow-green, blue, light violet
N4brown-bluetranslucent1.703.35yellow, light grey-blue, light violet
N5grey violet-bluetransparent1.703.35yellow, blue, light violet
N6brown-bluetranslucent1.713.35yellow, dark blue, light violet
N7blue-yellowtransparent1.713.35yellow section: yellow, grey-blue, violet
N8Indigo-violettransparent1.713.34grey-blue section light yellow, blue, light violet
N9light violettransparent -opaque1.713.34yellow section: yellow, blue, light violet-pink
N10light violettransparent-translucent1.713.35blue section light yellow, light blue, grey- violet
N11light violettransparent1.703.35violet-pink, blue, light yellow-green
N12dark violet-bluetranslucent1.703.35dark blue, violet, light yellow-green
N13light grey-violettransparent-translucent1.703.35yellow-green, light blue, violet-pink
T1light violettransparent-opaque1.703.33violet-pink, blue
T2grey-violettransparent-opaque1.703.29violet-pink, blue
T3violetopaque1.703.29violet, blue
T4grey-violetopaque1.703.28violet, blue
T5grey-violetopaque1.703.24not measurable
T6violetopaque1.703.30blue, violet
T7light violetopaque1.703.21blue, violet
T8light violetopaque1.703.16dark blue, dark violet
Publisher’s Note: MDPI stays neutral with regard to jurisdictional claims in published maps and institutional affiliations.

