Article

Flow Stability, Convective Heat Transfer and Chemical Reactions in Ammonothermal Autoclaves—Insights by In Situ Measurements of Fluid Temperatures

by
Saskia Schimmel
1,2,*,†,
Ines Kobelt
1,
Lukas Heinlein
1,
Anna-Carina L. Kimmel
3,
Thomas G. Steigerwald
3,
Eberhard Schlücker
3 and
Peter Wellmann
1
1
Crystal Growth Lab, Materials Department 6, Friedrich-Alexander-University Erlangen-Nürnberg (FAU), Martensstraße 7, 91058 Erlangen, Germany
2
International Research Fellow of Japan Society for the Promotion of Science, Institute of Materials and Systems for Sustainability, Nagoya University, C-TECs, Furo-cho, Chikusa-ku, Nagoya 464-8601, Japan
3
Institute of Process Machinery and Systems Engineering, Friedrich-Alexander-University Erlangen-Nürnberg (FAU), Cauerstraße 4, 91058 Erlangen, Germany
*
Author to whom correspondence should be addressed.
Present address: Institute of Materials and Systems for Sustainability, Nagoya University, C-TECs, Furo-cho, Chikusa-ku, Nagoya 464-8601, Japan.
Crystals 2020, 10(9), 723; https://doi.org/10.3390/cryst10090723
Submission received: 24 July 2020 / Revised: 12 August 2020 / Accepted: 17 August 2020 / Published: 20 August 2020
(This article belongs to the Section Inorganic Crystalline Materials)

Abstract

:
A variety of functional nitride materials, including the important wide bandgap semiconductor GaN, can be crystallized in exceptionally good structural quality by the ammonothermal method. However, the further development of this method is hindered by a lack of access to internal process parameters including fluid temperatures, flow stability and reaction kinetics. Internal temperature measurements are thus introduced as a tool for in situ monitoring of fluid flow stability in ammonothermal reactors as well as chemical reactions associated with enthalpy changes. The temperature change of an internal thermocouple is studied numerically in order to estimate possible errors due to heat conduction along thermocouples as well as due to their heat capacity. Results from otherwise identical experiments conducted with air at ambient pressure and ammonothermal reaction medium, respectively, are compared. The comparison indicates that internal temperature distributions during ammonothermal growth of GaN cannot be determined by measurements using ambient pressure air instead of supercritical ammonia. Even an approximate determination is not feasible, given that the internal temperature gradients differ by a factor of seven, and that the Grashof- and Rayleigh numbers differ by approximately four orders of magnitude. Most importantly, convective heat transfer by supercritical ammonia is found to greatly influence the temperature distribution inside the reaction chamber and its walls, suggesting that it probably needs to be taken into account in numerical simulations of the global thermal field of ammonothermal reactors.

Graphical Abstract

1. Introduction

The ammonothermal method has evolved as a particularly promising route for the synthesis of major quantities of high-quality bulk GaN crystals. Several groups have demonstrated two-inch crystal diameters or even larger crystals [1,2,3,4], growth rates of several hundreds of micrometers per day [3,4,5] and nearly bow-free crystals with a radius of curvature exceeding 1000 m [4,6]. In addition, the method has proven to be a valuable tool for exploratory syntheses of nitride materials [7,8] including earth-abundant semiconductors [9,10].
For both bulk and exploratory syntheses, the internal temperature distribution inside the high-pressure autoclaves is very important. Besides temperature distribution, convective mass transport of soluble intermediates is highly relevant for most of these applications, especially for the growth of bulk crystals. As will become obvious in this work, fluid flow and temperature distribution are tightly interconnected. Various groups have studied fluid flow and temperature distribution by numerical simulations [11,12,13,14]. However, validation of the results has only been performed to a very limited extent, due to the difficulty of experimental access to the interior of high-pressure autoclaves. Masuda et al. measured internal temperatures, presumably in the vicinity of the autoclave wall, but do not give comprehensive information on the position and experimental conditions of the measurement [15]. Alt et al. demonstrated internal temperature measurements as well as further in situ monitoring technologies [16], but did not discuss information beyond temperature itself that is contained in the measurement signal of internal thermocouples. Alt et al. also show a method for flow monitoring through optical in situ monitoring [16]. While this is promising for visualizing flow fields in principle, this technique cannot easily be applied to most crystal growth reactors because it requires the use of autoclave windows, which poses special geometrical constraints on the reactor design. Moreover, Erlekampf et al. explicitly show internal temperature measurements, however, their measurements are limited to conditions where the top part of the autoclave is warmer than the bottom part [12], which must be expected to suppress natural convection and does not represent conditions suitable for bulk growth. Griffiths et al. [17] performed internal temperature measurements but focused on the direct information on temperatures rather than on indirectly contained information on fluid flow. Nevertheless, Griffith et al. note fluctuations of fluid temperatures of up to 15 K [17]. Several numerical studies (employing a thermal gradient that facilitates natural convection) also indicate that the flow of the fluid is highly oscillatory under certain conditions [13,14,18]. In particular, simulations by Mirzaee et al. indicate that flow oscillations are closely linked to oscillations in temperature [14] but the authors do not present experimental validation.
Due to the high density of supercritical ammonia, particularly in the case of ammonothermal growth of GaN which uses supercritical ammonia far above its critical parameters, one can expect a pronounced contribution of convective heat transfer to the overall heat transfer inside the autoclave. More precisely, the high density contributes to a high volumetric heat capacity, which can be expressed as the product of specific heat capacity cp and density ρ. A high volumetric heat capacity should enable the fluid to transport a high amount of energy per volume. In conjunction with low viscosities that are typical for supercritical fluids, this can be expected to lead to a particularly significant contribution of convective heat transfer to the overall heat transfer. The idea behind this study, therefore, is twofold. First, we investigate whether in situ measurements of fluid temperatures may represent a valuable tool for obtaining information on fluid flow. The background is that fluctuations in fluid temperature should be caused by fluctuations in flow velocity. Moreover, the average (quasi-steady) thermal gradient inside the fluid should depend strongly on mean flow velocities. As a second aspect, we investigate how much internal temperatures differ if measured in situ under ammonothermal conditions or with the same temperature control settings but use ambient air as the medium. The latter is of both practical and theoretical interest. The practical aspect is that measurements at ambient pressure in air can be conducted easily in almost any laboratory. The theoretical aspect is that the comparison of ammonothermal medium and air experiments shows whether there is a strong contribution of convective heat transfer (due to the much lower density and lower specific heat capacity of air, convective heat transfer can be expected to be much less pronounced if ambient air is used as the medium inside the autoclave).
Several types of information that are accessible by in situ fluid temperature measurements will be analyzed based on experimental data. A numerical simulation of thermocouple heating by temperature changes in the fluid will be used to obtain an estimate of thermocouple response time. The simulation will also be used to estimate how far an internal thermocouple needs to reach into the fluid to measure fluid temperatures accurately, i.e., without an influence of the temperature of the thermocouple-containing autoclave wall, which can influence the temperature at the thermocouple junction due to heat conduction through the thermocouple. Characteristic dimensionless numbers will also be given. While the focus is on fluid flow and convective heat transfer, additional information contained in the experimental data will also be presented.

2. Materials and Methods

In the following section, the experimental methods are described first. Thereafter, the methods used for the numerical simulation are given.

2.1. Experiments with Internal Temperature Measurements

Experiments were conducted using a custom-made 3-zone furnace (LOBA 750-115/60-400-3, HTM Reetz GmbH, Berlin, Germany). Two different geometries of custom-made autoclaves made of a nickel-base superalloy (Inconel 718®, Zapp AG, Ratingen, Germany) were used (see Table 1). The end piece of setup A is also a custom-made Inconel 718® part. A schematic of the autoclaves as well as autoclave-specific modifications to the furnace for autoclave positioning are given in Figure 1.
Temperature measurements were carried out using Type K thermocouples. The positions of fluid temperature measurement were chosen so that they correspond approximately to the middle of each temperature zone.
Procedures analogous to our previous study [19] were used, including that the head assembly of the autoclaves was not connected to any metal parts during the experiment. The experiments were conducted in ambient air inside a nonhermetically closed steel enclosure (for protection of operators in case of ruptures and leakages). The air turnover in the steel enclosure was controlled by connection to an exhaust fan. While this was done for safety reasons, it also has an effect on the thermal boundary conditions of the experiments and may differ from those in other laboratories. Components of the head assembly were made of stainless steels 1.4571 or 1.4435. The head assembly consisted of a hand valve (SITEC-Sieber Engineering AG, Maur, Switzerland), burst disc (SITEC-Sieber Engineering AG), pressure transducer (HBM P2VA2/5000bar, Hottinger Brüel & Kjaer GmbH, Darmstadt, Germany; accuracy class 0.3 for the measurement range used) as well as one cross and one T-fitting for connecting these parts. For internal temperature measurements, commercially available Type K thermocouples with Inconel 600® sheath (TC Mess- und Regeltechnik GmbH, Mönchengladbach, Germany) were used.
Single thermocouples were mounted to an Inconel 718® blind with a tight fit bore by laser welding with a highly alloyed Ni-base filler metal (252-CT, CRONITEX Metallurgie und Schweißtechnik GmbH, Bergisch Gladbach, Germany). For introducing two thermocouples through one blind, the thermocouples were mounted to an Inconel 718® blind with appropriate bore by soldering. In this case, a high melting silver solder with soldering flux (56 UX, TECHNOLIT GmbH, Großenlüder, Germany; melting range 630–660 °C) was used to fill the small gaps between thermocouple and bore. Soldering as well as welding resulted in a reliable and reusable connection between the blind and thermocouples with regard to sealing and corrosion resistance in basic ammonothermal solutions.
The diameter of the thermocouples was 1.5 mm except for the bottom thermocouple in experiment B with a diameter of 1.0 mm. This small difference is thought to have a negligible effect on response time, as well as on heat conduction along the thermocouple. The absolute error of the temperature measurements is 2.5 K, based on the accuracy of thermocouples and extension wires. For experiments A1 to A3, the top and bottom thermocouples reached 34 mm and 25 mm into the fluid, respectively. For experiment B, the junction-containing tip of the top thermocouple had a distance of 85 mm from the top inner wall and the tip of the bottom thermocouple was positioned 55 mm above the bottom inner wall of the autoclave.
Temperature and pressure data were generally recorded every 2.5 s. During selected steady periods of the experiments, both temperature and pressure data were additionally sampled every 10 milliseconds for studying temperature fluctuations with better time resolution.
In experiments with mineralizer, NaN3 (Roth, 99.99%) was used as received. A 1.5 mm thick Inconel wire was employed as a standoff for mounting GaN crystals and, if applicable, an Inconel 718® baffle. The baffle (used in experiment A3 only, positioned 60 mm from the bottom of the autoclave) contained four holes of 4 mm diameter each and had an outer diameter of 20 mm, corresponding to an open-space ratio of 27%. A 1.5 mm thick Inconel welding wire (CRONI-WIG 252-C, CRONITEX Metallurgie und Schweißtechnik GmbH) was used as a standoff. A 0.5 mm thick Molybdenum wire was used for mounting the internal components. HVPE GaN pieces were used in order to create a similar fluid composition as in an actual growth experiment (one piece was hung in each of the temperature zones) because Ga-containing solutes are suspected to alter fluid properties [20].
The initial experiments were conducted without baffles (i.e., using an experimental configuration that favors strong natural convection) in order to first investigate whether internal temperature measurements can be utilized as a probe for fluid flow. An overview of the experiments is given in Table 2.
Two experiments were performed with identical setup in order to compare temperature fields with different fluids: One experiment using air at ambient pressure (experiment A1), and one using supercritical ammonia containing mineralizer as well as Ga-containing solutes (A2). While internal temperature measurements in ambient air do not require specialized high-pressure equipment and are thus easier available, there are no data in literature clarifying how close such data are to those under ammonothermal conditions. Another pair of experiments was designed to study the influence of the baffle (A2 without baffle, A3 with baffle). The last experiment, B, was conducted with an autoclave of different aspect ratio. This was done mostly for establishing an improved setup that allows for introducing multiple thermocouples from the top, which eliminates trapping of sodium amide in the bore around the bottom thermocouple if a closely fitting crucible is used. However, it also allows for comparison of two autoclaves with different aspect ratios (A2 and B).

2.2. Numerical Simulation of Thermocouple Temperature Changes

In order to clarify under which circumstances the measured temperatures can be assumed to represent the fluid temperatures, numerical simulations were conducted. The two main aspects to be addressed are heat conduction in the thermocouple (i.e., heat transfer from the autoclave wall through the thermocouple) and the heat capacity of the thermocouple (i.e., the possibility of a delayed, damped response). The time needed to heat up thermocouples and its effect on response times have been analyzed by Atroshenko et al. before [25], however, using much larger thermocouple diameters and other surrounding media.
Simulations of thermocouple heating were conducted using Phoenics 2019 64 bit software (Concentration, Heat and Momentum Limited, London, United Kingdom), i.e., using the SIMPLEST (SIMPLE ShorTened) algorithm [26]. The following combinations of solvers and preconditioners were used: CGRS (Conjugate-Gradient-Residual Solver) with AMG (BoomerAMG from HYPRE) for pressure P1, CGRS (Conjugate-Gradient-Residual Solver) with PBP (Point-By-Point preconditioner) for velocity components V1 and W1, and AMG for the temperature TEM1 as well as for the scalar variable LTLS. The variable LTLS is an auxiliary variable related to the calculation of the distance to the nearest solid wall [26]. Further information on the solvers, variables and other Software-specific details can be found in [26].
In the simulations, a 1.5 mm thick thermocouple reaching 85 mm into the fluid (i.e., the dissolution zone thermocouple in experiment B) is considered. The thermocouple was approximated as a 1.5 mm thick rod of Inconel 718 (see Table 3 for materials properties used).
The location of the thermocouple junction was assumed to be 1 mm away from the surface of the thermocouple tip. The temperature measured in the relief hole of the autoclave head, Tcover, was used as a fixed temperature boundary condition, since it was found to be rather stable in the experiment. The distance of this fixed temperature boundary to the fluid region corresponds approximately to the wall thickness of the autoclave head and is 45 mm. The very narrow gap between the thermocouples and the wall of the bore through the autoclave head was neglected (thus, the calculation should overestimate the influence of heat conduction through the thermocouple from its contact to the autoclave head). For simplicity, only a 10 mm wide region at the center of the autoclave, corresponding to approximately half of the inner diameter of the autoclave, was considered for this estimation. Consequently, the sidewalls of the domain were defined as open, so that the returning fluid flow did not need to be calculated. In order to allow for the development of a realistic flow field around the thermocouple, the simulation domain extends 25 mm beyond the thermocouple tip. An illustration of the simulation domain is depicted in Figure 2.
Firstly, a quasi-steady state temperature and velocity distribution was determined, assuming fluid to flow into the domain at a temperature of 513.75 °C and a velocity of 0.2 m/s in the direction towards the tip of the thermocouple. The chosen temperature 513.75 °C represents the mean temperature of the studied thermocouple junction within the time period shown in detail in the upper subfigure of Figure 6 (the temperature fluctuated between approximately 507.5 °C and 520.0 °C). As for the velocity, a literature-based assumption had to be made, and the value of 0.2 m/s was taken from simulations by Erlekampf et al. [12] as a typical value in regions of high flow velocity. The temperature distribution and flow field were calculated for after one hour to ensure a quasi-stable state. The results of this calculation were then used as initial values for a calculation of short time scale changes triggered by a change in the temperature of the inflowing fluid to 520 °C. The chosen temperature of the inflowing fluid represents the maximum temperature recorded within the time period shown in detail in the upper subfigure of Figure 6. In the quasi-steady case, the normalized residuals for P1, V1, W1, TEM1 and LTLS were 6.281 × 10⁻²%, 1.826 × 10⁻¹%, 2.717 × 10⁻¹%, 5.898 × 10⁻⁴% and 8.386 × 10⁻⁷%. The term ‘normalized’ indicates normalization of the sum of residuals to the typical flow rate RESREF of the respective variable [26], which was calculated by the solver. The model was checked for mesh sensitivity by doubling the number of cells in each region and no deviations of significance were observed.
A total of 50 timesteps symmetrically distributed over 5 s were calculated after changing the inlet temperature to 520 °C. In the final time step of this transient case, normalized residuals for P1, V1, W1, TEM1 and LTLS were 4.091 × 10⁻³%, 1.149 × 10⁻¹%, 2.012 × 10⁻¹%, 1.574 × 10⁻⁴% and 3.221 × 10⁻¹⁰%, respectively. Normalized residuals of other timesteps were similar or lower. For each timestep, the temperature 1 mm from the outside of the thermocouple tip was extracted as a conservative estimate for the location of the thermocouple junction.

3. Results and Discussion

In the following section, the results will be presented and analyzed, including methodical aspects.

3.1. Characterization of the Experiments by Dimensionless Numbers

As a basis for further discussion, dimensionless numbers of the experiments are given in Table 4. The three dimensionless numbers are the Rayleigh number Ra, the Grashof number Gr and the Prantl number Pr, which are connected by Ra = Gr * Pr. Note that the calculation of the Grashof number Gr requires a characteristic temperature difference. We use the temperature difference between the two points of measurement (the locations of these two temperature measurements can be found as TDZ and TCZ in Figure 1). For the characteristic length, we modify a suggestion by Lin and Akins for the definition of the characteristic length in natural convection in enclosures [29]. Lin and Akins define the characteristic length as the product of a dimensionality parameter (equal to 3 for a cylinder) and the volume of the enclosed fluid divided by the total interior area of the enclosure. Besides the analysis in [29], it appears reasonable to include the inner length and not only the radius of the enclosure: The temperature difference ∆T in the calculation of the Prantl number will obviously have a different effect on buoyancy that depends on the vertical distance over which the temperature difference occurs. To select inner length and inner area so that they correspond to the dimensions across which measured temperature difference data are available, we use the distance between the two thermocouples as an effective inner length and use the same length for calculating the effective internal area. Note also that pure substance data (given in Table 2) were used for the calculation of the dimensionless numbers, thus the given dimensionless numbers neglect possible influences of solutes on fluid properties.
As evident from Table 4, there is a difference of approximately four orders of magnitude in the Grashof and Rayleigh numbers of the experiment conducted with ambient air (A1) and the experiments conducted with ammonothermal reaction media (A2, A3 and B). The low Grashof number in the case of using air as the medium inside the autoclave confirms that in this case a much lower contribution of convection to overall heat transfer is to be expected. On the other hand, the high Grashof numbers of the ammonothermal experiments indicates that a much larger contribution of convective heat transfer can be expected.
Prantl and Rayleigh numbers yield information whether the flow can be expected to be steady, oscillatory or turbulent [30]. As will be discussed in Section 3.3., the results shown in Figure 6 suggest turbulent flow for the experiments with supercritical ammonia inside the autoclave. For Prantl numbers in the range of 2.5 × 10⁻² to 0.85 × 10⁴, steady flow is to be expected for Rayleigh numbers up to 2.4 × 10³ [30]. Specifically for air, Krishnamurti reports the flow to remain steady up to a Rayleigh number of 5.6 × 10³ [30]. Thus, only steady convection is expected in the experiment with air. Moreover, only little convective effects are expectable with air because the determined combination of Prantl and Rayleigh numbers suggest that experiment A1 operates close to the transition from no motion to steady-state two-dimensional flow according to [30]. This is in good agreement with the observation of steady internally measured temperatures for experiment A1 (as evident from Table 5 and Figure 7).
In agreement with the expectation of much more pronounced convective heat transfer and unsteady flow for the experiments with ammonothermal reaction media, we observe well-measurable fluctuations of internal temperatures if applying a temperature distribution that causes buoyancy (as evident from Table 5 and Figure 8). Moreover, turbulent flow is to be expected in the ammonothermal experiments given the high Rayleigh number (according to [30], transition to turbulent flow should begin at Rayleigh numbers around 2.5 × 10⁴, which is approximately three orders of magnitude below the Rayleigh numbers of experiments A2, A3 and B given in Table 4).

3.2. Estimate of Thermocouple Response by Numerical Simulation

The results of numerical estimates of the temperature distribution within the thermocouple, as well as its temperature change, will be presented and discussed in the following. The velocity and temperature distributions in quasi-steady state are presented in Figure 3 and Figure 4, respectively, for the entire simulation domain. These two visualizations refer to the quasi-steady fields that would develop if the fluid temperature flowing towards the thermocouple tip and autoclave top inner wall was kept constant. The fluid flow (Figure 3) exhibits an expectable pattern with a decreased velocity in front of the thermocouple tip and in the boundary layer surrounding the thermocouple.
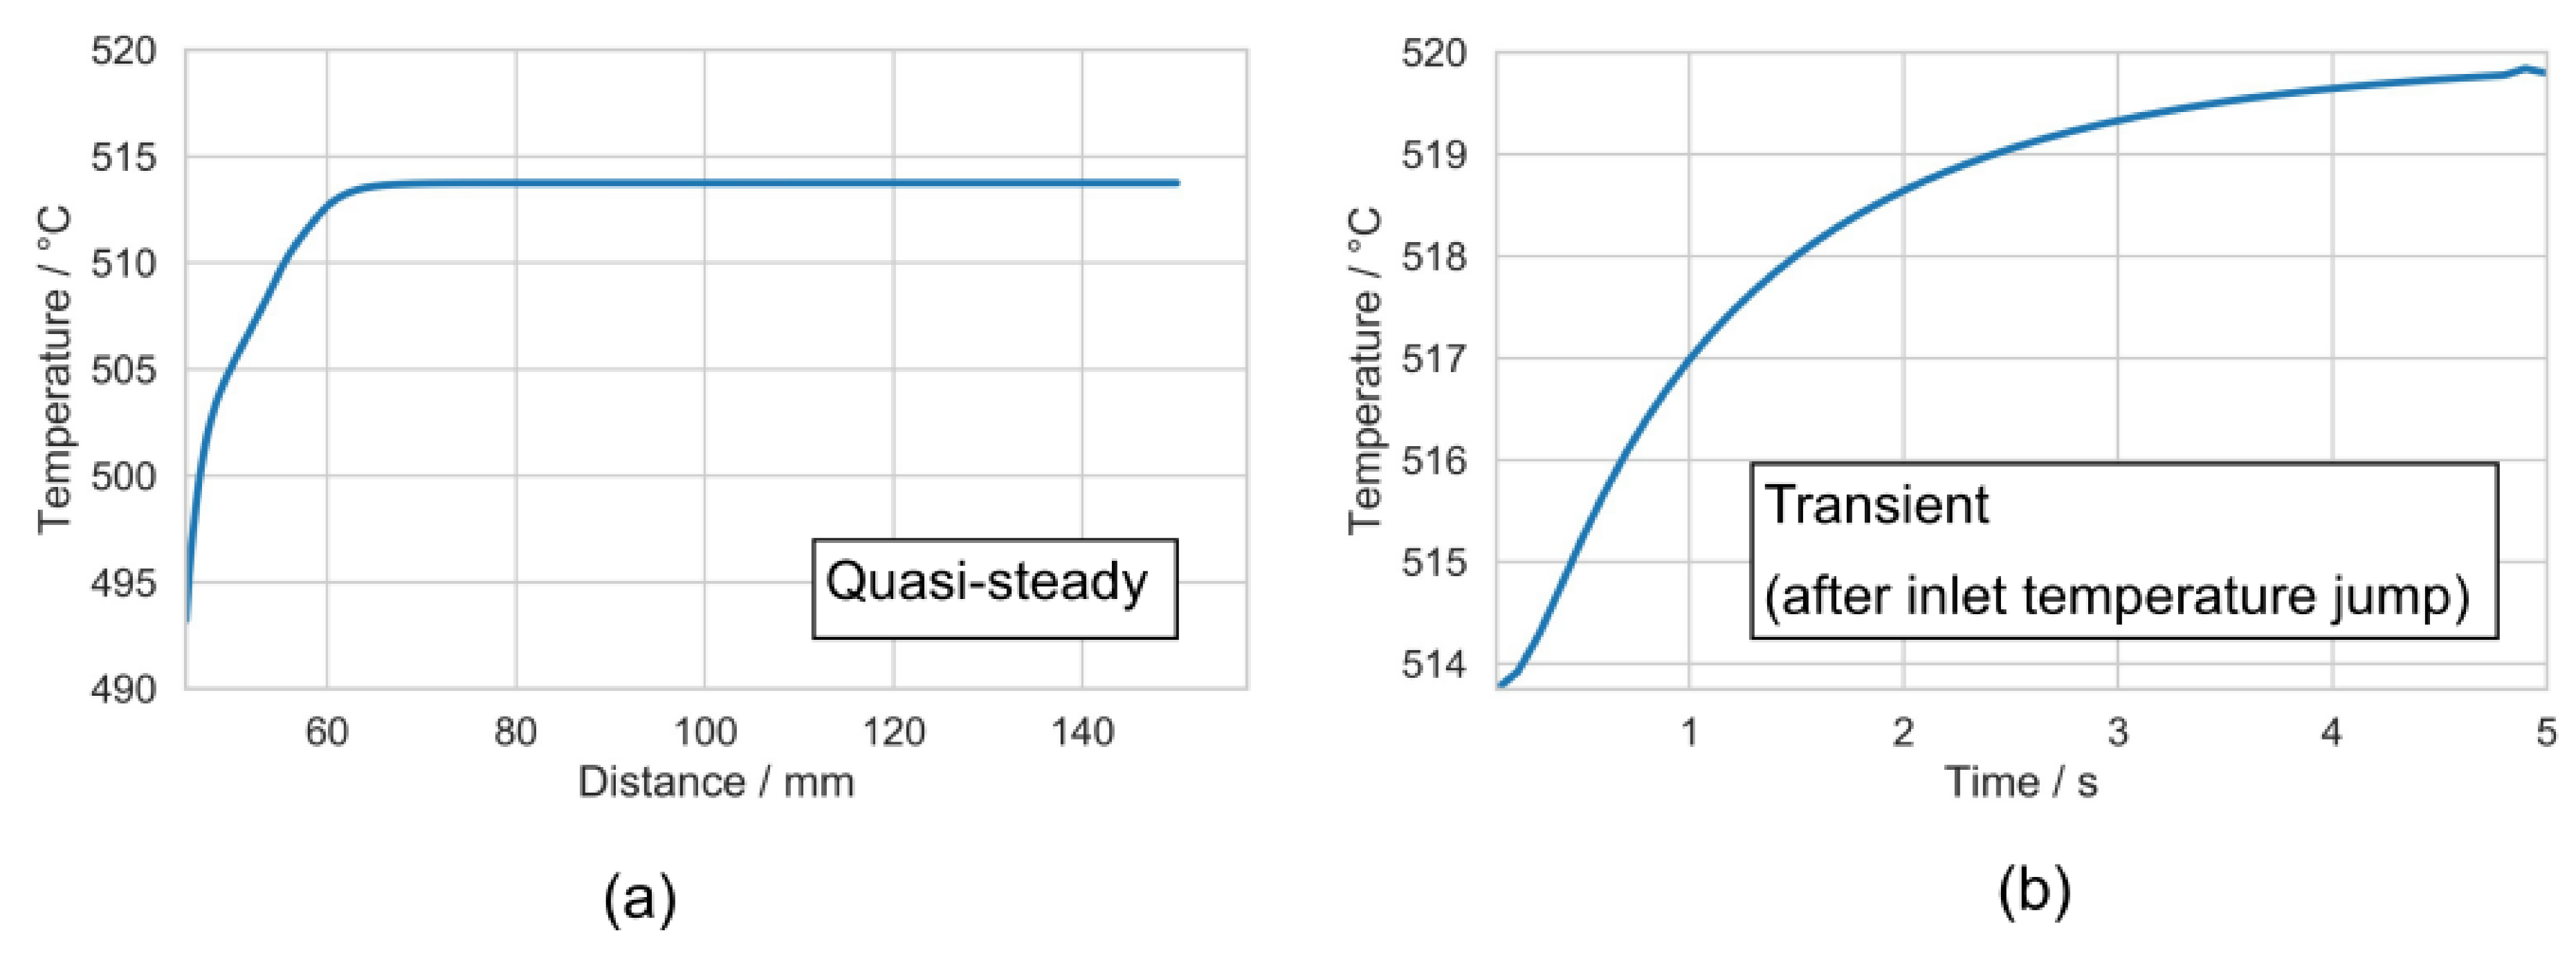
Regarding the contribution of heat conduction from the thermocouple to the cooler autoclave head, the temperature distribution in Figure 4 (top) indicates that only a short section of the thermocouple close to the top inner wall shows a reduced temperature compared to the surrounding fluid. Based on the temperature profile plotted in the graph in Figure 5a, the length of this section can be determined to be less than 20 mm. Therefore, the thermocouple can be expected to measure the fluid temperature accurately if reaching into the fluid for 20 mm or more.
Regarding the temperature fluctuations, the transient graph in Figure 5b shows that after an increase of inlet temperature by approximately 6 K, the temperature at the thermocouple junction will increase to a measurable extent already within half a second. After one second, approximately half of the total temperature change has occurred. However, it can also be seen that it will take approximately 5 s for the thermocouple junction to reach the new inlet temperature and an approximately steady state. Therefore, fast temperature fluctuation must be expected to be slightly damped in the recorded measurements.

3.3. Feasibility of Using Temperature Fluctuations as a Probe for Fluid Flow

As expected, clearly measurable fluctuations of fluid temperature were observed in the experiments with supercritical ammonia. The amplitude of these fluctuations is given in Table 5 as a plus-/minus-range following the average value of the measurement. The observed range of amplitudes in our experiments is in good agreement with internal fluid temperature measurements reported by Griffiths et al. [17]. A comparison of this range for the experiment with ambient air (±0.05) and the experiments with supercritical ammonia (up to ±4.0 for the identical setup) shows that the temperature fluctuations are much more pronounced with supercritical ammonia, indicating a strong and measurable contribution of convection to the heat transfer inside the autoclave.
The flow velocity oscillations presented by Mirzaee et al. have a characteristic frequency, i.e., they occur periodically [14]. For the temperature fluctuations observed in our experiments, no such periodicity was observable, not even after decreasing the interval of measurement to 10 ms. A two-minute sample is plotted for experiment B in Figure 6, showing the measurements in both zones. The sample is representative for all experiments conducted with ammonothermal reaction medium in this study. No clear periodicity is evident from Figure 6, and Fourier transformation did not reveal any prevailing frequencies either. This is in agreement with an analysis of numerical results on temperature and velocity fluctuations by Erlekampf et al. who attempted Fourier analysis for both temperature and flow velocity obtained by numerical simulation [12]. The irregular frequency and amplitude of the temperature fluctuations is thought to be a sign of turbulent flow, at least in the vicinity of the thermocouple tips and likely other obstacles to fluid flow, such as GaN crystals. In agreement with this, most numerical studies of ammonothermal growth conditions assume the flow to be turbulent (e.g., [31,32,33]).
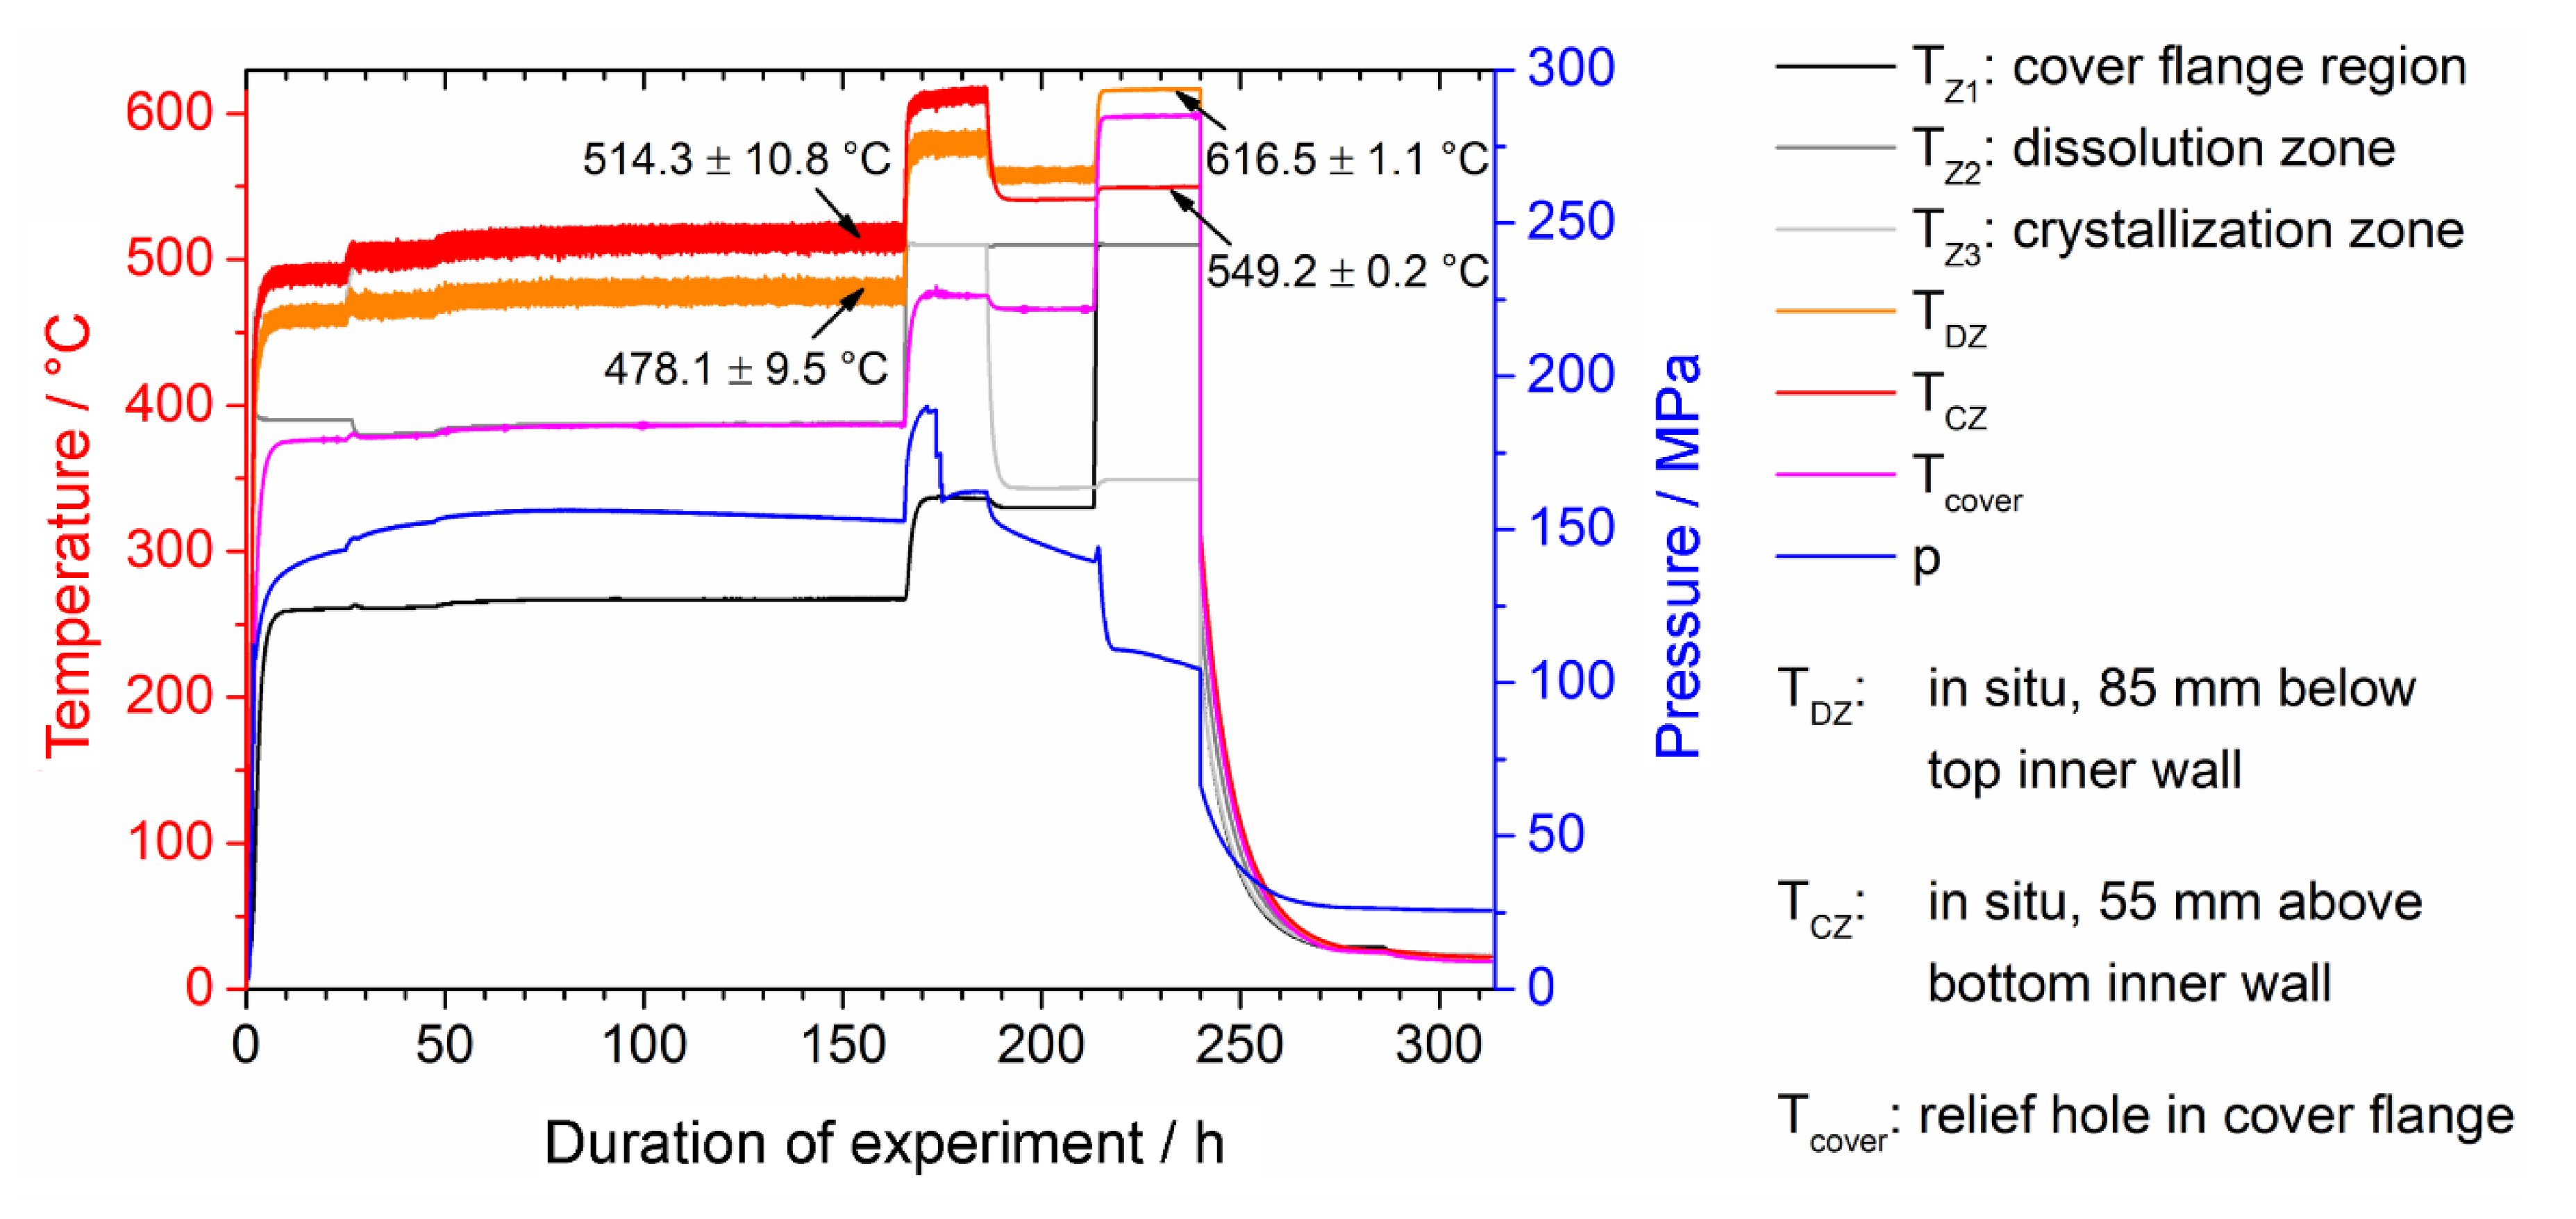
In case of air, there are no measurable fluctuations of temperature, as evident also from the plot of temperature data over time (Figure 7). In contrast to this, internal temperature measurements create an up to 11 K broad band of values in the corresponding plot for an experiment with supercritical ammonia (Figure 8).
In order to verify that the fluctuations in internal temperatures can be ascribed to buoyancy-induced temperature fluctuations, temperatures of the top and bottom zones of the autoclave were inverted in two steps (see Figure 8) in order to minimize or eliminate the driving force for natural convection. This resulted in a strong reduction of the amplitude of fluctuations. In the final step, in which the top part of the autoclave was significantly warmer than the bottom part, fluctuations were suppressed below the detection limit. The time interval between minima and maxima of temperature is in the order of several seconds, which is in good agreement of simulation data published for oscillation frequencies of fluid flow in ammonothermal autoclaves by other groups [13,14].
A strong contribution of convective heat transfer is also evident from the remarkably different internal temperature distribution that is observed when using the same set temperatures with air and supercritical ammonia, respectively. Based on the data in Table 5, the temperature difference between the two internal points of measurement decreases from 59.4 K to 8.5 K after air was exchanged by the ammonothermal reaction medium. This indicates clearly that it is not possible to investigate internal temperature distribution of ammonothermal reactors by technically simple measurements using ambient air, at least not in terms of absolute temperatures.
Experiment A3, which was conducted with a baffle, shows an increase of the internal thermal gradient by a factor of approximately 2.5 compared to the baffle-free reference experiment A2 (Table 5). The amplitude of temperature fluctuations is lower in this experiment, which is in accordance with expectations because the baffle reduces the distance across which the fluid can freely be accelerated by thermally induced density differences. This effect may also contribute to the more pronounced temperature fluctuations in experiment B1, as the autoclave type B used for this experiment has more than twice the inner length compared to autoclave type A. In spite of the strong temperature fluctuations, experiment B1 shows a larger and similarly stable temperature gradient between the two internal points of measurement. This is thought to be related to the higher aspect ratio. The aspect ratio can be expected to alter the importance of wall effects. However, the experiments with the two autoclave types have some limitations in comparability because the temperatures at the outer autoclave walls may not be fully equivalent in the two setups.
Further investigation of the temperature ramp-up part of such experiments yields some additional insights. A close-up plot of ramp-up of experiment B1 is presented in Figure 9. Enhanced convective heat transfer in higher density fluid phases is reflected by the observation that the upper internal temperature lags behind as long as the upper internal thermocouple is immersed in gaseous ammonia, and quickly approaches the temperature of the lower thermocouple as soon as it is reached by the expanding fluid phase (event ① in Figure 9). The change in heat transfer is also observable by a measurement of the temperature of the cover flange of the autoclave from the outside (utilizing a relief hole, event ② in Figure 9). Note also that the fluctuations in fluid temperatures develop gradually as the internal temperature gradient builds up (Figure 9). Event ③, which represents the decomposition of sodium azide, will be discussed in Section 3.4.

3.4. Feasibility of Probing Chemical Reactions

Besides fluid temperature and fluid flow, chemical reactions can also be monitored by internal temperature measurements, if they cause sufficient enthalpy changes [21]. This is demonstrated by the decomposition of the mineralizer precursor NaN3 (see event ③ in Figure 9, and close-up thereof in Figure 10). Besides being exothermal, this reaction also results in a pressure increase. The reaction is clearly observable as a spike in fluid temperatures (in particular the lower point of measurement, which is closer to NaN3 placed at the bottom of the autoclave) and a sudden increase in pressure. Both temperature and pressure change occurred simultaneously, supporting that the temperature spike can be ascribed to the reaction. The observed decomposition-initiating temperature of approximately 375 °C (TCZ) is slightly higher than the upper end of the temperature that has been reported for thermal decomposition of NaN3 in vacuum (240 °C to 365 °C [34]). The temperature of NaN3 upon the onset of decomposition in our case may even be a little larger because the azide is located at the bottom of the autoclave as long as it remains a solid. The decomposition occurring only at relatively high temperatures may be related to the high pressure in the autoclave suppressing reactions that cause an increase of pressure.
The decomposition of NaN3 was also repeatedly observed through similar features in other experiments. Moreover, solidification of NaNH2 during cool-down was observed occasionally in similar experiments, provided that it occurred at a thermocouple [21]. Solidification of NaNH2 occurred at 191 °C and was observable as a temporary temperature increase by approximately 5 K [21]. This is in reasonable agreement with the melting point of NaNH2 at ambient pressure, 200 °C [35]. After the experiment, solidified droplets of NaNH2 were found at the thermocouples, confirming the observation [21].
Interestingly, the range of fluctuations appears to widen after the decomposition of the azide. This is more clearly seen in the close-up in Figure 10. While the temperatures fluctuate in a range of approximately 10 K to 15 K prior to azide decomposition, the range of fluctuations increases to approximately 15 to 20 K after the reaction has been completed. In the lower zone, the width of temperature fluctuations gradually increases prior to the clearly visible part of the decomposition reaction. This might be related to a small amount of decomposition already taking place and affecting primarily the fluid in proximity to the azide. Regarding the increase in fluctuation bandwidth after azide decomposition, the question arises why this occurs and what it indicates. One possibility is changes of fluid properties that could affect fluid flow, heat transfer, or both. In aqueous electrolyte solutions, the viscosity changes compared to the viscosity of the pure solvent, and in most cases an increase of viscosity is observed [36]. For aqueous solutions of CaCl2, the viscosity is nearly independent of pressure [37], therefore it seems unlikely that the pressure increase upon azide decomposition has a major effect through a viscosity change. The decomposition also yields nitrogen, which should substantially increase the molar fraction of N2 in the fluid (the concentration of N2 originating from azide decomposition can be estimated to be approximately 1.14 mol/L). The pure substance viscosity for N2 of this density is approximately 1.13 × 10⁻⁶ m2/s [22], thus, in comparison to pure substance data of ammonia in Table 2 an increase may be expected. However, it seems yet unclear how an increase of viscosity could cause the observed effect of increased temperature or flow velocity fluctuations. Another possibility would be a change in specific heat capacity, as a fluid with higher specific heat capacity could transport more energy per volume and thus reduce the damping effect of the heat capacity of the thermocouple, if there are no other predominating effects. A slight increase of heat capacity with increasing mineralizer concentration has been reported for hydrothermal growth of ZnO using KOH [38], and Alt et al. suspected a change of heat capacity for ammonothermal reaction media upon the addition of the mineralizer NH4Cl [16]. However, Masuda et al. state that the most significant effect of the mineralizer on fluid properties is viscosity [38]. Nevertheless, Masuda et al. also note that data on the thermal expansion coefficient could not be found [38]. A change in thermal expansion coefficient could indeed have an effect on buoyancy-driven fluid flow that might be recordable. Lastly, natural convection can sometimes depend on initial conditions if there are multiple solutions for the flow field [39]. Therefore, there is a possibility that the rapid decomposition of the azide with its pressure increase disturbs the system and leads to the establishment of a different flow field. In conclusion, the reason for the increase in temperature fluctuations could not be clarified but it is thought to likely indicate some change in fluid properties.

3.5. Note on Internal Temperature Measurements Close to Autoclave Walls

From a methodical viewpoint, the question arises how far an internal thermocouple needs to reach into the fluid in order to measure fluid temperatures reasonably accurately, i.e., in order to avoid a dominating contribution of wall temperatures through heat conduction inside the thermocouple itself. From the simulation results in Figure 5a, the deviation from fluid temperature can be estimated to 15 K or less for a thermocouple ranging few millimeters into the fluid, if there is a significant thermal gradient between autoclave wall and fluid. Configurations in which the internal thermocouple tip is located in proximity to the inner wall occur, among others, in our previous studies using an optical cell for optical [40] and x-ray absorption [19,20,21,41] measurements. In these experiments, temperature fluctuations were usually not observed, in particular never during the main part of the experiment. The absence of temperature fluctuations in these experiments, however, is primarily due to the absence of measurable convective heat transfer, as the optical cell is designed for nominally isothermal conditions. It was possible to trigger temperature fluctuations also in an optical cell (with the thermocouple tip located approximately 2 mm away from the autoclave wall) by removing the heating sleeve during cool-down (see Figure 11) [21]. Thus, it could be confirmed that 2 mm distance between the tip of the thermocouple and the inner wall of the autoclave is sufficient for using internal temperature measurements as a probe for convection [21]. The absence of temperature fluctuations during the heating process as well as at steady temperature confirms that natural convection does not play a major role in such optical cell experiments [21], as assumed in our previous studies [19,20,21,41]. Note also that the above-mentioned maximum deviation of 15 K is unlikely to occur in practice because axial thermal gradients in the autoclave wall should be very small and do not create major thermal gradients between autoclave wall and fluid.

4. Conclusions

It has been demonstrated that in situ measurements of fluid temperature can be used as a probe for convective heat transfer, and that this provides an indirect experimental access to fluid flow. Moreover, information on chemical reactions with enthalpy changes can also be obtained.
A slight damping of the fluid-flow-induced temperature fluctuations is to be expected due to the heat capacity of the thermocouples, however, temperature changes become observable already after half a second. Approximately 5 s are needed for a thermocouple to fully reach fluid temperature for a sudden temperature change of 6 K. For thermocouples of around 1.5 mm thickness, measurements can be expected to be undisturbed by heat conduction through the thermocouple from the autoclave wall if the thermocouple ranges at least 20 mm into the fluid.
The internal temperature distribution of ammonothermal reactors cannot be determined reasonably accurately by technically simple measurements using air at ambient pressure, at least not in terms of absolute temperatures. The reason for this is that the internal temperature distribution is heavily affected by convective heat transfer in case of high-density fluids such as supercritical ammonia at fluid densities typical for ammonothermal GaN growth.
It was also shown that convective heat transfer has a noticeable effect on temperatures at the outer autoclave wall at locations where the temperature is not controlled directly, such as the top of the autoclave. This raises the question whether constant wall temperatures or adiabatic boundaries represent suitable boundary conditions for simulations of fluid flow. The same applies also to simulations of other processes during ammonothermal growth that are closely linked to internal temperature distributions, such as local supersaturation and crystallization. The strong contribution of convective heat transfer to overall heat transfer also calls for a further clarification of fluid properties such as viscosity. As an alternative to direct measurements of fluid properties, simulations with thorough experimental validation may pave a way to clarify whether the available data for pure ammonia are sufficiently accurate for obtaining sufficiently accuracy in simulations of internal temperature distribution and fluid flow in ammonothermal growth reactors.

Author Contributions

Conceptualization, S.S. and P.W.; methodology, A.-C.L.K., T.G.S. and E.S., formal analysis, S.S., I.K. and L.H.; investigation, I.K. and L.H.; resources, P.W. and E.S.; data curation, S.S., I.K. and L.H.; writing—original draft preparation, S.S.; writing—review and editing, S.S., A-C.L.K., T.G.S., E.S. and P.W.; visualization, S.S.; supervision, P.W. and E.S.; project administration, P.W. and E.S.; funding acquisition, P.W., E.S. (DFG project) and S.S. (fellowship). All authors have read and agreed to the published version of the manuscript.

Funding

This research was funded by Deutsche Forschungsgemeinschaft (DFG), grant number WE2107/6-2 (FOR1600, project number 182356696). One of the authors (S.S.) would like to thank the Japan Society for the Promotion of Science (JSPS) for funding during preparation of the manuscript (Postdoctoral Fellowships for Research in Japan (Standard), grant number P19752) and the Alexander von Humboldt-Foundation for the nomination for the JSPS fellowship.

Acknowledgments

We would like to thank Amano laboratory for access to simulation software.

Conflicts of Interest

The authors declare no conflict of interest. The funders had no role in the design of the study; in the collection, analyses, or interpretation of data; in the writing of the manuscript, or in the decision to publish the results.

References

  1. Key, D.; Letts, E.; Tsou, C.-W.; Ji, M.-H.; Bakhtiary-Noodeh, M.; Detchprohm, T.; Shen, S.-C.; Dupuis, R.; Hashimoto, T. Structural and Electrical Characterization of 2” Ammonothermal Free-Standing GaN Wafers. Progress toward Pilot Production. Materials 2019, 12, 1925. [Google Scholar] [CrossRef] [Green Version]
  2. Zajac, M.; Kucharski, R.; Grabianska, K.; Gwardys-Bak, A.; Puchalski, A.; Wasik, D.; Litwin-Staszewska, E.; Piotrzkowski, R.; Domagala, J.Z.; Bockowski, M. Basic ammonothermal growth of Gallium Nitride—State of the art, challenges, perspectives. Prog. Cryst. Growth Charact. Mater. 2018, 64, 63–74. [Google Scholar] [CrossRef]
  3. Mikawa, Y.; Ishinabe, T.; Kagamitani, Y.; Mochizuki, T.; Ikeda, H.; Iso, K.; Takahashi, T.; Kubota, K.; Enatsu, Y.; Tsukada, Y.; et al. Recent progress of large size and low dislocation bulk GaN growth. In Proceedings of the Gallium Nitride Materials and Devices XV; Morkoç, H., Fujioka, H., Schwarz, U.T., Eds.; SPIE: Bellingham, WA, USA, 2020; Volume 1128002, p. 1. [Google Scholar]
  4. Tomida, D.; Bao, Q.; Saito, M.; Osanai, R.; Shima, K.; Kojima, K.; Ishiguro, T.; Chichibu, S.F. Ammonothermal growth of 2 inch long GaN single crystals using an acidic NH4F mineralizer in a Ag-lined autoclave. Appl. Phys. Express 2020, 13, 055505. [Google Scholar] [CrossRef]
  5. Pimputkar, S.; Kawabata, S.; Speck, J.S.; Nakamura, S. Improved growth rates and purity of basic ammonothermal GaN. J. Cryst. Growth 2014, 403, 7–17. [Google Scholar] [CrossRef]
  6. Dwiliński, R.; Doradziński, R.; Garczyński, J.; Sierzputowski, L.P.; Puchalski, A.; Kanbara, Y.; Yagi, K.; Minakuchi, H.; Hayashi, H. Excellent crystallinity of truly bulk ammonothermal GaN. J. Cryst. Growth 2008, 310, 3911–3916. [Google Scholar] [CrossRef]
  7. Häusler, J.; Schnick, W. Ammonothermal Synthesis of Nitrides: Recent Developments and Future Perspectives. Chem. A Eur. J. 2018, 24, 11864–11879. [Google Scholar] [CrossRef] [PubMed]
  8. Häusler, J.; Neudert, L.; Mallmann, M.; Niklaus, R.; Kimmel, A.C.L.; Alt, N.S.A.; Schlücker, E.; Oeckler, O.; Schnick, W. Ammonothermal Synthesis of Novel Nitrides: Case Study on CaGaSiN3. Chem. A Eur. J. 2017, 23, 2583–2590. [Google Scholar] [CrossRef]
  9. Häusler, J.; Schimmel, S.; Wellmann, P.; Schnick, W. Ammonothermal Synthesis of Earth-Abundant Nitride Semiconductors ZnSiN2 and ZnGeN2 and Dissolution Monitoring by In Situ X-ray Imaging. Chem. A Eur. J. 2017, 23, 12275–12282. [Google Scholar] [CrossRef] [PubMed] [Green Version]
  10. Mallmann, M.; Niklaus, R.; Rackl, T.; Benz, M.; Chau, T.G.; Johrendt, D.; Minár, J.; Schnick, W. Solid Solutions of Grimm-Sommerfeld Analogous Nitride Semiconductors II-IV-N2 with II = Mg, Mn, Zn; IV = Si, Ge—Ammonothermal Synthesis and DFT Calculations. Chem. A Eur. J. 2019, 2, 15887–15895. [Google Scholar] [CrossRef] [PubMed] [Green Version]
  11. Masuda, Y.; Sato, O.; Tomida, D.; Yokoyama, C. Convection patterns and temperature fields of ammonothermal GaN bulk crystal growth process. Jpn. J. Appl. Phys. 2016, 55, 3–6. [Google Scholar] [CrossRef]
  12. Erlekampf, J.; Seebeck, J.; Savva, P.; Meissner, E.; Friedrich, J.; Alt, N.S.A.; Schlücker, E.; Frey, L. Numerical time-dependent 3D simulation of flow pattern and heat distribution in an ammonothermal system with various baffle shapes. J. Cryst. Growth 2014, 403, 96–104. [Google Scholar] [CrossRef]
  13. Jiang, Y.N.; Chen, Q.S.; Prasad, V. Numerical simulation of ammonothermal growth processes of GaN crystals. J. Cryst. Growth 2011, 318, 411–414. [Google Scholar] [CrossRef] [Green Version]
  14. Mirzaee, I.; Charmchi, M.; Sun, H. Heat, mass, and crystal growth of GaN in the ammonothermal process: A numerical study. Numer. Heat Transf. Part A Appl. 2016, 70, 460–491. [Google Scholar] [CrossRef]
  15. Masuda, Y.; Suzuki, A.; Ishiguro, T.; Yokoyama, C. Heat and Fluid Flow in Solvothermal Autoclave for Single-Crystal Growth Process. J. Therm. Sci. Technol. 2012, 7, 379–386. [Google Scholar] [CrossRef] [Green Version]
  16. Alt, N.; Meissner, E.; Schlücker, E.; Frey, L. In situ monitoring technologies for ammonthermal reactors. Phys. Status Solidi Curr. Top. Solid State Phys. 2012, 9, 436–439. [Google Scholar] [CrossRef]
  17. Griffiths, S.; Pimputkar, S.; Kearns, J.; Malkowski, T.F.; Doherty, M.F.; Speck, J.S.; Nakamura, S. Growth kinetics of basic ammonothermal gallium nitride crystals. J. Cryst. Growth 2018, 501, 74–80. [Google Scholar] [CrossRef]
  18. Chen, Q.S.; Pendurti, S.; Prasad, V. Effects of baffle design on fluid flow and heat transfer in ammonothermal growth of nitrides. J. Cryst. Growth 2004, 266, 271–277. [Google Scholar] [CrossRef] [Green Version]
  19. Schimmel, S.; Koch, M.; Macher, P.; Kimmel, A.C.L.; Steigerwald, T.G.; Alt, N.S.A.; Schlücker, E.; Wellmann, P. Solubility and dissolution kinetics of GaN in supercritical ammonia in presence of ammonoacidic and ammonobasic mineralizers. J. Cryst. Growth 2017, 479, 59–66. [Google Scholar] [CrossRef]
  20. Schimmel, S.; Duchstein, P.; Steigerwald, T.G.; Kimmel, A.-C.L.; Schlücker, E.; Zahn, D.; Niewa, R.; Wellmann, P. In situ X-ray monitoring of transport and chemistry of Ga-containing intermediates under ammonothermal growth conditions of GaN. J. Cryst. Growth 2018, 498, 214–223. [Google Scholar] [CrossRef]
  21. Schimmel, S. In Situ Visualisierung des Ammonothermalen Kristallisationsprozesses mittels Röntgenmesstechnik. Ph.D. Thesis, Friedrich-Alexander-Universität Erlangen-Nürnberg (FAU), Erlangen, Germany, 2018. [Google Scholar]
  22. Lemmon, E.W.; McLinden, M.O.; Friend, D.G. Thermophysical Properties of Fluid Systems. Linstrom, P.J., Mallard, W.G., Eds.; Available online: http://http//webbook.nist.gov/chemistry (accessed on 5 June 2017).
  23. Panasiti, M.D.; Lemmon, E.W.; Penoncello, S.G.; Jacobsen, R.T.; Friend, D.G. Thermodynamic properties of air from 60 to 2000 K at pressures up to 2000 MPa. Int. J. Thermophys. 1999, 20, 217–228. [Google Scholar] [CrossRef]
  24. Kadoya, K.; Matsunaga, N.; Nagashima, A. Viscosity and Thermal Conductivity of Dry Air in the Gaseous Phase. J. Phys. Chem. Ref. Data 1985, 14, 947–970. [Google Scholar] [CrossRef] [Green Version]
  25. Atroshenko, Y.K.; Strizhak, P.A.; Yashutina, O.S. Determination of necessary time of measurements of surface thermocouples depending on conditions of technological processes. EPJ Web Conf. 2015, 82. [Google Scholar] [CrossRef] [Green Version]
  26. Spalding, D.B. The PHOENICS Encyclopaedia; Concentration, Heat and Momentum Ltd.: London, UK, 1996. [Google Scholar]
  27. VDM Metals International GmbH. VDM Alloy 718 Nicrofer 5219 Nb; VDM Metals International GmbH: Werdohl, Germany, 2019; pp. 1–13. [Google Scholar]
  28. Greene, G.A.; Finfrock, C.C.; Irvine, T.F. Total hemispherical emissivity of oxidized Inconel 718 in the temperature range 300–1000 °C. Exp. Therm. Fluid Sci. 2000, 22, 145–153. [Google Scholar] [CrossRef]
  29. Lin, Y.S.; Akins, R.G. A Suggested Characteristic Dimension for Natural Convection in Enclosures. Chem. Eng. Commun. 1986, 49, 119–126. [Google Scholar] [CrossRef]
  30. Krishnamurti, R. Some further studies on the transition to turbulent convection. J. Fluid Mech. 1973, 60, 285–303. [Google Scholar] [CrossRef]
  31. Pendurti, S.; Chen, Q.S.; Prasad, V. Modeling ammonothermal growth of GaN single crystals: The role of transport. J. Cryst. Growth 2006, 296, 150–158. [Google Scholar] [CrossRef] [Green Version]
  32. Masuda, Y.; Suzuki, A.; Ishiguro, T.; Yokoyama, C. Numerical simulation of heat and fluid flow in ammonothermal GaN bulk crystal growth process. Jpn. J. Appl. Phys. 2013, 52. [Google Scholar] [CrossRef]
  33. Enayati, H.; Chandy, A.J.; Braun, M.J. Numerical simulations of transitional and turbulent natural convection in laterally heated cylindrical enclosures for crystal growth. Numer. Heat Transf. Part A Appl. 2016, 70, 1195–1212. [Google Scholar] [CrossRef]
  34. Pai Verneker, V.R.; Krishna Mohan, V. Thermal decomposition of sodium azide. Thermochim. Acta 1977, 21, 375–380. [Google Scholar] [CrossRef]
  35. Jepsen, L.H.; Wang, P.; Wu, G.; Xiong, Z.; Besenbacher, F.; Chen, P.; Jensen, T.R. Thermal decomposition of sodium amide, NaNH2, and sodium amide hydroxide composites, NaNH2–NaOH. Phys. Chem. Chem. Phys. 2016, 18, 25257–25264. [Google Scholar] [CrossRef]
  36. Lencka, M.M.; Anderko, A.; Sanders, S.J.; Young, R.D. Modeling viscosity of multicomponent electrolyte solutions. Int. J. Thermophys. 1998, 19, 367–378. [Google Scholar] [CrossRef]
  37. Abdulagatov, I.M.; Azizov, N.D. Viscosity of aqueous calcium chloride solutions at high temperatures and high pressures. Fluid Phase Equilib. 2006, 240, 204–219. [Google Scholar] [CrossRef]
  38. Masuda, Y.; Suzuki, A.; Mikawa, Y.; Yokoyama, C.; Tsukada, T. Numerical simulation of natural convection heat transfer in a ZnO single-crystal growth hydrothermal autoclave—Effects of fluid properties. J. Cryst. Growth 2009, 311, 675–679. [Google Scholar] [CrossRef]
  39. Ferialdi, H.; Lappa, M.; Haughey, C. On the role of thermal boundary conditions in typical problems of buoyancy convection: A combined experimental-numerical analysis. Int. J. Heat Mass Transf. 2020, 159. [Google Scholar] [CrossRef]
  40. Steigerwald, T.G.; Balouschek, J.; Hertweck, B.; Kimmel, A.-C.L.; Alt, N.S.A.; Schluecker, E. In situ investigation of decomposing ammonia and ammonobasic solutions under supercritical conditions via UV/vis and Raman Spectroscopy. J. Supercrit. Fluids 2018, 134, 96–105. [Google Scholar] [CrossRef]
  41. Schimmel, S.; Lindner, M.; Steigerwald, T.G.; Hertweck, B.; Richter, T.M.M.; Künecke, U.; Alt, N.S.A.; Niewa, R.; Schlücker, E.; Wellmann, P.J. Determination of GaN solubility in supercritical ammonia with NH2F and NH2Cl mineralizer by in situ X-ray imaging of crystal dissolution. J. Cryst. Growth 2015, 418, 64–69. [Google Scholar] [CrossRef]
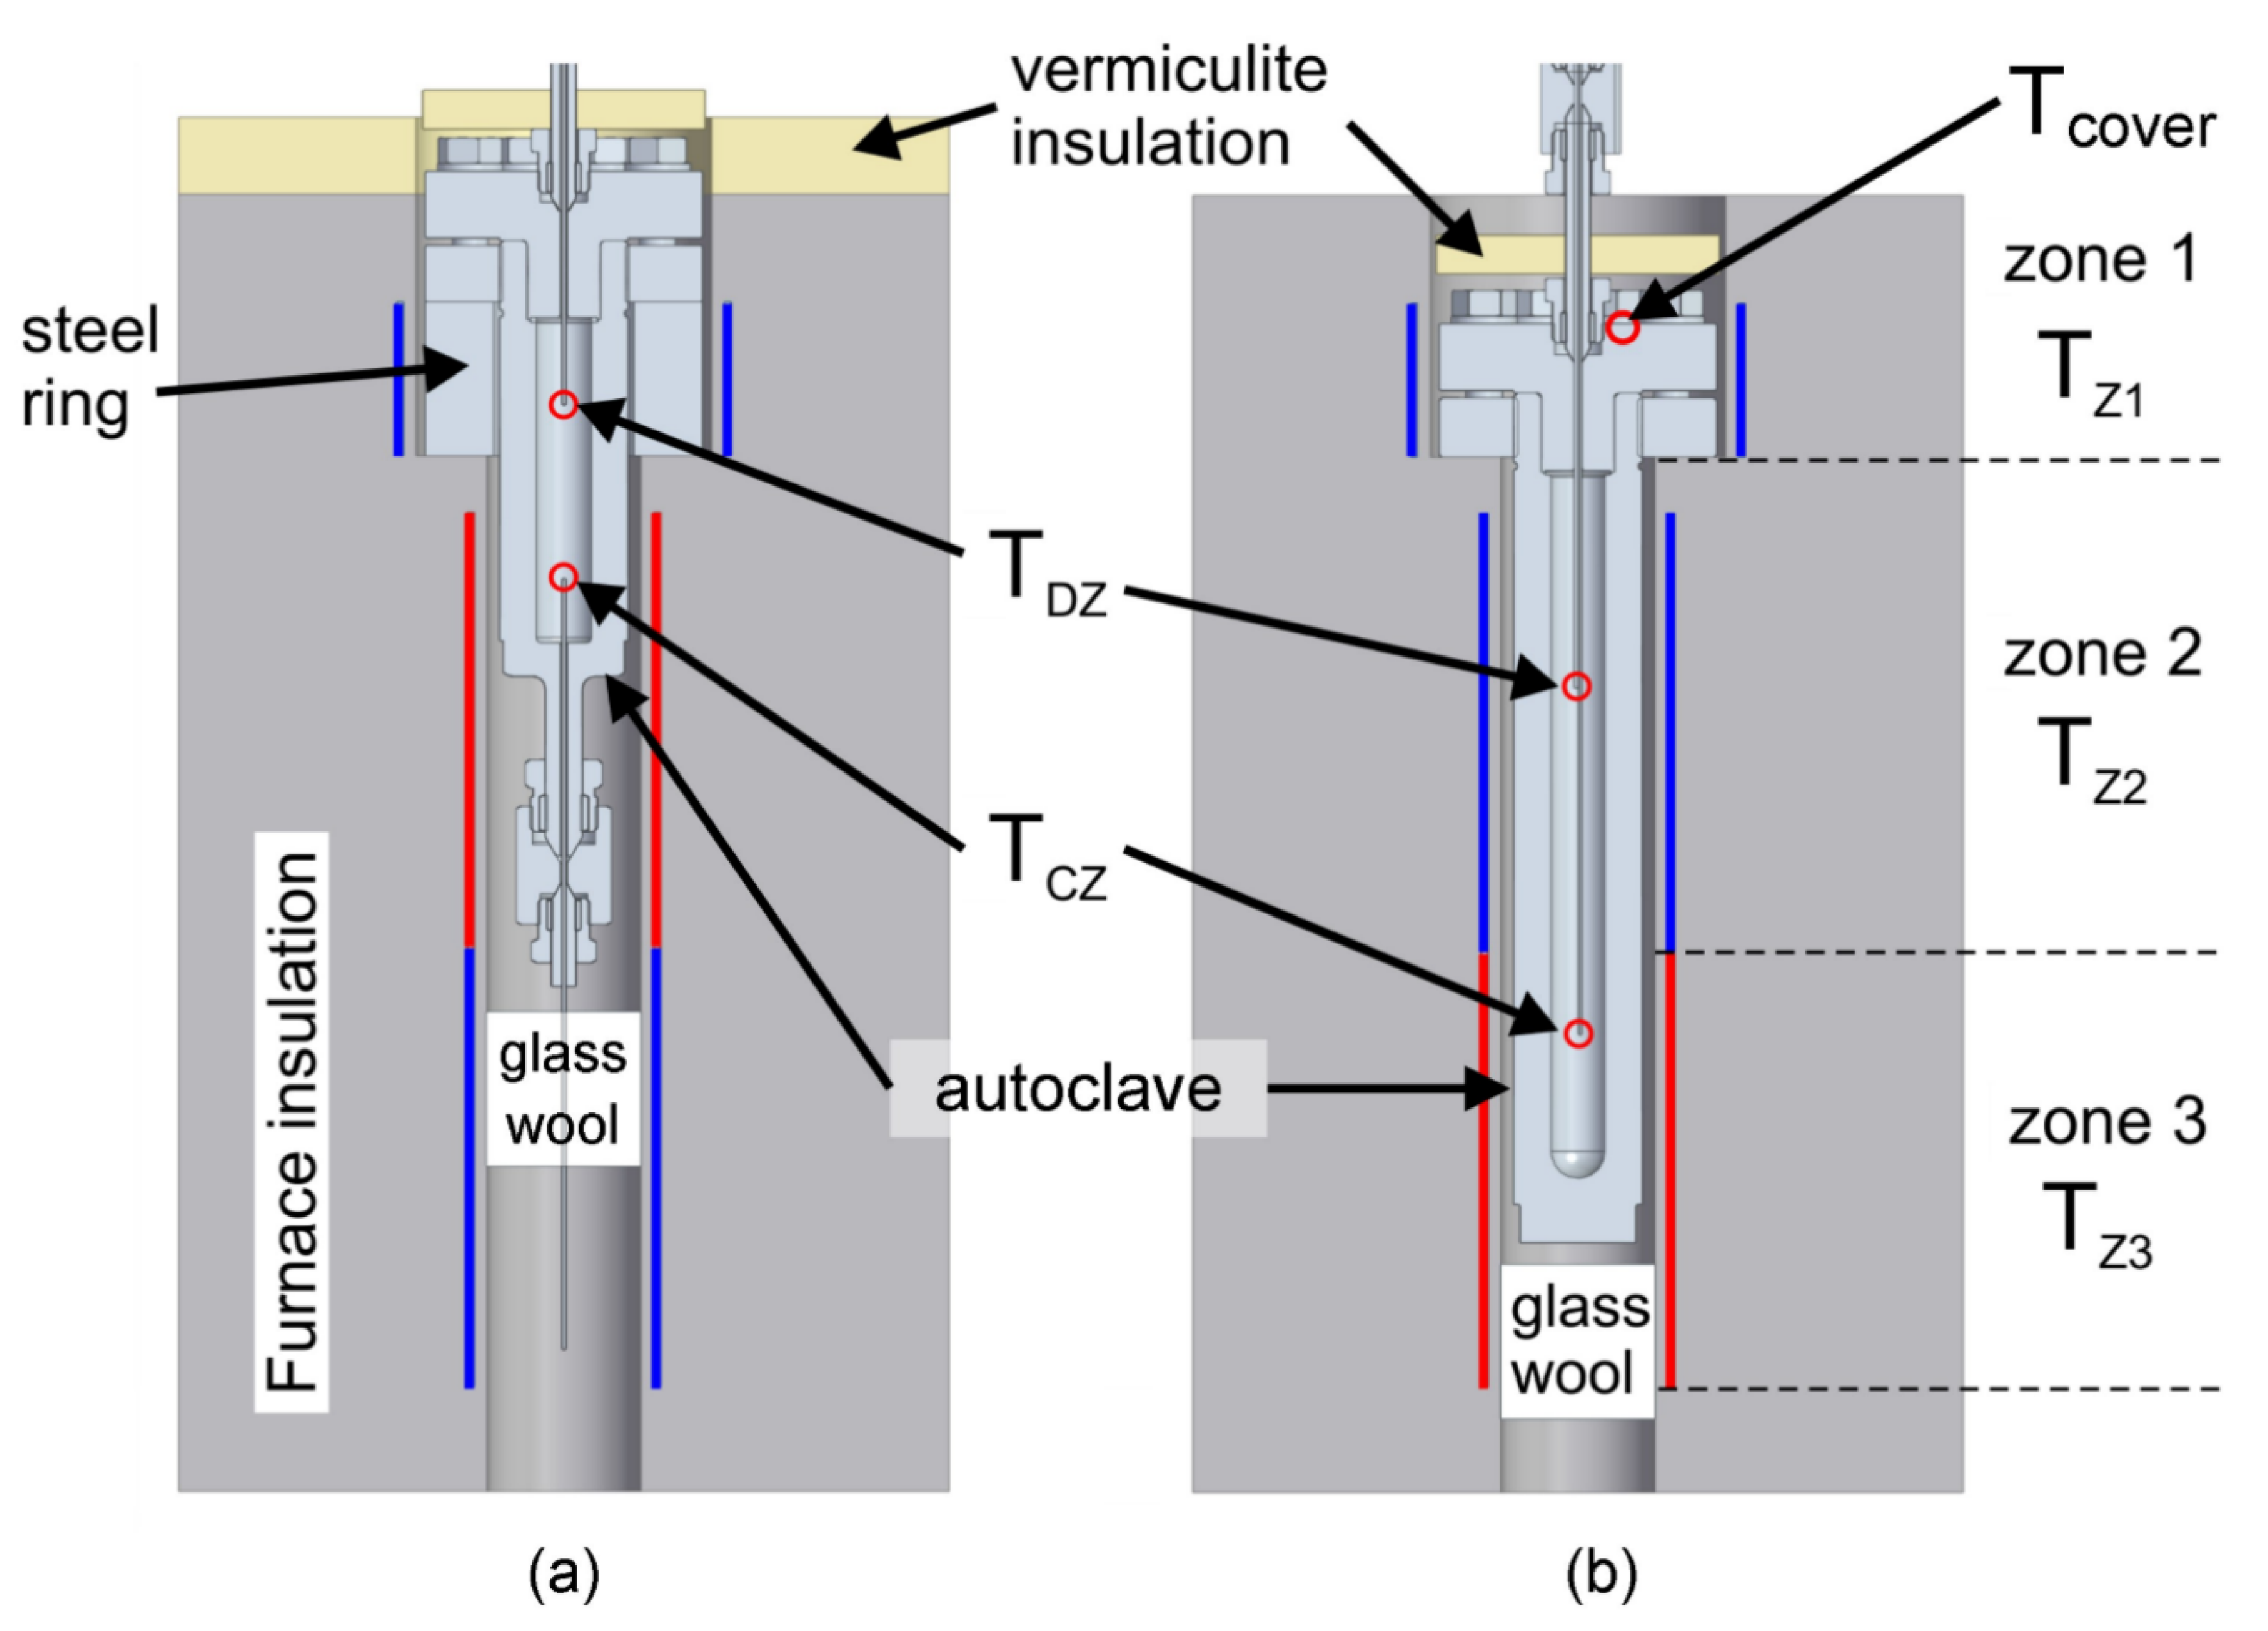
Figure 1. Experimental setups: (a) Experiment A1, A2 and A3, (b) Experiment B. For setup A, the positions of the internal temperature measurements are 34 mm below the top inner wall and 25 mm above the bottom inner wall. For setup B, the positions are 85 mm below the top inner wall and 55 mm above the bottom inner wall, respectively. Reprinted based on [21].
Crystals 10 00723 g001
Figure 2. Simulation domain used to study the effects of heat capacity and heat conduction of internal thermocouples on the measurement results. The figure has been rotated by 90°, thus, the force of gravity acts from left to right in this figure. See also Figure 1b to relate the simulation domain to the entire experimental setup.
Crystals 10 00723 g002
Figure 3. Simulation results showing the quasi-steady velocity distribution, which was used as initial values for the calculation to estimate thermocouple response, shown in Figure 5. The direction of gravity is from left to right. See Figure 2 for explanatory details of the simulation domain.
Crystals 10 00723 g003
Figure 4. Simulation results showing the quasi-steady temperature distribution, which was used as initial values for the calculation to estimate thermocouple response, shown in Figure 5. The direction of gravity is from left to right. See Figure 2 for explanatory details of the simulation domain.
Crystals 10 00723 g004
Figure 5. Simulation results for the temperature at the location of the thermocouple junction. (a) Quasi-steady temperature distribution along the thermocouple (from the outer wall of the autoclave head to 25 mm beyond the tip of the thermocouple), (b) Temperature change at the thermocouple junction after a jump in temperature of the in-flowing fluid (time scale ranges from temperature jump to the re-establishing of a quasi-steady state).
Crystals 10 00723 g005
Figure 6. Internal temperature data recorded with a time resolution of 10 ms at quasi-steady state during experiment B for dissolution zone (top) and crystallization zone (bottom).
Crystals 10 00723 g006
Figure 7. Temperature data of experiment A1 (air) over time. For an illustration of the locations of measurement see Figure 1. The value ∆Tinternal refers to the temperature difference between the two internal temperature measurements. Reprinted from [21].
Crystals 10 00723 g007
Figure 8. Temperature and pressure data of experiment B over time. The width of temperature fluctuations is given as a plus-/minus-range that follows the average value. For an illustration of the locations of measurement see Figure 1. Reprinted from [21].
Crystals 10 00723 g008
Figure 9. Temperature ramp up part of experiment B1. The features in the internal temperature charts correspond to: ① liquid–gas phase boundary of sub-critical ammonia reaches the measurement tip of the upper internal thermocouple, ② liquid–gas phase boundary reaches the top inner wall, ③ the mineralizer precursor NaN3 decomposes. Note also that the fluctuations of fluid temperatures develop gradually as the temperature gradient between the two points of measurement increases. For an illustration of the locations of measurement see Figure 1. Critical parameters of NH3 are also given, showing that the described events are not related to the critical point. Reprinted from [21].
Crystals 10 00723 g009
Figure 10. Close-up showing details of the sudden decomposition of NaN3 (event ③ in Figure 9). Note the increase in the bandwidth of temperature fluctuations after azide decomposition.
Crystals 10 00723 g010
Figure 11. Internal temperature and pressure over time in the cool-down part of a solubility experiment using an optical cell as described in [19,20,41]; (a) Overview; the geometry of the reaction chamber and the position of measurement (at the tip of the thermocouple shown in green) are illustrated in the inset. Event ① most likely represents the phase transition of the NH3-N2-H2 mixture from supercritical to subcritical state; (b) Close-up showing event ②, which corresponds to a change in thermal boundary conditions due to removal of the heating sleeve. Reprinted from [21].
Crystals 10 00723 g011
Table 1. Geometrical parameters of the autoclaves used.
Autoclave TypeInner Diameter/mmInner Length/mmAspect Ratio/LInner Volume/mLWall Thickness/mm
A21.51245.847.214.3
B21.027513.195.314.5
Table 2. Experimental parameters of experiments. Two thermocouples were placed in the fluid as shown in Figure 1. All experiments except for A3 were conducted without any baffle. In experiment A3, a baffle was used. In experiment A1, the autoclave was not hermetically sealed, thus the medium was air at atmospheric pressure. The concentration of the mineralizer is denoted as cmin, whereas cGaN,dissolved refers to the dissolved amount of GaN based on gravimetric evaluation.
ExperimentA1A2A3B1
Autoclave type 2AAAB
Mineralizer 2NoneNaN3NaN3NaN3
cmin/(mmol/mL) 2n.a.1.001.001.14
cGaN,dissolved/(mmol/mL) 2n.a.1.0314.798.80
Fluid 2Air 4Ammonia 3Ammonia 3Ammonia 3
ρ/(kg/m3) 1,20.504365416409
cp/(J/(kg·K))1075.34183.54110.94121.2
ν/(m2/s)6.80 × 10−51.297 × 10−71.271 × 10−71.265 × 10−7
λ/(W/(m·K))0.05150.24340.28550.2792
1 The given density of ammonia refers to the density of the supercritical fluid and was determined based on the initial fill volume and fill density. 2 Experimental data based on [21] and references therein. 3 Fluid data taken from [22] for a temperature of 426.0 °C. 4 Fluid data for air are for ambient pressure at 426 °C and based on [23], except for kinematic viscosity ν and thermal conductivity λ which are taken from [24].
Table 3. Material properties of Inconel 718 used in the simulation of thermocouple temperature change. Data from [27] were used for density, specific heat capacity and thermal conductivity, taking the values for 600 °C for the latter two, for which temperature-dependent data were available. The emissivity is an estimate based on [28] accounting for prolonged exposure to oxygen at temperatures around 600 °C. Exposure to ammonothermal reaction media likely has similar effects, given the visual appearance of used thermocouples.
Density ρ/(kg/m3)Specific Heat Capacity cp/(J/(kg∙K))Thermal Conductivity k/(W/(m∙K))Emissivity ε/(1)
8260.0533.0020.600.8
Table 4. Dimensionless numbers characterizing the conducted experiments. For experimental parameters of the experiments see Table 2.
ExperimentA1 (Air)A2 (NH3,sc)A3 (NH3,sc)B (NH3,sc)
Grashof3.83 × 1033.54 × 1073.77 × 1077.45 × 107
Prantl7.16 × 10−18.14 × 10−17.61 × 10−17.64 × 10⁻¹
Rayleigh2.74 × 1032.88 × 1072.87 × 1075.69 × 107
Table 5. Summary of experimentally determined temperature distributions. The amplitude of temperature fluctuations is given as a plus-/-minus-range that follows the average value. For an illustration of the locations of measurement see Figure 1. Data mostly taken from [21]. Tcover refers to the temperature measured by a thermocouple placed in a relief hole in the top part of the autoclave close to the connection to the head assembly.
ExperimentTZ1/°C
Set/
Actual
TZ2/°C
Set/
Actual
TZ3/°C
Set/
Actual
Tcover/°CTCZ,in situ/°CTDZ,in situ/°CTinternal/K/cm
A1390/390460/460-/219-508.3 ± 0.1448.9 ± 0.19.1 ± 0.1
A2390/390460/460-/244-477.4 ± 3.1468.9 ± 4.01.3 ± 1.1
A3390/390460/460-/318-482.2 ± 1.9461.0 ± 1.83.3 ± 0.6
B-/261390/390460/460376.5 ± 0.15489.7 ± 7.6461.3 ± 8.62.1 ± 1.2