Article

CO2 Capture in A Bubble-Column Scrubber Using MEA/CaCl2/H2O Solution—Absorption and Precipitation

Department of Chemical and Materials Engineering, Lunghwa University of Science and Technology, Taoyuan 33306, Taiwan
*
Author to whom correspondence should be addressed.
Crystals 2020, 10(8), 694; https://doi.org/10.3390/cryst10080694
Submission received: 15 June 2020 / Revised: 1 August 2020 / Accepted: 7 August 2020 / Published: 11 August 2020
(This article belongs to the Special Issue Carbonates Volume II)

Abstract

:
This study used the solvent monoethylamine (MEA)/CaCl2/H2O to investigate CO2 absorption and CaCO3 crystallization in a bubble column scrubber. The variables explored were pH, gas flow rate, gas concentration, the liquid flow rate of the solution to absorb CO2, and CaCO3 crystallization. Under a continuous mode, the solution of CaCl2 was fed continuously, and the pH dropped after CO2 absorption. To maintain the set pH value, there was an automatic input of the MEA solvent into the bubble column. In addition to maintaining the pH, the solution could also absorb CO2 and produce CaCO3 crystals, which served two purposes. The results showed that there were mainly vaterite crystals. At different pH values, the lower the pH, the higher the precipitation rate of vaterite (Fp), and vice versa. However, under different gas flow rates, the Fp decreased as the pH value increased. Additionally, the process variables also affected the absorption rate (RA) and the overall mass-transfer coefficient (KGa) generally increased with increasing pH, gas concentration, and gas flow rate. However, it slowed down under operating conditions at high pH and high gas flow rate. Finally, correlation equations for RA, KGa, and Fp were also obtained and discussed in the study.

Graphical Abstract

1. Introduction

The weather irregularity resulting from the greenhouse effect is a matter of great concern around the world. A major portion of greenhouse gases is CO2, which is mainly caused by the excessive use of fossil fuels and unchecked deforestation [1,2]. Many countries are working towards alternative energy development [3], energy-saving, and process improvement. Chemical treatment, physical treatment, and microbiological treatment are the primary technologies for disposing of the CO2 emitted from factories, and the most commonly used method used is chemical treatment [4,5]. More than 1000 factories have developed the alkanolamine processes over the past few decades, among which the monoethylamine (MEA) process has the advantages in terms of price, characteristics, and recovery, although, it still consumes energy during recovery and brings cost burdens due to the treatment of concentrated CO2 [5]. To develop an energy-saving process, new solvents [6,7,8,9,10], and new processes [11,12] have been proposed and explored to find a process with a lower regeneration energy requirement. Some of them studied the absorption kinetics of the mixed solvents [9,13,14]. Alternatively, the hot potassium carbonate process is also applied in many cases, however, solvent regeneration and reuse during recovery not only increases the cost but also causes secondary pollution [1,15]. The issue with the NaOH process is that the solvent cannot be recovered. For the processes focusing on resource recycling, the hot potassium carbonate and the NaOH processes are less effective. Hence, this research team has developed the Ca(OH)2 process for CO2 absorption, which can recover CO2 and produce CaCO3 without solvent recovery. However, due to the inability of continuous operation, the process development was limited. Eventually, the process was changed, and BaCl2/NaOH/H2O was used for CO2 absorption, which could produce BaCO3 and be operated continuously [16,17]. However, limitations still exist in solvent reuse. Previous studies showed that the CO2 absorption rate is greatly affected by pH because while an increase in pH improves the CO2 removal efficiency, it consumes more NaOH, which raises the cost. In addition, an increase in the liquid flow rate improves the yield of BaCO3, and an increase in the gas flow rate improves the CO2 removal efficiency.
To develop CO2 and for resource recycling, this team also tried to recover CO2 and produce CaCO3 by MEA/CaCl2/H2O, and tested solvent reuse. The results showed that the recovered solvent can also absorb CO2, which motivated us to develop this process. Hence, because of the advantage of the bubble column, with MEA/CaCl2/H2O as the solvent, CO2 recovery and resource recycling were carried out by continuously operating a bubble column [18,19,20,21].
The main equations for the reaction with MEA/CaCl2/H2O as the solvent are as follows [8,22]:
H2O ⇌H++OH
Ca2++OH⇌CaOH+
Ca2++CO32−⇌ CaCO30
H2CO3* ⇌H++HCO3
HCO3⇌H++CO32−
RNH2 ⇌RNH3++OH
2RNH2+H2CO3*⇌RNHCOO+RNH3++H2O
Ca2++HCO3⇌CaHCO3+
CaCO3(s)⇌Ca2++CO32−
Equations (1), (4) and (5) present the change in the hydrolysis of the carbonate ion, and Equations (6), (7) present the reaction of using MEA solution for CO2 absorption. RNCOO(aq) is hydrolyzed into HCO3 and RNH2 after production and then reacts with Ca2+ to precipitate CaCO3 because HCO3 can be further dissociated to CO32−. MEA exhibits excellent absorption efficiency, therefore, it has been adopted in several studies.
In the previous studies, to understand the relationship between absorption and crystallization in this system, the quasi-steady operation and shell balance were adopted to obtain the equation of absorption rate, and a two-film model was used to describe the mass transfer of CO2 in the absorption solvent to determine the overall mass transfer coefficient [16,23]. Hence, the results of this study were compared with those of the previous studies in terms of the above-mentioned theory to understand the commercial value of this process. Further, the yield of the recovered solid was determined by the liquid flow rate and suspension concentration, and the relationship between absorption rate and precipitation rate was used to obtain the design parameters of the absorber.
As a result, with MEA/CaCl2/H2O as the absorbent, MEA as the controller of the pH of the system, CaCl2 as the precipitant, and pH value, CO2 concentration and CO2 flow rate as the variables, this study aimed to investigate the effects of variables on the absorption rate, mass transfer coefficient, and precipitation rate by CO2 absorption experiment in the bubble column, so as to provide references for the design of such absorbers.

2. Absorption Rate and Mass Transfer Coefficient
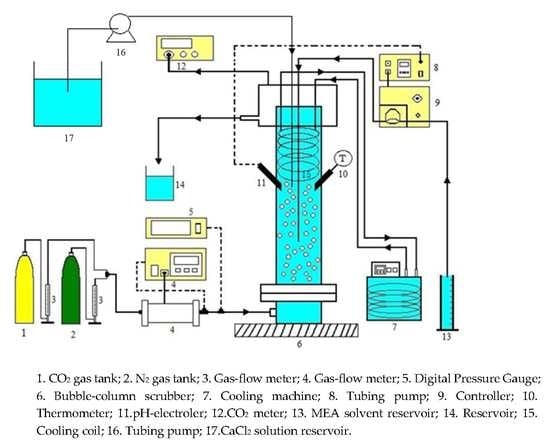
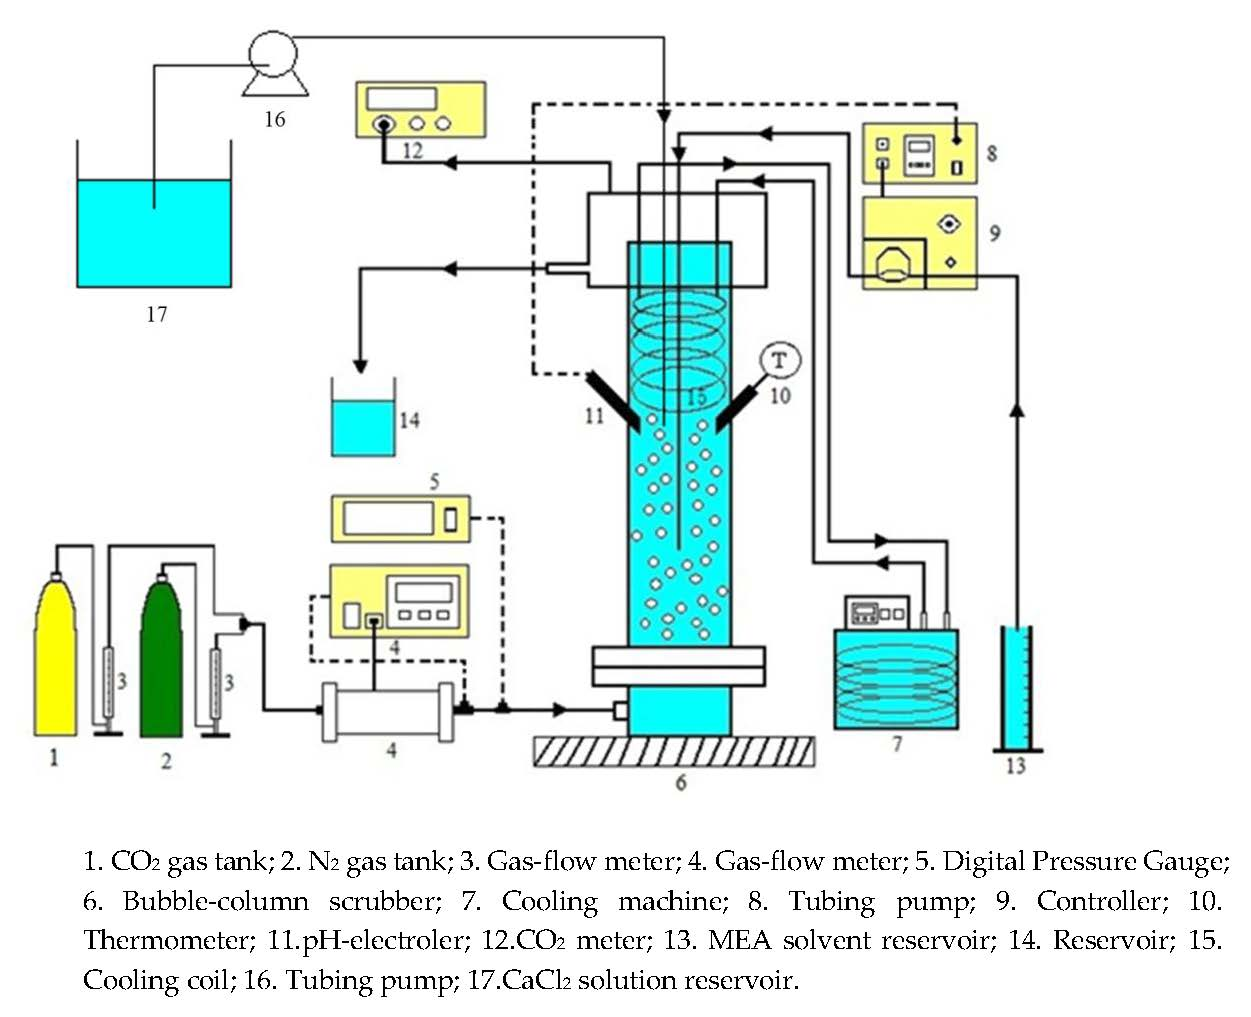
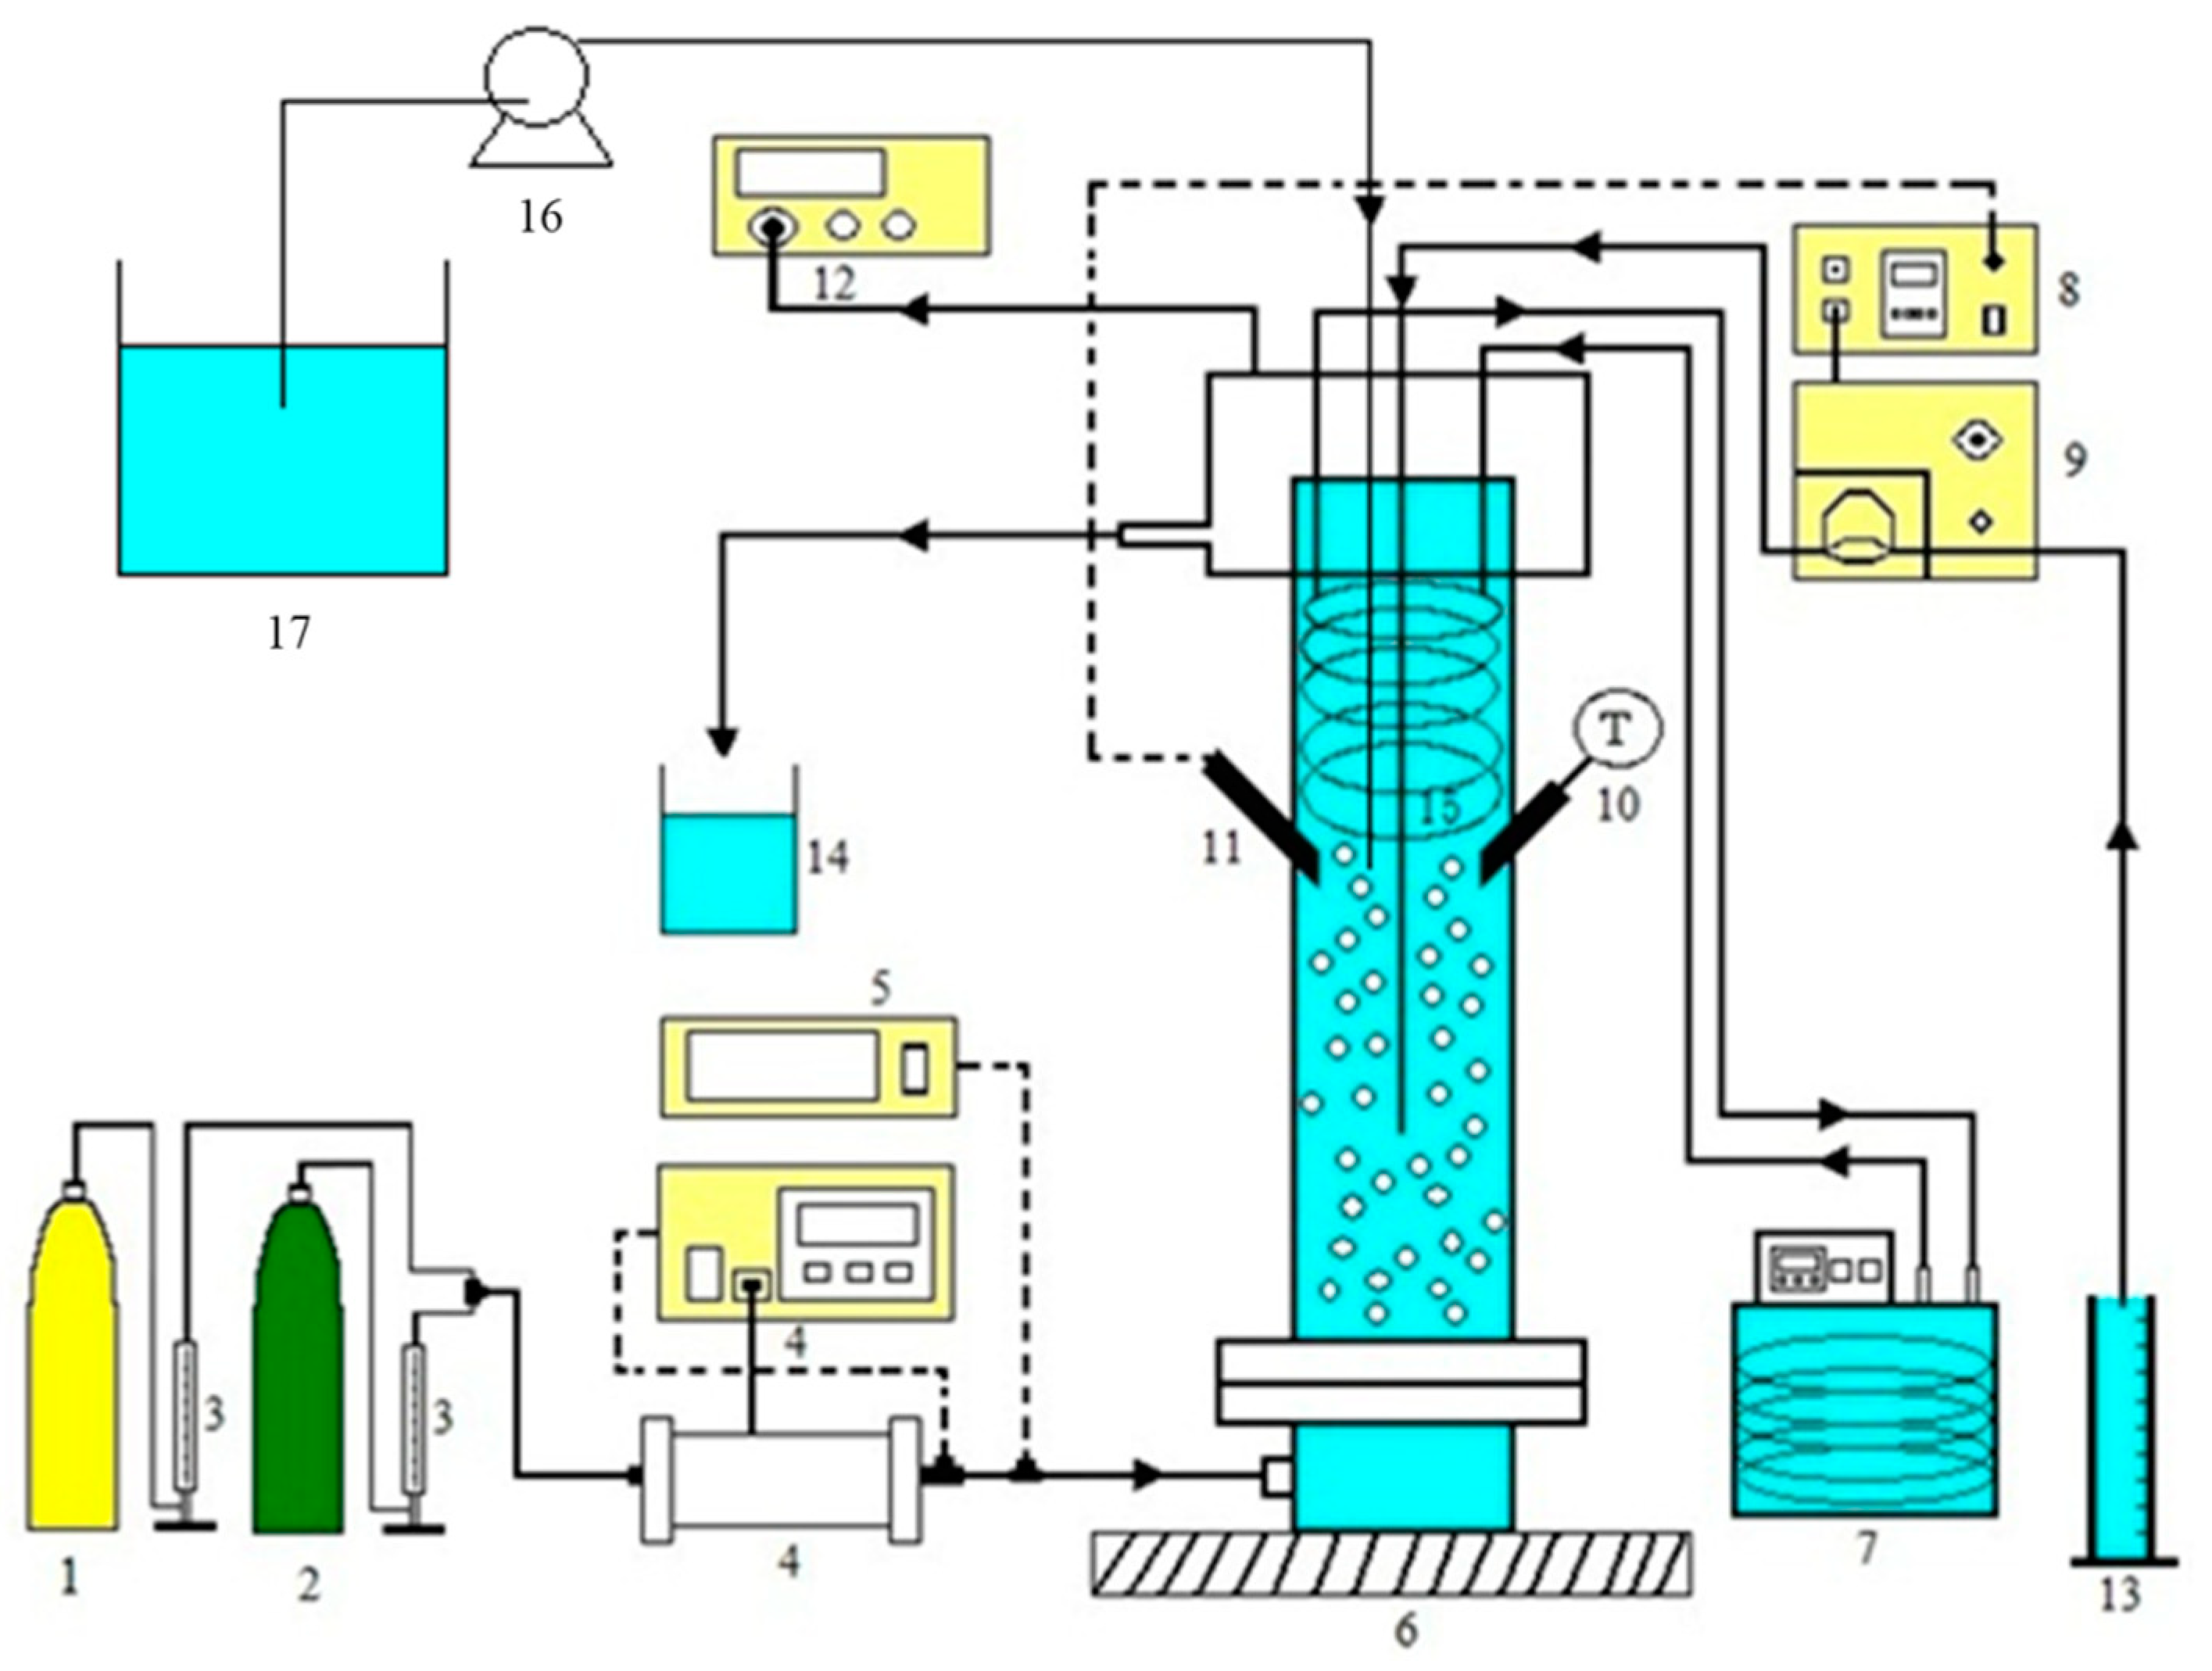
The gases A (CO2) and B (N2) were mixed and added to the bubble column, and the calcium chloride aqueous solution and MEA solvent were separately imported into the bubble column. At the beginning of the experiment, the calcium chloride solution was continuously fed at 50 mL/min and the MEA was fed to adjust the decline of pH value due to CO2 absorption to keep it within the set range. MEA balanced pH value and absorbed the CO2. The absorbed CO2 decomposed to CO32− in the solution and quickly reacted with Ca2+ in the solution to form CaCO3 precipitation. CO2 was continuously fed and MEA was fed to maintain absorption, finally, the CO2 at the outlet was steady, indicating that the system was now stable. The mass balance at a steady state of CO2 is shown below [16]:
F A 1 F A 2 R A V L = 0
where, FA1 and FA2, respectively, denote the molar flow rates at the CO2 inlet and outlet, VL represents the liquid volume in the bubble column and RA represents the CO2 absorption rate, which can be obtained by the following equation:
R A = F A 1 V L [ 1 ( 1 y 1 y 1 ) ( y 2 1 y 2 ) ]
where, y1 and y2, respectively, denote the CO2 concentrations at the inlet and outlet. Once the absorption rate is obtained, the overall mass transfer coefficient can be obtained by the following equation:
K G a = R A [ C g H C L ] a v
where, H is Henry’s law constant and a function of temperature and ionic strength. In Equation (12), because of the change in the position of the gas as it passes through the bubble column, Cg-HCL is substituted by the average value of the inlet and outlet, thus, the calculated overall mass transfer coefficient is the average value [23]. However, H-value was found to be 0.39–0.78 [24] and CO2 in the liquid phase was less than 10−6 M. Due to this, the value HCL was less than 10−6 [25], which was much smaller than Cg. Therefore, the HCL value can be negligible compared to Cg.

3. Experiment

The major equipment used in this experiment is shown in Figure 1, including the bubble column, digital pressure indicator, heater, CO2 meter, condenser, pH controller, gas mixer, N2 cylinder, CO2 cylinder, and gas flow-meter. The reagents used in this experiment are calcium chloride, MEA, CO2, and N2 gas.
Before the experiment, the pH electrode was calibrated with a standard buffer solution of pH 4.0 and 7.0 to accurately observe the change in pH. CO2 and N2 cylinders were opened to adjust the flow of CO2 and N2 and the gas temperature at the inlet until the CO2 concentration and temperature of the gas mixer reached the set values. During the experiment, the prepared solution was added into the bubble column, and the gas in the gas mixer was introduced into the solution in the bubble column. To begin the operation, the condenser was opened and the calcium chloride solution was continuously fed at 50 mL/min and the MEA was fed to adjust the decline of pH after absorption to keep it within the set range. On the other hand, CO2 could be absorbed. The time, pH value, the test value of the CO2 meter, and MEA feeding volume were recorded during the experiment, and about 5 mL of suspension was extracted in a fixed time. After the suspension was filtered, two additional 5 mL samples of the suspension were taken at 40 and 50 min to measure the calcium ion concentration and total carbonate ion concentration by atomic absorption (AA) (GBC Scientific Equipment, GBC 932 Plus, Melbourne, Australia) At the end of the experiment, an additional 2 mL of suspension was taken and placed in a container used for particle size measurement to measure the size of CaCO₃ particles by using a laser particle size analyzer (Galai CIS-50, Or Akiva, Isreal).
After the experiment, the suspension reacted in the bubble column was filtered, and the obtained solid was dried using a hot air drier. Finally, the obtained powder was weighed, and part of it was observed by a SEM (Jeol, JSM-6500F, Tokyo, Japan) for its morphology, while the other part was observed by XRD(Rigaku, D/MAX-2200/PC, Tokyo, Japan)components and construction. Table 1 shows the operating conditions of the experiment, with the CO2 concentration between 10 and 30%, the gas flow rate between 2 and 8 L/min, and the pH value between 9 and 11. Table 1 was the operating conditions conducted in this study.

4. Results and Discussions

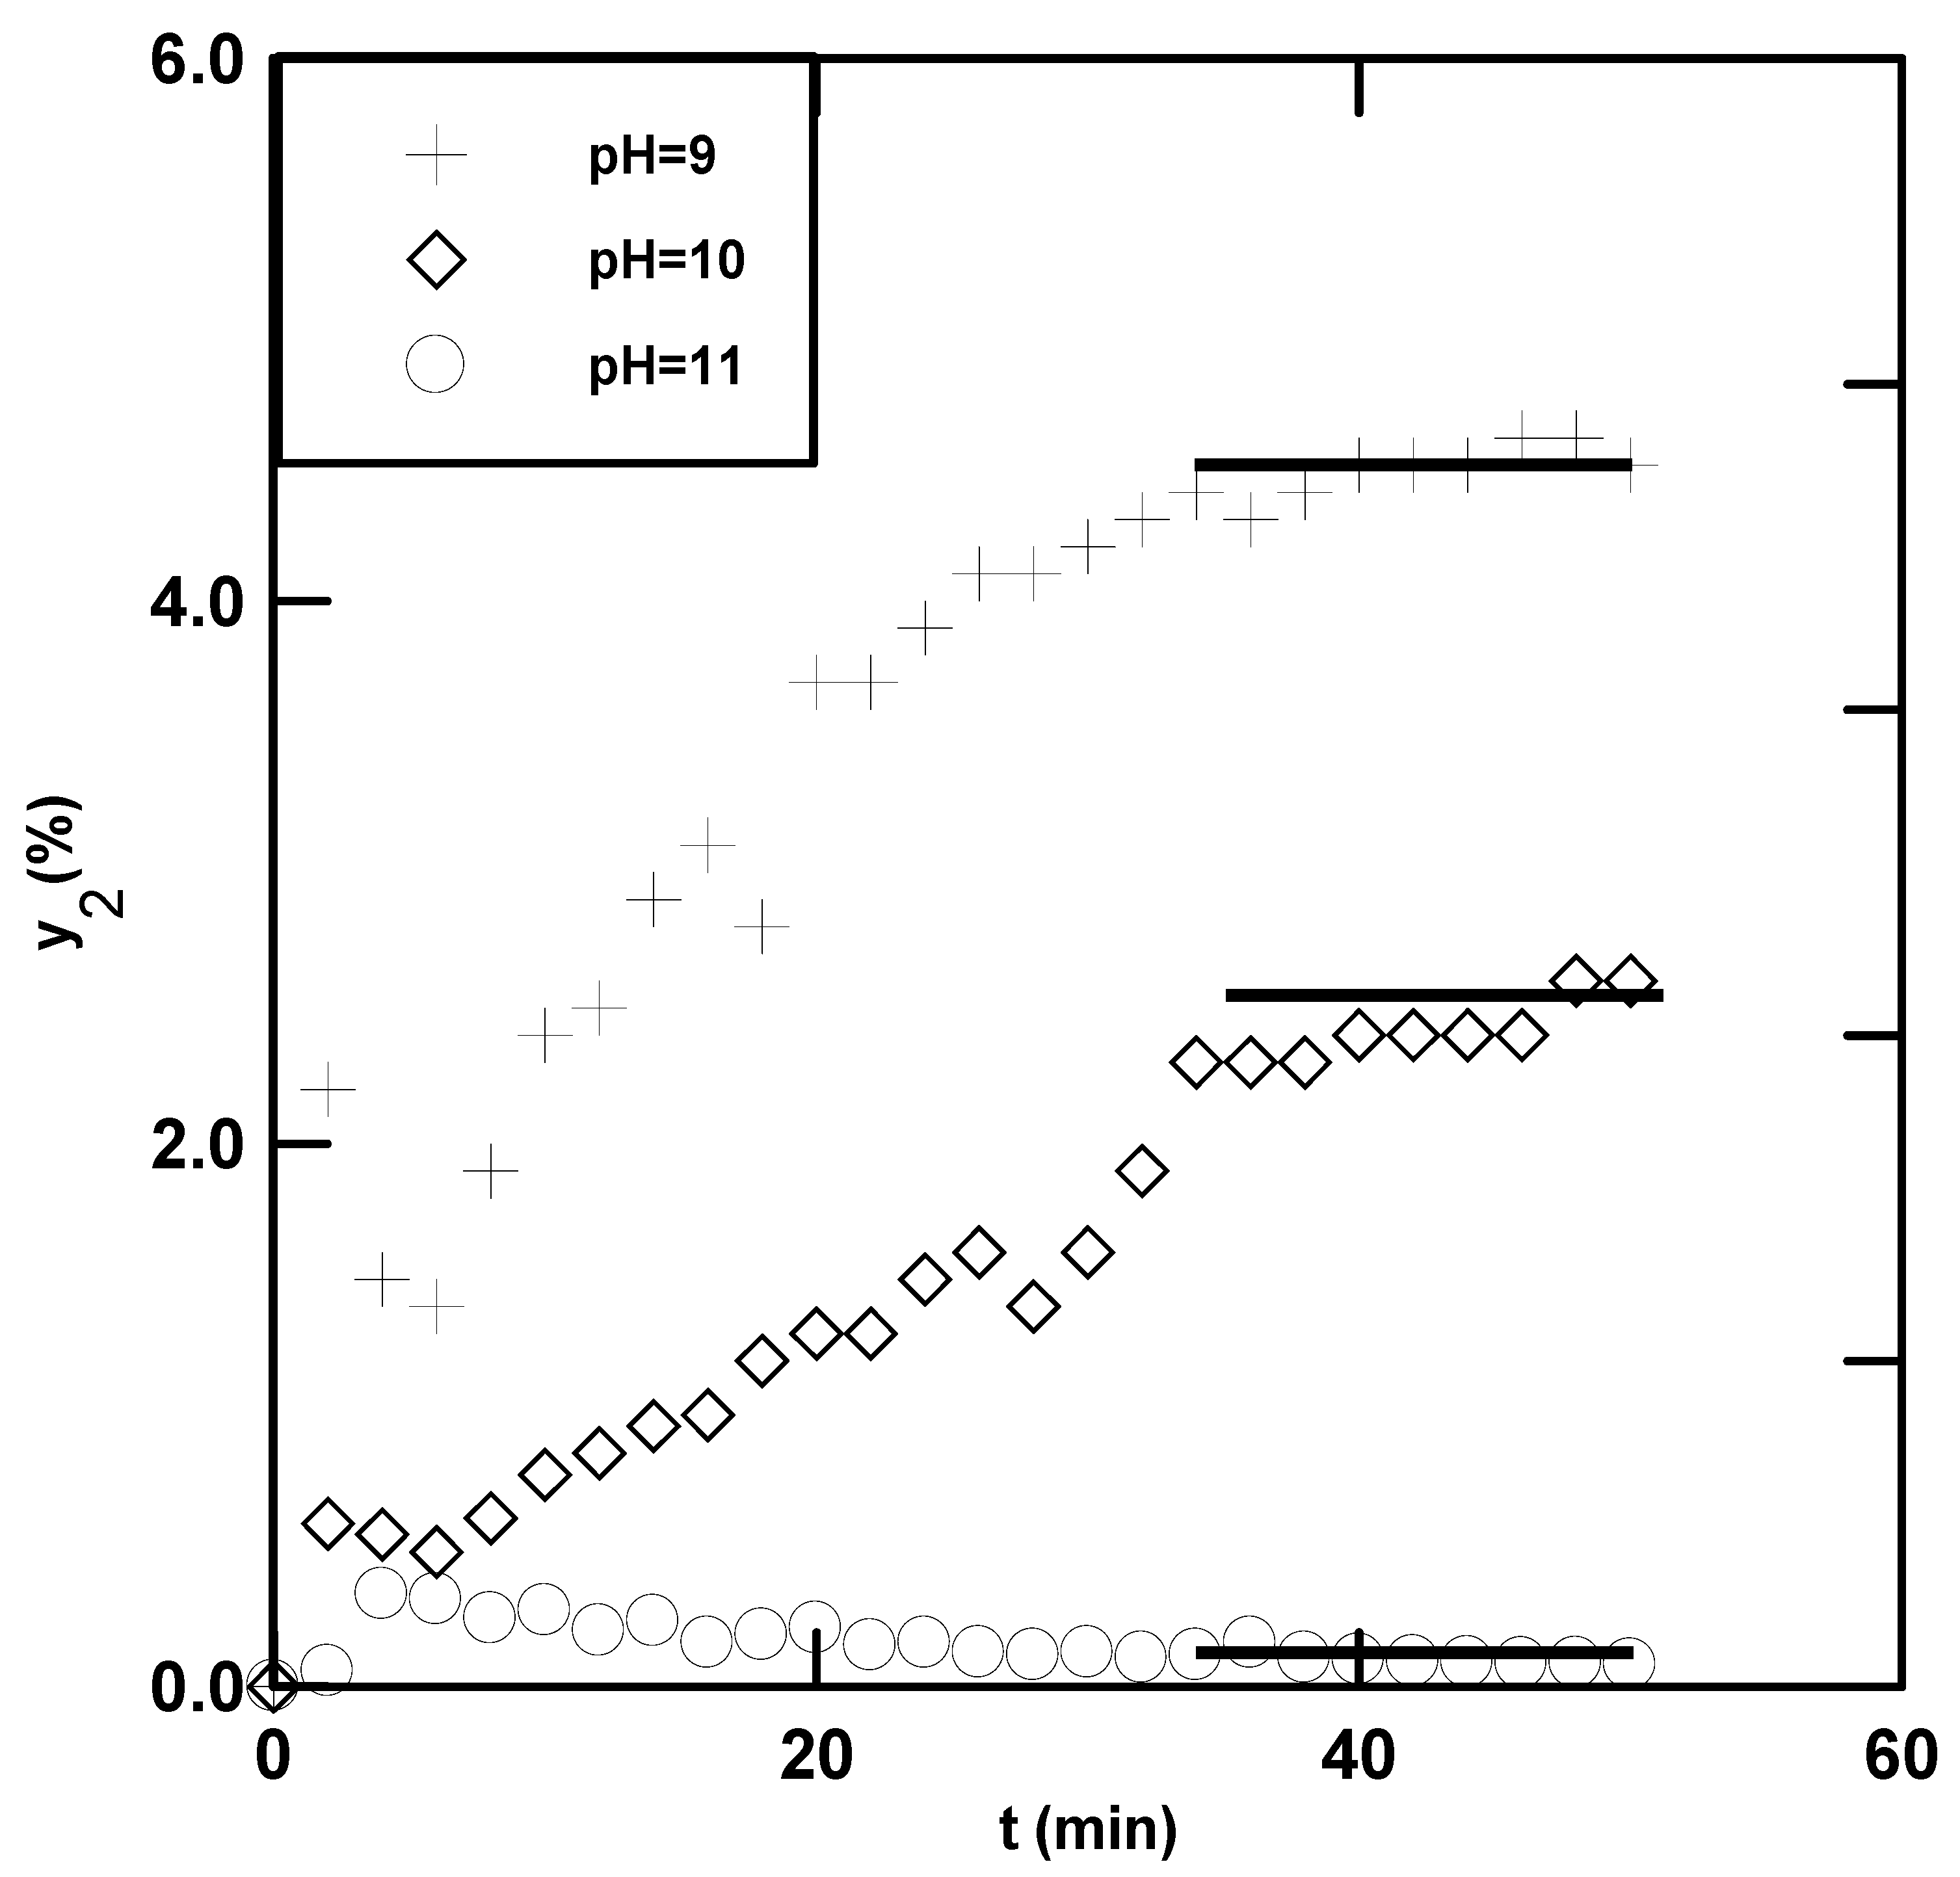
4.1. Experimental Data

Figure 2 shows the CO2 concentrations at the outlet measured at Qg = 4 L/min and different pH values, indicating that, at pH 9 and 10, the CO2 concentration at the outlet declined in the initial stage of the experiment, then began to rise nearly 5 min later, and reached a steady state at nearly 40 min and 34 min, respectively. At pH 11, the CO2 concentration at the outlet first rose and then began to decline nearly 2 min later until it reached a steady state at about 20 min. After the steady state was reached, the absorption rate, mass transfer coefficient, mean residence time, and precipitation rate could be obtained by Equations (10) and (11), by which the precipitation rate was calculated by multiplying the slurry density by the liquid flow-rate and dividing the result by the liquid volume; the mean particle size was measured by the particle size analyzer. As shown in Table 2, the obtained absorption rate was between 6.26 × 10⁻⁶ and 3.80 × 10⁻⁴ mol/s×L, the mass transfer coefficient was in the range between 1.83 × 10⁻³ and 5.33 × 10⁻² 1/s, the precipitation rate is was in the range of 0.53 × 10⁻⁵ to 26.08 × 10⁻⁵ mol/s×L, and the particle size was in the range of 0.72 to 1.83 μm. Further, the absorption efficiency was found to be in the range of 32.8–100%.

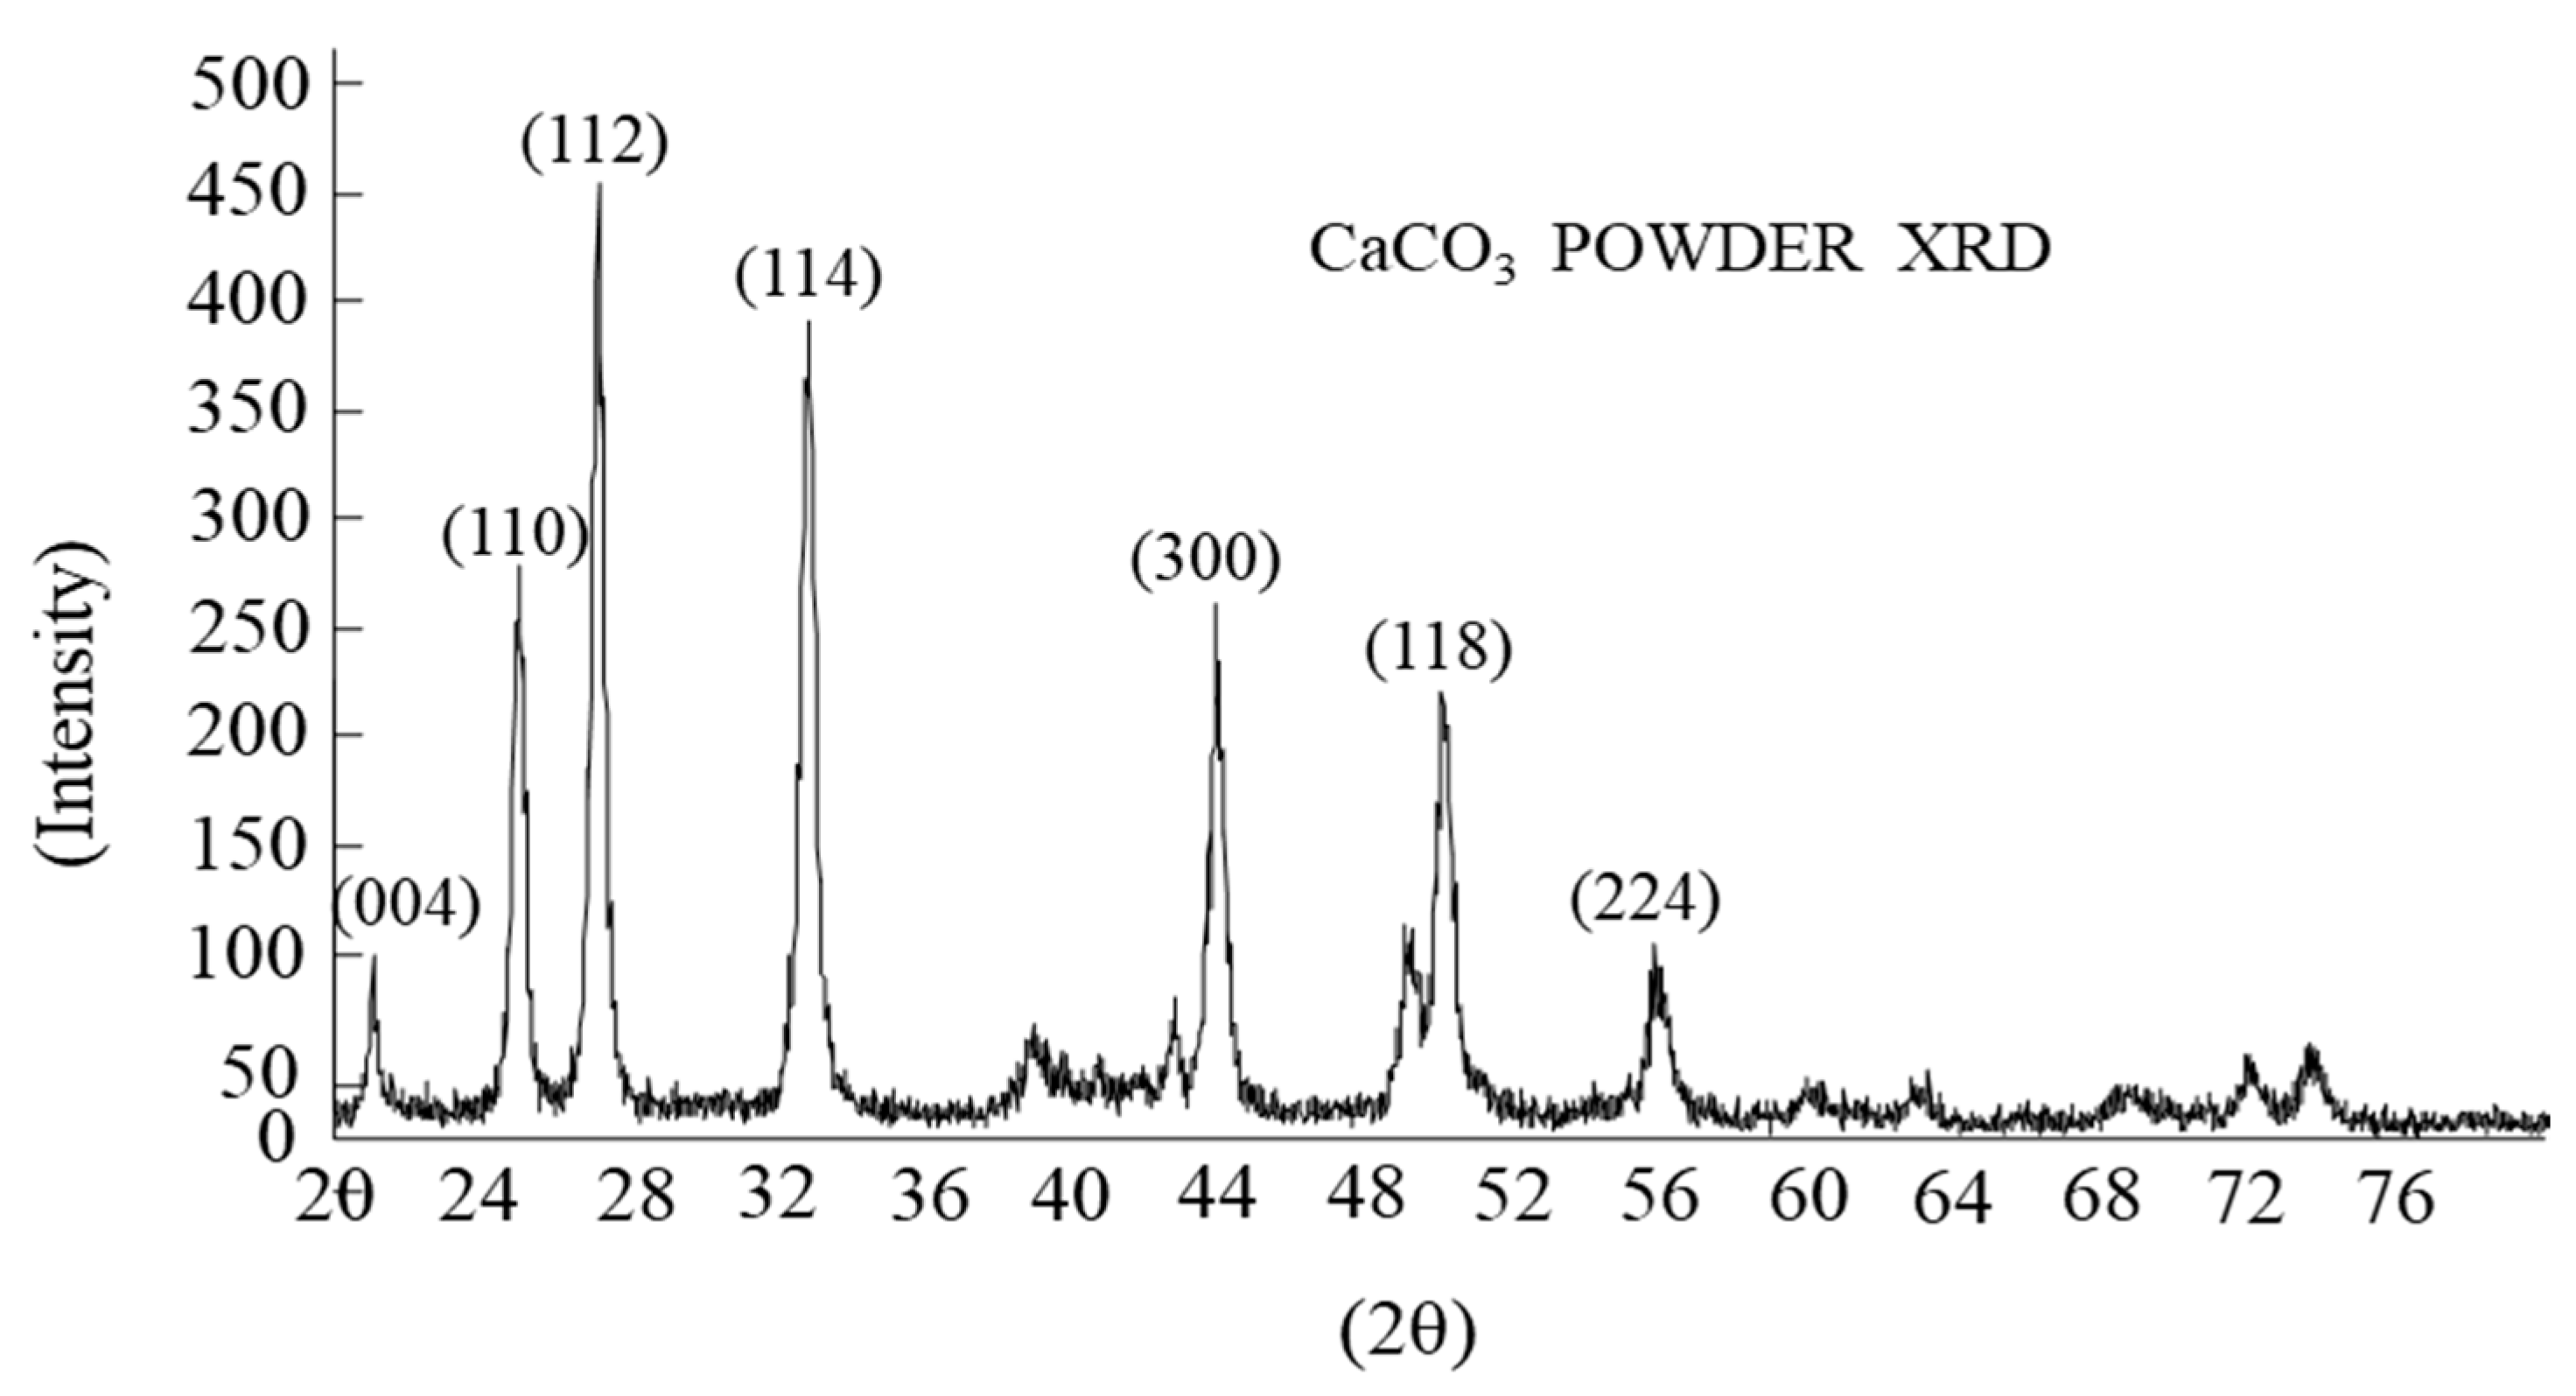
4.2. Identification of Solid Components

The XRD analysis (Figure 3) shows the comparison with the standard CaCO3 peak, and the results shows that the major peak intensities, (110), (112), (114), (300), (118), and position of the sample obtained from the experiment were consistent with those of the vaterites as reported earlier [26,27,28], indicating that the obtained CaCO₃ was mainly vaterite.

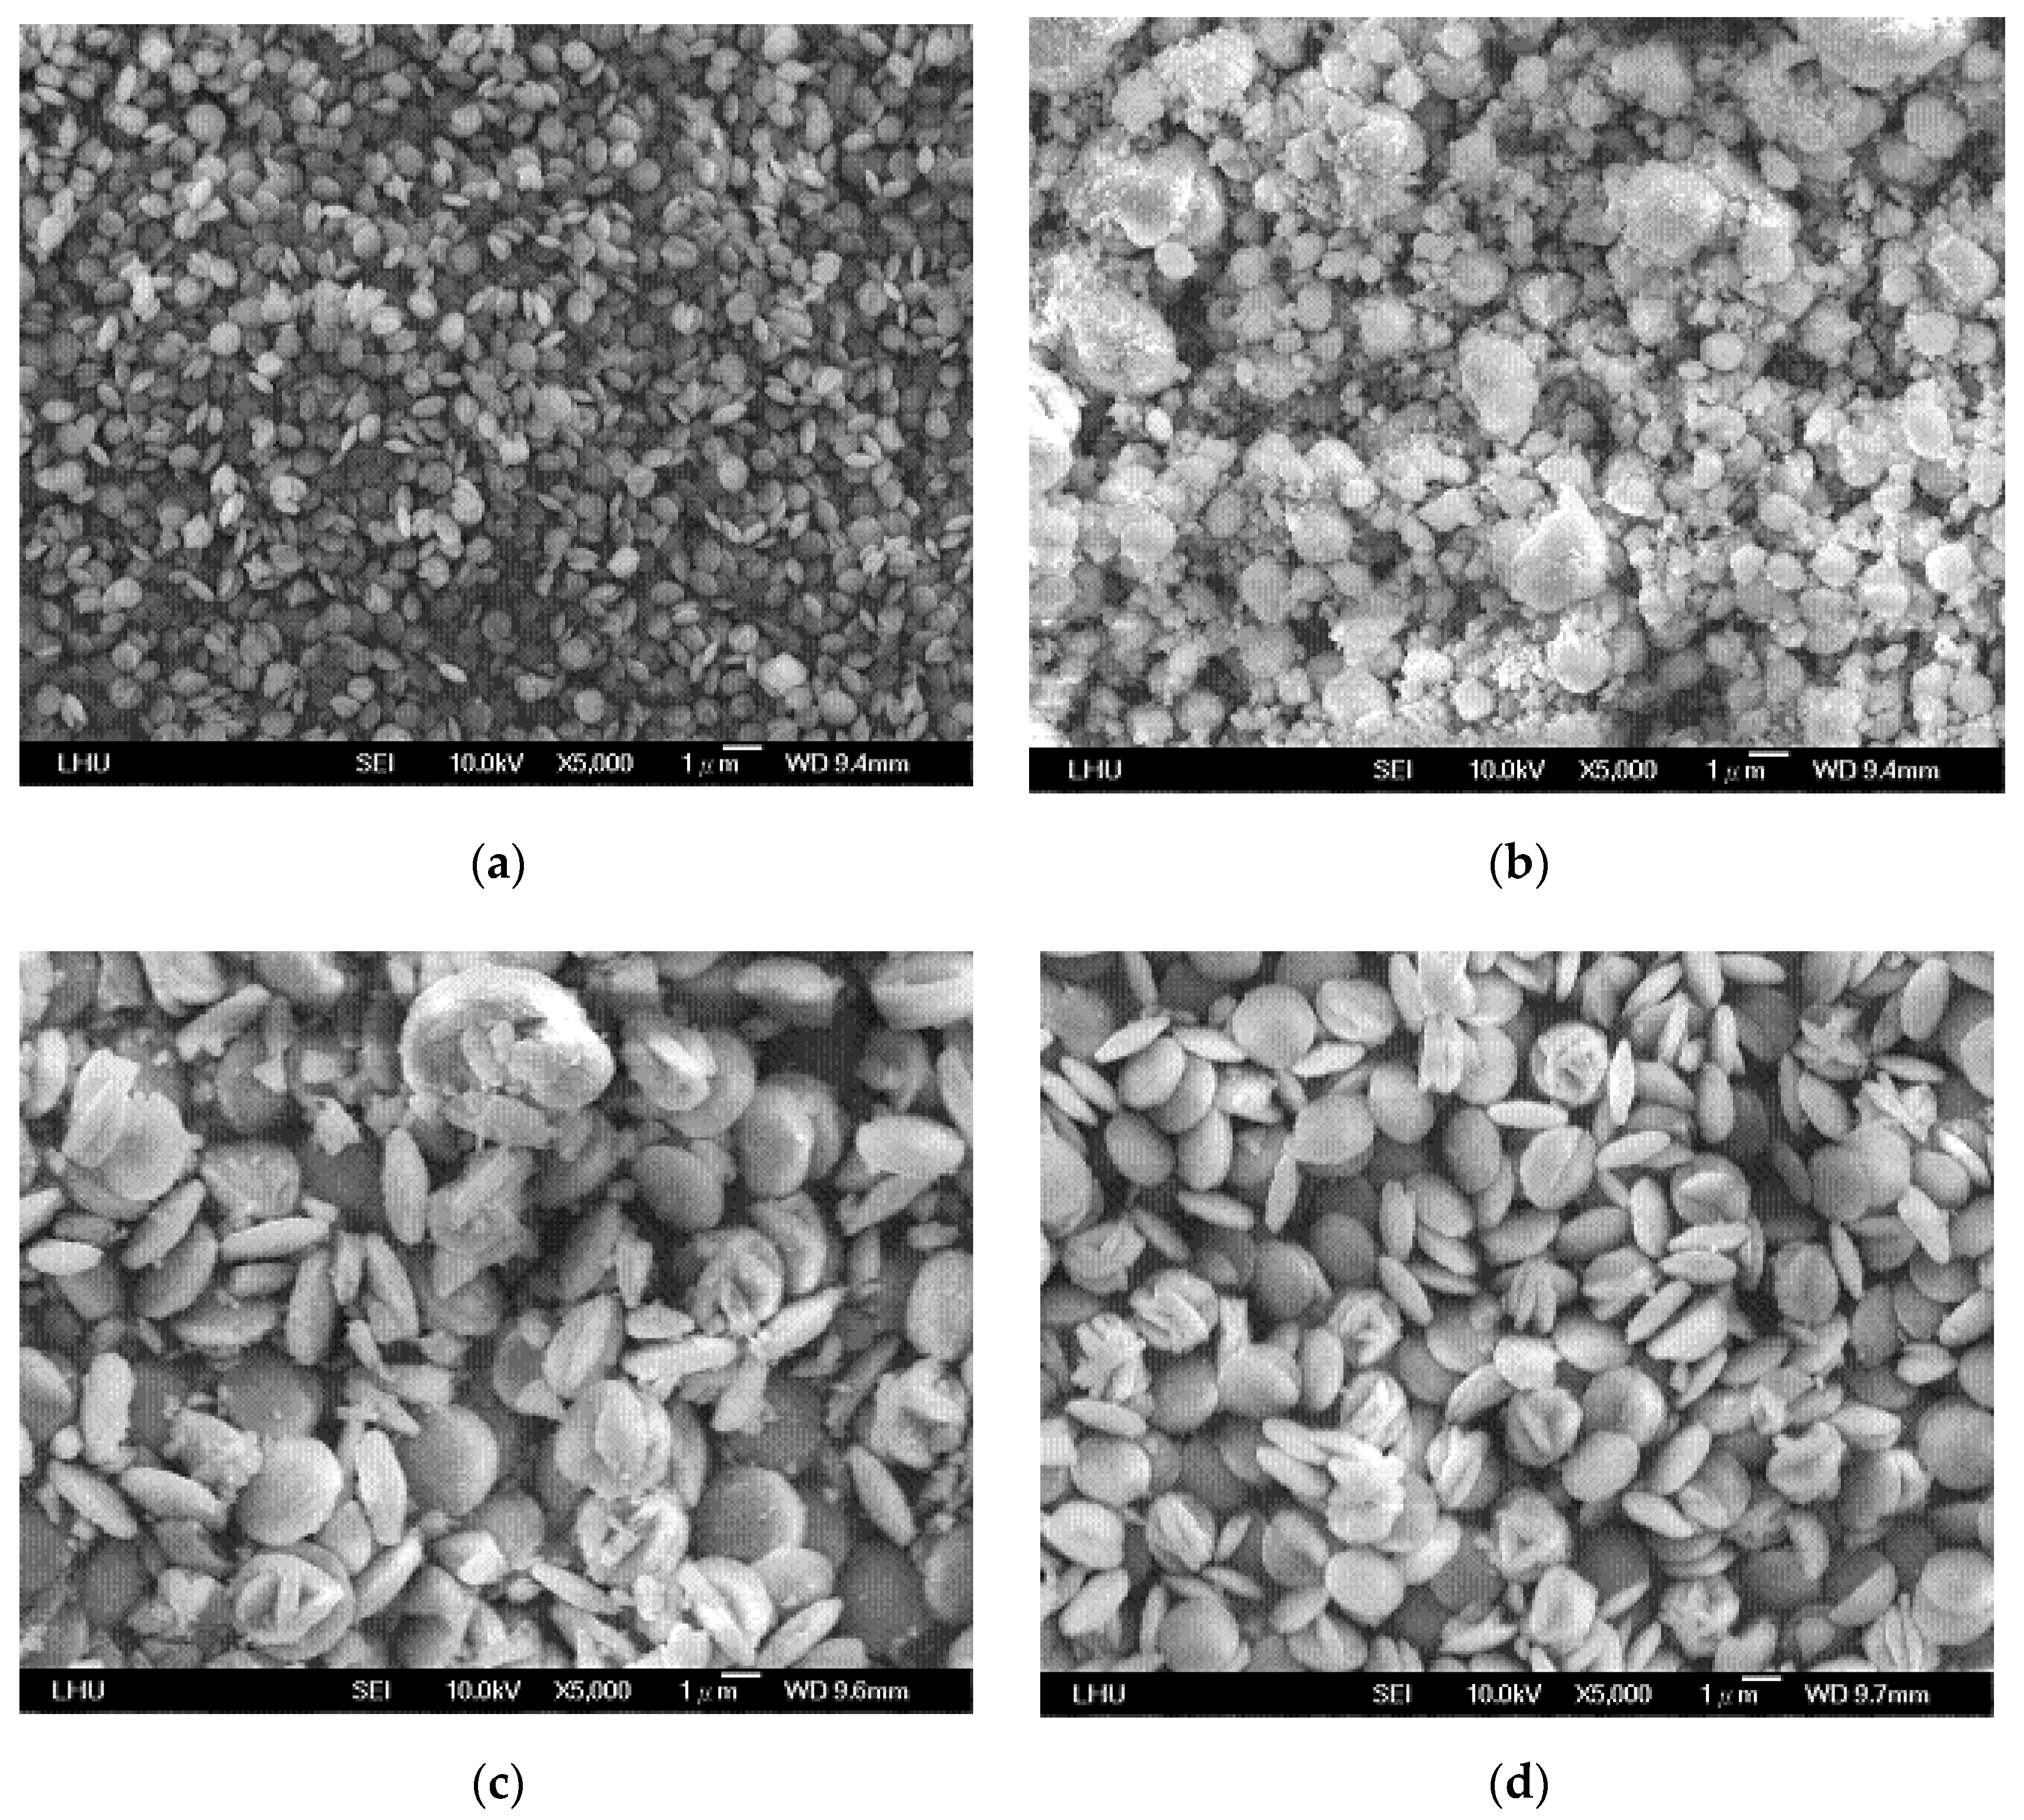
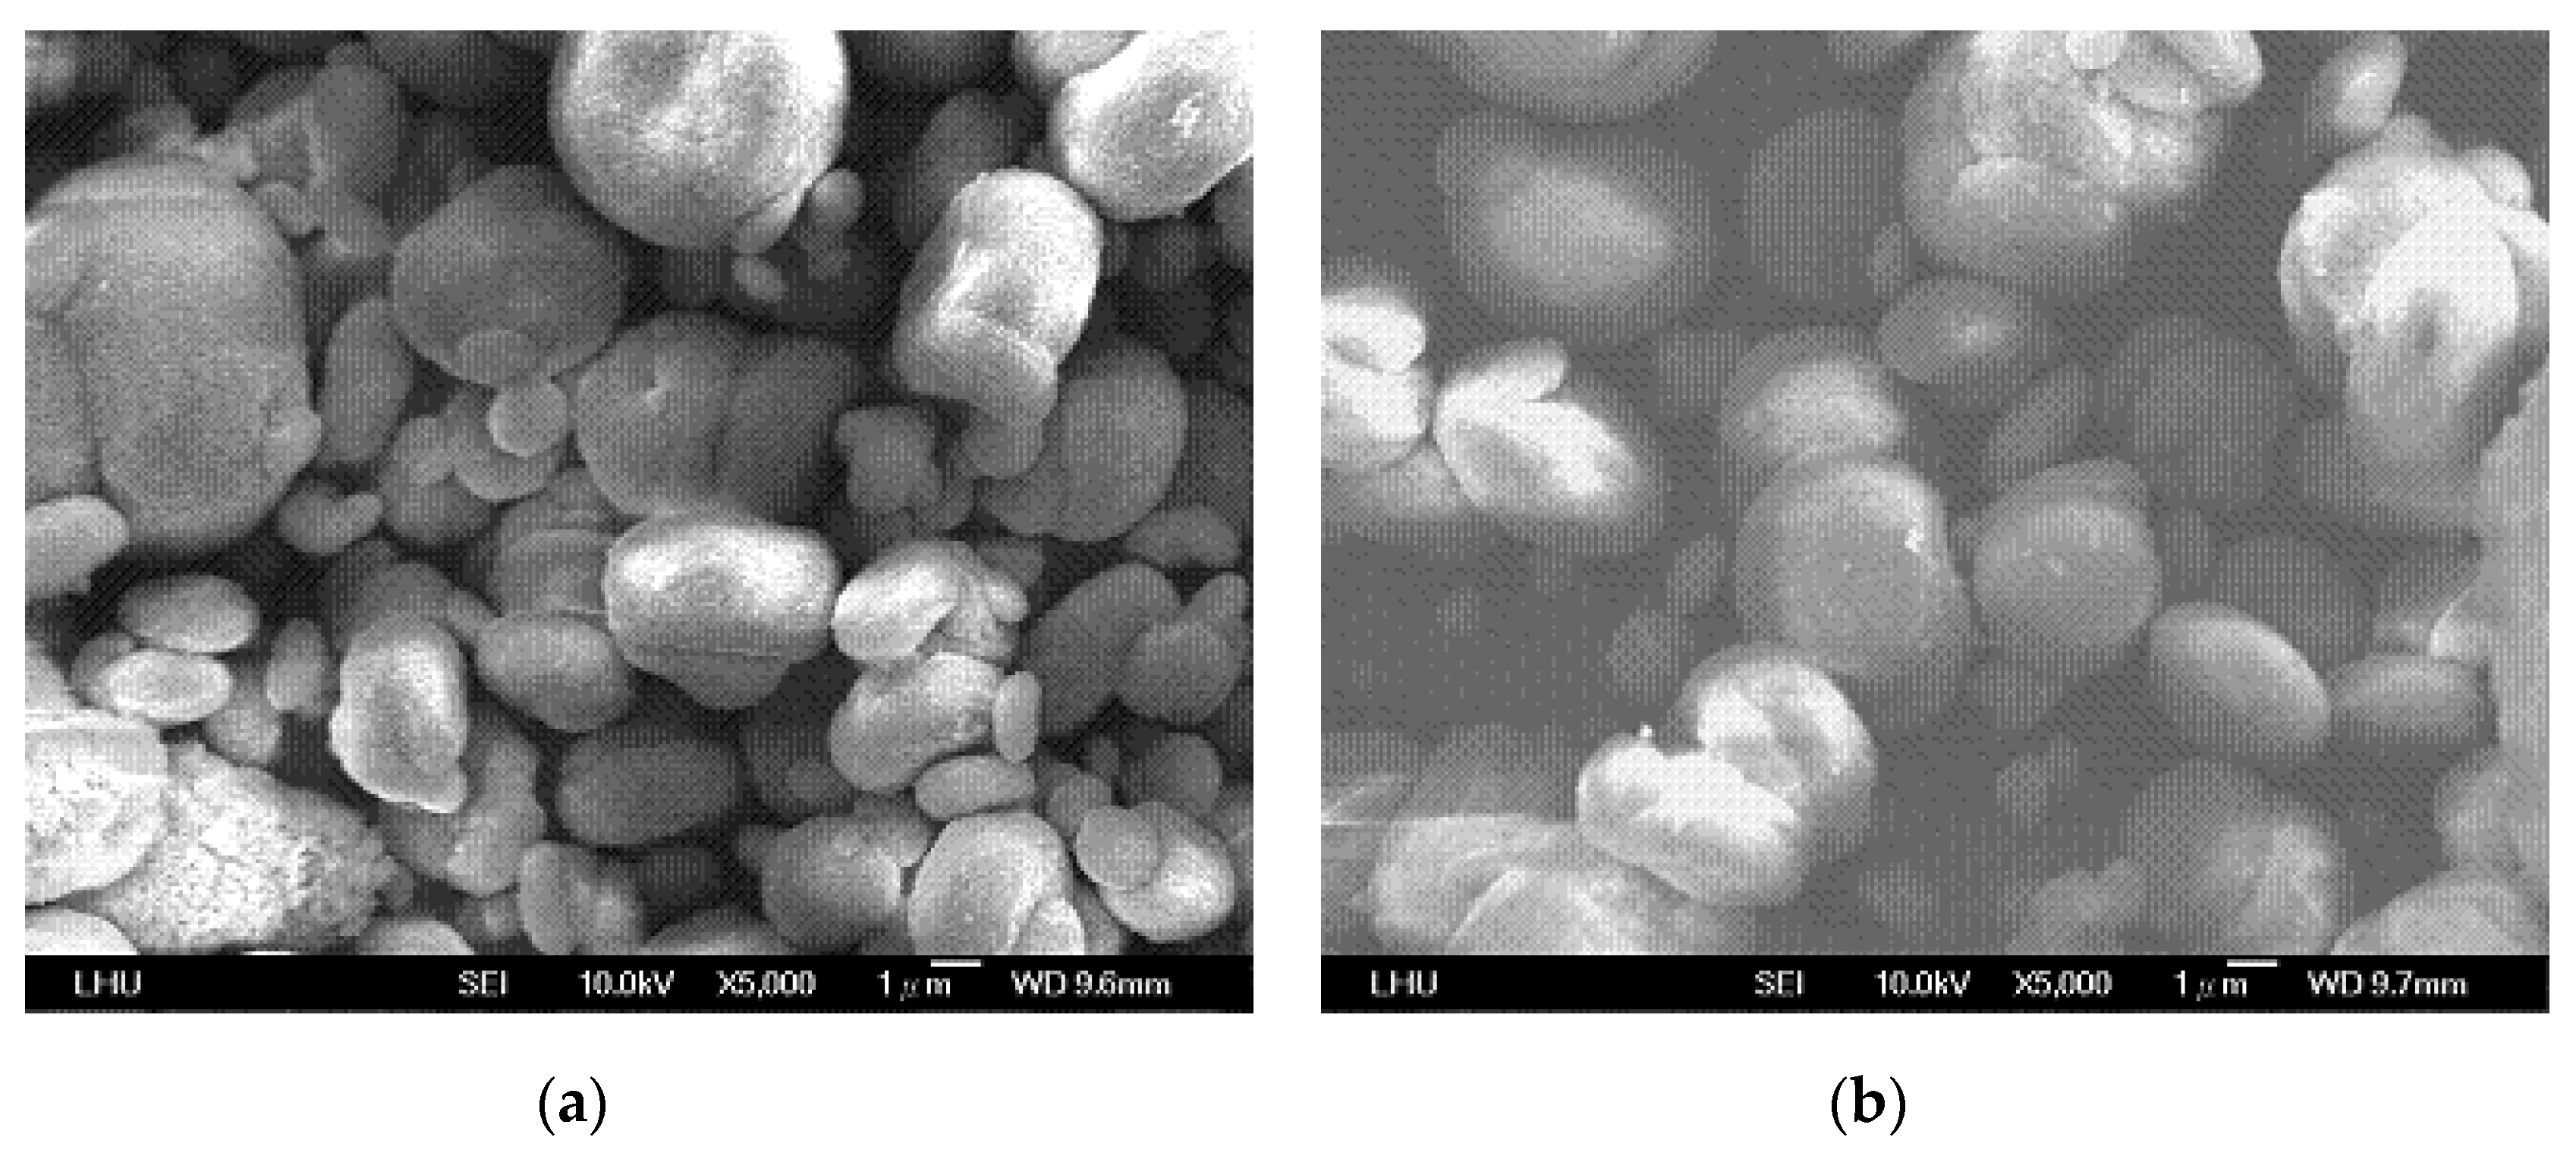
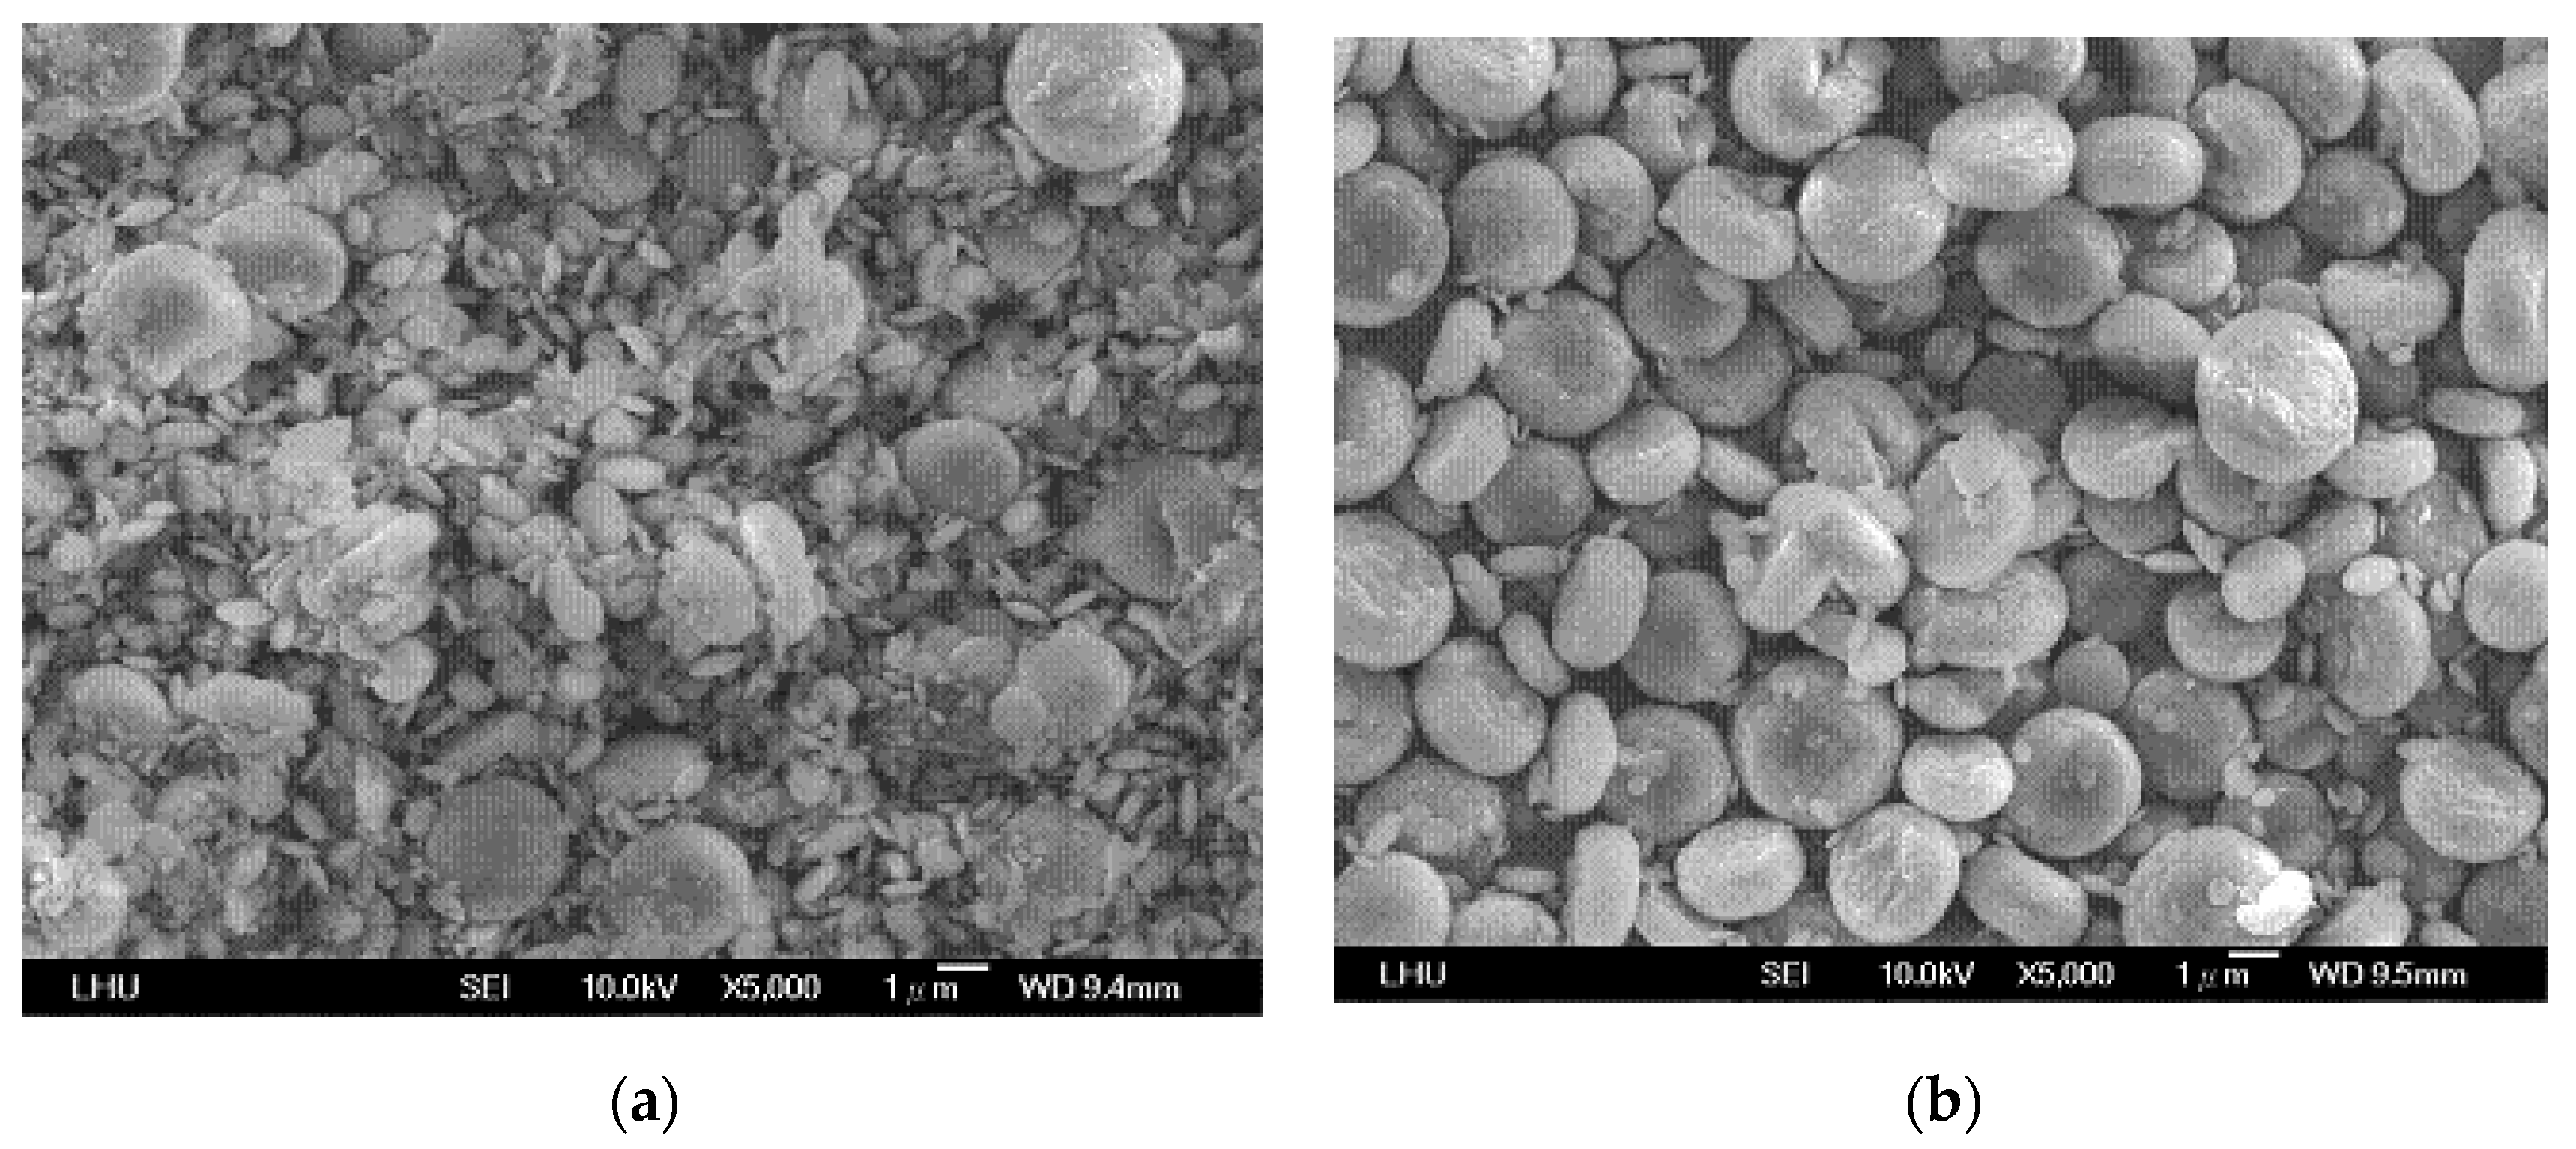
4.3. Effects of Variables on Vaterite Morphology and Size

Figure 4 shows different morphologies of vaterites with different flow rates observed by SEM when the pH was 9 and y1 was 10%. According to the images observed by SEM, the single particles were mainly disc vaterites. With the increase in Qg, the morphology changed a little, but the particle size decreased. The picture in Figure 4a showed the uniform particles were observed; on the other hand, in Figure 4b–d, they showed some tiny particles were formed giving average size smaller. However, the effects of Qg on particles need to be investigated further. Figure 4b and Figure 5 show the effects of different CO2 concentrations on the vaterite morphology; the morphology obtained at different CO2 concentrations was nearly discoid and spherical. Its morphology was nearly spherical when y1 was 10% (dp = 1.33 μm), 20% (dp = 1.63 μm), and 30% (dp = 1.65 μm), and the mean particle size increased with the increase in y1.
Figure 4b and Figure 6 show the different morphologies at different pH values when y1 was 10% and the flow rate was 4.0 L/min. At pH 9, as shown in Figure 4b, the calcium carbonate morphology was roughly spherical; at pH 10, spherical crystals began to form; at pH 11, the morphology was mainly spherical and significantly exhibited the shape of vaterite, and the particle size increased with the increase in pH value. However, when y1 was 20% and 30%, the particle size decreased with the increase in pH (Please see Table 2). The possible reason may be that the increase in MEA feed and CO2 absorption at a high pH improved the rates of supersaturation and nucleation, so that the precipitation increased accordingly, which affected the particle size and morphology.

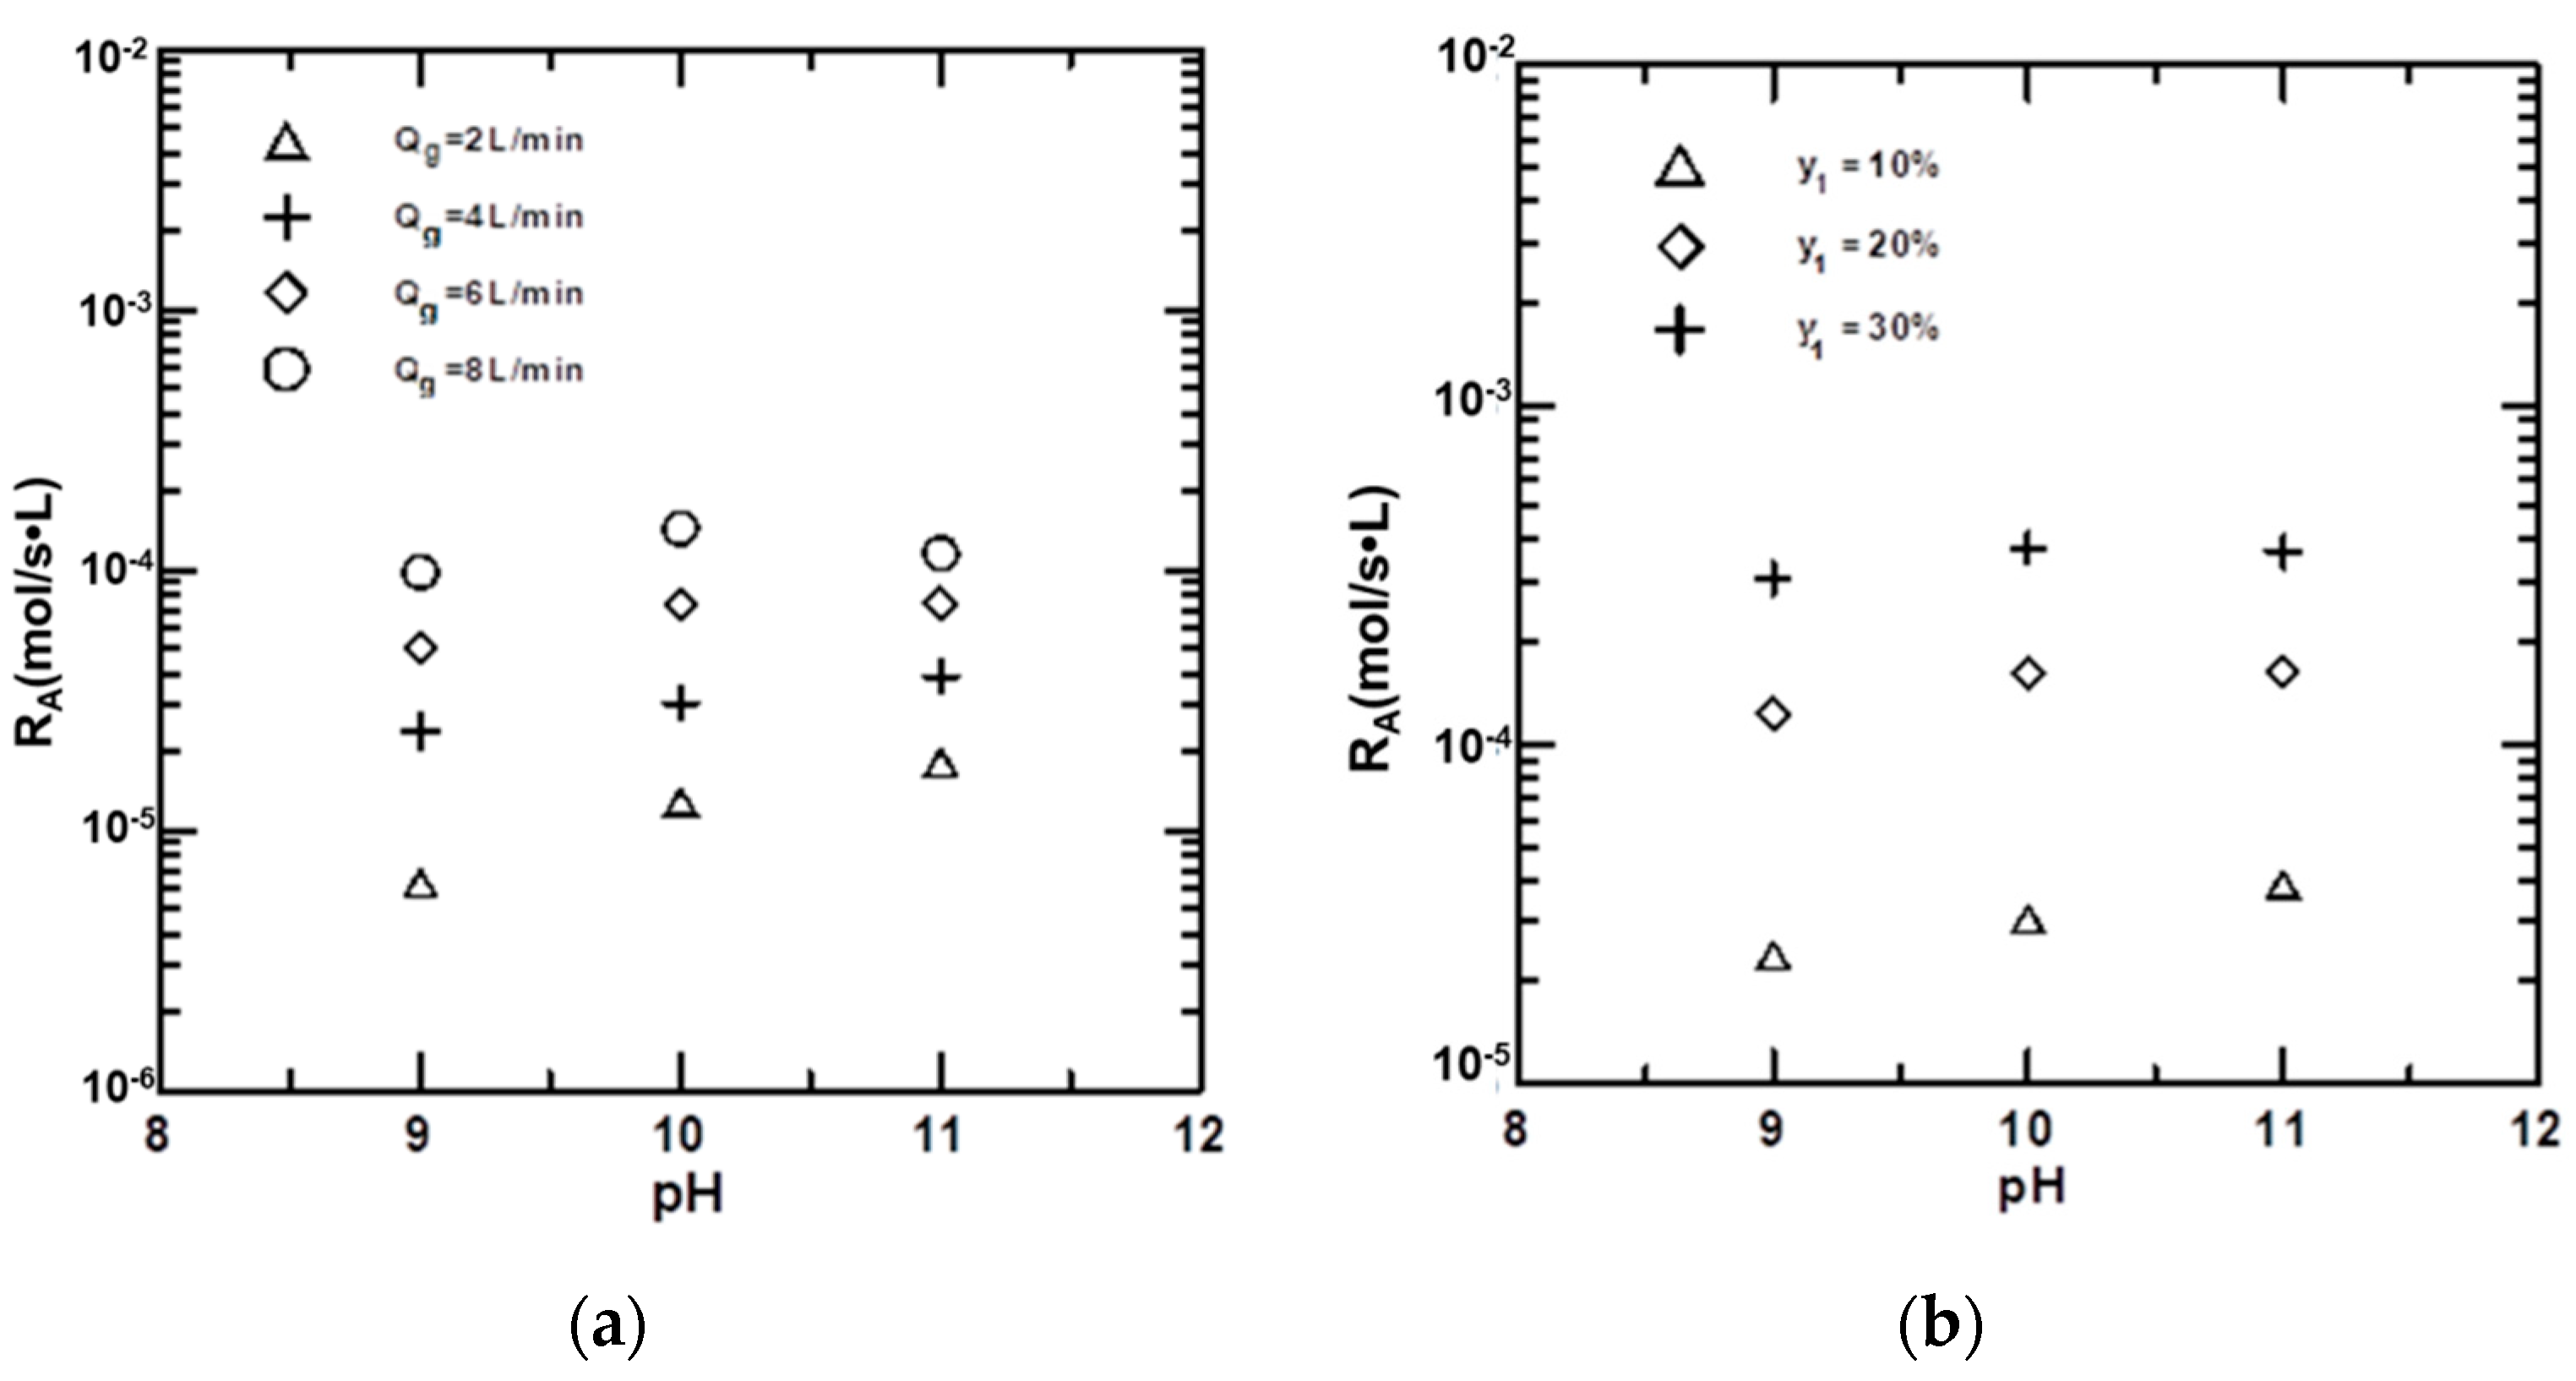
4.4. Effects of Variables on the Absorption Rate of CO2

To investigate the effects of variables on the absorption rate, the pH value at the absorption rate (RA) was drawn, as shown in Figure 7. In Figure 7a, with the volume flow rate as the parameter, RA was found to increase roughly with the increase in pH; RA increased linearly with pH at low flow rates and remained steady with the increase in pH at high flow rates, indicating that the increase in pH had limited effects on the absorption rate. In addition, Figure 7a also shows that, at high flow rates, the absorption rate was high and increased significantly, indicating that increasing the flow rate is an effective method to increase the absorption rate. Finally, as per Figure 7b, the feed concentration significantly increased the absorption rate, but the effects of pH were limited at high values of y1.
The effects of parameters on RA were explored using linear regression and the result was as follows:
R A = 6.9095 × 10 5 exp ( 0.21 p H ) y 1 2.12 u 1.67
The regression error was 1.63%. The regression confidence is shown in Figure 8. The regression result showed that RA was proportional to u and y1 to the powers of 1.67 and 2.12, respectively. It also shows that RA increased with an increase in pH. In addition, the RA values presented here were in the range of 0.063 × 10⁻⁴–3.8 × 10⁻⁴ mol/s×L, which was much smaller than that of MEA-CO2-H2O absorption system (3.68 × 10⁻⁴–56.8 × 10⁻⁴ mol/s×L) as reported in the previous study [21]. The difference was due to the formation of vaterites, a larger number of tiny particles, which enhanced the coalescence of the bubbles. Due to this, the mass-transfer rate of CO2 gas was blocked, which reduced the absorption rate.

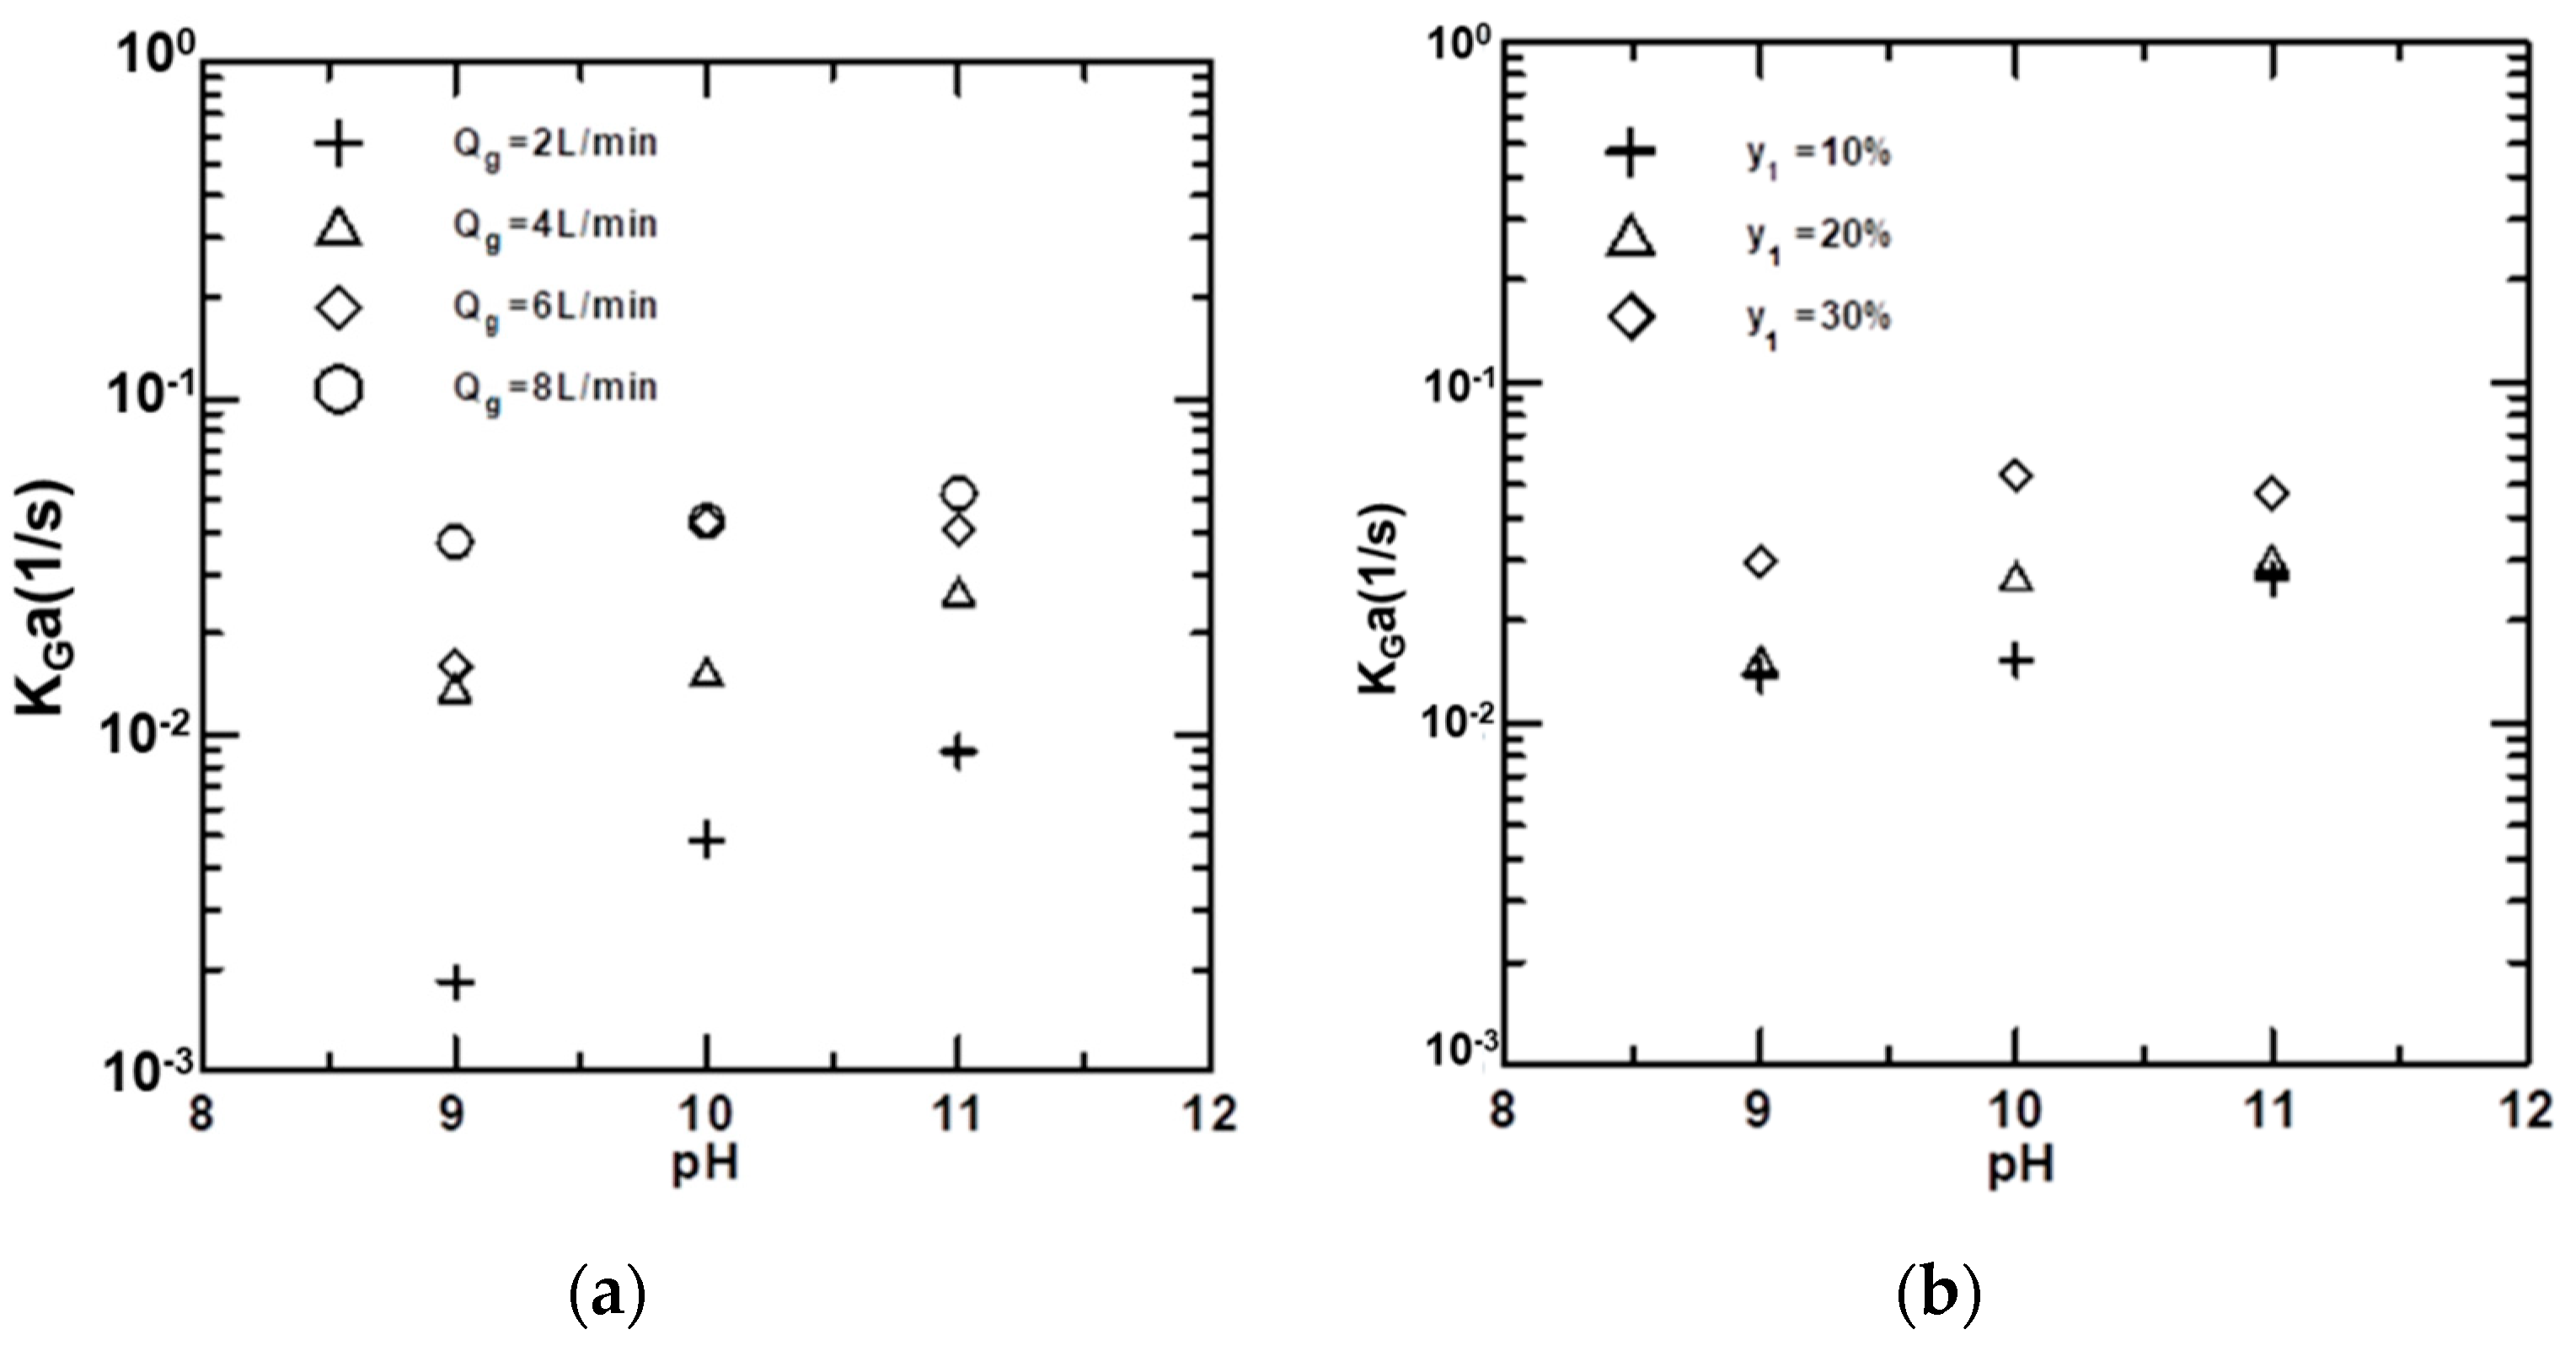
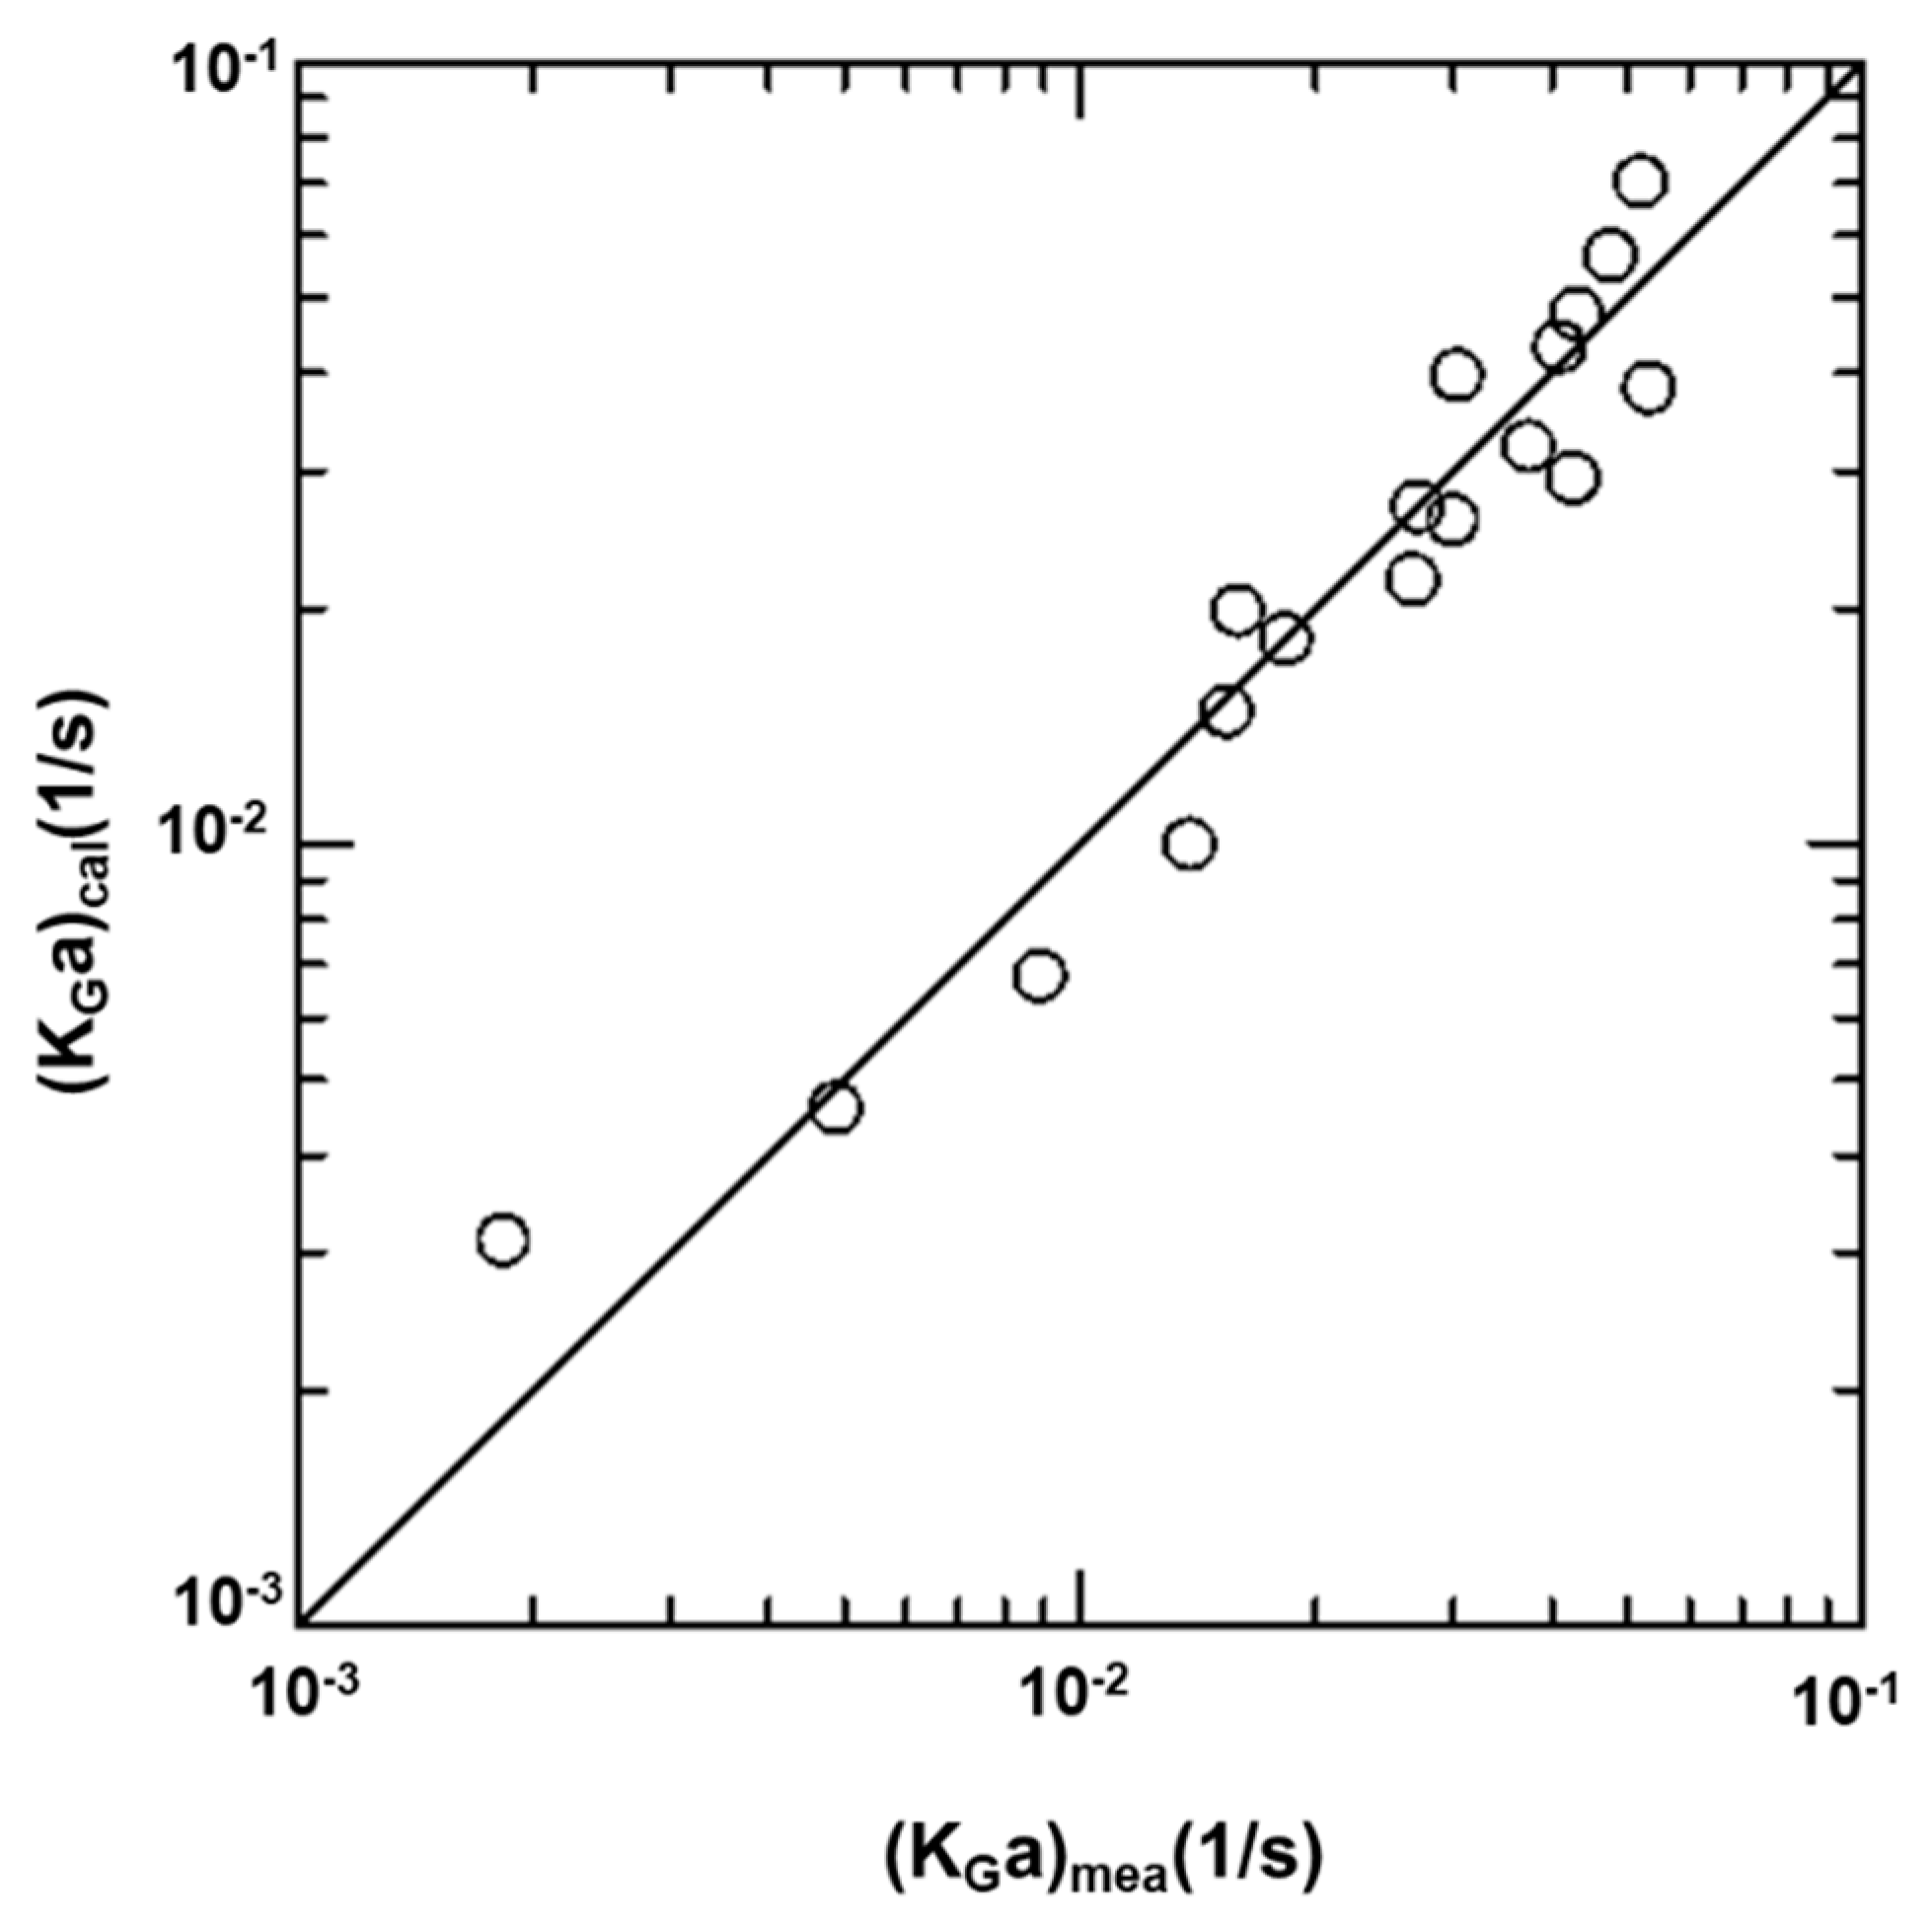
4.5. Effects of Variables on KGa

As shown in Figure 9a, the KGa value increased linearly with the increase in pH, and a higher gas flow rate led to a higher KGa value. At a high pH value (pH = 11), the absorption tended to be complete, as shown in Figure 2, indicating the reduced effects on KGa. Figure 9b shows that KGa increased with the increase in pH and y1, and this value was large at a high pH. The figure also shows that, at pH = 10 and 11, the KGa values were leveled off, indicating the diminishing effects of pH.
The relationship between KGa and pH value, and between u and y1 was explored, and KGa was used to carry out a regression analysis of u, y1 and pH, and the result was as follows:
K G a = 2.8469 × 10 4 u 1.68 y 1 0.87 exp ( 0.39 p H )
The regression error was 6.42%. The difference between the calculated value and the measured value is presented in Figure 10. The regression result showed that KGa was proportional to u to the power of 1.68 and the obtained value was closer than that reported earlier, which was between 0.58 and 1.67 [7,9,10,11,12], and the empirical formula also shows that KGa increased with the increase in y1 and pH value. The overall mass transfer coefficients at different pH values, y1, and u could be estimated from Equation (14), and after the values were determined, the volume of the absorption tower could be estimated. In addition, the difference in the mass transfer coefficient in the bubble columns can be compared with each other. For example, please see Table 3. The values obtained in this study ranged from 0.01 to 0.15 1/s, congruent with those reported in the literature [29,30,31,32,33]. However, these values were much smaller than those reported in previous work [21], and those by Al-Naimi et al. [29]. In our study, as shown in Table 2, KGa decreased with an increase in Fp, such as that in No.1-No.3. In addition, in other earlier studies [23] we found that Nos. 7(0.0136 1/s), 8(0.0199 1/s), 10(0.0506 1/s), 11(0.0299 1/s), 12(0.0241 1/s) were lower in mass-transfer coefficient due to the formation of ABC crystals. This decrease in mass transfer coefficient with increasing solid concentration is attributed to a decrease in small bubble and an increase in large bubble sizes due to the bubble coalescence tendencies, and they exhibited limited the mass transfer coefficient [29]. A similar trend was found in an earlier study [31].

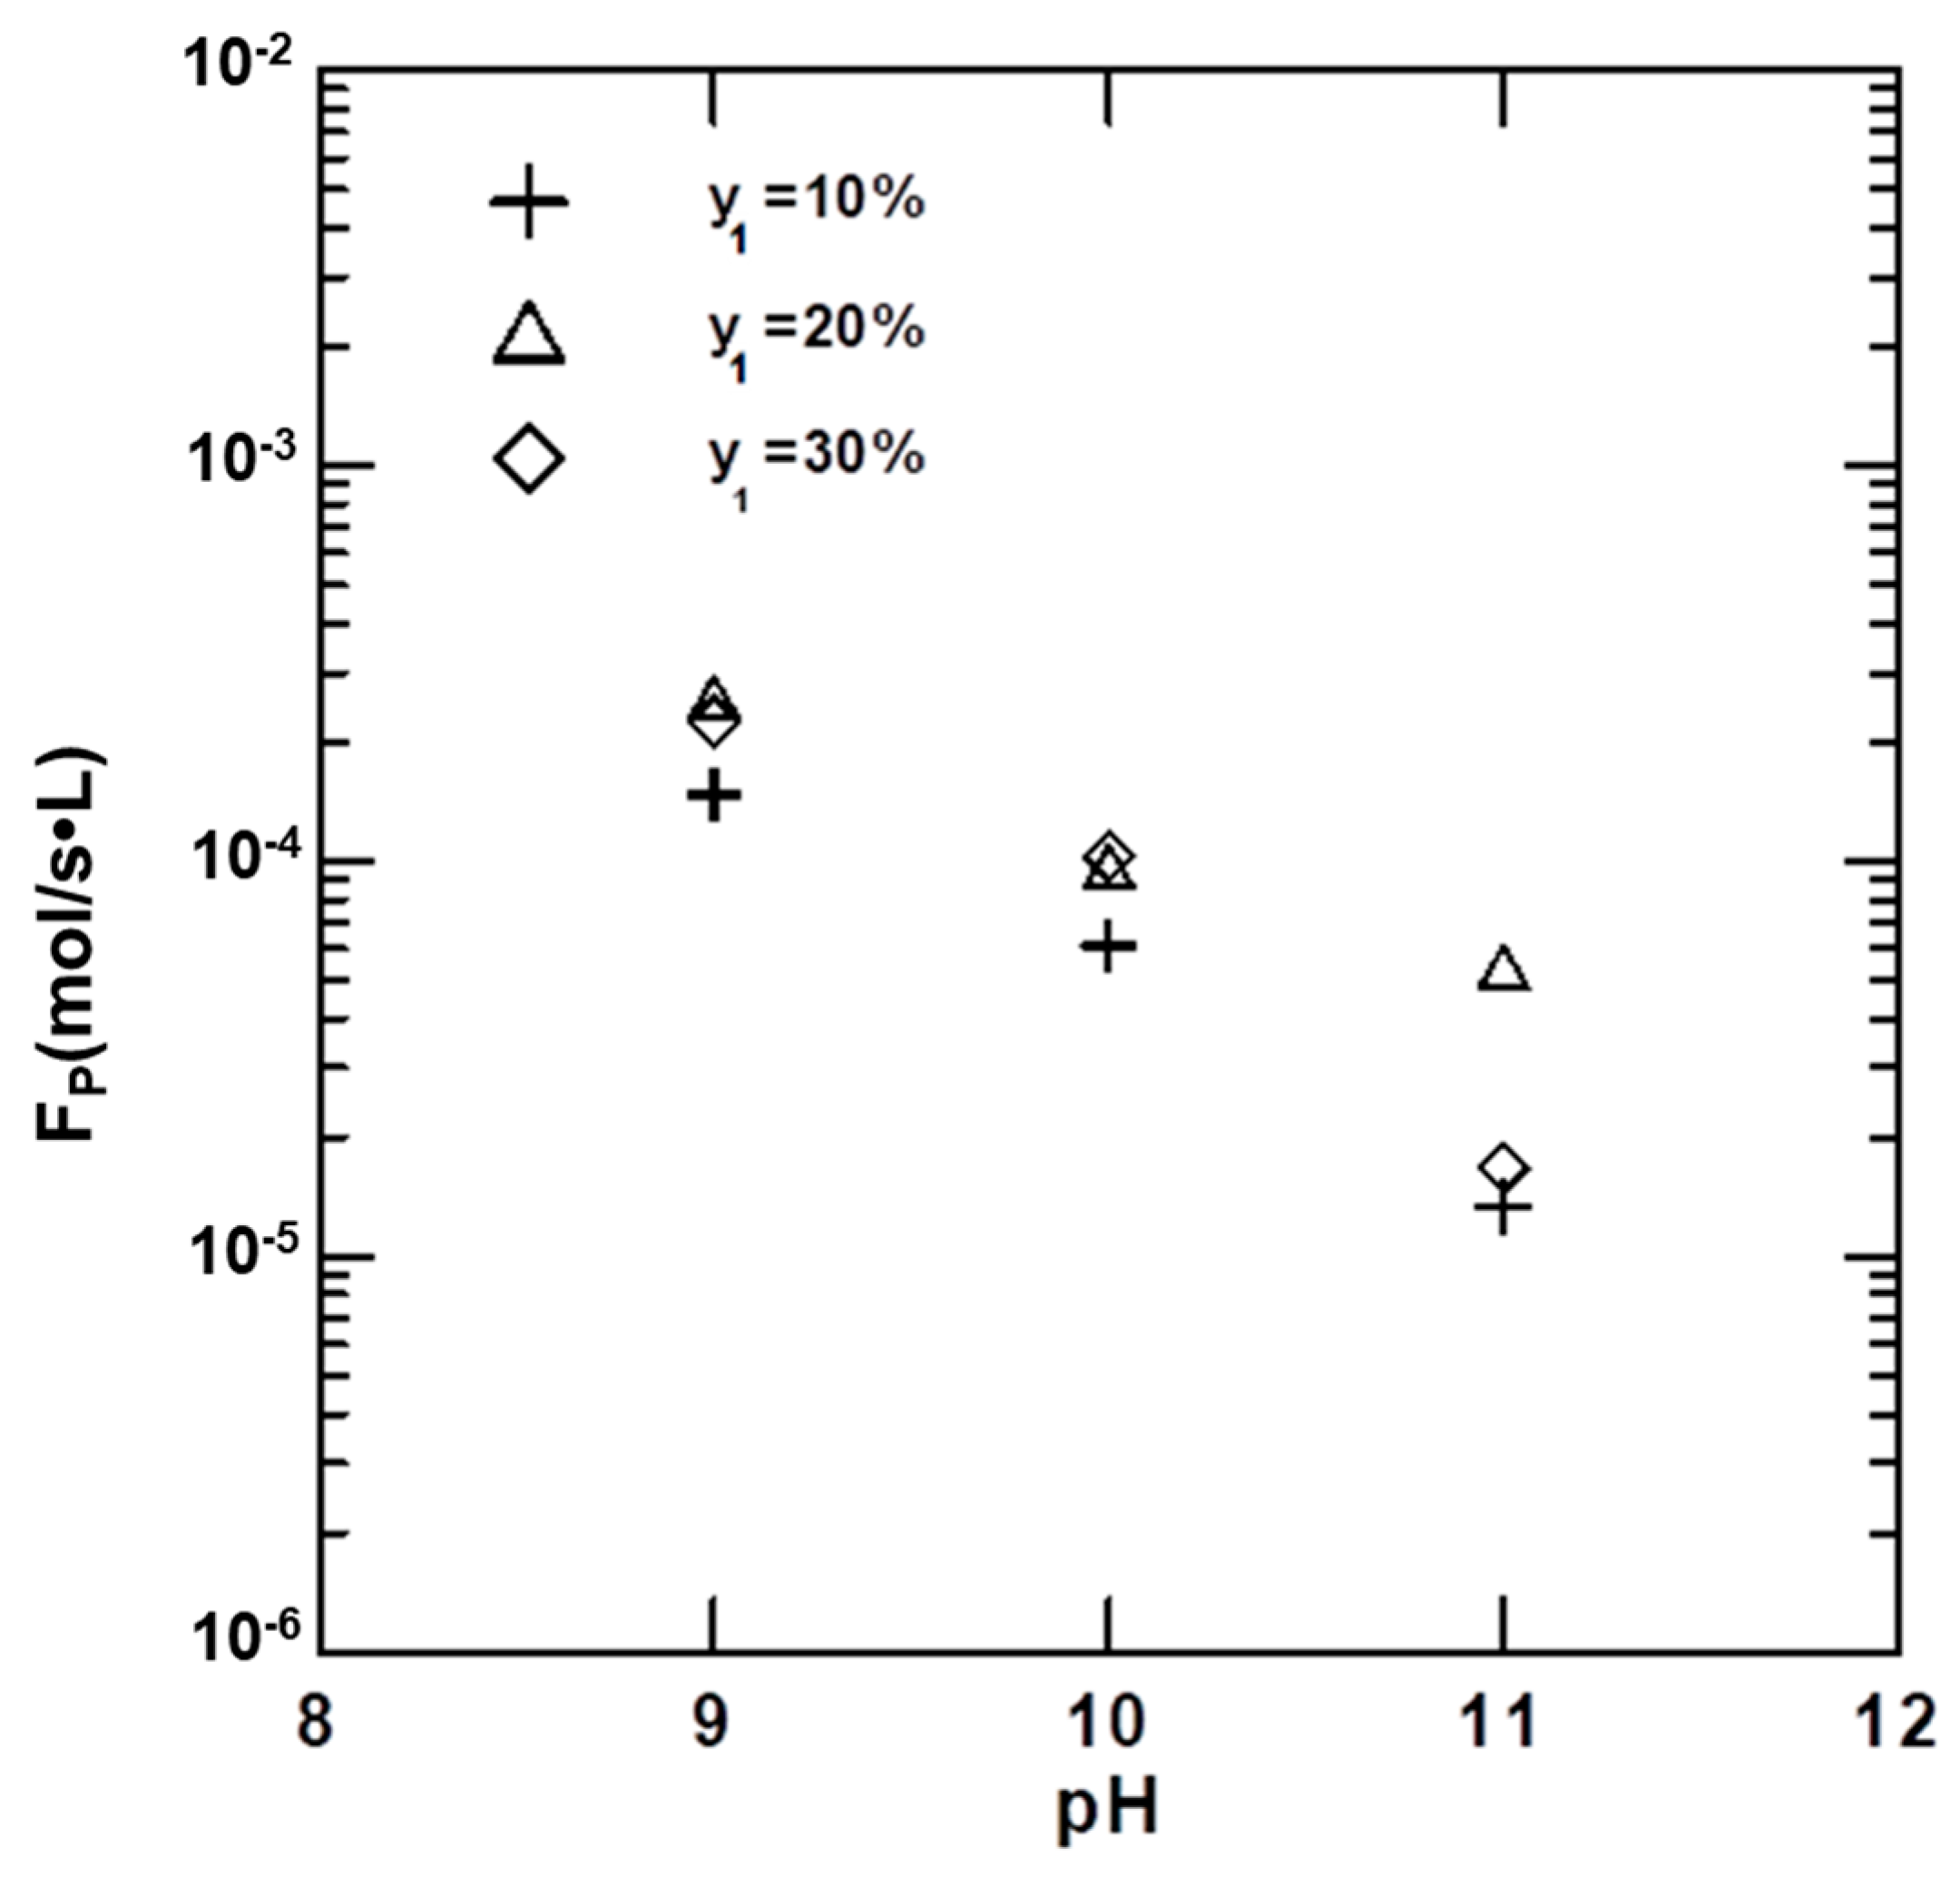
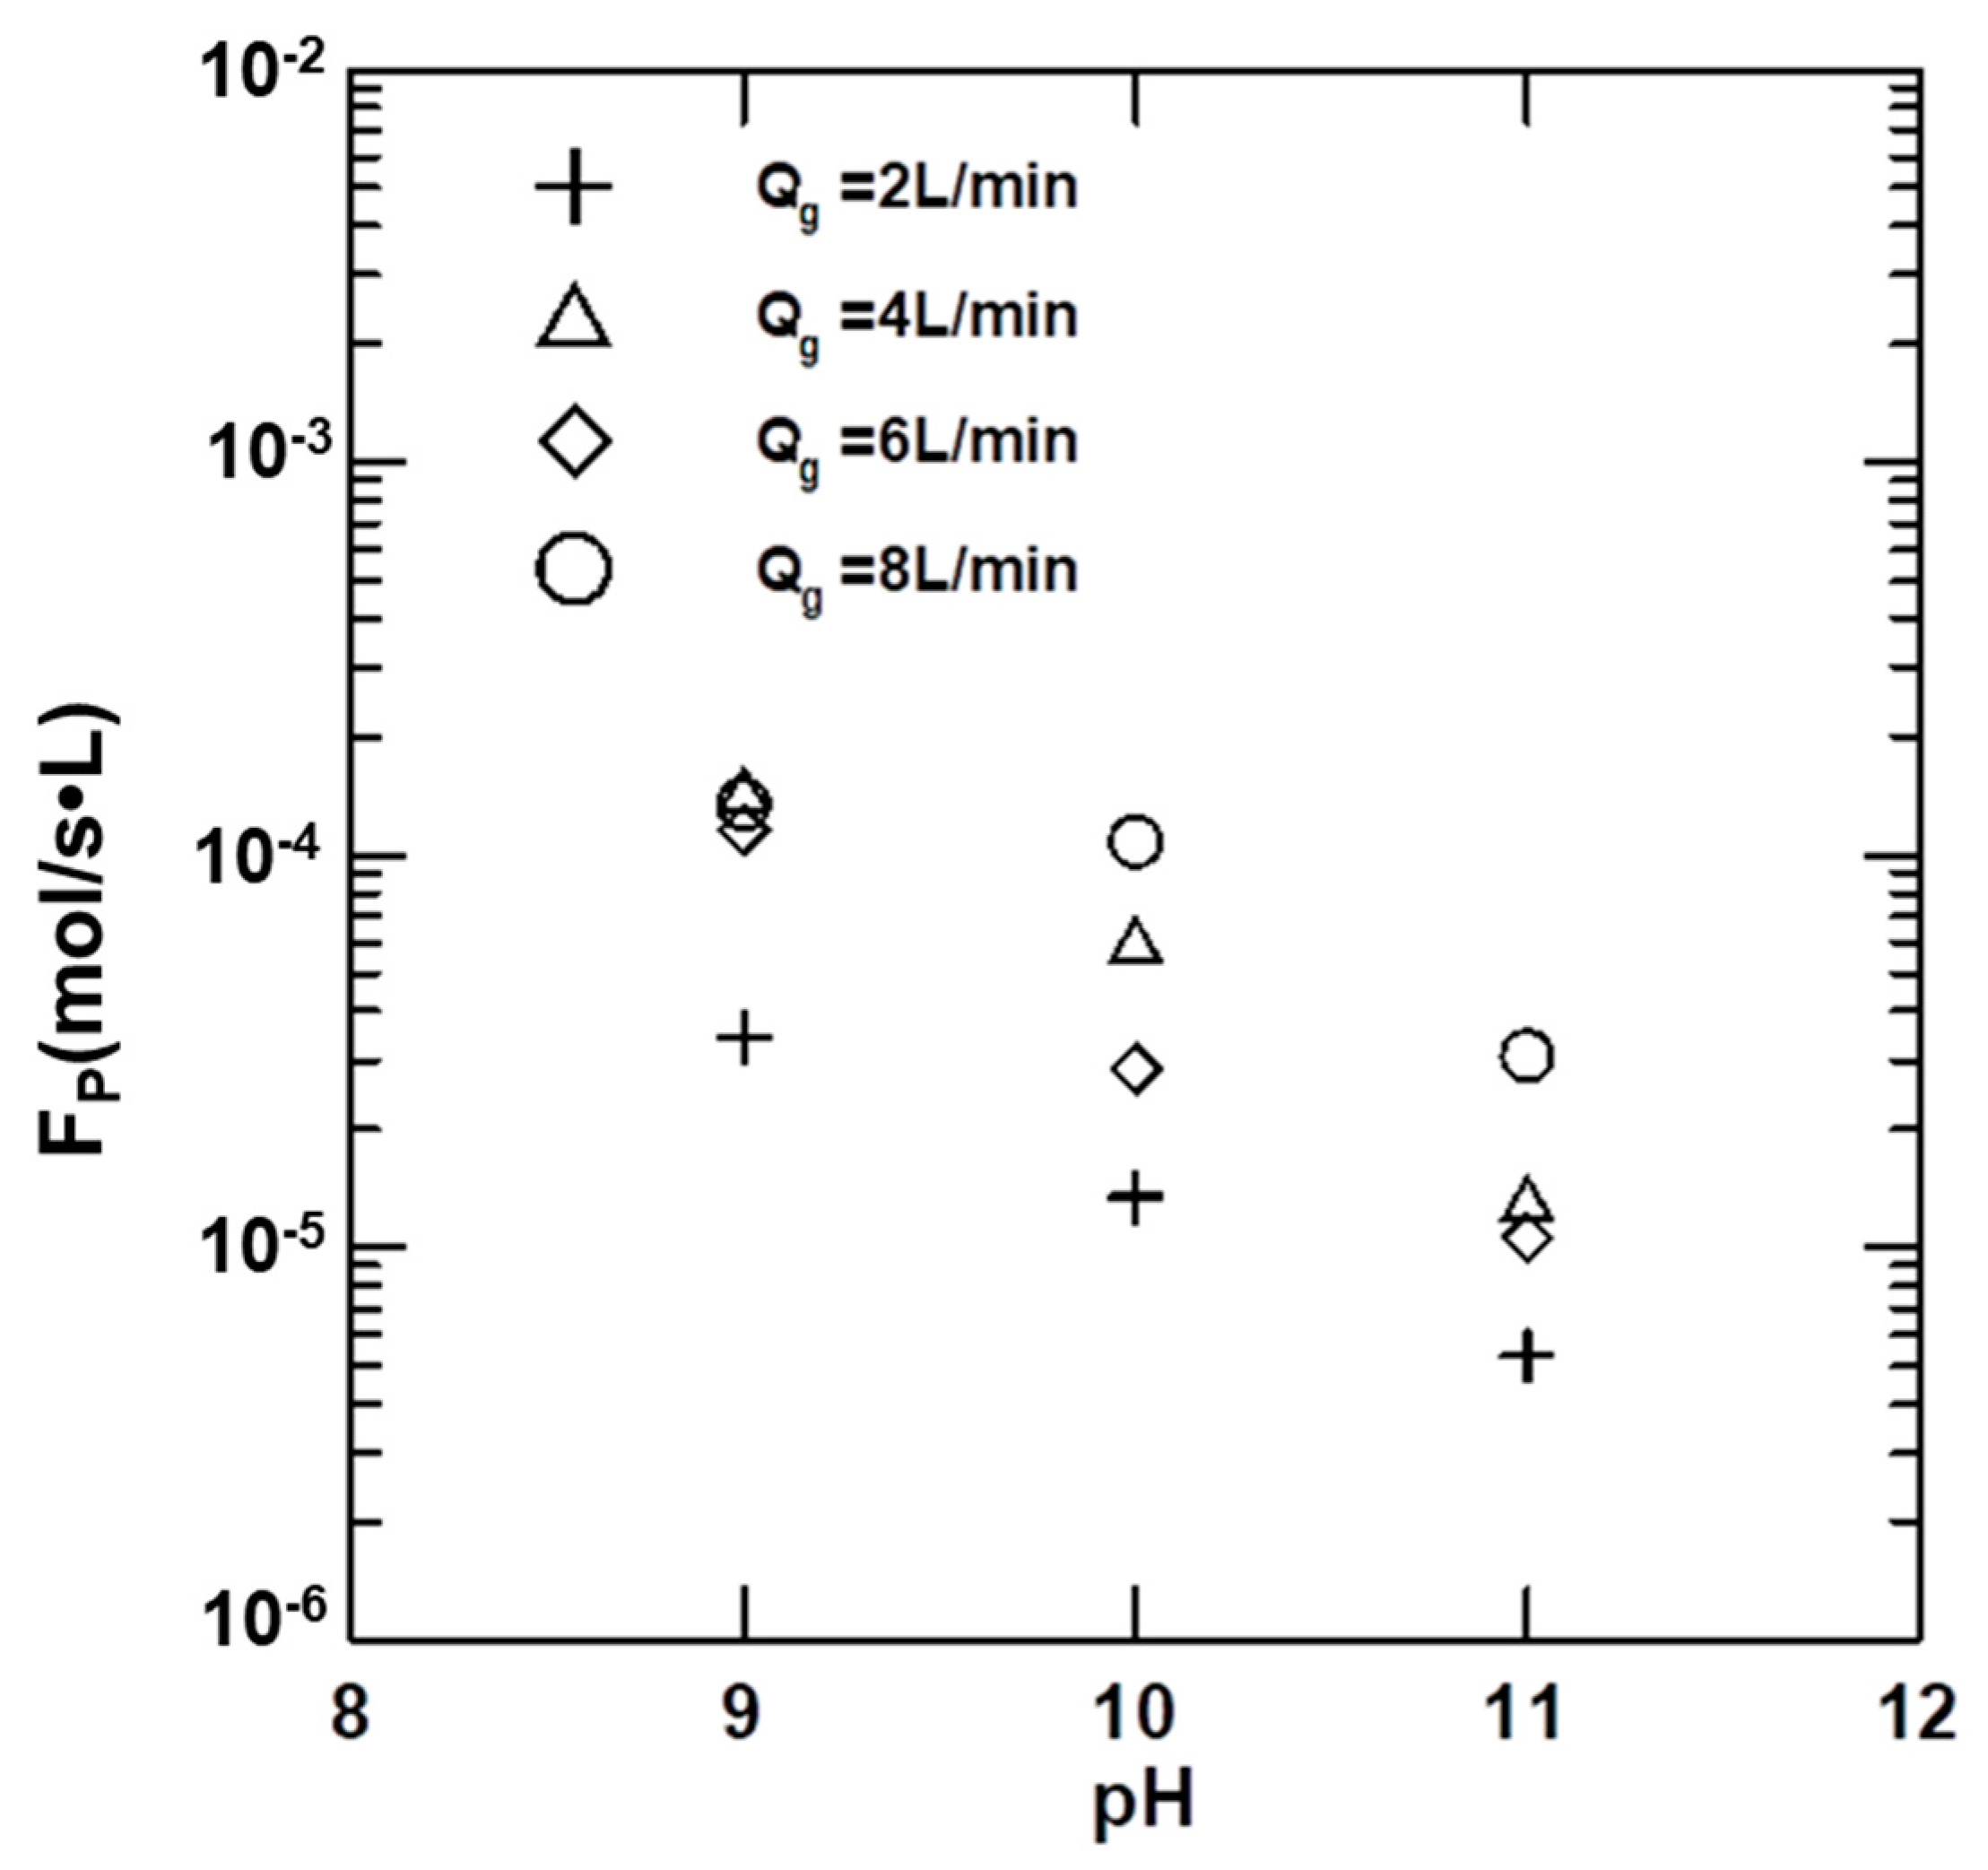
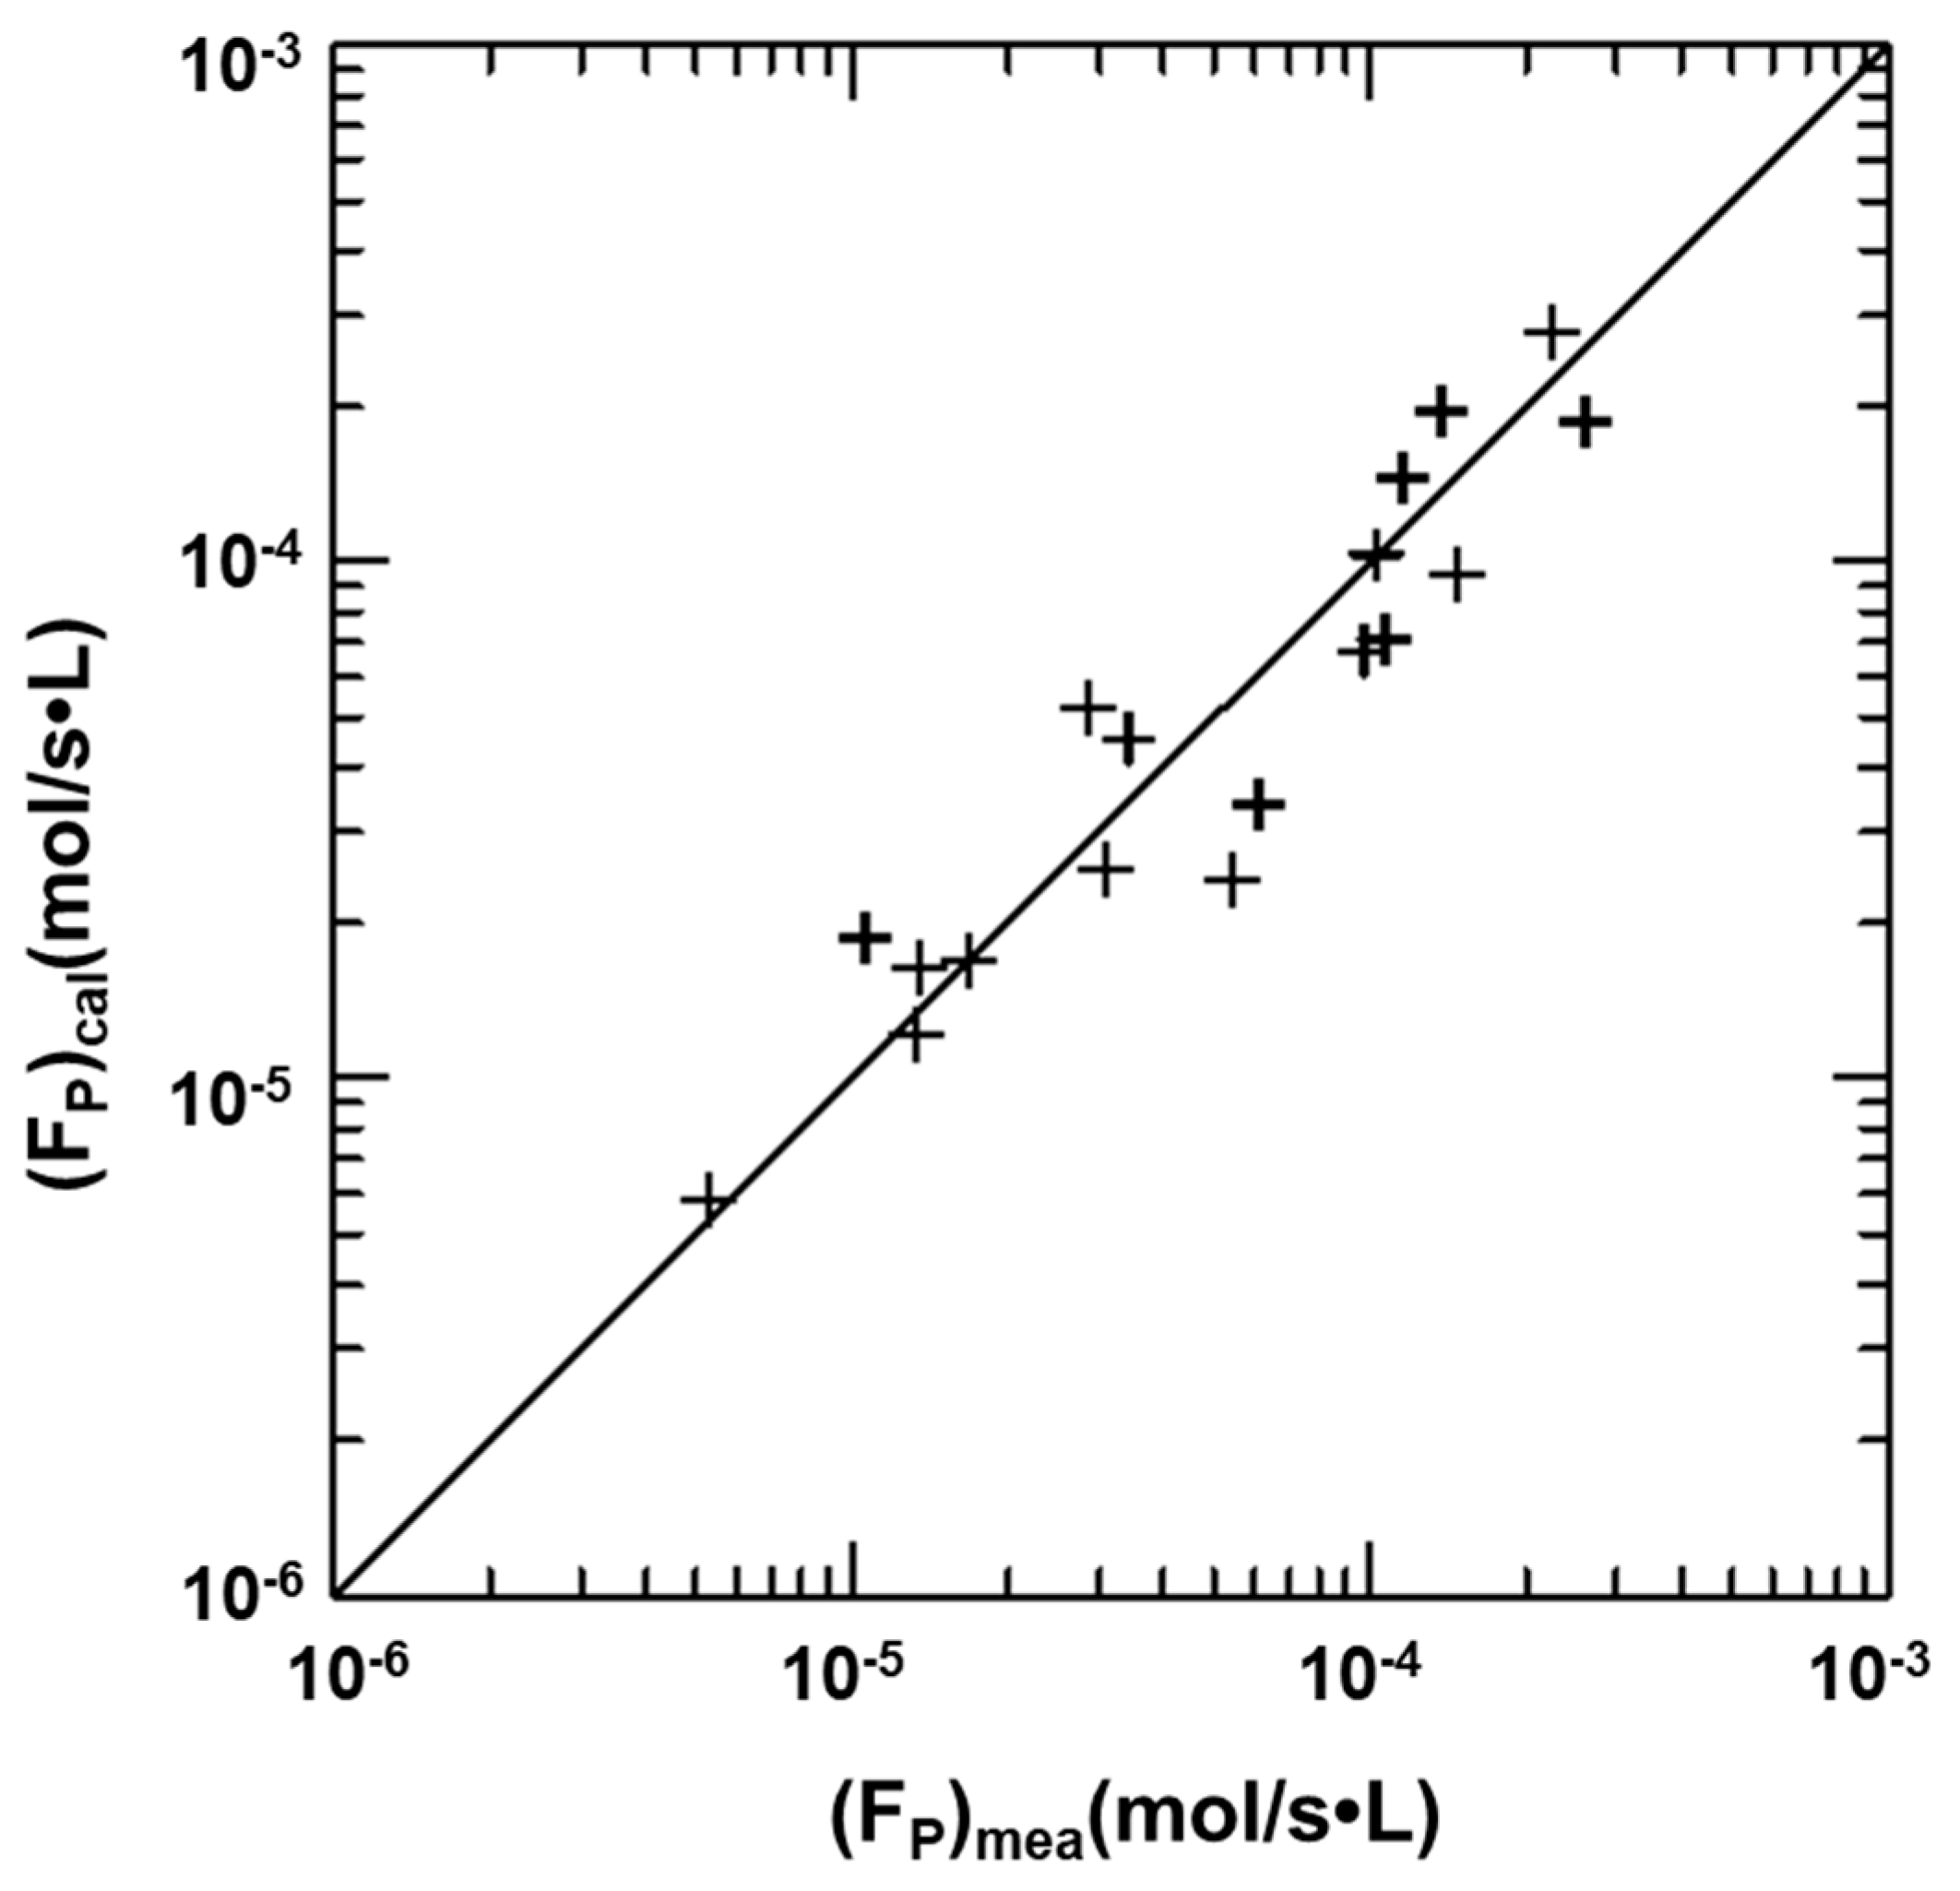
4.6. Precipitation Rates of Vaterites

Figure 11 shows the relationship between the rate of CaCO₃ precipitation and pH at different y1. The results indicate that the precipitation rate of CaCO₃ increased with the decrease in pH, otherwise, the precipitation rate decreased. This figure also shows that Fp tended to increase with an increase in y1. Figure 12 shows the effects of pH on Fp at different Qg values and obviously indicates that Fp values decreased with the increase in pH, regardless of Qg. Moreover, generally, a higher Qg led to a larger Fp. However, when Qg = 8 L/min, except at pH = 9, Fp was smaller than that at Qg = 6 L/min, which may be caused by the restriction of the system operation.
The results of the above discussion and the data in Table 2 indicate a competition effect between RA and FP, which was affected by u, y1, and pH. Hence, Fp was used to carry out the regression of parameters for comparison, and the result was as shown below:
F p = 2.5081 exp ( 1.02 p H ) y 1 0.98 u 1.06
The error was 4.28% and the reliability was as shown in Figure 13. According to this equation, the Fp value decreased with the increase in pH and increased with an increase in u and y1. Here, we defined the ratio of RA and FP as ψ. Using Equations (13) and (15), the relation became ψ = 2.7548 × 10 5 exp ( 1.23 p H ) y 1 1.14 u 0.61 . A high ψ value indicates that the mass transfer was dominated by absorption, while a low ψ value indicates that the mass transfer was dominated by crystallization.

5. Conclusions

In a continuous bubble column, the vaterite was precipitated mainly in disk-like and spherical morphology if MEA/CaCl2/H2O solution was used for CO2 absorption. At pH = 11, regardless of the other conditions, the absorption rate was close to 100%, so the increase in pH made no contribution to the improvement in absorption efficiency. The shell balance and two-film model were able to determine the absorption rate and overall mass transfer coefficient. An improvement in the gas flow rate and gas concentration increased the solid precipitation rate and overall mass transfer coefficient, but the solid precipitation rate decreased with the increase in pH values. Therefore, the precipitation rate was competitive with the absorption rate, which could be estimated by ψ(= RA/FP). A high ψ value indicates that the mass transfer was dominated by absorption, while a low ψ value indicates that the mass transfer was dominated by crystallization. The results show that the MEA/CaCl2/H2O solution can be used to absorb CO2, the greenhouse gas, and recover CaCO₃, and is a technology worthy of further development.

Author Contributions

P.C.C. conceived and designed the experiments and wrote the paper, while S.H.Z. performed the experiments and analyzed the data. All authors have read and agreed to the published version of the manuscript.

Funding

This research received no external funding.

Acknowledgments

The authors acknowledge the financial support of the MOST in Taiwan ROC (MOST-109-2221-E-262-004).

Conflicts of Interest

The authors declare no conflict of interest.

References

  1. Streedhar, I.; Nahar, T.; Venugopal, A.; Strinivas, B. Carbon capture by absorption---path covered and ahead. Renew. Sustain. Energy Rev. 2017, 76, 1080–1107. [Google Scholar] [CrossRef]
  2. Ali Khan, A.; Hader, G.N.; Saha, A.K. Carbon dioxide capture characteristics from flue gas using aqueous 2-amino-2-methyl-1-propanal (AMP) and monoethanolamine (MEA) solutions in packed bed absorption and regeneration columns. Int. J. Greenh. Gas Control. 2015, 32, 15–23. [Google Scholar] [CrossRef]
  3. Tian, Y.; Zhao, C.Y. A review of solar collectors and thermal energy storage in solar thermal Applications. Appl. Energy 2013, 104, 538–553. [Google Scholar] [CrossRef] [Green Version]
  4. Leung, D.Y.C.; Caramanna, C.; Maroto-Valer, M.M. An overview of current status of carbon dioxide capture and storage technologies. Renew. Sustain. Energy Rev. 2014, 39, 426–443. [Google Scholar] [CrossRef] [Green Version]
  5. Yu, C.H.; Huang, C.H.; Tan, C.S. A Review of CO2 Capture by Absorption an Adsorption. Aerosol Air Qual. Res. 2012, 12, 745–769. [Google Scholar]
  6. Mangalapally, H.P.; Notz, R.; Hoch, S.; Asprion, N.; Mangalapally, H.P.; Notz, R.; Hoch, S.; Asprion, N.; Sieder, G.; Garcia, H.; et al. Pilot plant experimental studies of post combustion CO2 capture by reactive absorption with MEA and new solvent. Energy Procedia. 2009, 1, 963–970. [Google Scholar] [CrossRef] [Green Version]
  7. Vaidya, P.D.; Kenig, E.Y. Absorption of CO2 into aqueous blends of alkanolamines prepared from renewable resources. Chem. Eng. Sci. 2007, 62, 7344–7350. [Google Scholar] [CrossRef]
  8. Kwak, N.S.; Lee, J.H.; Lee, I.Y.; Jang, K.R.; Shim, J.G. A study of new absorbent for post-combustion CO2 capture test bed. J. Taiwan Inst. Chem. Eng. 2014, 45, 2549–2556. [Google Scholar] [CrossRef]
  9. Hwang, K.S.; Park, S.W.; Park, D.W.; Oh, K.J.; Kim, S.S. Absorption of carbon dioxide into diisopropanolamine solutions of polar organic solvents. J. Taiwan Inst. Chem. Eng. 2010, 41, 16–21. [Google Scholar] [CrossRef]
  10. Lee, K.H.; Lee, B.; Lee, J.H.; You, J.K.; Park, K.T.; Baek, I.H.; Hur, N.H. Aqueous hydrazine as a promising candidate for capturing carbon dioxide. Inter. J. Greenh. Gas Control 2014, 29, 256–262. [Google Scholar] [CrossRef]
  11. Zhao, B.; Su, Y.; Peng, Y.C. Effect of reactor geometry on aqueous ammonia-based carbon dioxide capture in bubble column reactors. Inter. J. Greenh. Gas Control 2013, 17, 481–487. [Google Scholar] [CrossRef]
  12. Andersson, V.; Franck, P.A.; Berntsson, T. Industrial excess heat driven post-combustion CCS: The effect of stripper temperature level. Inter. J. Greenh. Gas Control 2014, 21, 1–10. [Google Scholar] [CrossRef]
  13. Xiao, J.; Li, C.C.; Li, M.H. Kinetics of absorption of carbon dioxide into aqueous solutions of 2-amino-2-methyl-1-propanol + monoethanolamin. Chem. Eng. Sci. 2000, 55, 161–175. [Google Scholar] [CrossRef]
  14. Lin, C.Y.; Soriano, A.N.; Li, M.H. Kinetics study of carbon dioxide absorption into aqueous solution containing N-methyldiethanolamine + Diethanolamine. J. Taiwan Inst. Chem. Eng. 2009, 40, 403–412. [Google Scholar] [CrossRef]
  15. Borhani, T.N.G.; Azarpour, A.; Akbari, V.; Wan Alwi, S.R.; Manan, Z.A. CO2 capture with potassium carbonate solutions: A state-of-the-art review. Inter. J. Greenh. Gas Control 2015, 41, 142–162. [Google Scholar] [CrossRef]
  16. Chen, P.C.; Shi, W.; Du, R.; Chen, V. Scrubbing of CO2 greenhouse gases, accompanied by precipitation in a continuous bubble-column scrubber. Ind. Eng. Chem. Res. 2008, 47, 6336–6343. [Google Scholar] [CrossRef]
  17. Chen, P.C.; Shi, W.; Du, R.; Chen, V. Crystallization kinetics of barium carbonate crystals in a lab-scale bubble-column scrubber. J. Taiwan Inst. Chem. Eng. 2014, 45, 2418–2426. [Google Scholar] [CrossRef]
  18. Chen, P.C. Absorption of Carbon Dioxide in a Bubble Column Scrubber. Greenhouse Gases; Liu, G., Ed.; InTech: Rijeka, Croatia, 2012; Chapter 5; pp. 95–116. [Google Scholar]
  19. Petrov, P.; Ewert, G.; Rohm, H.J. Chemisorptive removal of carbon dioxide from process streams using a reactive bubble column with simultaneous production of usable materials. Chem. Eng. Technol. 2006, 29, 1084–1089. [Google Scholar] [CrossRef]
  20. Sánchez, O.; Michaud, S.; Escudié, R.; Delgenès, J.-P.; Bernet, N. Liquid mixing and gas–liquid mass transfer in a three-phase inverse turbulent bed reactor. Chem. Eng. J. 2005, 114, 1–7. [Google Scholar] [CrossRef]
  21. Chen, P.C.; Luo, Y.X.; Cai, P.W. CO2 Capture using monoethanolamine in a bubble-column scrubber. Chem. Eng. Technol. 2015, 38, 274–282. [Google Scholar] [CrossRef]
  22. Vaidya, P.D.; Kenig, E.Y. CO2-aklanolamine reaction kinetics: A review of recent studies. Chem. Eng. Technol. 2007, 11, 1467–1474. [Google Scholar] [CrossRef]
  23. Chen, P.C.; Yu, S.C. CO2 capture and crystallization of ammonia biocarbonate in a lab-scale scrubber. Crystals 2018, 8, 39. [Google Scholar] [CrossRef] [Green Version]
  24. Li, L.; Maeder, M.; Burns, R.; Puxty, G.; Clifford, S.; Yu, H. The Henry coefficient of CO2 in the MEA-CO2-H2O system. Energy Procedia 2017, 114, 1841–1847. [Google Scholar] [CrossRef]
  25. Tong, D.; Martin Trusler, J.P. Solubility of carbon dioxide in aqueous solution on monoethanolamine or 2-amino-2-methyl-1-propanal: Experimental measurements and modeling. Inter. J. Greenh. Gas Control 2012, 6, 37–47. [Google Scholar] [CrossRef]
  26. Li, Q.; Ding, Y.; Li, F.; Xie, B.; Qiana, Y. Solvothermal growth of vaterite in the presence of ethylene glycol, 1,2-propanediol and glycerin. J. Crystal Growth 2002, 236, 357–362. [Google Scholar] [CrossRef]
  27. Trushina, D.B.; Bukreeva, T.V.; Kovalchuk, M.V.; Antipina, M.N. CaCO3 vaterite microparticles for biomedical and personal care applications. Mater. Sci. Eng. C 2014, 45, 644–658. [Google Scholar] [CrossRef]
  28. Brecevic, L.; Kralj, D. On calcium carbonates: From fundamental research to application. Crocatia Chem. Acta 2007, 80, 467–484. [Google Scholar]
  29. Al-Naimi, S.A.; Salih, S.A.J.; Al-Atabi, H. Simulation study of mass transfer coefficient in slurry bubble column reactor using neural network. Al-Khwarizmi Eng. J. 2013, 9, 60–70. [Google Scholar]
  30. Lau, R.; Lee, P.H.V.; Chen, T. Mass transfer studies in shallow bubble column reactors. Chem. Eng. Process. Process Intensif. 2012, 62, 18–25. [Google Scholar] [CrossRef] [Green Version]
  31. Vandu, C.O.; Koop, K.; Krishna, R. Volumetric mass transfer coefficient in a slurry bubble column operating in the heterogeneous flow regime. Chem. Eng. Sci. 2004, 59, 5417–5423. [Google Scholar] [CrossRef]
  32. Dhaouadi, H.; Poncin, S.; Hornut, J.M.; Midoux, N. Gas–liquid mass transfer in bubble column reactor: Analytical solution and experimental confirmation. Chem. Eng. Process 2008, 47, 548–556. [Google Scholar] [CrossRef]
  33. Chen, P.C.; Chou, P.H.; Lin, S.Z.; Chen, H.W. Capturing CO2 by using a microalgae culture recycle solution. Chem. Eng. Technol. 2017, 40, 2274–2282. [Google Scholar] [CrossRef]
Figure 1. The capture of CO2 using a bubble-column scrubber. 1. CO2 gas tank; 2. N2 gas tank; 3. gas-flow meter; 4. gas-flow meter; 5. digital pressure gauge; 6. bubble-column scrubber; 7. cooling machine; 8. tubing pump; 9. controller; 10. thermometer; 11. pH-electrode; 12. CO2 meter; 13. MEA solvent reservoir; 14. reservoir; 15. cooling coil; 16. tubing pump; 17. CaCl2 solution reservoir.
Crystals 10 00694 g001
Figure 2. Variation in CO2 concentration at the outlet with time at different pH values. (CO2 = 10%, Qg = 4 L/min).
Crystals 10 00694 g002
Figure 3. XRD spectra for No. 2 showing the intensity of vaterite.
Crystals 10 00694 g003
Figure 4. Effects of Qg on the morphology and crystal size of vaterite. (a) Qg = 2 L/min (dp = 1.60 μm) (No. 1); (b) Qg = 4 L/min (dp = 1.33 μm) (No.4); (c) Qg = 6 L/min (dp = 1.14 μm) (No. 7); (d) Qg = 8 L/min (dp = 1.01 μm) (No. 10).
Crystals 10 00694 g004
Figure 5. Effects of y1 on the morphology and crystal size of vaterite (pH = 9, Qg = 4 L/min). (a) 20% (dp = 1.63 μm) (No. 13); (b) 30% (dp = 1.65 μm) (No. 16).
Crystals 10 00694 g005
Figure 6. Effects of pH on the morphology and crystal size of vaterite (y1 = 10%, Qg = 4L/min). (a) pH = 10 (dp = 1.41 μm) (No.5); (b) pH = 11 (dp = 1.83 μm) (No. 6).
Crystals 10 00694 g006
Figure 7. Effects of process variables on the absorption of CO2. (a) Effects of pH at different gas-flow rates; (b) Effects of pH at different gas concentrations.
Crystals 10 00694 g007
Figure 8. Regression confidence for RA.
Crystals 10 00694 g008
Figure 9. Effects of variables on the KGa at different conditions. (a) Effects of pH at different gas-flow rates; (b) Effects of pH at different gas concentrations.
Crystals 10 00694 g009
Figure 10. A plot of calculated KGa versus measured KGa.
Crystals 10 00694 g010
Figure 11. Variation in Fp with pH at different y1 values.
Crystals 10 00694 g011
Figure 12. Variation in Fp with pH at different Qg values.
Crystals 10 00694 g012
Figure 13. A plot of calculated versus measured ψ showing the confidence of regression.
Crystals 10 00694 g013
Table 1. Operating conditions used in this work.
Concentration of CO2 Gas (%)10–30
Concentration of CaCl2 (M)0.2
Concentration of MEA (M)4
Gas-flow rate (L/min)2–8
Flow rate of CaCl2 (mL/min)50
Gas inlet temperature (°C)30
Temperature in the column (°C)35
pH9–11
Table 2. The data obtained in the experiment.
No.pHy1
(%)
u (cm/s)RA × 105
(mol/s·L)
KGa × 102
1/s
τ
min
Fp × 105
(mol/s·L)
E
(%)
dp
μm
Qadd
(mL/min)
19101.70.630.18317.003.4232.81.602.0
210101.71.280.48716.711.3571.51.372.9
311101.71.820.88916.010.531001.452.6
49103.42.401.3814.9814.71551.339.0
510103.43.071.5413.926.11751.4113.5
611103.43.882.6613.561.3499.21.8315.2
79105.15.021.599.5711.59681.1412.4
810105.17.364.269.512.851000.6425.3
911105.17.404.104.571.061001.78176.6
109106.89.783.7411.8813.7684.11.0120.2
1110106.814.44.317.7010.681000.9444.3
1211106.811.55.204.953.081001.28228.4
139203.412.31.5314.1726.0868.71.6342.4
1410203.416.32.7011.749.7797.51.4443.0
1511203.416.43.033.905.431000.72143.6
169303.430.82.9912.6022.5073.41.6524.4
1710303.438.05.339.3710.3098.31.3164.8
1811303.436.94.763.181.681000.75128.6
Table 3. Comparison of mass-transfer coefficients in the bubble columns.
KGa(1/s)RA × 104(mol/s×L)Remarks and References
0.01–0.14-O2-Liquid(water/glycerin/alcohol)-Solid(PVC) [29]
0.045–0.085-O2(N2+O2)-H2O [30]
0.02–0.14-Air-Paraffin oil-Porous catalyst [31]
0.01–0.15-O2-H2O [32]
0.0377–0.88813.68–56.8CO2-MEA-H2O [21]
0.021–0.1091.36–6.61CO2-NaOH-H2O [33]
0.0143–0.33023.21–9.03CO2-NH3-H2O [23]
0.0183–0.05200.063–3.80CO2-MEA-CaCl2-H2O [This work]

