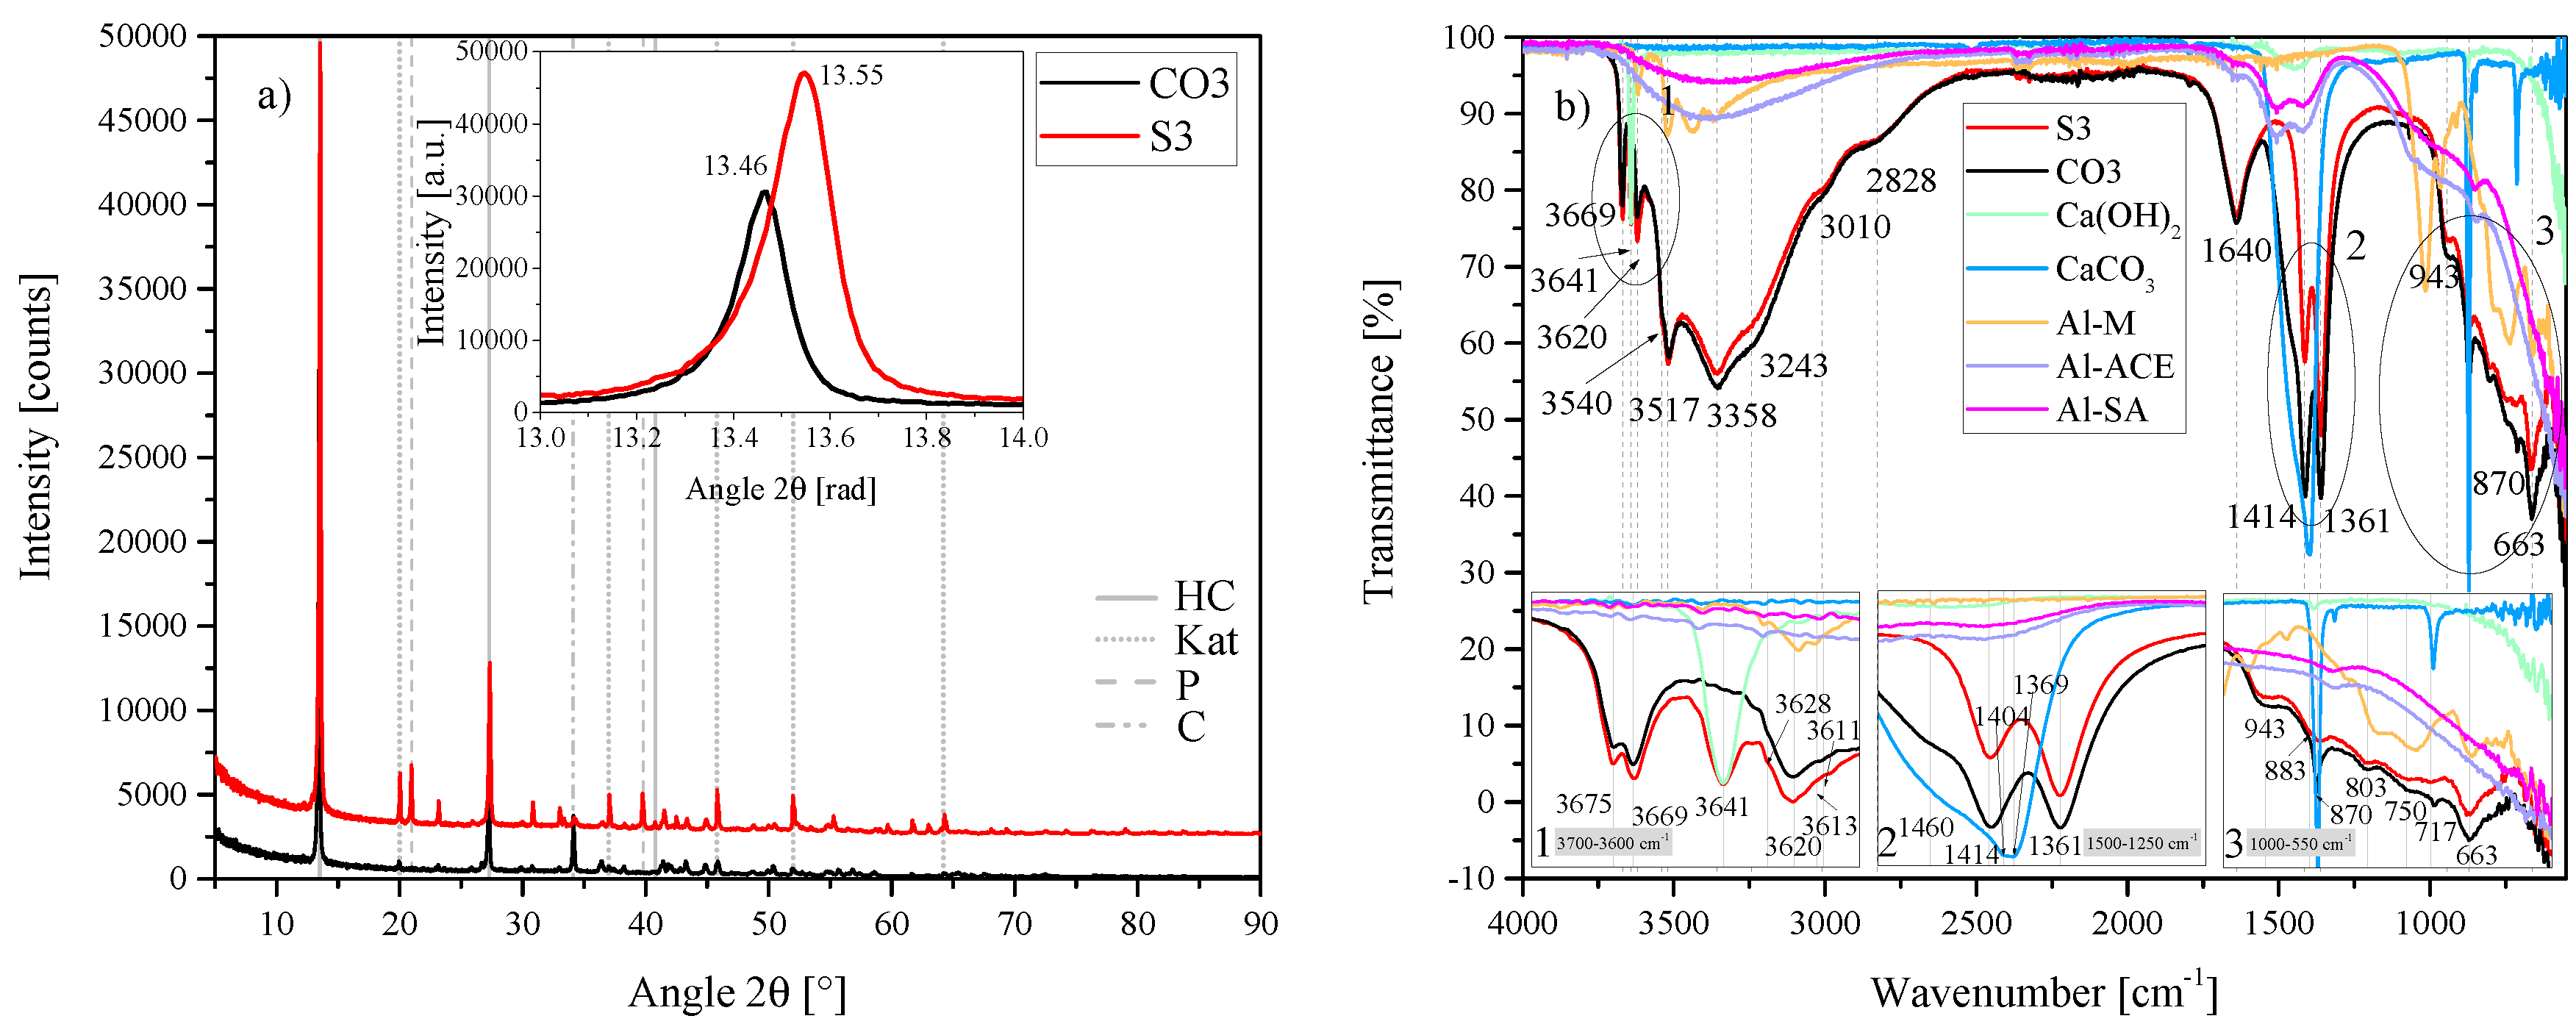
Figure 1.
(a) XRD results of the three standard hydrocalumite (HC) layered double hydroxides (LDHs) S1, S2 and S3 between 5 2 and 90 2. Each scan is y-shifted by 2500 counts. The inset depicts the primary LDH peaks and change in position. HC = hydrocalumite, Kat = katoite, P = portlandite and C = calcite. (b) FTIR-ATR scans of the three standard HC LDHs S1, S2 and S3 between 4000 and 550 . The three insets show the regions: (1) 3700 –3600 , (2) 1500 –1250 , (3) 1000 –550 in detail. Dashed and solid grey lines indicate the maxima of vibrations.
Figure 2.
(a) XRD results of the HC-CO3-LDH plotted against the standard HC LDH S2 between 5 2 and 90 2. Each scan is y-shifted by 2500 counts. The inset depicts the primary LDH peaks and change in position. HC = hydrocalumite, Kat = katoite, P = portlandite and C = calcite. (b) FTIR-ATR scans of the HC-CO3-LDH plotted against the standard HC LDH S2 and the starting materials used (Al(OH)3, Ca(OH)2 and CaCO3) between 4000 and 550 . The three insets show the regions: (1) 3700 – 3600 , (2) 1500 – 1250 , (3) 1000 – 550 in detail. Dashed and solid grey lines indicate the maxima of vibrations.
Figure 3.
SEM micrographs of the HC LDHs S1, S2, S3 and CO3 at 1 keV and 2k magnification, and Ca(OH)2, Al(OH)3-SA (amorphous) and CaCO3 at 1 kEV and 10k magnification. The scale bar is indicated under the label. LDH: turquoise hexagon, katoite: turquoise circle, calcite: turquoise asterisk.
Figure 3.
SEM micrographs of the HC LDHs S1, S2, S3 and CO3 at 1 keV and 2k magnification, and Ca(OH)2, Al(OH)3-SA (amorphous) and CaCO3 at 1 kEV and 10k magnification. The scale bar is indicated under the label. LDH: turquoise hexagon, katoite: turquoise circle, calcite: turquoise asterisk.
Figure 4.
pHs of the standard HC LDHs S1, S2, S3 and CO3. The pH was adjusted to 25 C to facilitate comparison.
Figure 4.
pHs of the standard HC LDHs S1, S2, S3 and CO3. The pH was adjusted to 25 C to facilitate comparison.
Figure 5.
(a) XRD results of the temperature series T1, T2, T3, T4 and T5 between 5 2 and 90 2. Each scan is y-shifted by 2500 counts. The inset depicts the primary LDH peaks and change in position. HC = hydrocalumite, oHC = secondary HC-like phase, Kat = katoite, P = portlandite and C = calcite. (b) FTIR-ATR scans of the temperature series T1, T2, T3, T4 and T5 between 4000 and 550 . The three insets show the regions: (1) 3700 – 3600 , (2) 1500 – 1250 , (3) 1000 – 550 in detail. Dashed and solid grey lines indicate the maxima of vibrations. T1 = 20 C, T2 = 40 C, T3 = 60 C, T4 = 80 C and T5 = 90 C.
Figure 6.
SEM micrographs of the HC LDHs T1 = 20 C, T2 = 40 C, T3 = 60 C, T4 = 80 C and T5 = 90 C at 1 keV and 2k magnification. The scale bar is indicated under the label.
Figure 6.
SEM micrographs of the HC LDHs T1 = 20 C, T2 = 40 C, T3 = 60 C, T4 = 80 C and T5 = 90 C at 1 keV and 2k magnification. The scale bar is indicated under the label.
Figure 7.
pHs of the temperature series of LDHs T1 = 20 C, T2 = 40 C, T3 = 60 C, T4 = 80 C and T5 = 90 C. The pH was adjusted to 25 C to facilitate comparison.
Figure 7.
pHs of the temperature series of LDHs T1 = 20 C, T2 = 40 C, T3 = 60 C, T4 = 80 C and T5 = 90 C. The pH was adjusted to 25 C to facilitate comparison.
Figure 8.
(a) XRD results of the time series t1, t2 and t3 between 5 2 and 90 2. Each scan is y-shifted by 2500 counts. The inset depicts the primary LDH peaks and change in position. HC = hydrocalumite, Kat = katoite, P = portlandite and C = calcite. (b) FTIR-ATR scans of the time series t1, t2 and t3 between 4000 and 550 . The three insets show the regions: (1) 3700 – 3600 , (2) 1500 – 1250 , (3) 1000 – 550 in detail. Dashed and solid grey lines indicate the maxima of vibrations. t1 = 1 h, t2 = 3 h and t3 = 6 h.
Figure 9.
SEM micrographs of the time series of HC LDHs t1 = 1 h, t2 = 3 h and t3 = 6 h at 1 keV and 2k magnification. The scale bar is indicated under the label.
Figure 9.
SEM micrographs of the time series of HC LDHs t1 = 1 h, t2 = 3 h and t3 = 6 h at 1 keV and 2k magnification. The scale bar is indicated under the label.
Figure 10.
pHs of the time series of LDHs t1 = 1 h, t2 = 3 h and t3 = 6 h. The pH was adjusted to 25 C to facilitate comparison.
Figure 10.
pHs of the time series of LDHs t1 = 1 h, t2 = 3 h and t3 = 6 h. The pH was adjusted to 25 C to facilitate comparison.
Figure 11.
(a) XRD results of the molar calcium-to-aluminium ratio series MR1, MR2 and MR3 between 5 2 and 90 2. Each scan is y-shifted by 2500 counts. The inset depicts the primary LDH peaks and change in position. HC = hydrocalumite, Kat = katoite, P = portlandite and C = calcite. (b) FTIR-ATR scans of the molar calcium-to-aluminium ratio series MR1, MR2 and MR3 between 4000 and 550 . The three insets show the regions: (1) 3700 – 3600 , (2) 1500 – 1250 , (3) 1000 – 550 in detail. Dashed and solid grey lines indicate the maxima of vibrations. MR1 = 3:2, MR2 = 4:2 and MR3 = 6:2.
Figure 12.
SEM micrographs of the series of molar calcium-to-aluminium ratio MR1 = 3:2, MR2 = 4:2 and MR3 = 6:2 at 1 keV and 2k magnification. The scale bar is indicated under the label.
Figure 12.
SEM micrographs of the series of molar calcium-to-aluminium ratio MR1 = 3:2, MR2 = 4:2 and MR3 = 6:2 at 1 keV and 2k magnification. The scale bar is indicated under the label.
Figure 13.
pHs of the molar calcium-to-aluminium series of LDHs MR1 = 3:2, MR2 = 4:2 and MR3 = 6:2. The pH was adjusted to 25 C to facilitate comparison.
Figure 13.
pHs of the molar calcium-to-aluminium series of LDHs MR1 = 3:2, MR2 = 4:2 and MR3 = 6:2. The pH was adjusted to 25 C to facilitate comparison.
Figure 14.
(a) XRD results of the Al sources used for the synthesis of A1, A2 and A3. SA = amorphous, ACE = boehmite and M = gibbsite—Sigma Aldrich (SA), ACE Chemicals (ACE) and Merck (M). Each scan is y-shifted by 2500 counts. (b) Isotherms obtained for each Al source. Sigma Aldrich (SA), ACE Chemicals (ACE) and Merck (M).
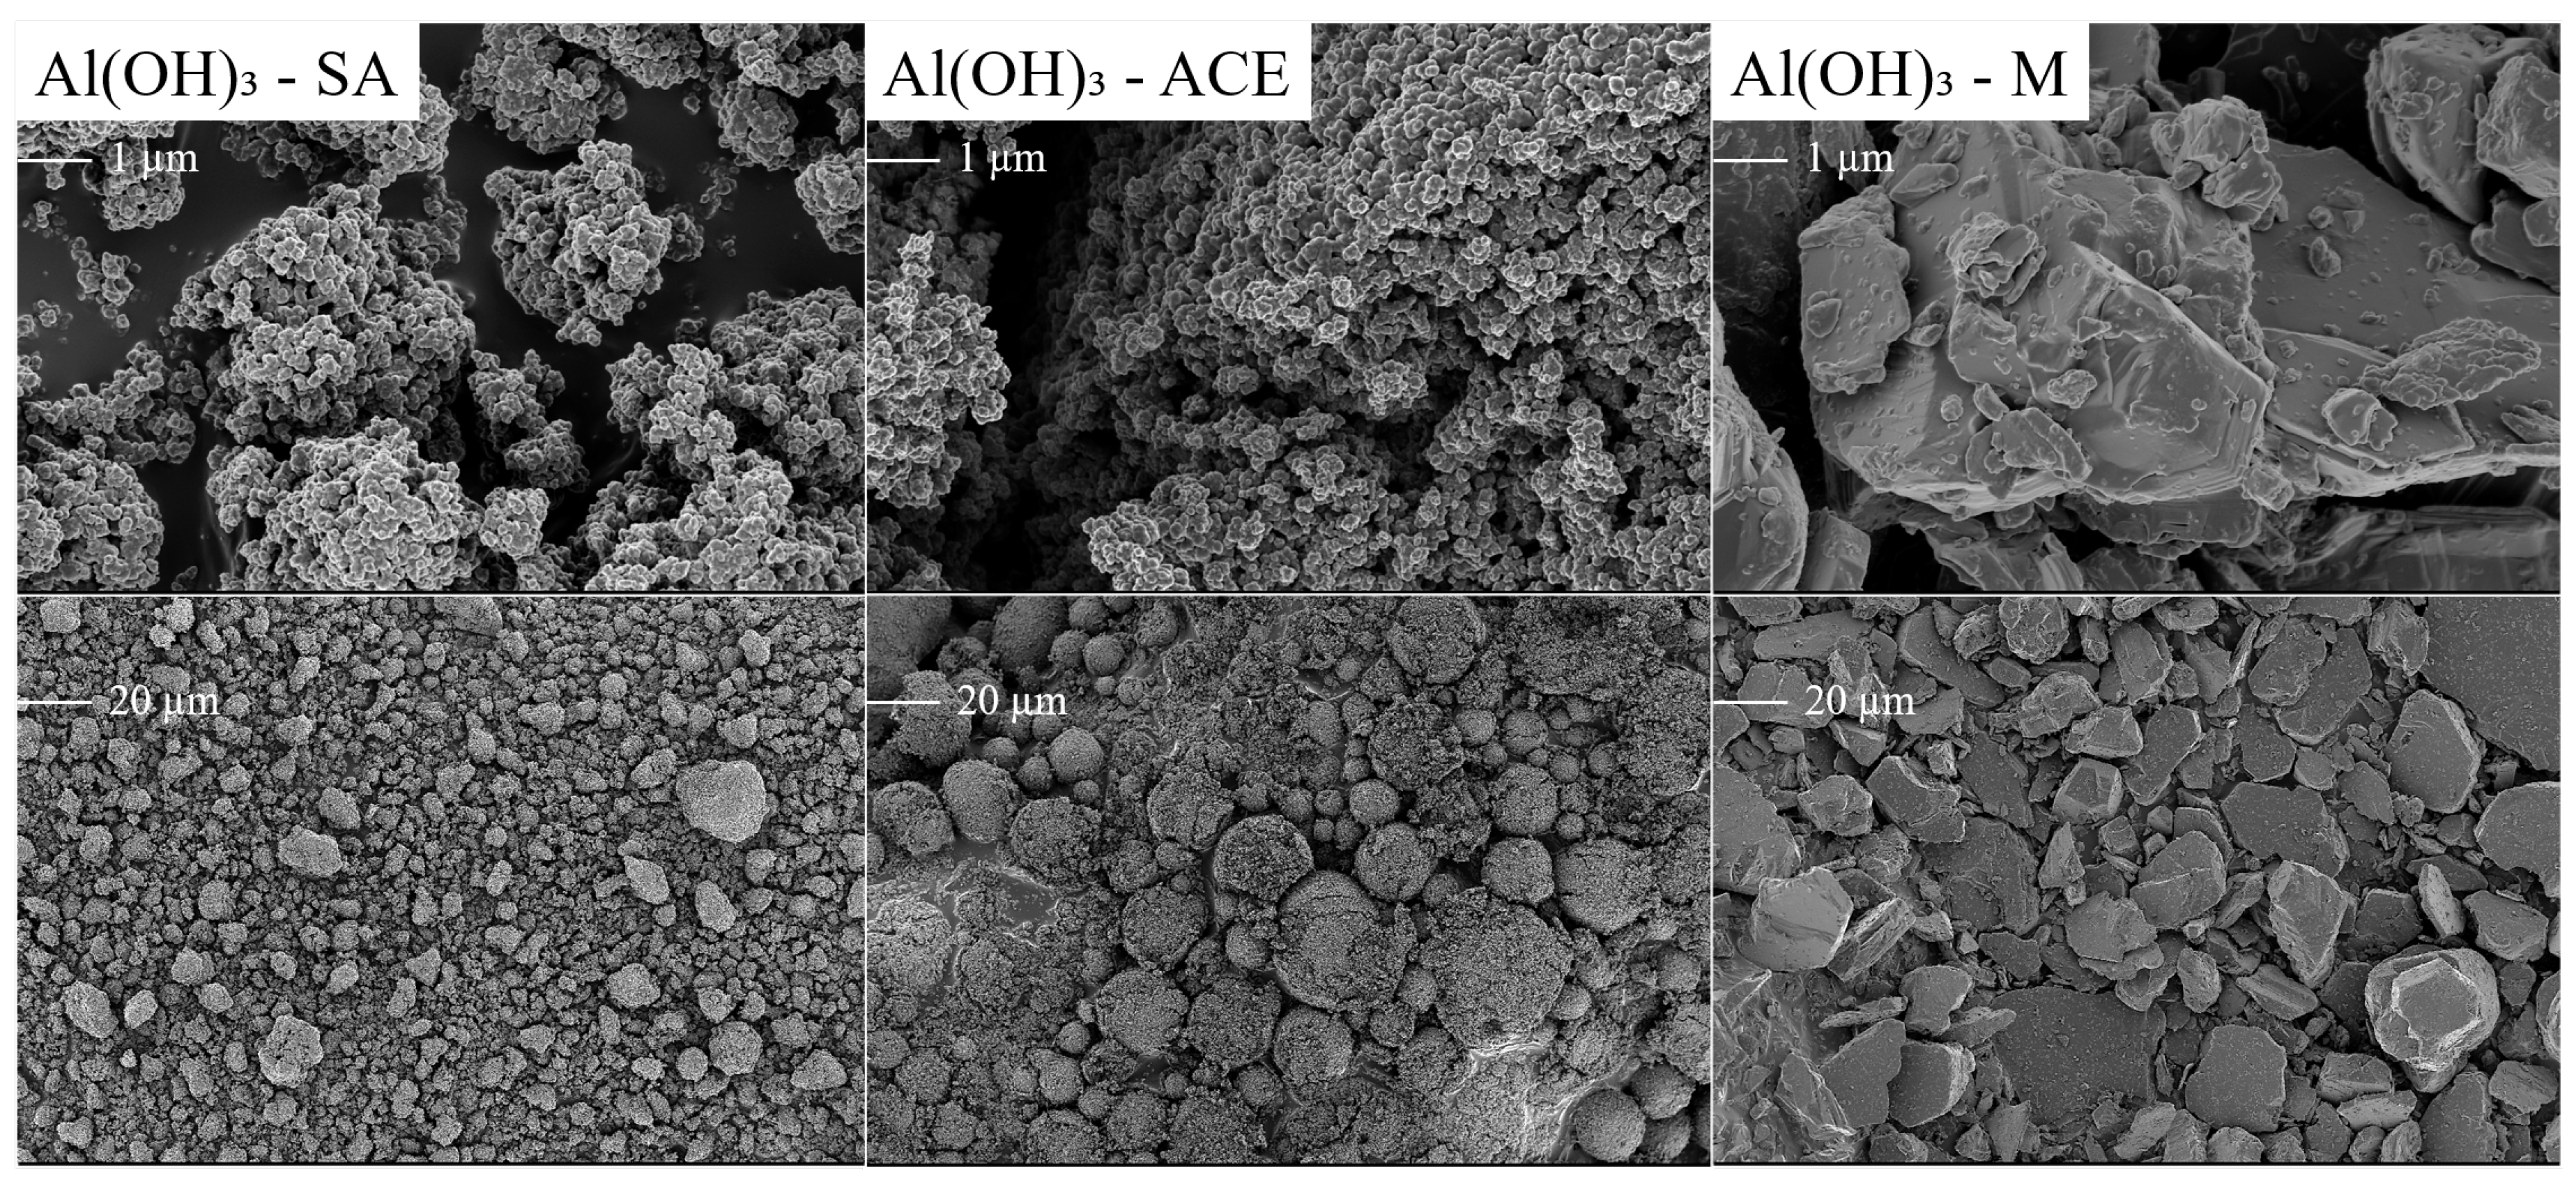
Figure 15.
SEM micrographs of the three different Al(OH)3 sources used from Sigma Aldrich (SA), ACE Chemicals (ACE) and Merck (M) taken at 1 keV and 10k (top) and 500 times (bottom) magnification. The scale bar is indicated on each micrograph.
Figure 15.
SEM micrographs of the three different Al(OH)3 sources used from Sigma Aldrich (SA), ACE Chemicals (ACE) and Merck (M) taken at 1 keV and 10k (top) and 500 times (bottom) magnification. The scale bar is indicated on each micrograph.
Figure 16.
(a) XRD results of the chemical morphology/crystallinity of Al(OH)3 series A1, A2 and A3 between 5 2 and 90 2. Each scan is y-shifted by 2500 counts. The inset depicts the primary LDH peaks and change in position. HC = hydrocalumite, HC2 = hydrocalumite phase 2, Kat = katoite, P = portlandite, C = calcite and G = gibbsite. (b) FTIR-ATR scans of the chemical morphology/crystallinity of Al(OH)3 A1, A2 and A3 between 4000 and 550 . The three insets show the regions: (1) 3700 – 3600 , (2) 1500 – 1250 , (3) 1200 – 550 in detail. Dashed and solid grey lines indicate the maxima of vibrations. A1 = Al(OH)3-SA, A2 = Al(OH)3-ACE and A3 = Al(OH)3-SA.
Figure 17.
SEM micrographs of the chemical morphology/crystallinity of Al(OH)3 series A1 = SA, A2 = ACE and A3 = M taken at 1 keV and 2k magnification. The scale bar is indicated below the label.
Figure 17.
SEM micrographs of the chemical morphology/crystallinity of Al(OH)3 series A1 = SA, A2 = ACE and A3 = M taken at 1 keV and 2k magnification. The scale bar is indicated below the label.
Figure 18.
pHs of the morphology/crystallinity of Al(OH)3 series of LDHs A1 = SA, A2 = ACE and A3 = M. The pH was adjusted to 25 C to facilitate comparison.
Figure 18.
pHs of the morphology/crystallinity of Al(OH)3 series of LDHs A1 = SA, A2 = ACE and A3 = M. The pH was adjusted to 25 C to facilitate comparison.
Figure 19.
(a) XRD results of the mixing series M1, M2 and M3 between 5 2 and 90 2. Each scan is y-shifted by 2500 counts. The inset depicts the primary LDH peaks and change in position. HC = hydrocalumite, Kat = katoite, P = portlandite and C = calcite. (b) FTIR-ATR scans of the mixing series M1, M2 and M3 between 4000 and 550 . The three insets show the regions: (1) 3700 – 3600 , (2) 1500 – 1250 , (3) 1000 – 550 in detail. Dashed and solid grey lines indicate the maxima of vibrations. M1 = 500 rpm, WS2 = 750 rpm and WS3 = 1000 rpm.
Figure 20.
SEM micrographs of the mixing series M1 = 500 rpm, M2 = 750 rpm and M3 = 1000 rpm taken at 1 keV and 2k magnification. The scale bar is indicated below the label.
Figure 20.
SEM micrographs of the mixing series M1 = 500 rpm, M2 = 750 rpm and M3 = 1000 rpm taken at 1 keV and 2k magnification. The scale bar is indicated below the label.
Figure 21.
pHs of the mixing series of LDHs M1 = 500 rpm, M2 = 750 rpm and M3 = 1000 rpm. The pH was adjusted to 25 C to facilitate comparison.
Figure 21.
pHs of the mixing series of LDHs M1 = 500 rpm, M2 = 750 rpm and M3 = 1000 rpm. The pH was adjusted to 25 C to facilitate comparison.
Figure 22.
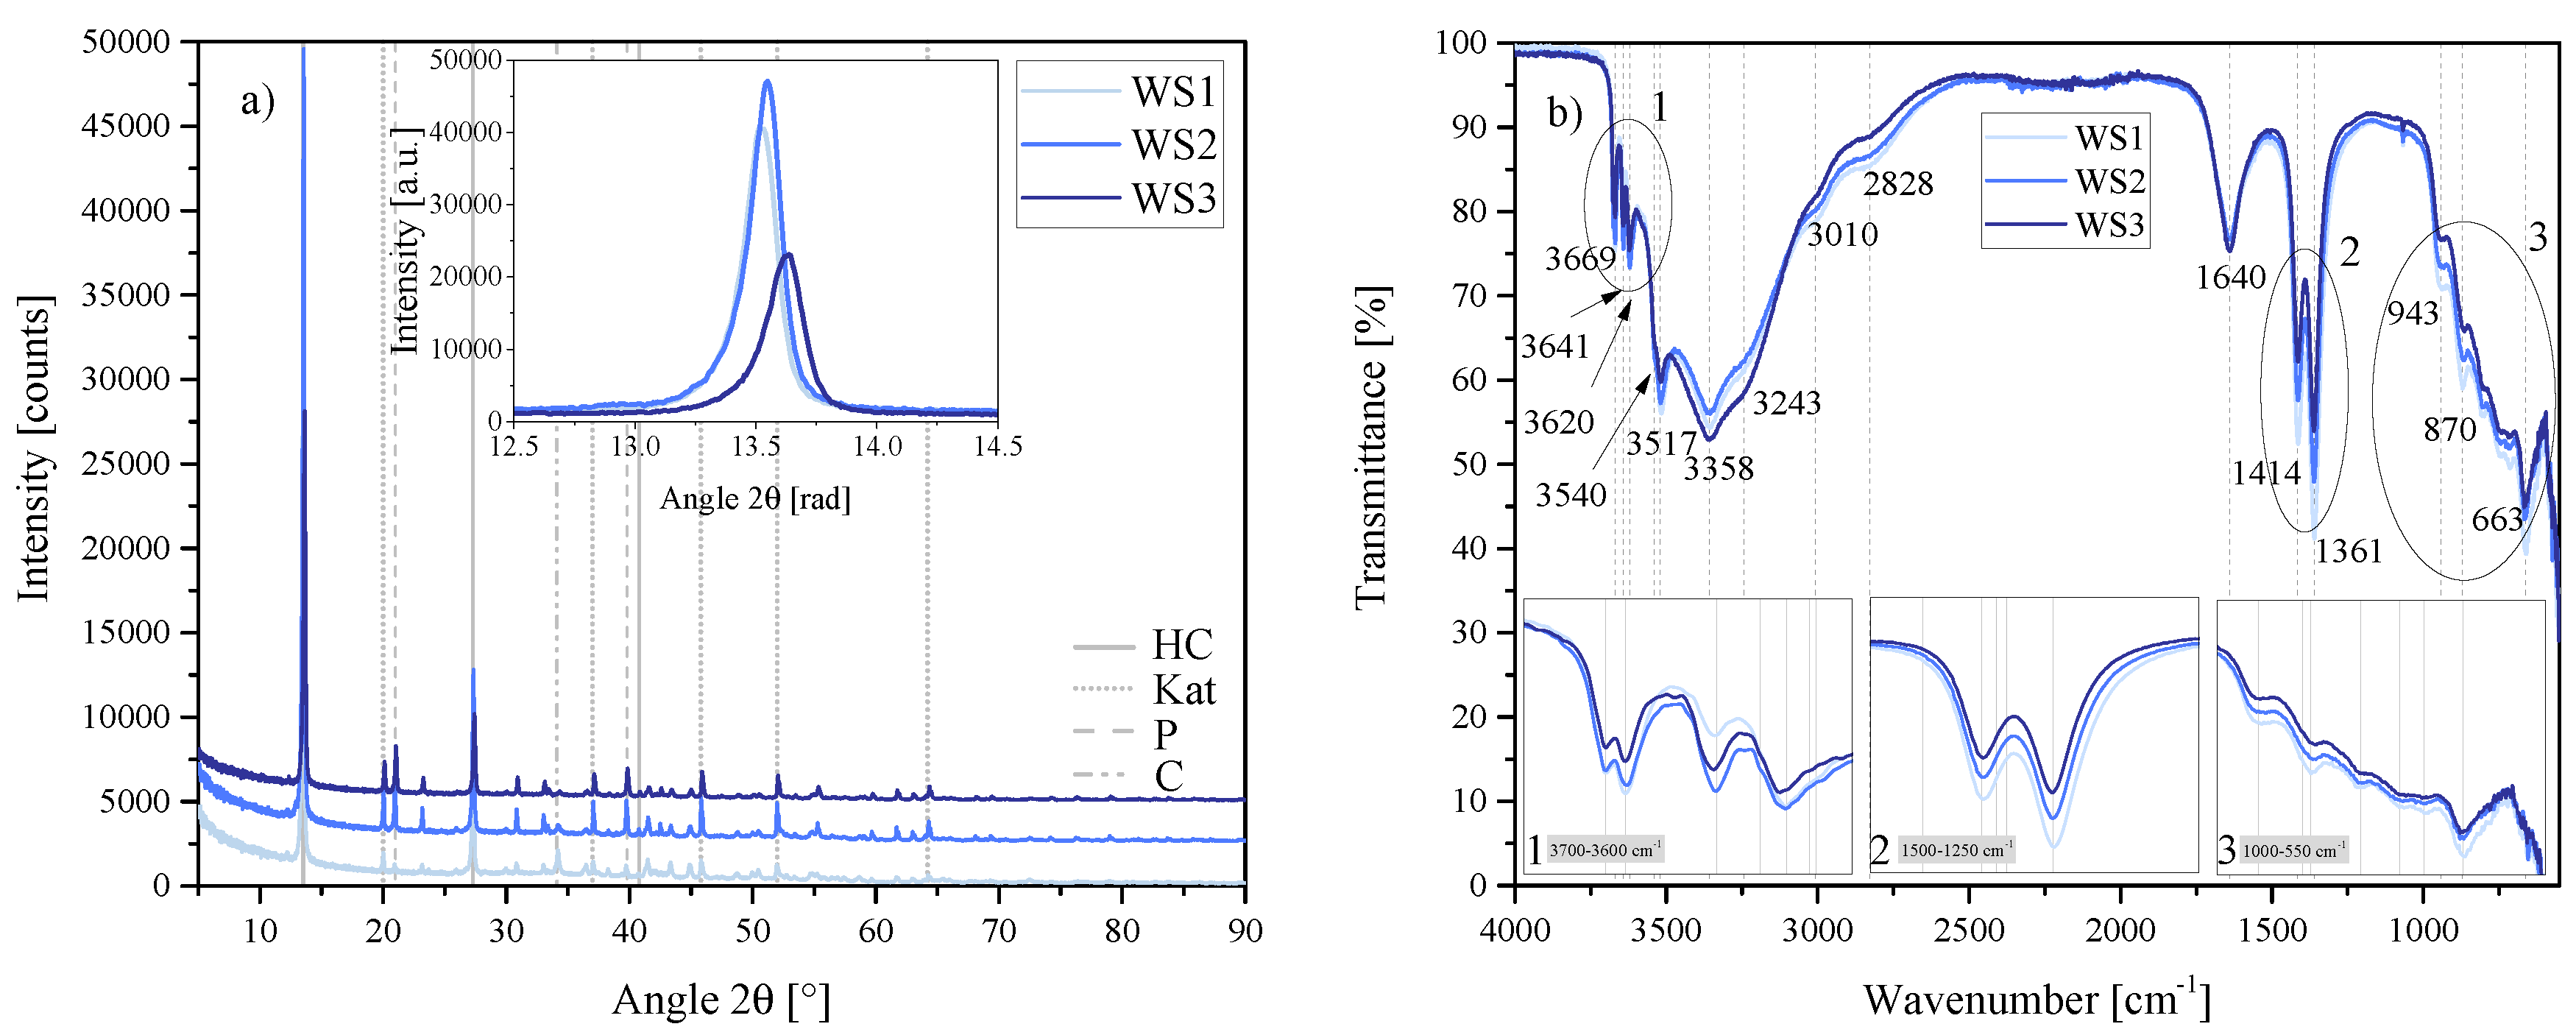
(a) XRD results of the water-to-solids ratio series WS1, WS2 and WS3 between 5 2 and 90 2. Each scan is y-shifted by 2500 counts. The inset depicts the primary LDH peaks and change in position. HC = hydrocalumite, Kat = katoite, P = portlandite and C = calcite. (b) FTIR-ATR scans of the water-to-solids ratio series WS1, WS2 and WS3 between 4000 and 550 . The three insets show the regions: (1) 3700 – 3600 , (2) 1500 – 1250 , (3) 1000 – 550 in detail. Dashed and solid grey lines indicate the maxima of vibrations. WS1 = 70:30, WS2 = 80:20 and WS3 = 90:10.
Figure 22.
(a) XRD results of the water-to-solids ratio series WS1, WS2 and WS3 between 5 2 and 90 2. Each scan is y-shifted by 2500 counts. The inset depicts the primary LDH peaks and change in position. HC = hydrocalumite, Kat = katoite, P = portlandite and C = calcite. (b) FTIR-ATR scans of the water-to-solids ratio series WS1, WS2 and WS3 between 4000 and 550 . The three insets show the regions: (1) 3700 – 3600 , (2) 1500 – 1250 , (3) 1000 – 550 in detail. Dashed and solid grey lines indicate the maxima of vibrations. WS1 = 70:30, WS2 = 80:20 and WS3 = 90:10.
Figure 23.
SEM micrographs of the water-to-solids ratio series WS1 = 70:30, WS2 = 80:20 and WS3 = 90:10 taken at 1 keV and 2k magnification. The scale bar is indicated below the label.
Figure 23.
SEM micrographs of the water-to-solids ratio series WS1 = 70:30, WS2 = 80:20 and WS3 = 90:10 taken at 1 keV and 2k magnification. The scale bar is indicated below the label.
Figure 24.
pHs of the water-to-solids ratio series of LDHs WS1 = 70:30, WS2 = 80:20 and WS3 = 90:10. The pH was adjusted to 25 C to facilitate comparison.
Figure 24.
pHs of the water-to-solids ratio series of LDHs WS1 = 70:30, WS2 = 80:20 and WS3 = 90:10. The pH was adjusted to 25 C to facilitate comparison.
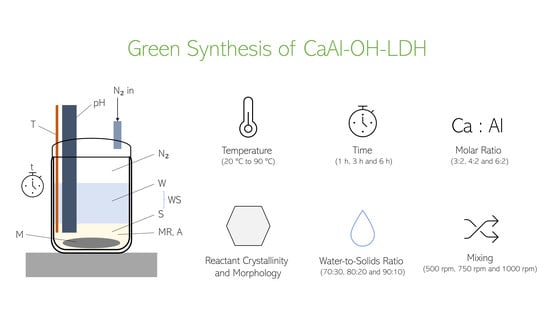
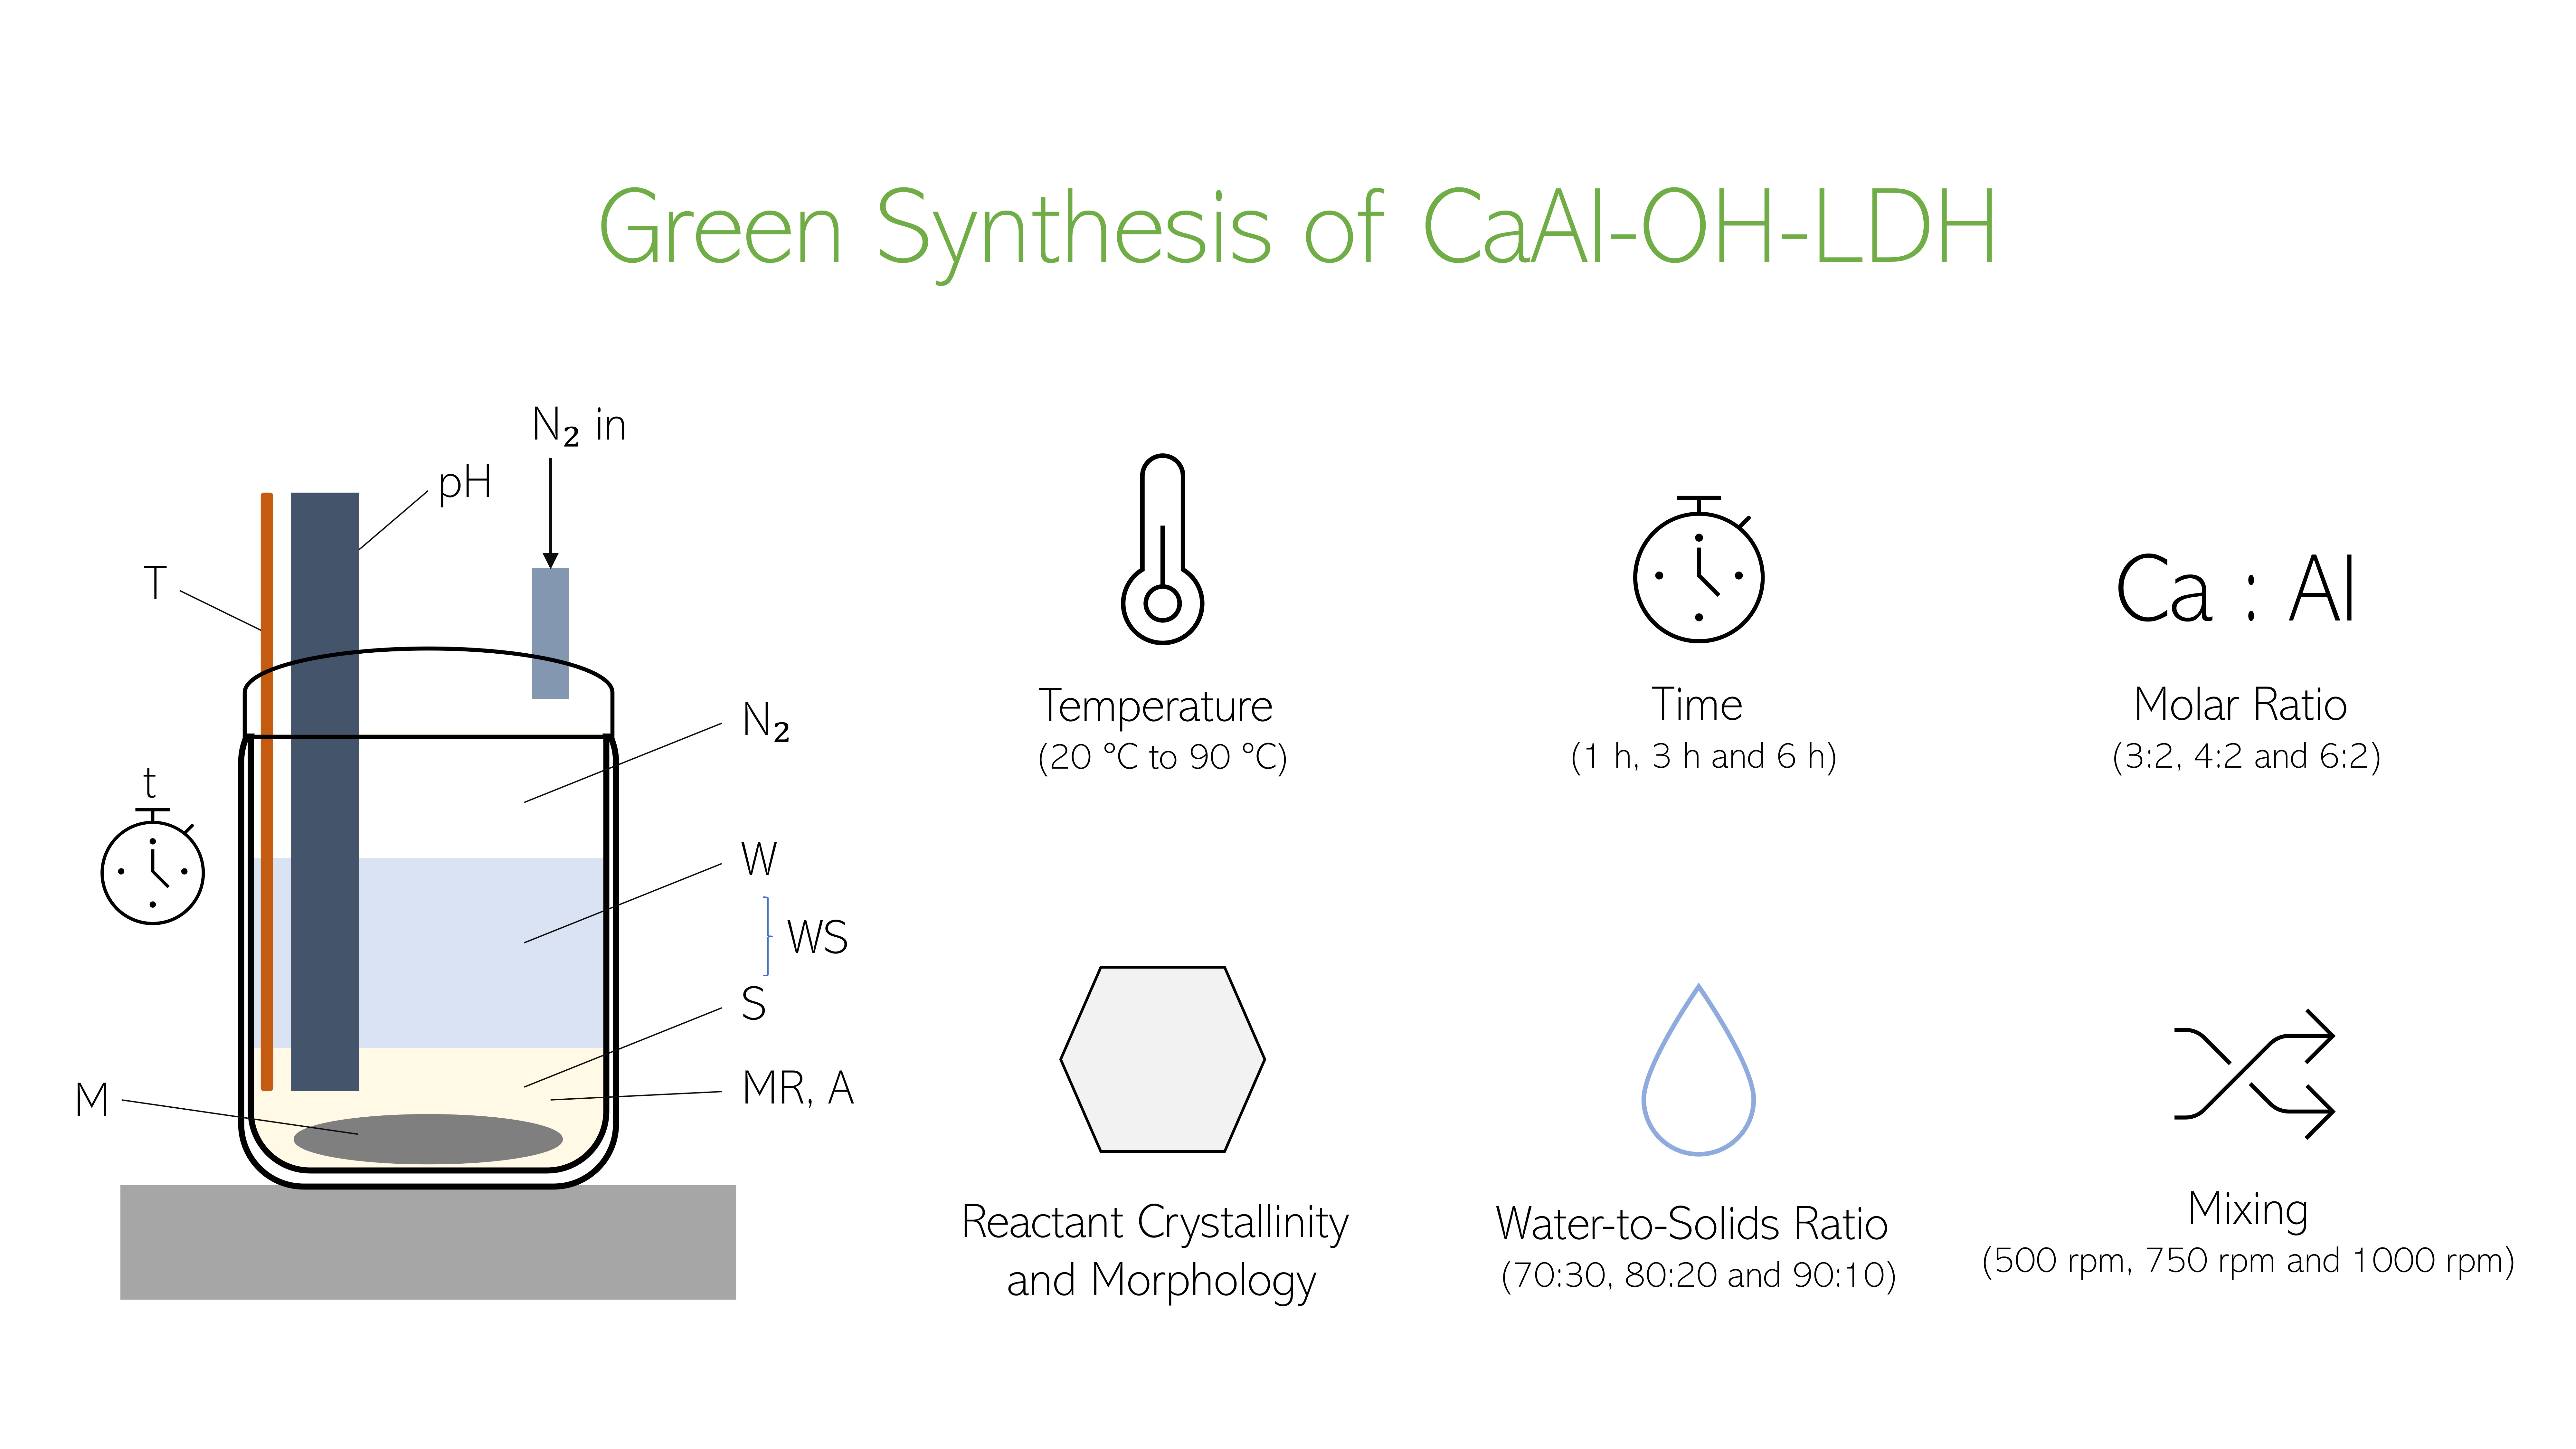
Figure 25.
Setup used for the synthesis of hydrocalumite.
Figure 25.
Setup used for the synthesis of hydrocalumite.
Table 1.
Rietveld refinement of the temperature series of LDHs T1 = 20 C, T2 = 40 C, T3 = 60 C, T4 = 80 C and T5 = 90 C. HC indicated the phase [Ca4Al2(OH)12][(CO3)·5H2O], oHC indicates the phase Ca4Al2(OH)12(OH)(CO3)0.5·4 H2O, Kat is katoite, P is portlandite and C is calcite. All values are given in percentages of the crystalline phases.
| | HC | oHC | Kat | P | C |
|---|
| T1 | 29.48 | 47.1 | 12.46 | 10.95 | |
| T2 | 30.14 | 24.22 | 32.57 | 13.07 | |
| T3 | 57.57 | | 28.8 | 11.37 | 2.26 |
| T4 | 61.5 | | 26.52 | 9.84 | 2.14 |
| T5 | 52.18 | | 29.52 | 10.36 | 8.24 |
Table 2.
Rietveld refinement of the time series of LDHs t1 = 1 h, t2 = 3 h and t3 = 6 h. HC indicates the phase [Ca4Al2(OH)12][(CO3)·5H2O], HC2 indicates the phase [Ca4Al2(OH)12][(CO3)0.5Cl4·8H2O], Kat is katoite, P is portlandite and C is calcite. All values are given in percentages of the crystalline phases.
| | HC | HC2 | Kat | P | C |
|---|
| t1 | 49.72 | | 37.39 | 10.47 | 2.42 |
| t2 | 61.5 | | 26.52 | 9.84 | 2.14 |
| t3 | 77.97 | 2.04 | 12.66 | 6.2 | 1.13 |
Table 3.
Rietveld refinement of the molar calcium-to-aluminium series of LDHs MR1 = 3:2, MR2 = 4:2 and MR3 = 6:2. HC indicates the phase [Ca4Al2(OH)12][(CO3)·5H2O], Kat is katoite, P is portlandite and C is calcite. All values are given in percentages of the crystalline phases.
Table 3.
Rietveld refinement of the molar calcium-to-aluminium series of LDHs MR1 = 3:2, MR2 = 4:2 and MR3 = 6:2. HC indicates the phase [Ca4Al2(OH)12][(CO3)·5H2O], Kat is katoite, P is portlandite and C is calcite. All values are given in percentages of the crystalline phases.
| | HC | Kat | P | C |
|---|
| MR1 | 84.91 | 14.59 | | 0.51 |
| MR2 | 61.5 | 26.52 | 9.84 | 2.14 |
| MR3 | 46.19 | 22.34 | 28.16 | 3.31 |
Table 4.
Rietveld refinement of the morphology/crystallinity series of LDHs A1 = SA, A2 = ACE and A3 = M. HC indicates the phase [Ca4Al2(OH)12][(CO3)·5H2O], HC2 is [Ca4Al2(OH)12][(CO3)0.5Cl4·8H2O], Kat is katoite, P is portlandite, C is calcite and G is gibbsite. All values are given in percentages of the crystalline phases.
| | HC | HC2 | Kat | P | C | G |
|---|
| A1 | 61.5 | | 26.52 | 9.84 | 2.14 | |
| A2 | 43.51 | 11 | 34.04 | 8.25 | 3.2 | |
| A3 | 27.9 | | 23.48 | 28.97 | | 19.65 |
Table 5.
Rietveld refinement of the mixing series of LDHs M1 = 500 rpm, M2 = 750 rpm and M3 = 1000 rpm. HC indicates the phase [Ca4Al2(OH)12][(CO3)·5H2O], Kat is katoite, P is portlandite and C is calcite. All values are given in percentages of the crystalline phases.
Table 5.
Rietveld refinement of the mixing series of LDHs M1 = 500 rpm, M2 = 750 rpm and M3 = 1000 rpm. HC indicates the phase [Ca4Al2(OH)12][(CO3)·5H2O], Kat is katoite, P is portlandite and C is calcite. All values are given in percentages of the crystalline phases.
| | HC | Kat | P | C |
|---|
| M1 | 58.29 | 28.77 | 11.61 | 1.33 |
| M2 | 61.5 | 26.52 | 9.84 | 2.14 |
| M3 | 59.83 | 27.74 | 10.36 | 2.07 |
Table 6.
Rietveld refinement of the water-to-solids ratio series of LDHs WS1 = 70:30, WS2 = 80:20 and WS3 = 90:10. HC indicates the phase [Ca4Al2(OH)12][(CO3)·5H2O], Kat is katoite, P is portlandite and C is calcite. All values are given in percentages of the crystalline phases.
Table 6.
Rietveld refinement of the water-to-solids ratio series of LDHs WS1 = 70:30, WS2 = 80:20 and WS3 = 90:10. HC indicates the phase [Ca4Al2(OH)12][(CO3)·5H2O], Kat is katoite, P is portlandite and C is calcite. All values are given in percentages of the crystalline phases.
| | HC | Kat | P | C |
|---|
| WS1 | 73.48 | 14.64 | 1.91 | 9.98 |
| WS2 | 61.5 | 26.52 | 9.84 | 2.14 |
| WS3 | 54.59 | 32.39 | 13.02 | |
Table 7.
Experimental conditions used for each of the experiments performed. The experiment IDs and colour codes defined in the table were used for each experiment in the text. Purple: molar Ca:Al ratio, red: temperature, green: time, blue: water: solids ratio, brown: Al source, grey: mixing. Note: S1, S2, S3 = MR2, T4, t2, WS2, A1 and M2. *Ca(OH)2 used in CO3 was partially substituted with CaCO3 as described in the text to achieve stoichiometric carbonate intercalation.
| ID | Molar Ca:Al Ratio [-] | Temperature [] | Time [h] | Water: Solids Ratio [-] | Al Source [-] | Mixing [rpm] |
|---|
| S1, S2, S3, CO3* | 2 | 80 | 3 | 80:20 | SA | 750 |
| MR1 | 1.5 | 80 | 3 | 80:20 | SA | 750 |
| MR2 | 2 | 80 | 3 | 80:20 | SA | 750 |
| MR3 | 3 | 80 | 3 | 80:20 | SA | 750 |
| T1 | 2 | 25 | 3 | 80:20 | SA | 750 |
| T2 | 2 | 40 | 3 | 80:20 | SA | 750 |
| T3 | 2 | 60 | 3 | 80:20 | SA | 750 |
| T4 | 2 | 80 | 3 | 80:20 | SA | 750 |
| T5 | 2 | 90 | 3 | 80:20 | SA | 750 |
| t1 | 2 | 80 | 1 | 80:20 | SA | 750 |
| t2 | 2 | 80 | 3 | 80:20 | SA | 750 |
| t3 | 2 | 80 | 6 | 80:20 | SA | 750 |
| WS1 | 2 | 80 | 3 | 70:30 | SA | 750 |
| WS2 | 2 | 80 | 3 | 80:20 | SA | 750 |
| WS3 | 2 | 80 | 3 | 90:10 | SA | 750 |
| A1 | 2 | 80 | 3 | 80:20 | SA | 750 |
| A2 | 2 | 80 | 3 | 80:20 | ACE | 750 |
| A3 | 2 | 80 | 3 | 80:20 | M | 750 |
| M1 | 2 | 80 | 3 | 80:20 | SA | 500 |
| M2 | 2 | 80 | 3 | 80:20 | SA | 750 |
| M3 | 2 | 80 | 3 | 80:20 | SA | 1000 |


