Article

Amplitude Dependent Internal Friction in Strained Magnesium Alloys of AZ Series

by
Milan Uhríčik
1,*,
Zuzana Dresslerová
1,
Peter Palček
1,
Mária Chalupová
1,
Zuzanka Trojanová
2 and
Patrícia Hanusová
1
1
Department of Materials Engineering, Faculty of Mechanical Engineering, University of Žilina, Univerzitná 8215/1, 010 26 Žilina, Slovakia
2
Faculty of Mathematics and Physics, Charles University, Ke Karlovu 5, 121 16 Praha 2, Czech Republic
*
Author to whom correspondence should be addressed.
Crystals 2020, 10(7), 608; https://doi.org/10.3390/cryst10070608
Submission received: 31 May 2020 / Revised: 8 July 2020 / Accepted: 11 July 2020 / Published: 13 July 2020
(This article belongs to the Special Issue Study Properties of Hexagonal Single Crystals and Polycrystals)

Abstract

:
Amplitude dependent internal friction (ADIF) was measured in three AZ magnesium alloys. Two types of experiments were performed: ADIF was measured step by step with the increasing strain amplitude and ADIF was measured after predeformation of samples in torsion. All experiments were done at room temperature. The quality factor was used as a measure of internal friction (IF). The quality factor decreased in the region of smaller amplitudes, and approaching some critical amplitude, εcr, rapidly increased. This critical amplitude increased with increasing maximum strain amplitude and predeformation of samples up to ~6%. Such behavior can be explained by considering mobile solute atoms, which may migrate along the dislocation line in the region of smaller amplitudes and perpendicular to the dislocation line in the region of higher amplitudes. A competition between dragging and depinning of solute atoms with dislocation lines may very well explain the measured dependencies.

1. Introduction

The lightest commercial structural alloys, magnesium alloys, offer lightweight, high specific stiffness, strength, and good machinability. Due to these properties, magnesium materials are the focus of engineers and designers [1,2,3,4,5], and their applications allow for energy savings in transport facilities. Nowadays, magnesium alloys due to their non-toxicity have become interesting materials for applications in medicine as biodegradable implants or coronary stents [6,7,8,9]. On the other hand, mechanical properties like low yield strength, low fatigue strength, and poor ductility at low temperatures are still their main disadvantages. Magnesium alloys, especially the AZ series (Mg–Al–Zn), which have been widely used in the automotive industry including parts such as steering wheels, steering column parts, instrument panels, seats, gear boxes, and others [10]. With increasing Al content, the strength of alloys increases while lower Al content is favorable for material plasticity. Mechanical properties of AZ magnesium alloys can be improved using some thermal treatments. Heat treatment is one of the most effective means for changing the microstructure to meet the requirement of the special mechanical properties. In addition, it is necessary to note that the other favorable property of AZ designation alloys is their relatively simple precipitation process [1,2,3,4,5,6,7,8,9,10,11,12,13,14].
With the evolution of modern industry and transportation, noise pollution has become one of the major environmental problems [15]. The development and application of high damping materials (HIDAMATs) is one of the most effective measures at reducing noise and vibrations. Moreover, it is necessary to point out that the high damping properties of magnesium alloys are not features that are available for other metallic structural materials [15,16].
Damping capacity or internal friction is usually measured depending on temperature (TDIF) or frequency (FDIF); in fewer cases, amplitude dependent internal friction (ADIF) has been studied. ADIF is usually interpreted on the basis of the Granato and Lücke model (G–L model), which describes dislocation–solute atom interactions [17,18,19]. The original model deals with the break-away of moving dislocations from static pinning points (solute atoms) in the glide plane. This model has been refined several times with the aim to express other aspects of this process such as thermally activated break-away of dislocations from solute atoms or their small clusters, dragging of solute atoms with dislocations, and diffusion of solute atoms at elevated temperatures [20,21,22,23,24,25]. Data concerning the ADIF of magnesium alloys of the AZ series have been reported in several papers [26,27,28,29]. ADIF strongly depends on the microstructure of samples. This connection is, in principle, a complex problem which has not been satisfactorily solved on the general level up to now.
In this work, ADIF was measured for three magnesium alloys of the AZ series, which were submitted to homogenization annealing. We studied the influence of predeformation in the compression on the ADIF curves with the aim to find out how the changes in the microstructure may affect the internal friction characteristics.

2. Materials and Methods

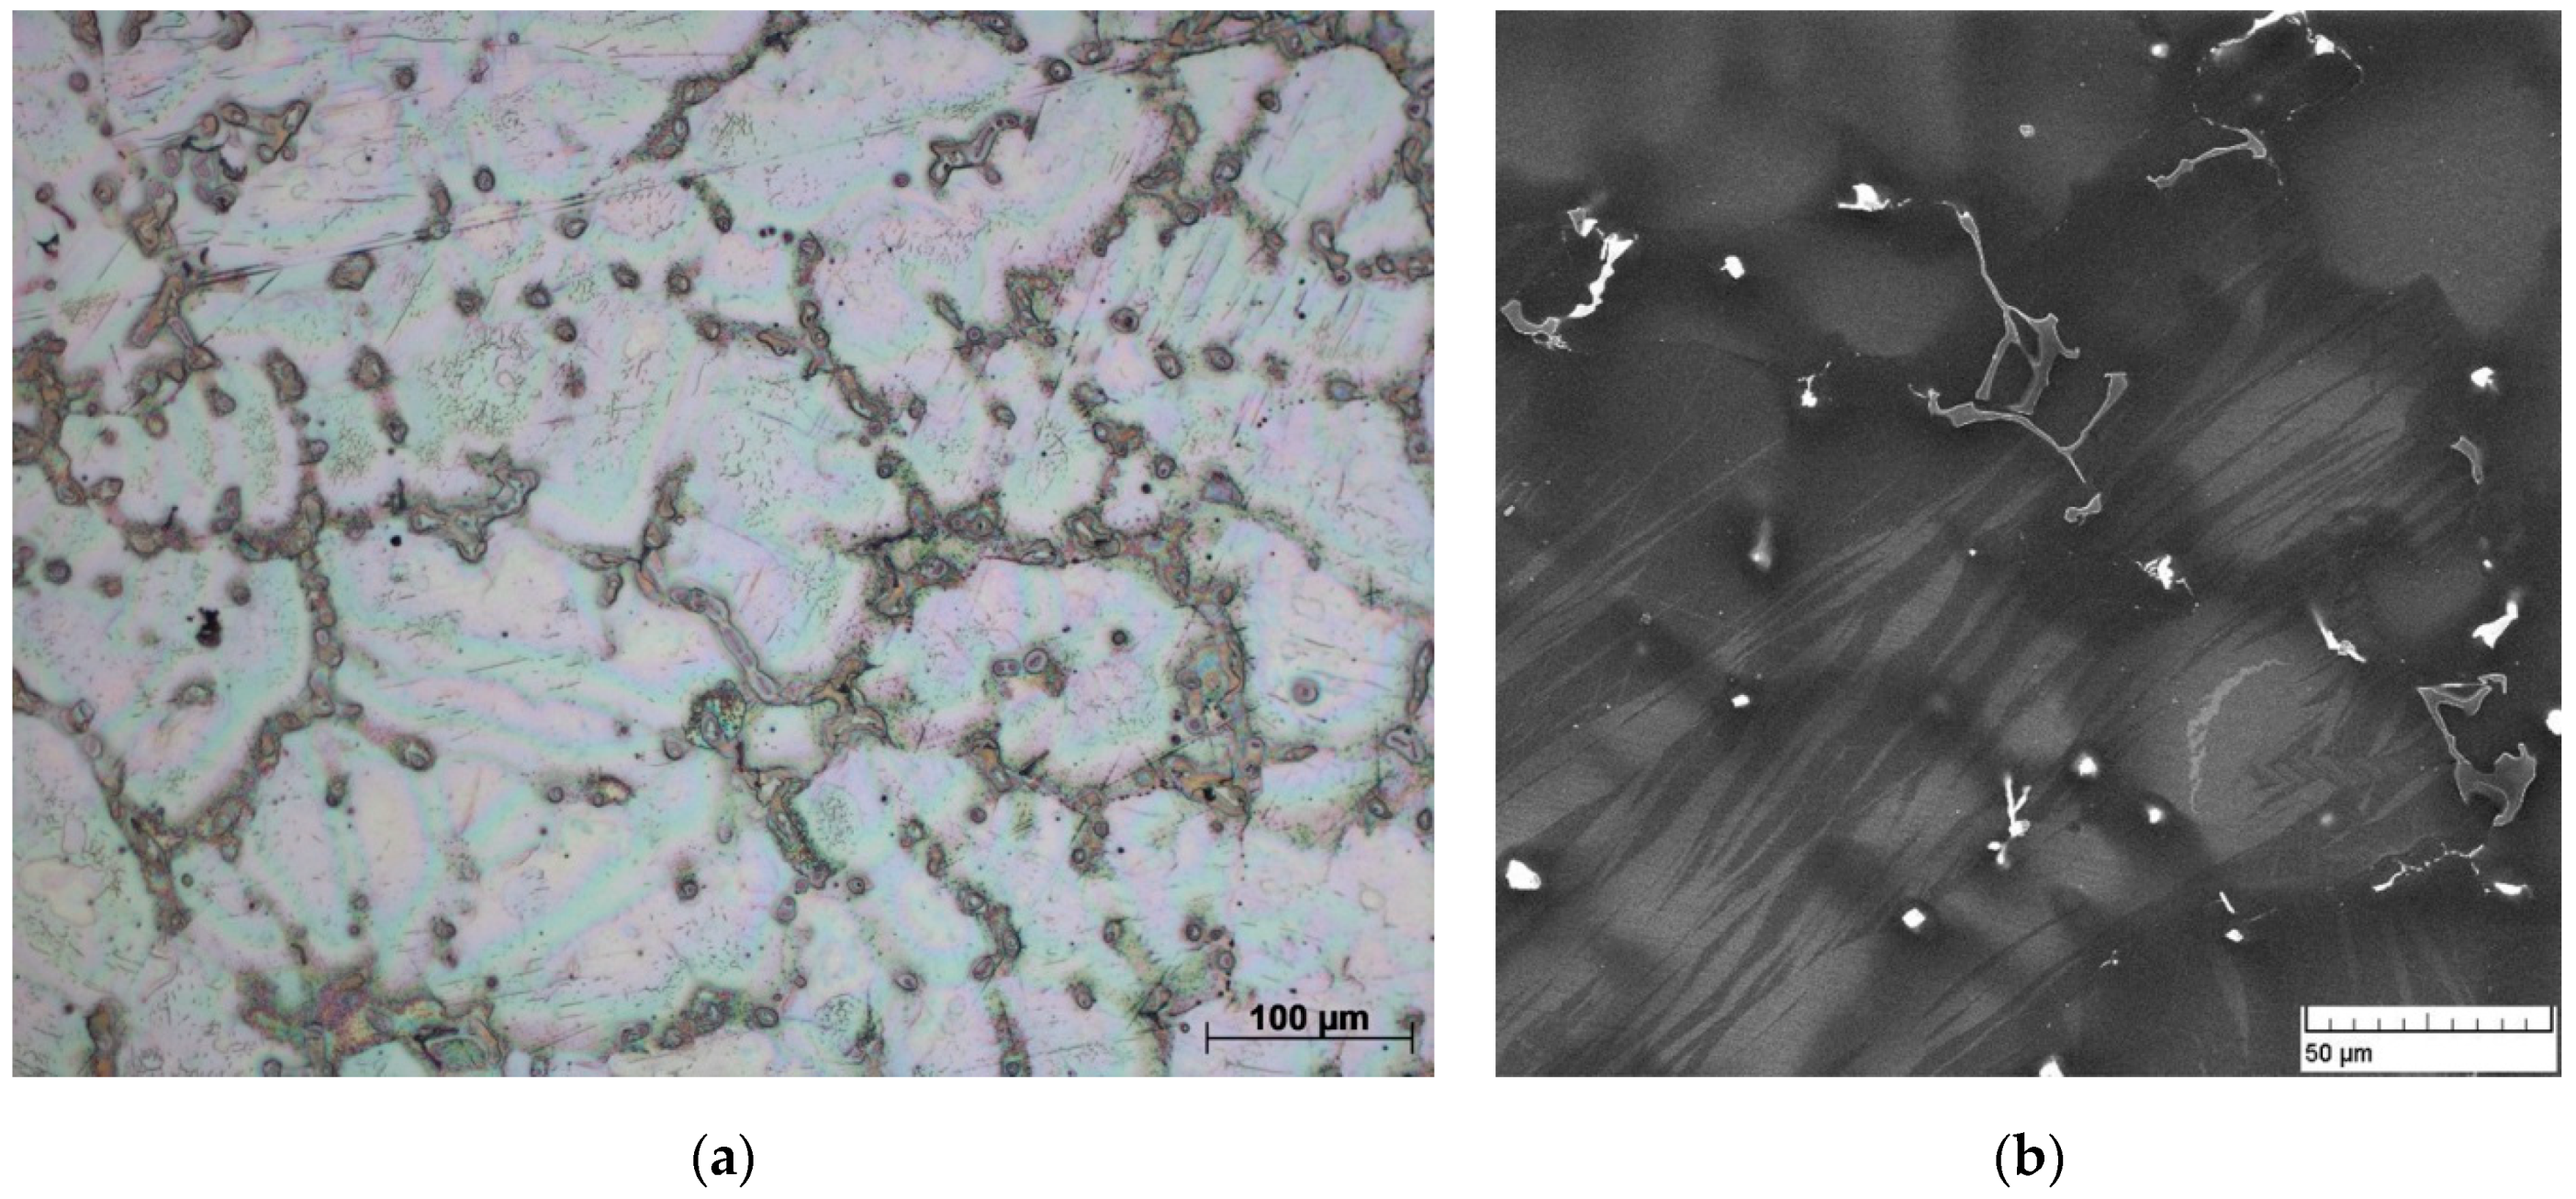
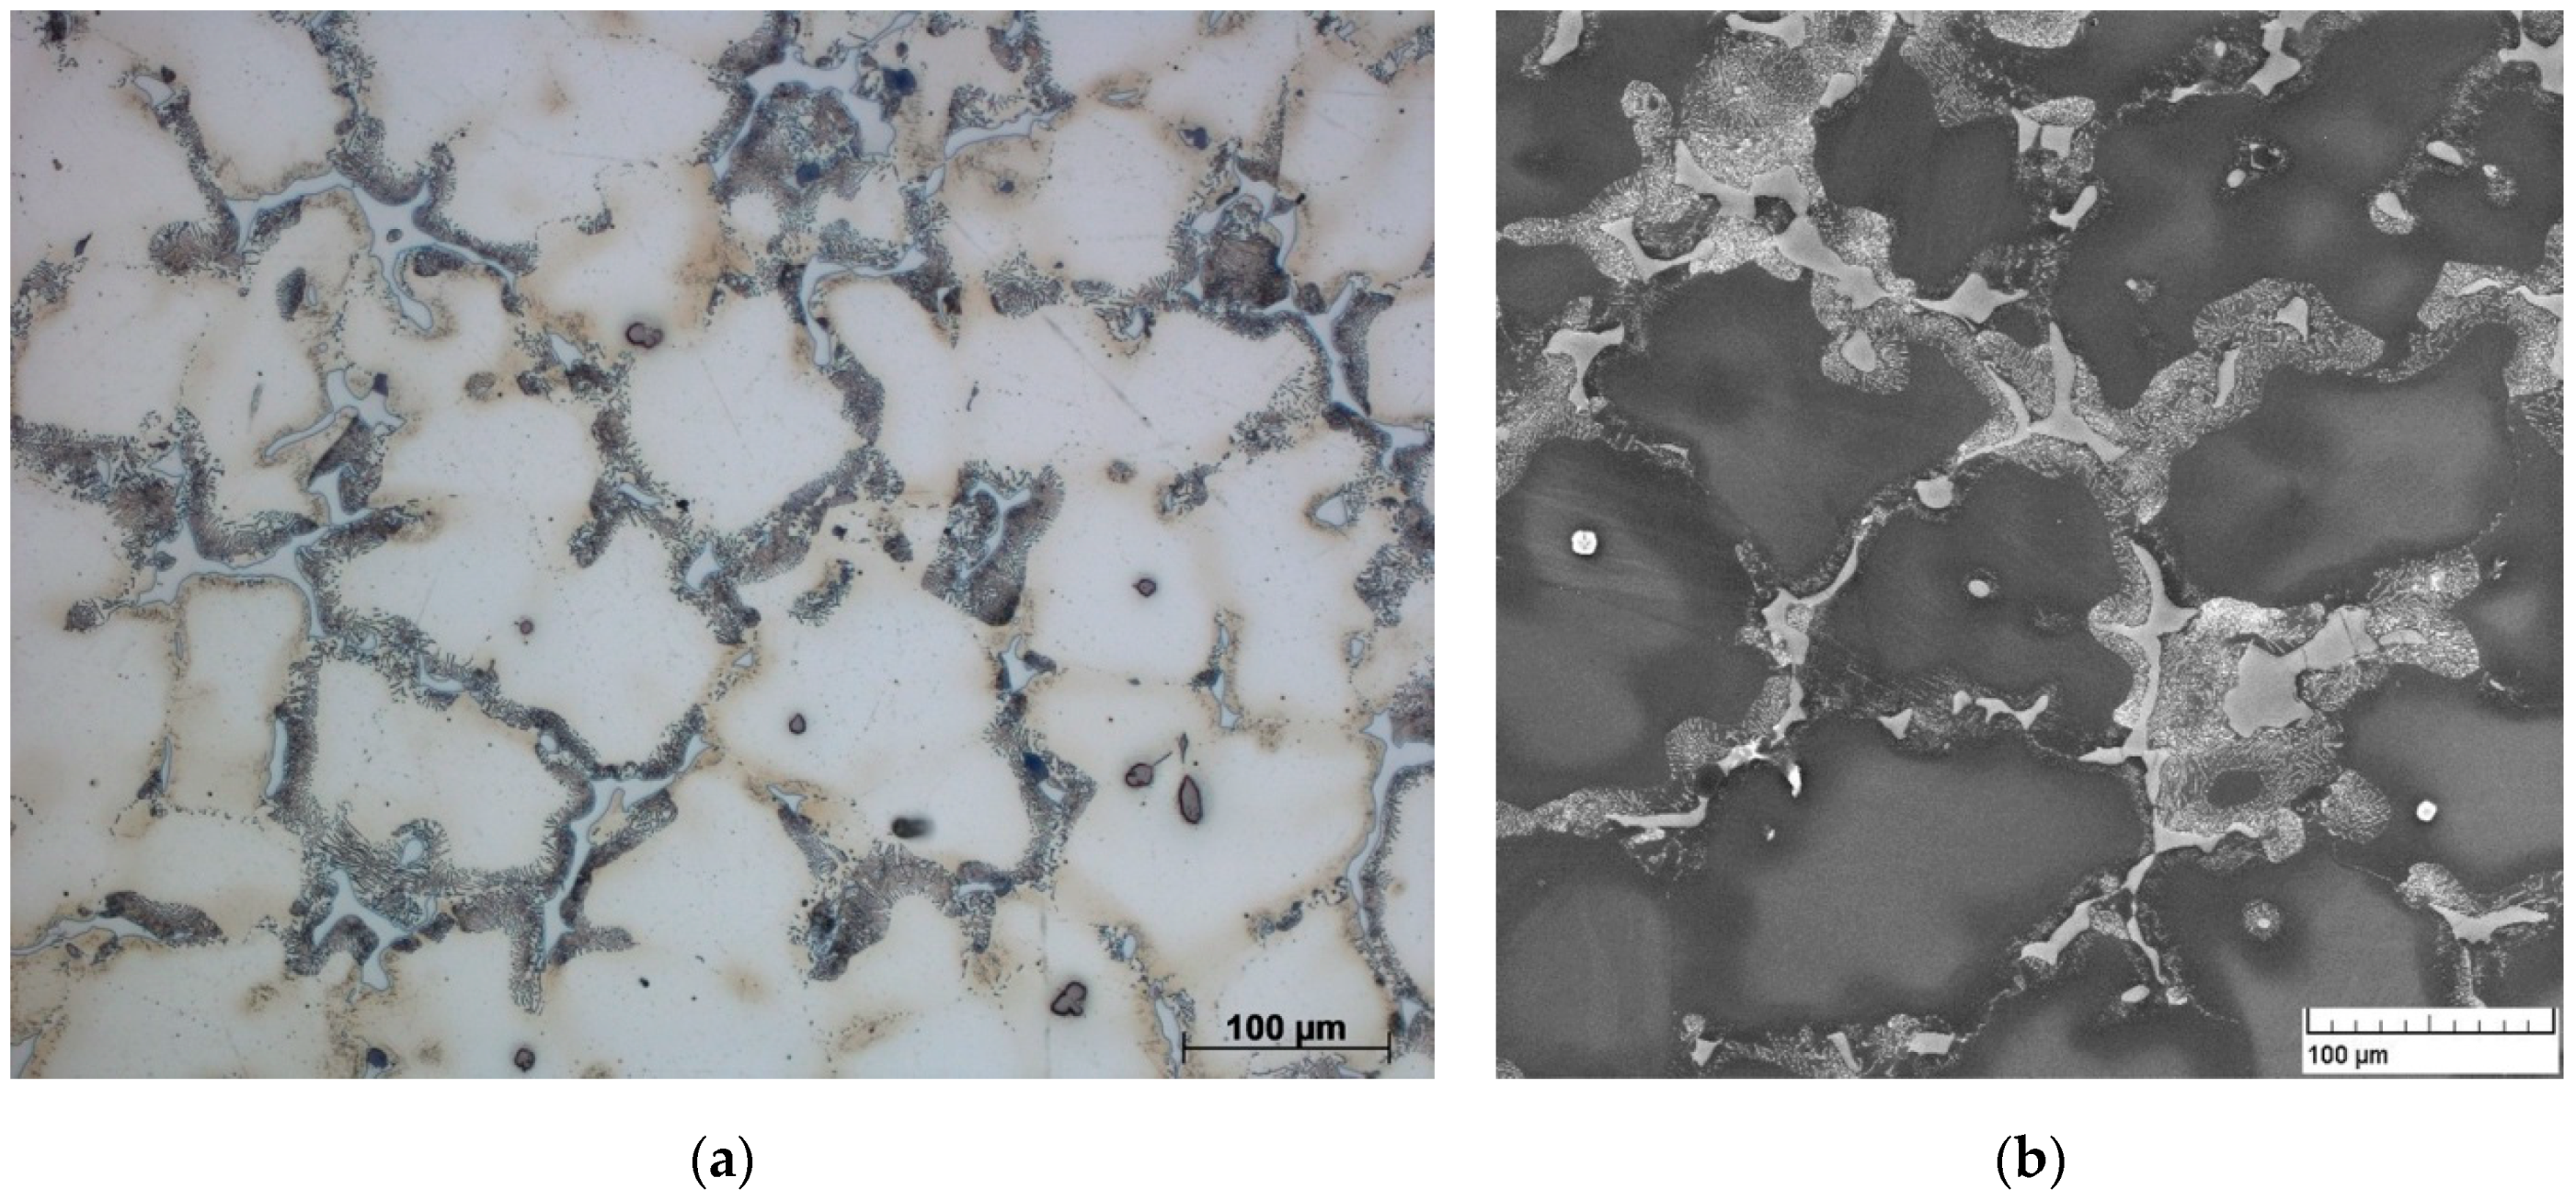
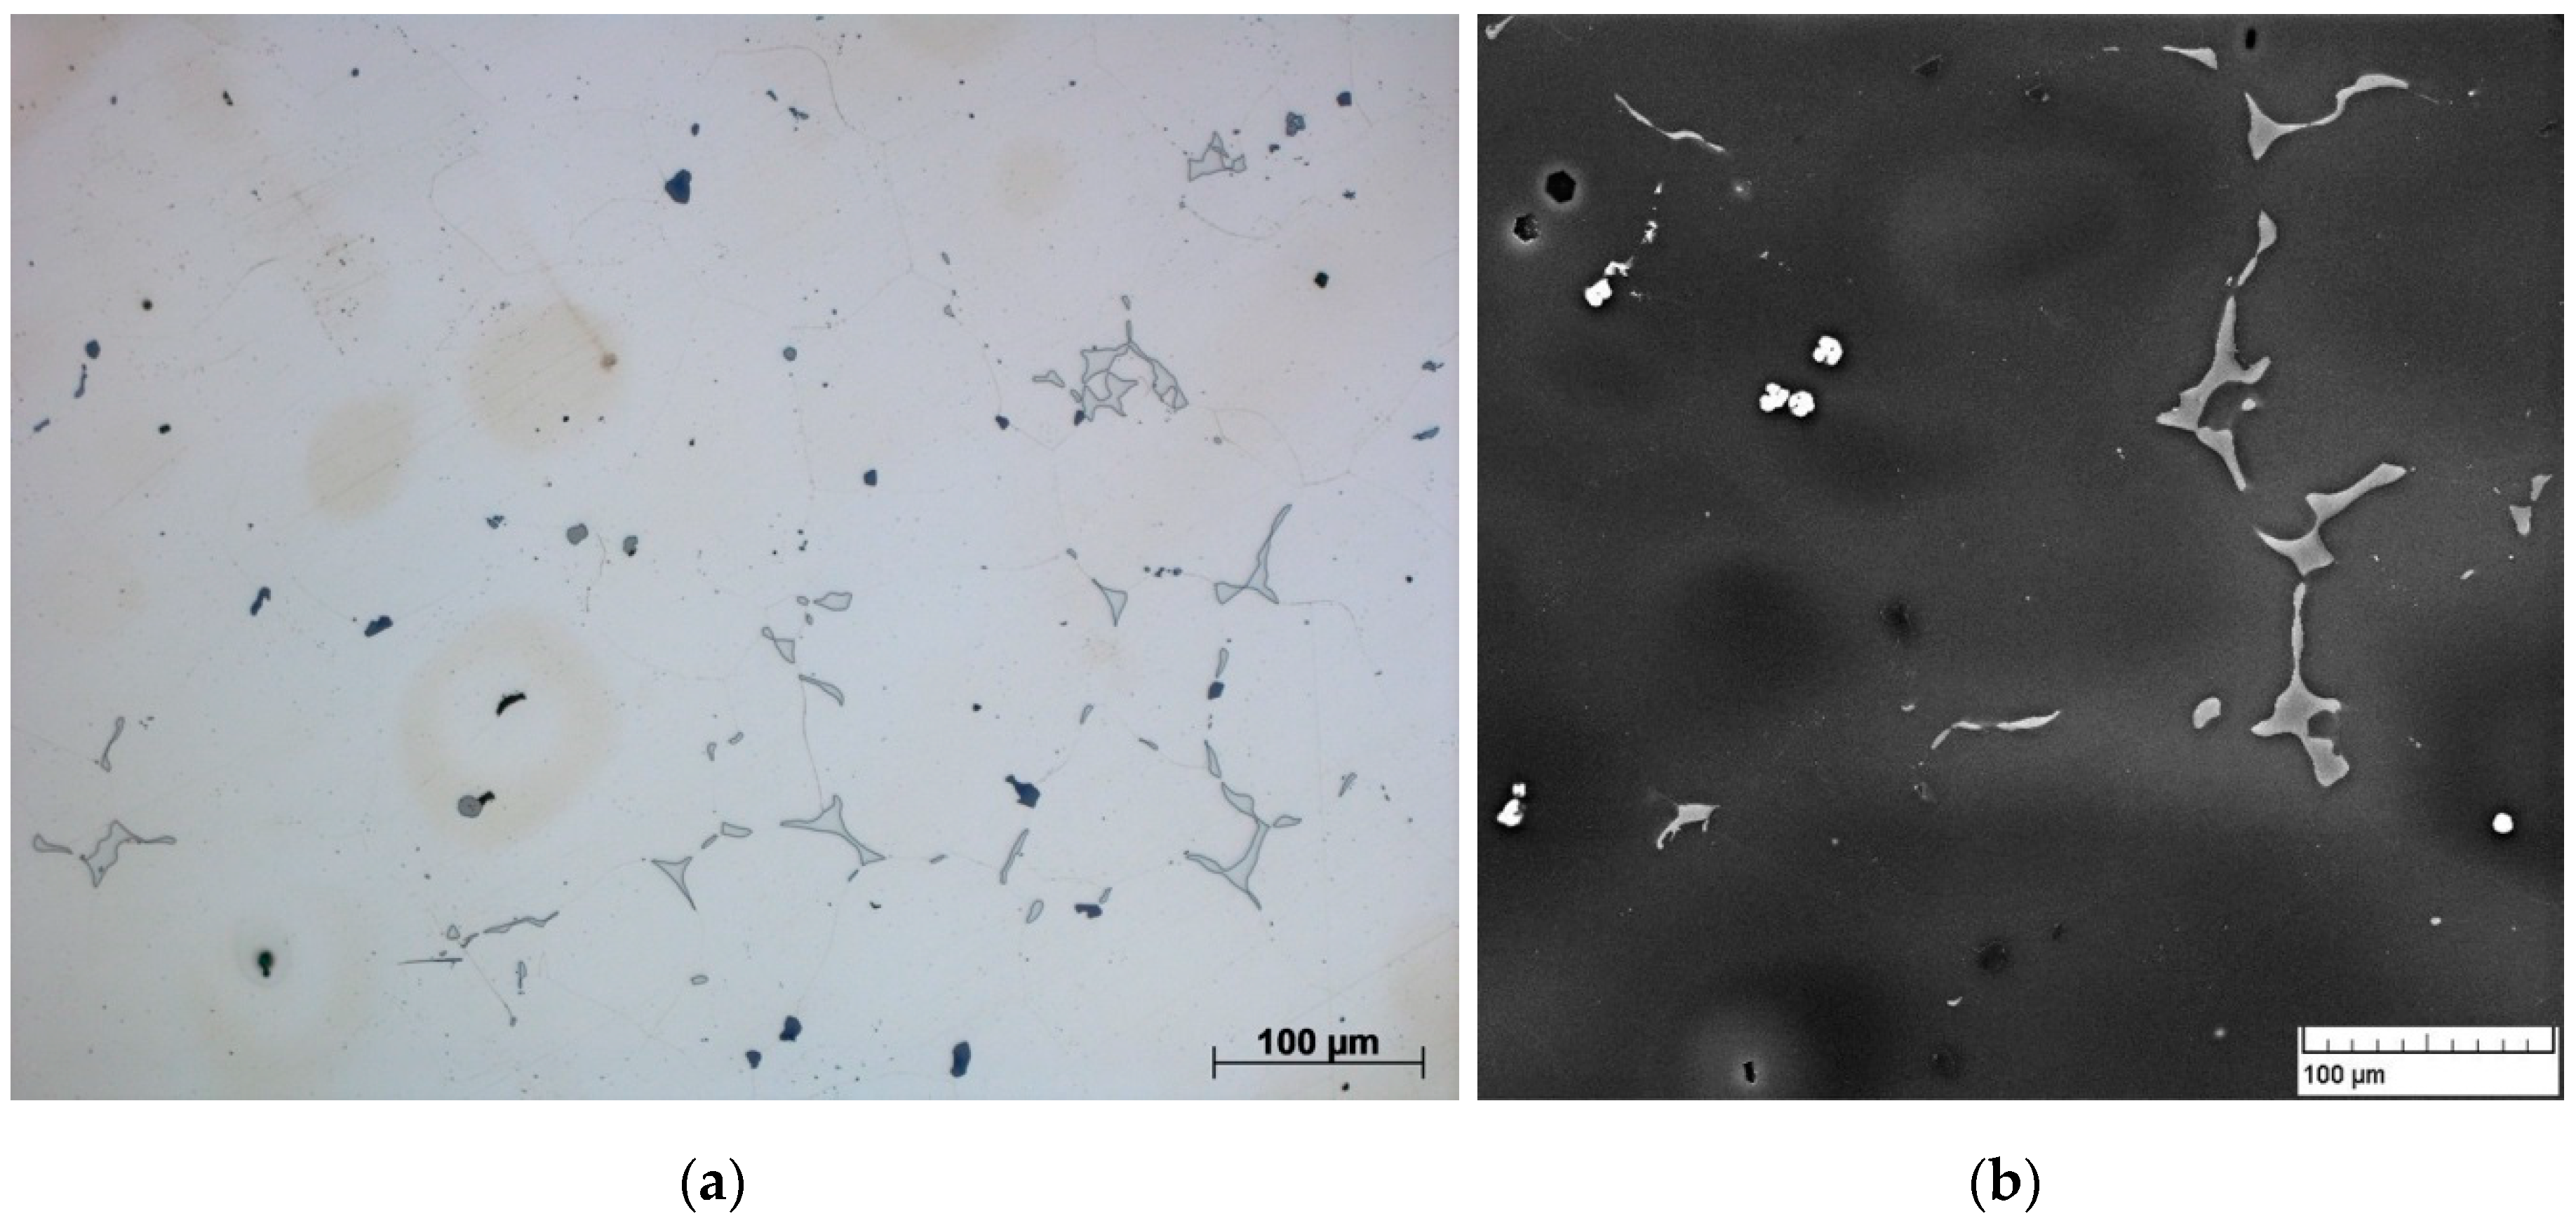
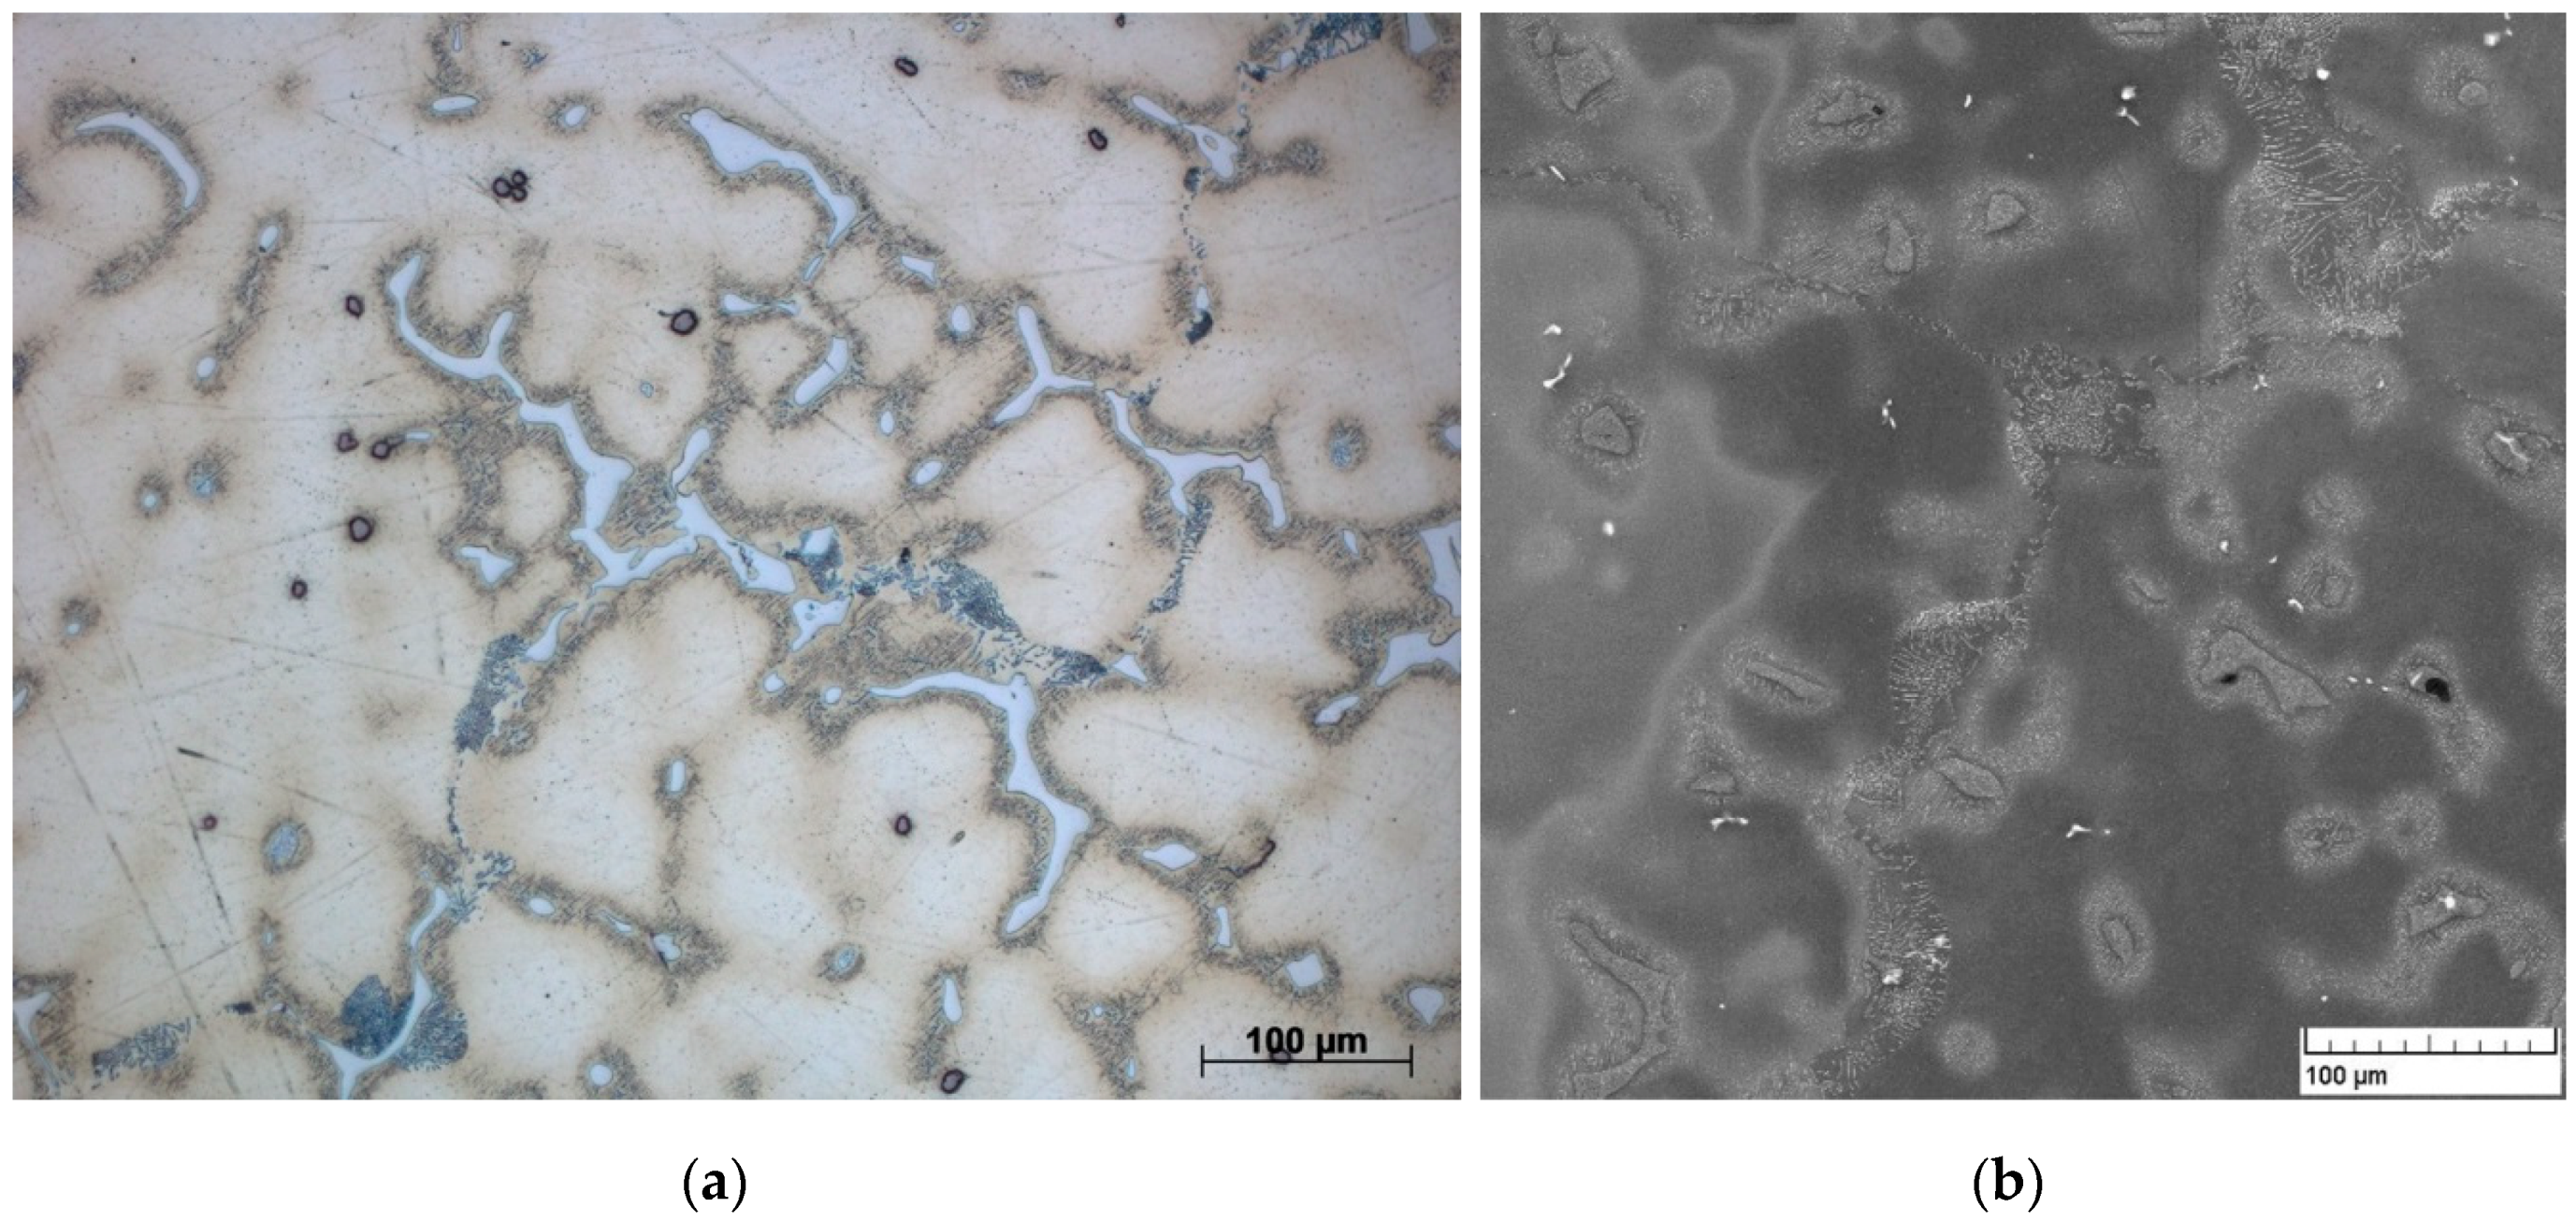
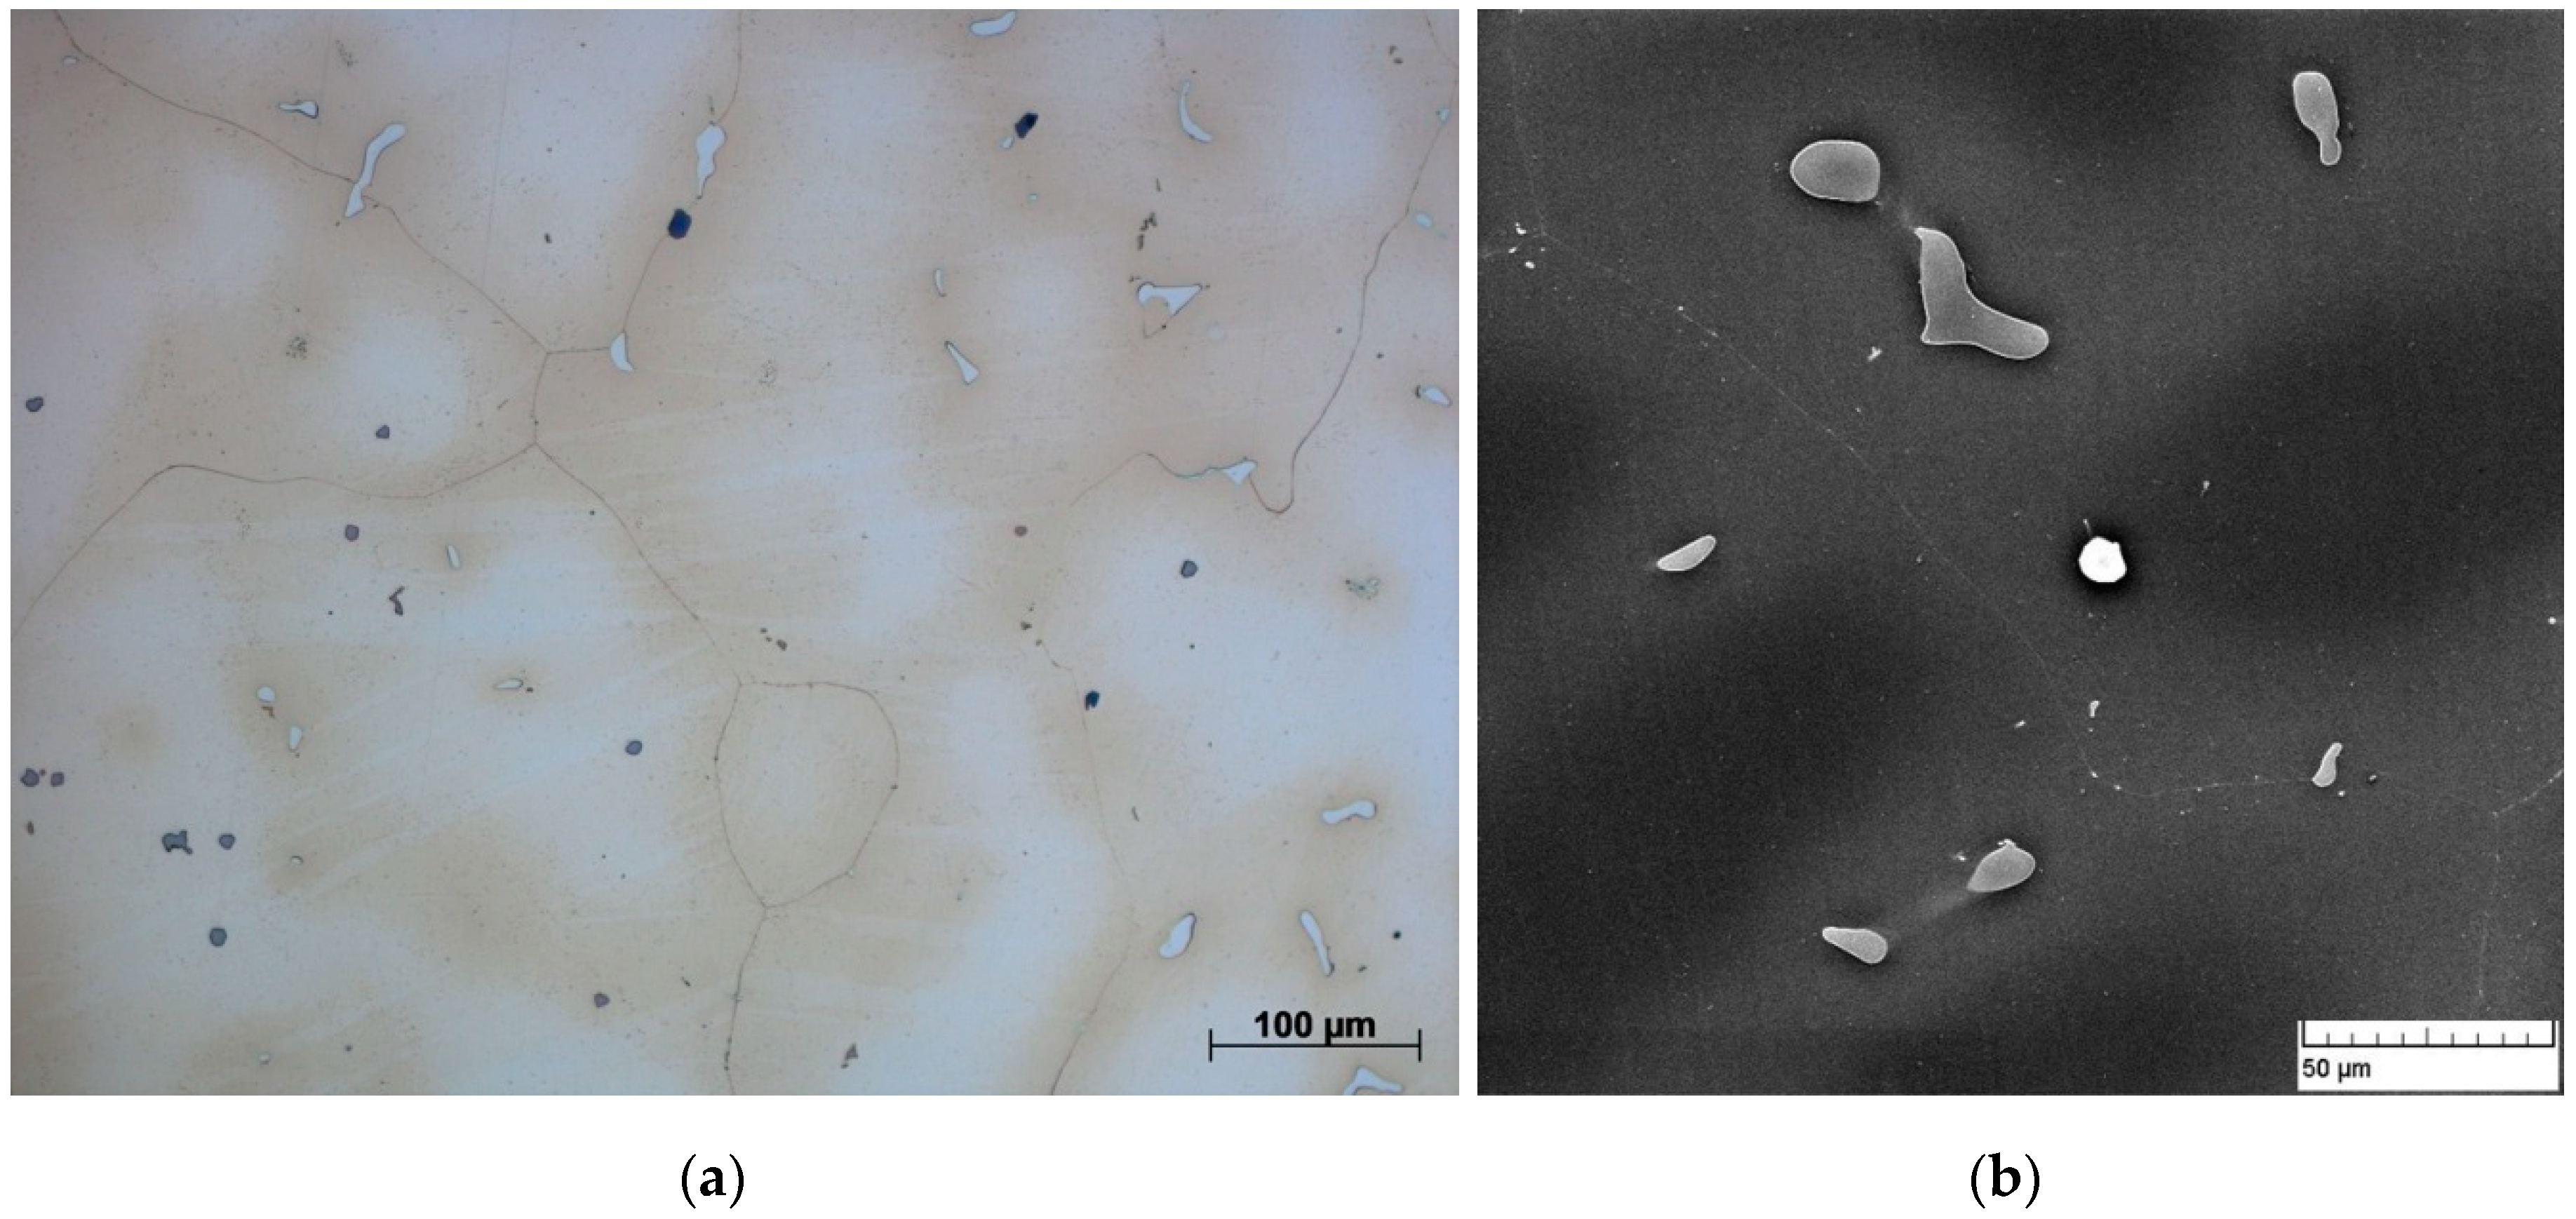
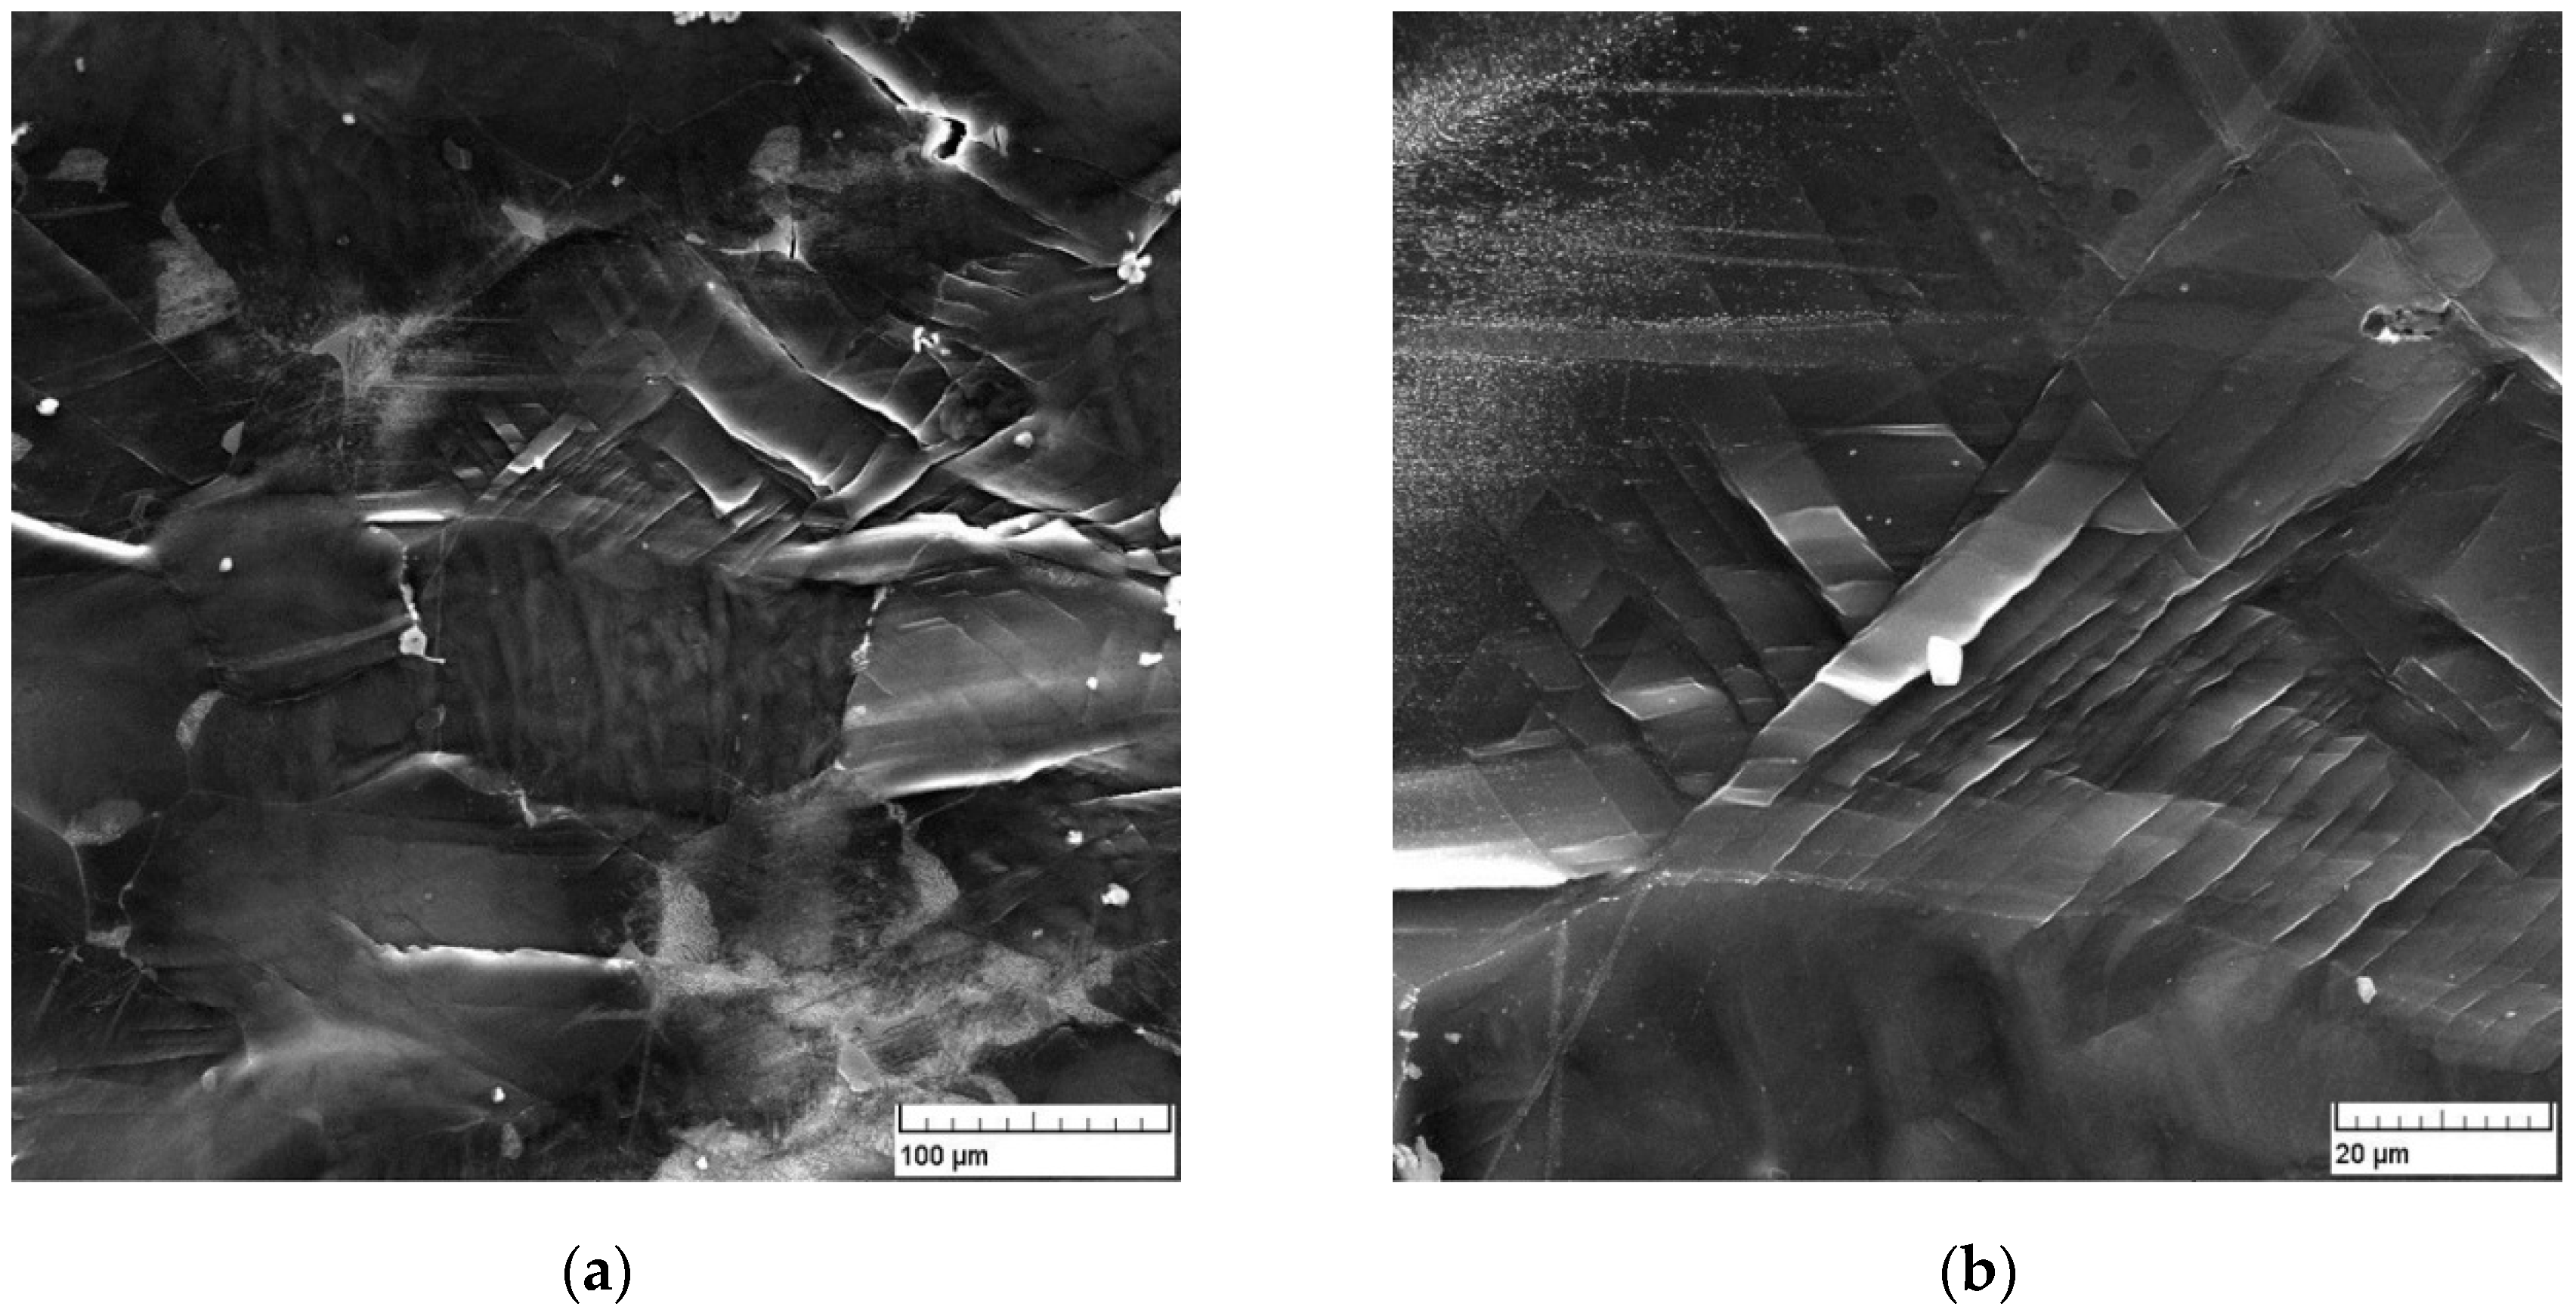
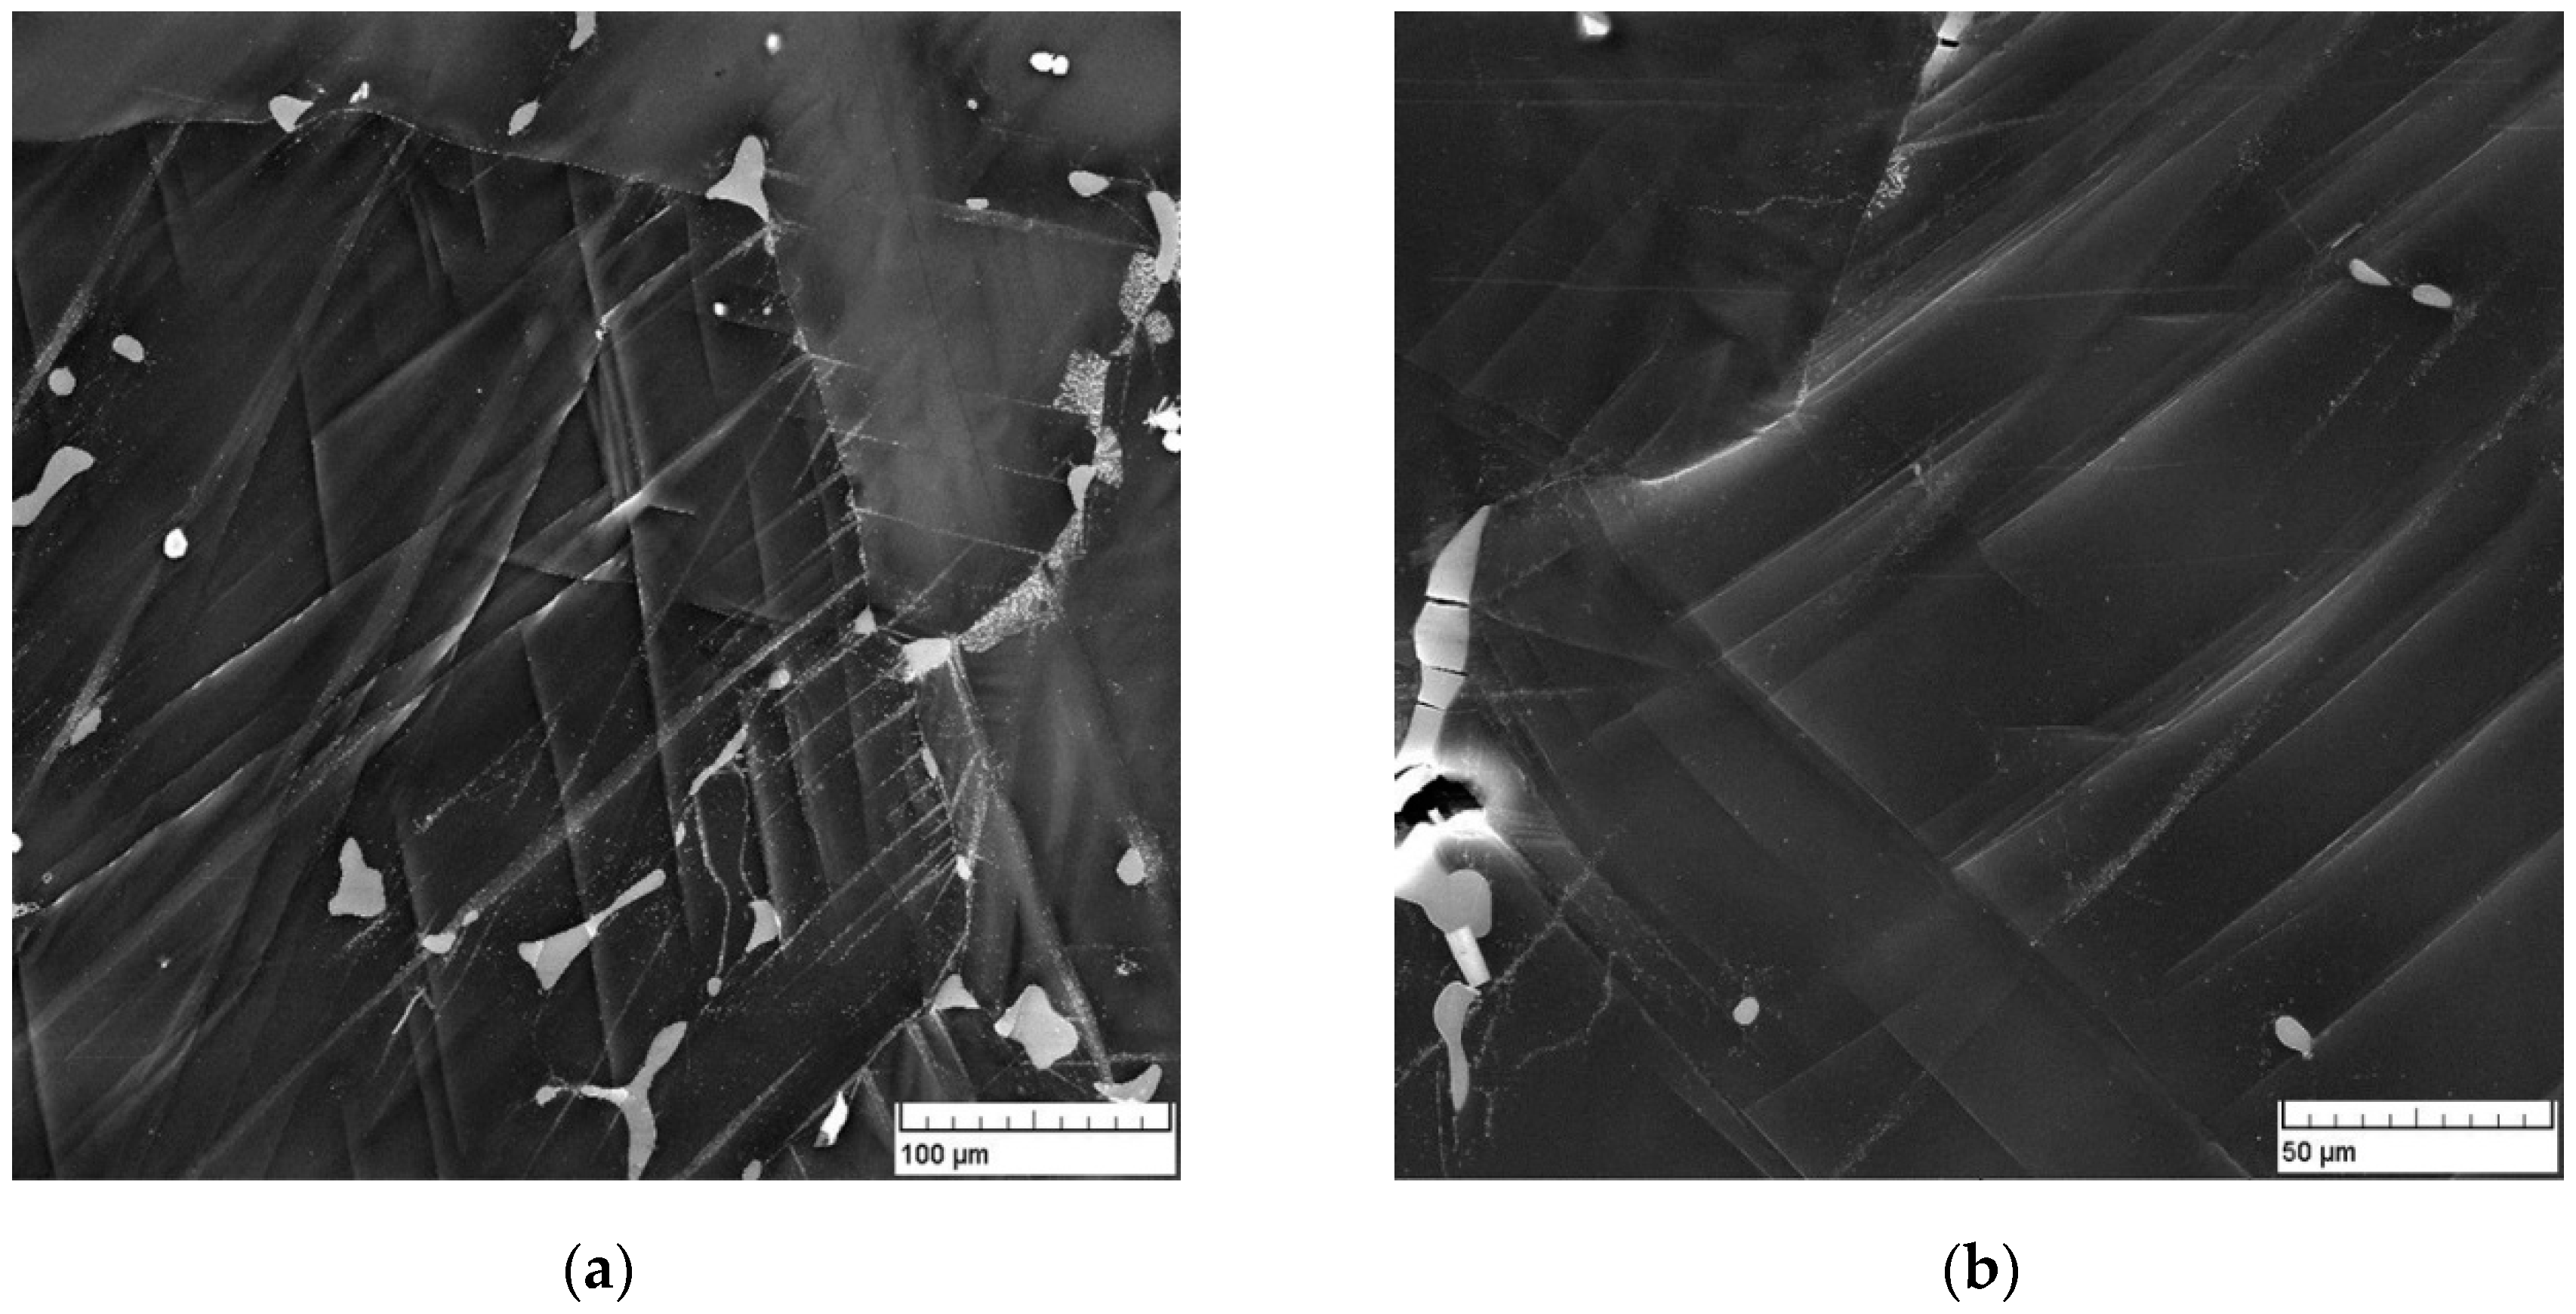
2.1. Microstructure of Alloys

Commercial magnesium alloys AZ31, AZ61, and AZ91 were used as an experimental material, supplied by their respective manufacturer in a cast state without heat treatment in the form of ingots. The real chemical composition of these alloys was examined using a spark emission spectrometer SPECTROMAXx (SPECTRO/AMETEC, Kleve, Germany) and the results are shown in Table 1.
The microstructure of materials was studied with a light microscope ZEISS Neophot 32 (CARL ZEISS, Jena, Germany) and scanning electron microscope TESCAN Vega II LMU (TESCAN ORSAY, Brno, Czech Republic). To reveal all the microstructure details, deep etching was used [30,31]. Three microstructure states were studied: initial state; homogenized state, where samples were annealed at 390 °C for 22 h and rapidly cooled in water of ambient temperature; and state after predeformation in torsion.
The microstructure of the AZ31 alloy (light micrograph presented in Figure 1a and electron micrograph shown in Figure 1b) was mostly dendritic, consisting of δ solid solution of alloying elements Al, Zn in Mg and γ phase Mg17Al12, and eutectics (formed by δ solid solution and γ phase). Phases containing other additive elements and magnesium were found in the interdendritic areas. Fine discontinuous precipitates were situated in the interdendritic places of the γ phase. Besides the γ phase, further precipitates consisting of alloying elements Mn, Si, and Fe were detected.
Heat treatment caused the formation of a polyedric microstructure in the AZ31 alloy (see Figure 2). Particles of the γ phase during the annealing mostly dissolved. Small particles visible in Figure 2 are phases of Mn, Fe, and Si that remained undissolved due to their limited solubility at the low annealing temperature.
The microstructure of the AZ61 alloy (light micrograph in Figure 3a and electron micrograph in Figure 3b) was formed in a similar manner to that of the AZ31 alloy by the α solid solution and γ phase in the form of dendrites. Discontinuous precipitates, rarely present in the AZ31 alloy, were situated in the interdendritic areas. Note that this alloy exhibited an approximately two times higher content of Zn, thus the precipitation process was slightly different and it is very likely that the concentration of residual precipitates after the annealing procedure was higher when compared with the AZ91 alloy, as will be described in the next section.
The microstructure of the AZ61 alloy changed after heat treatment into polyedric grains (light micrograph in Figure 4a and electron micrograph in Figure 4b). A part of the γ phase particles remained insoluble in the matrix beside stable Mn, Fe, and Si particles.
Figure 5a,b shows the microstructure of the as cast AZ91 alloy. Similar to the previous two alloys, the microstructure of the AZ91 alloy was significantly dendritic in its initial state. As the alloy contains the same additive elements as the AZ31 and AZ61 alloys, the same phases, eutectics, and discontinuous precipitates were formed in the interdendritic areas.
Polyedric grains are the typical features in the microstructure of the AZ91 alloy after heat treatment (light micrograph in Figure 6a and electron micrograph in Figure 6b). The majority of the γ phase particles in the alloy was dissolved. However, the debris of undissolved particles of the γ phase as well as particles based on Mn, Fe, and Si remained in the alloy.

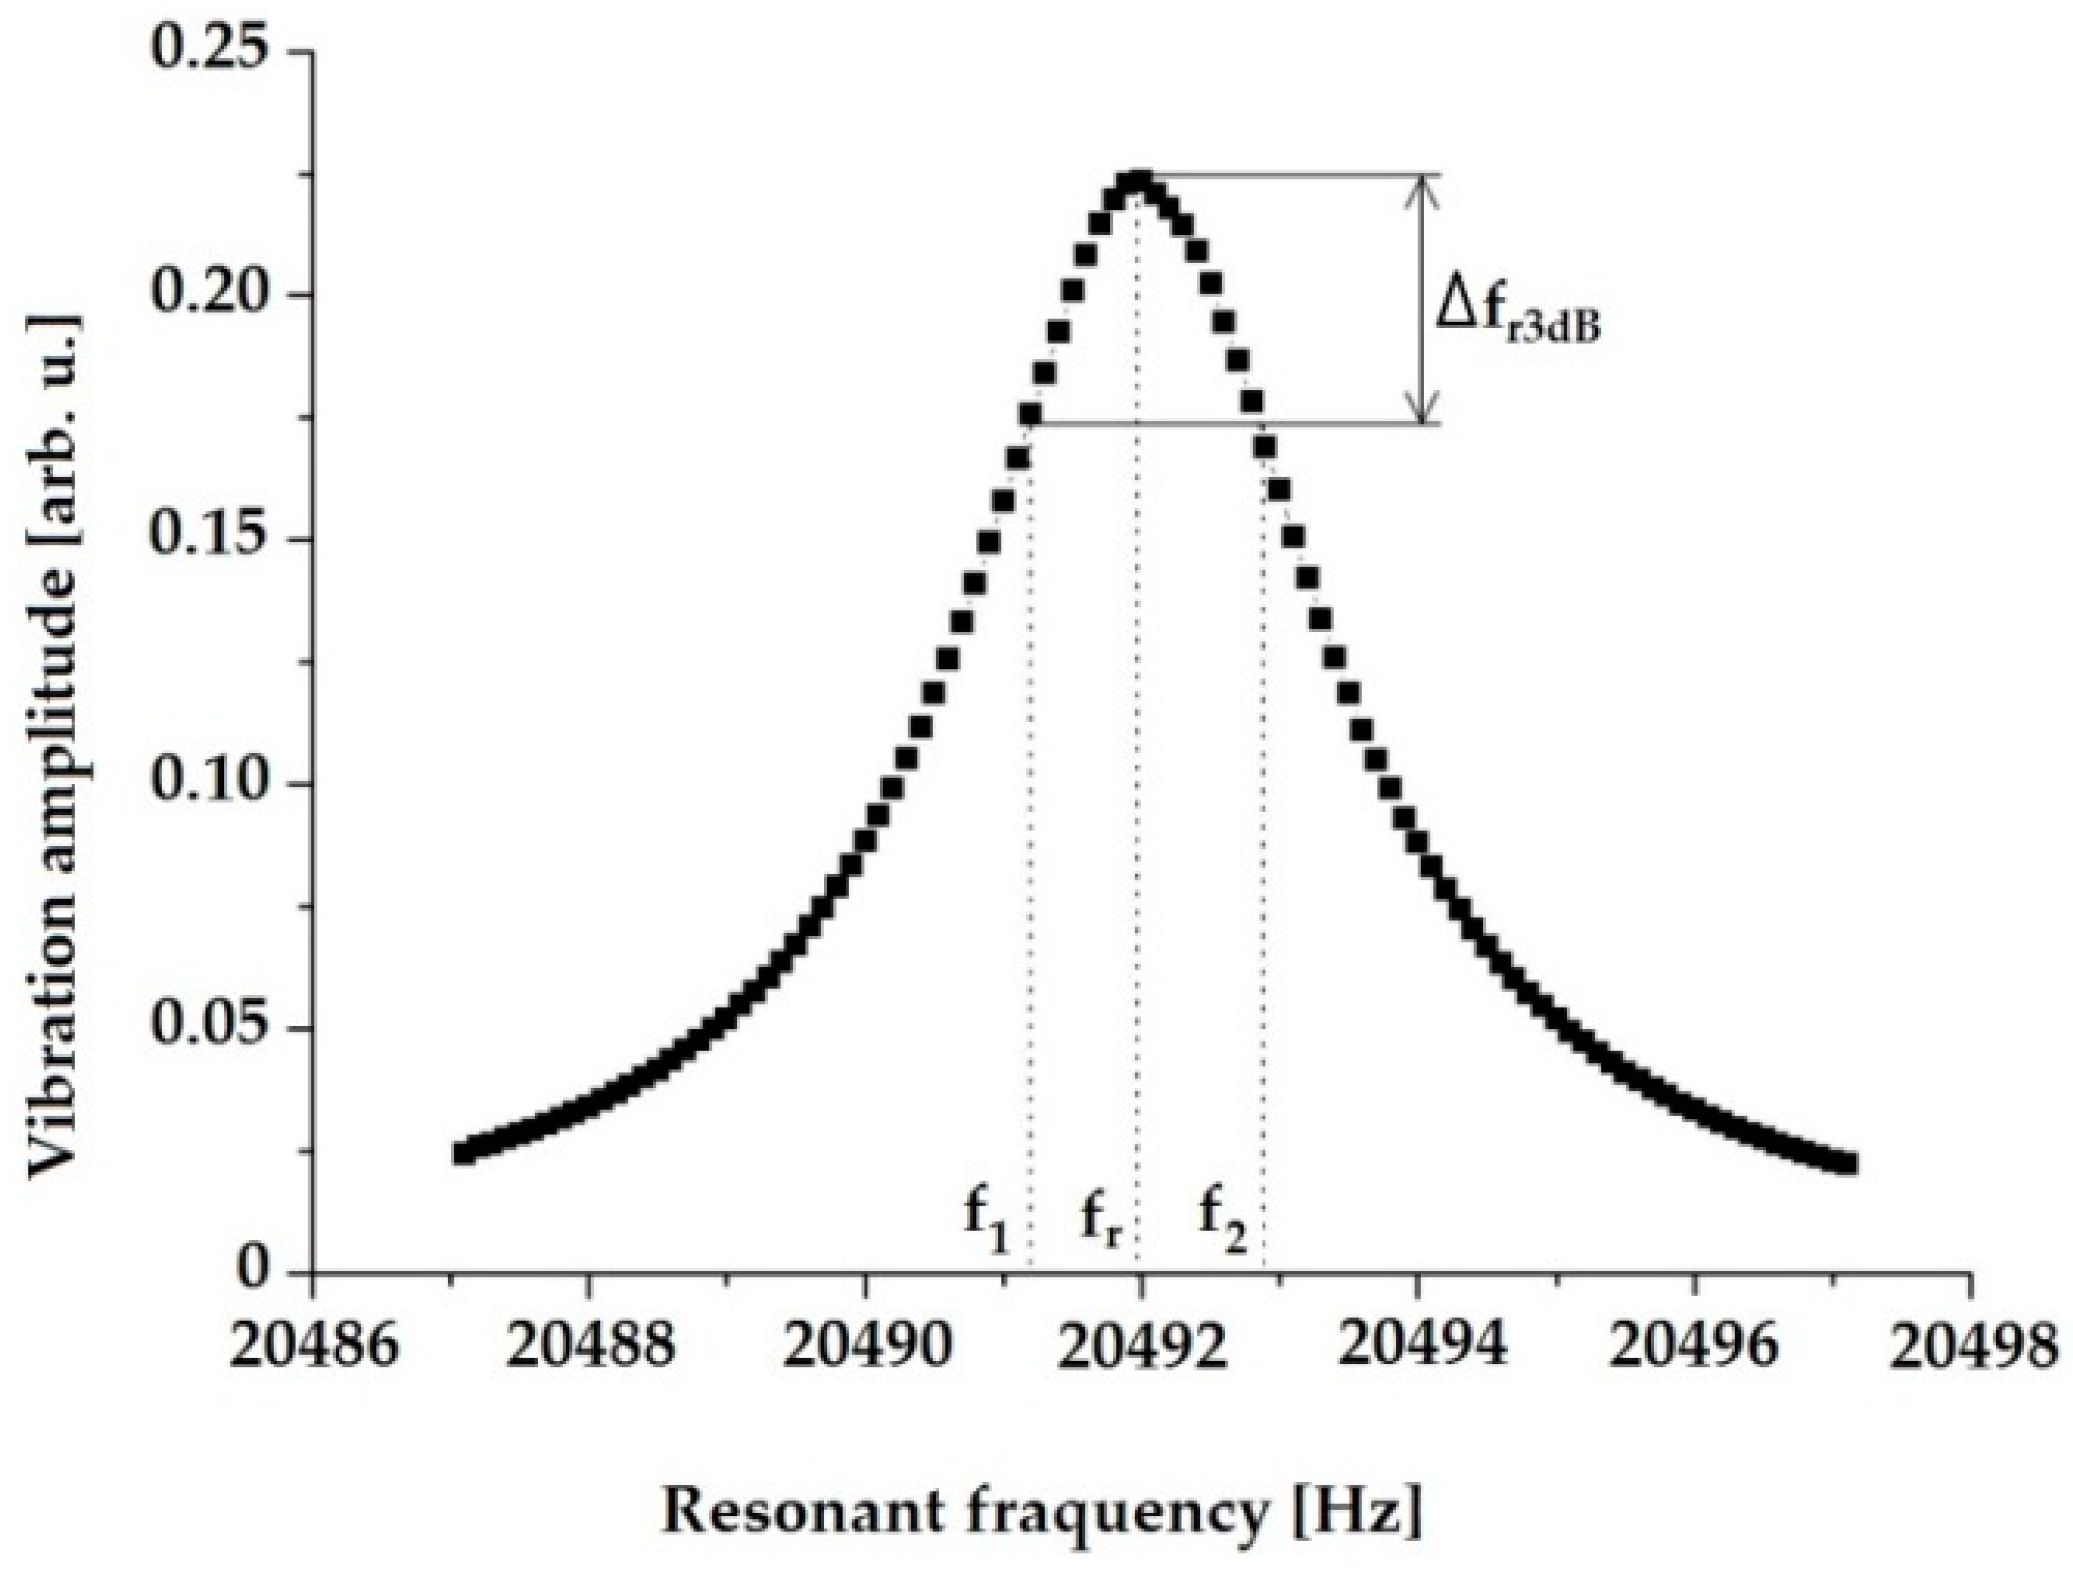
2.2. Internal Friction Measurements
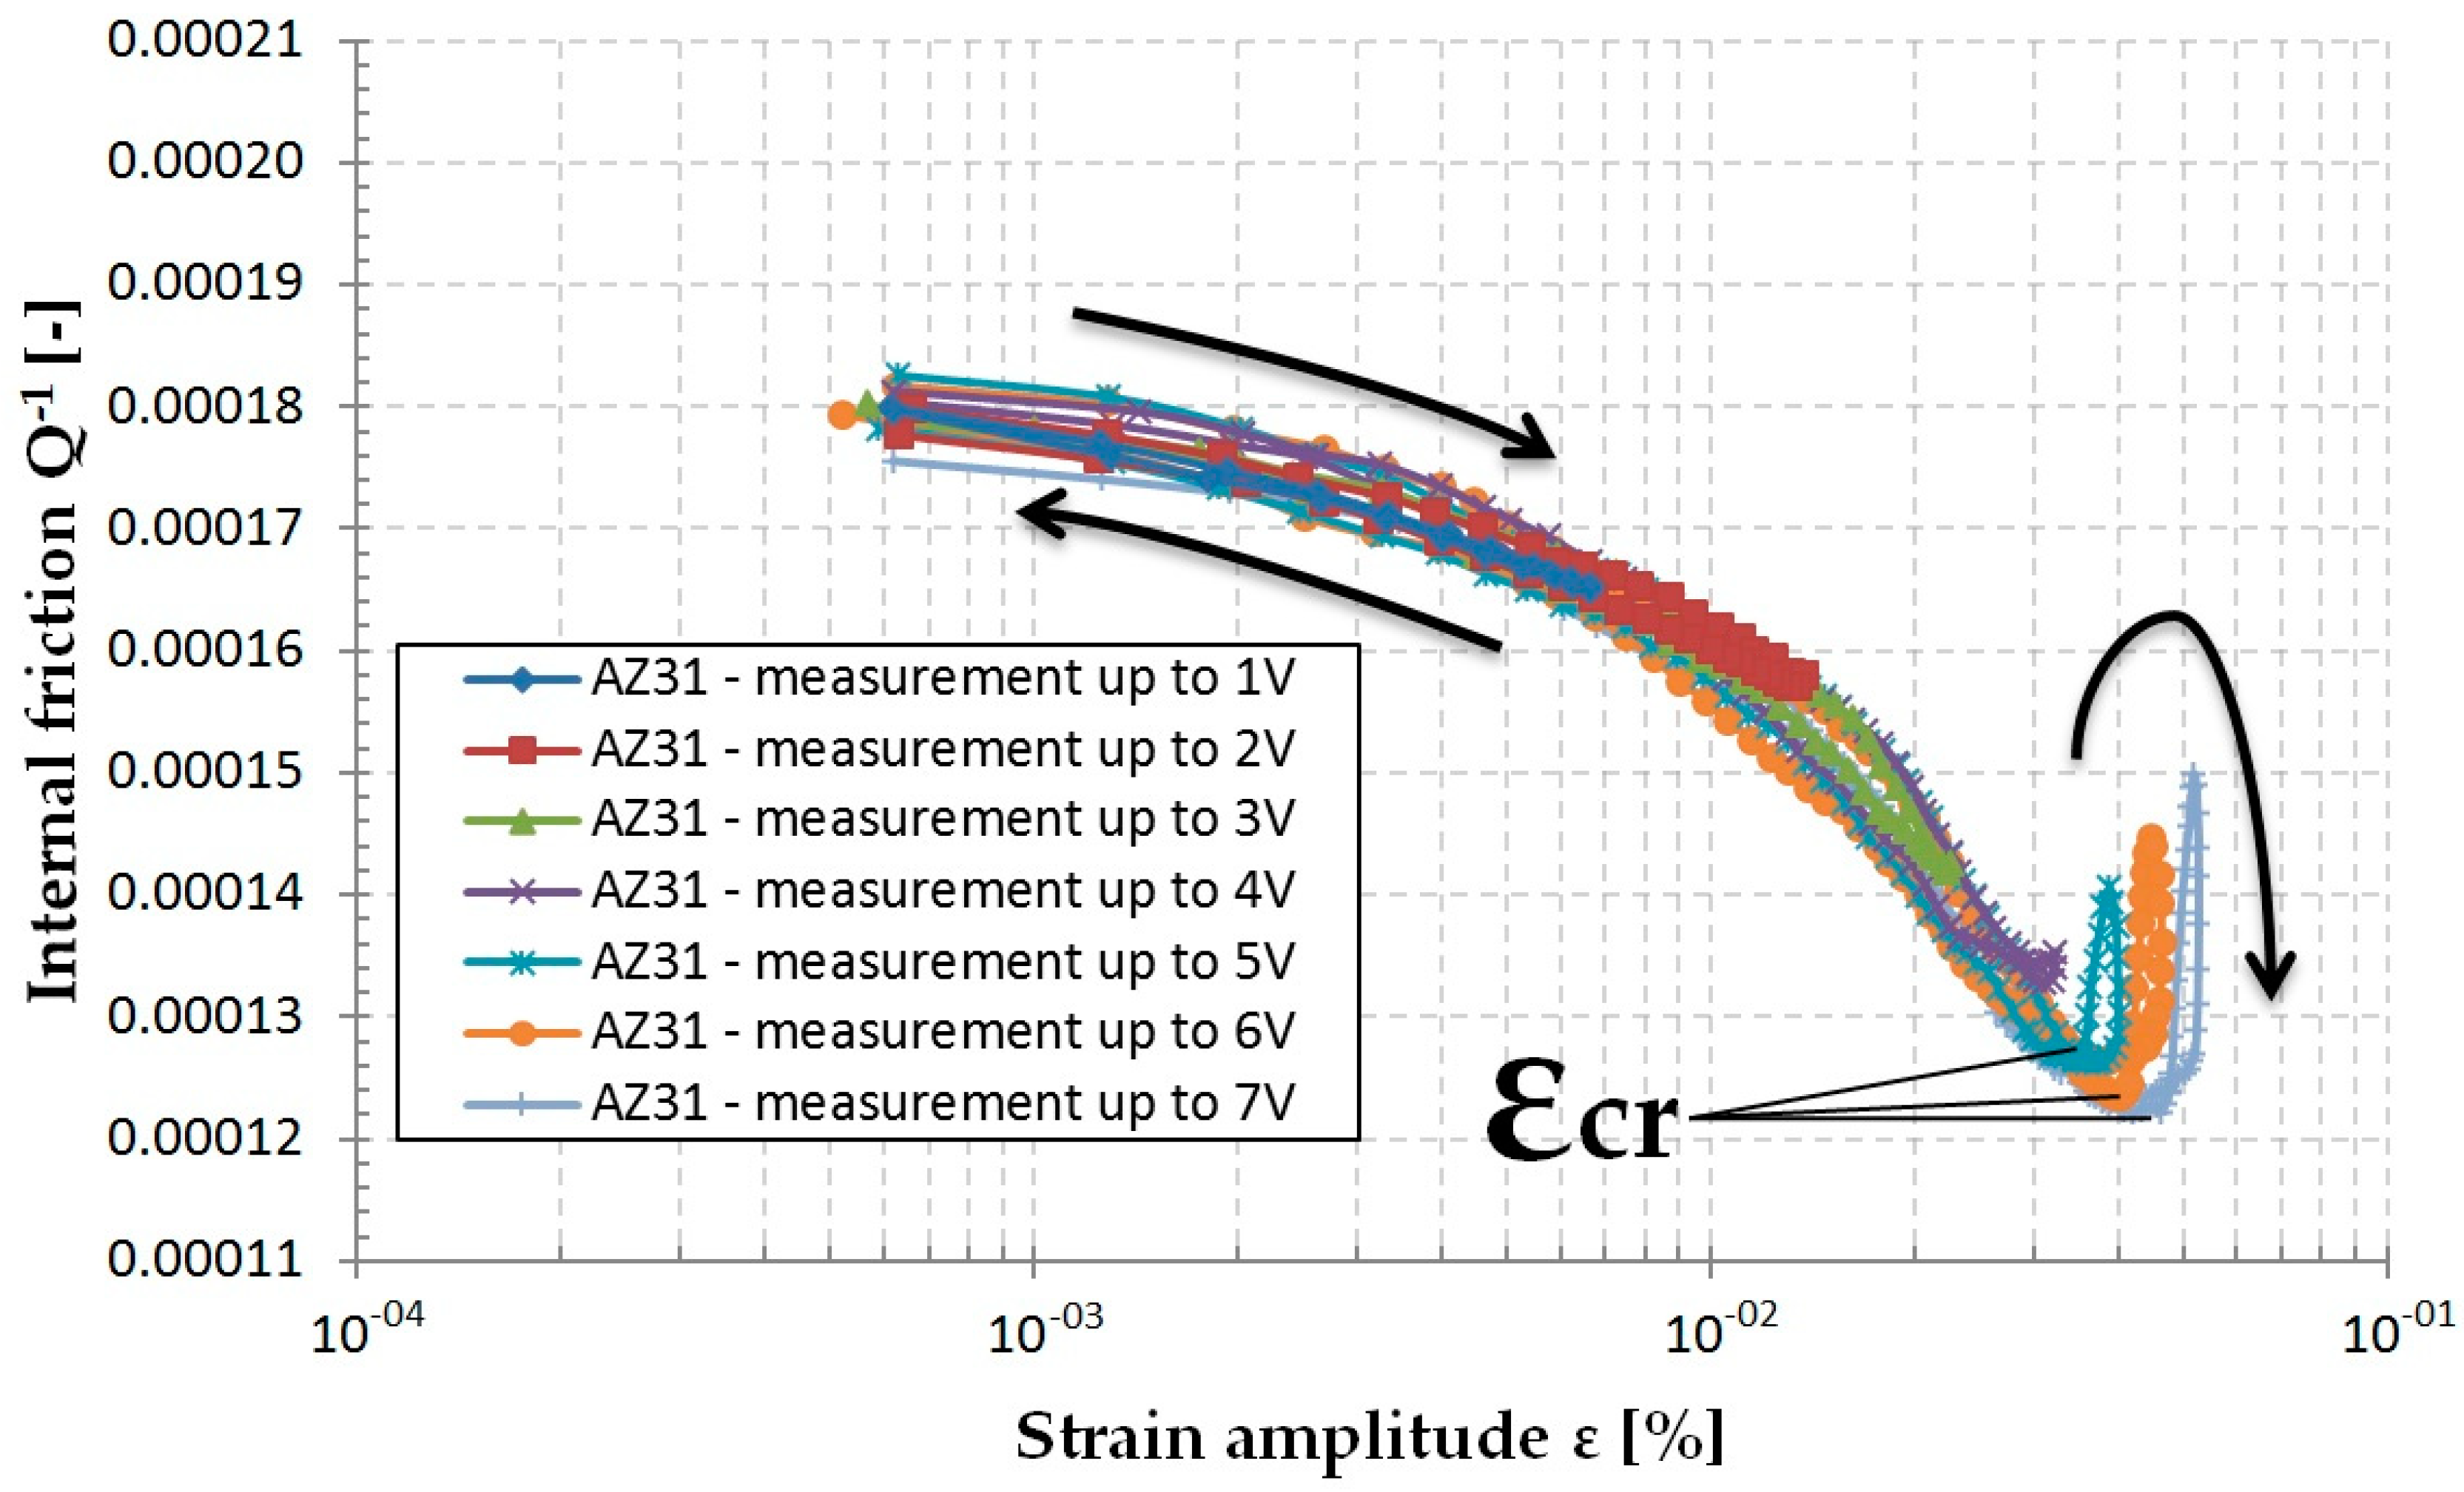
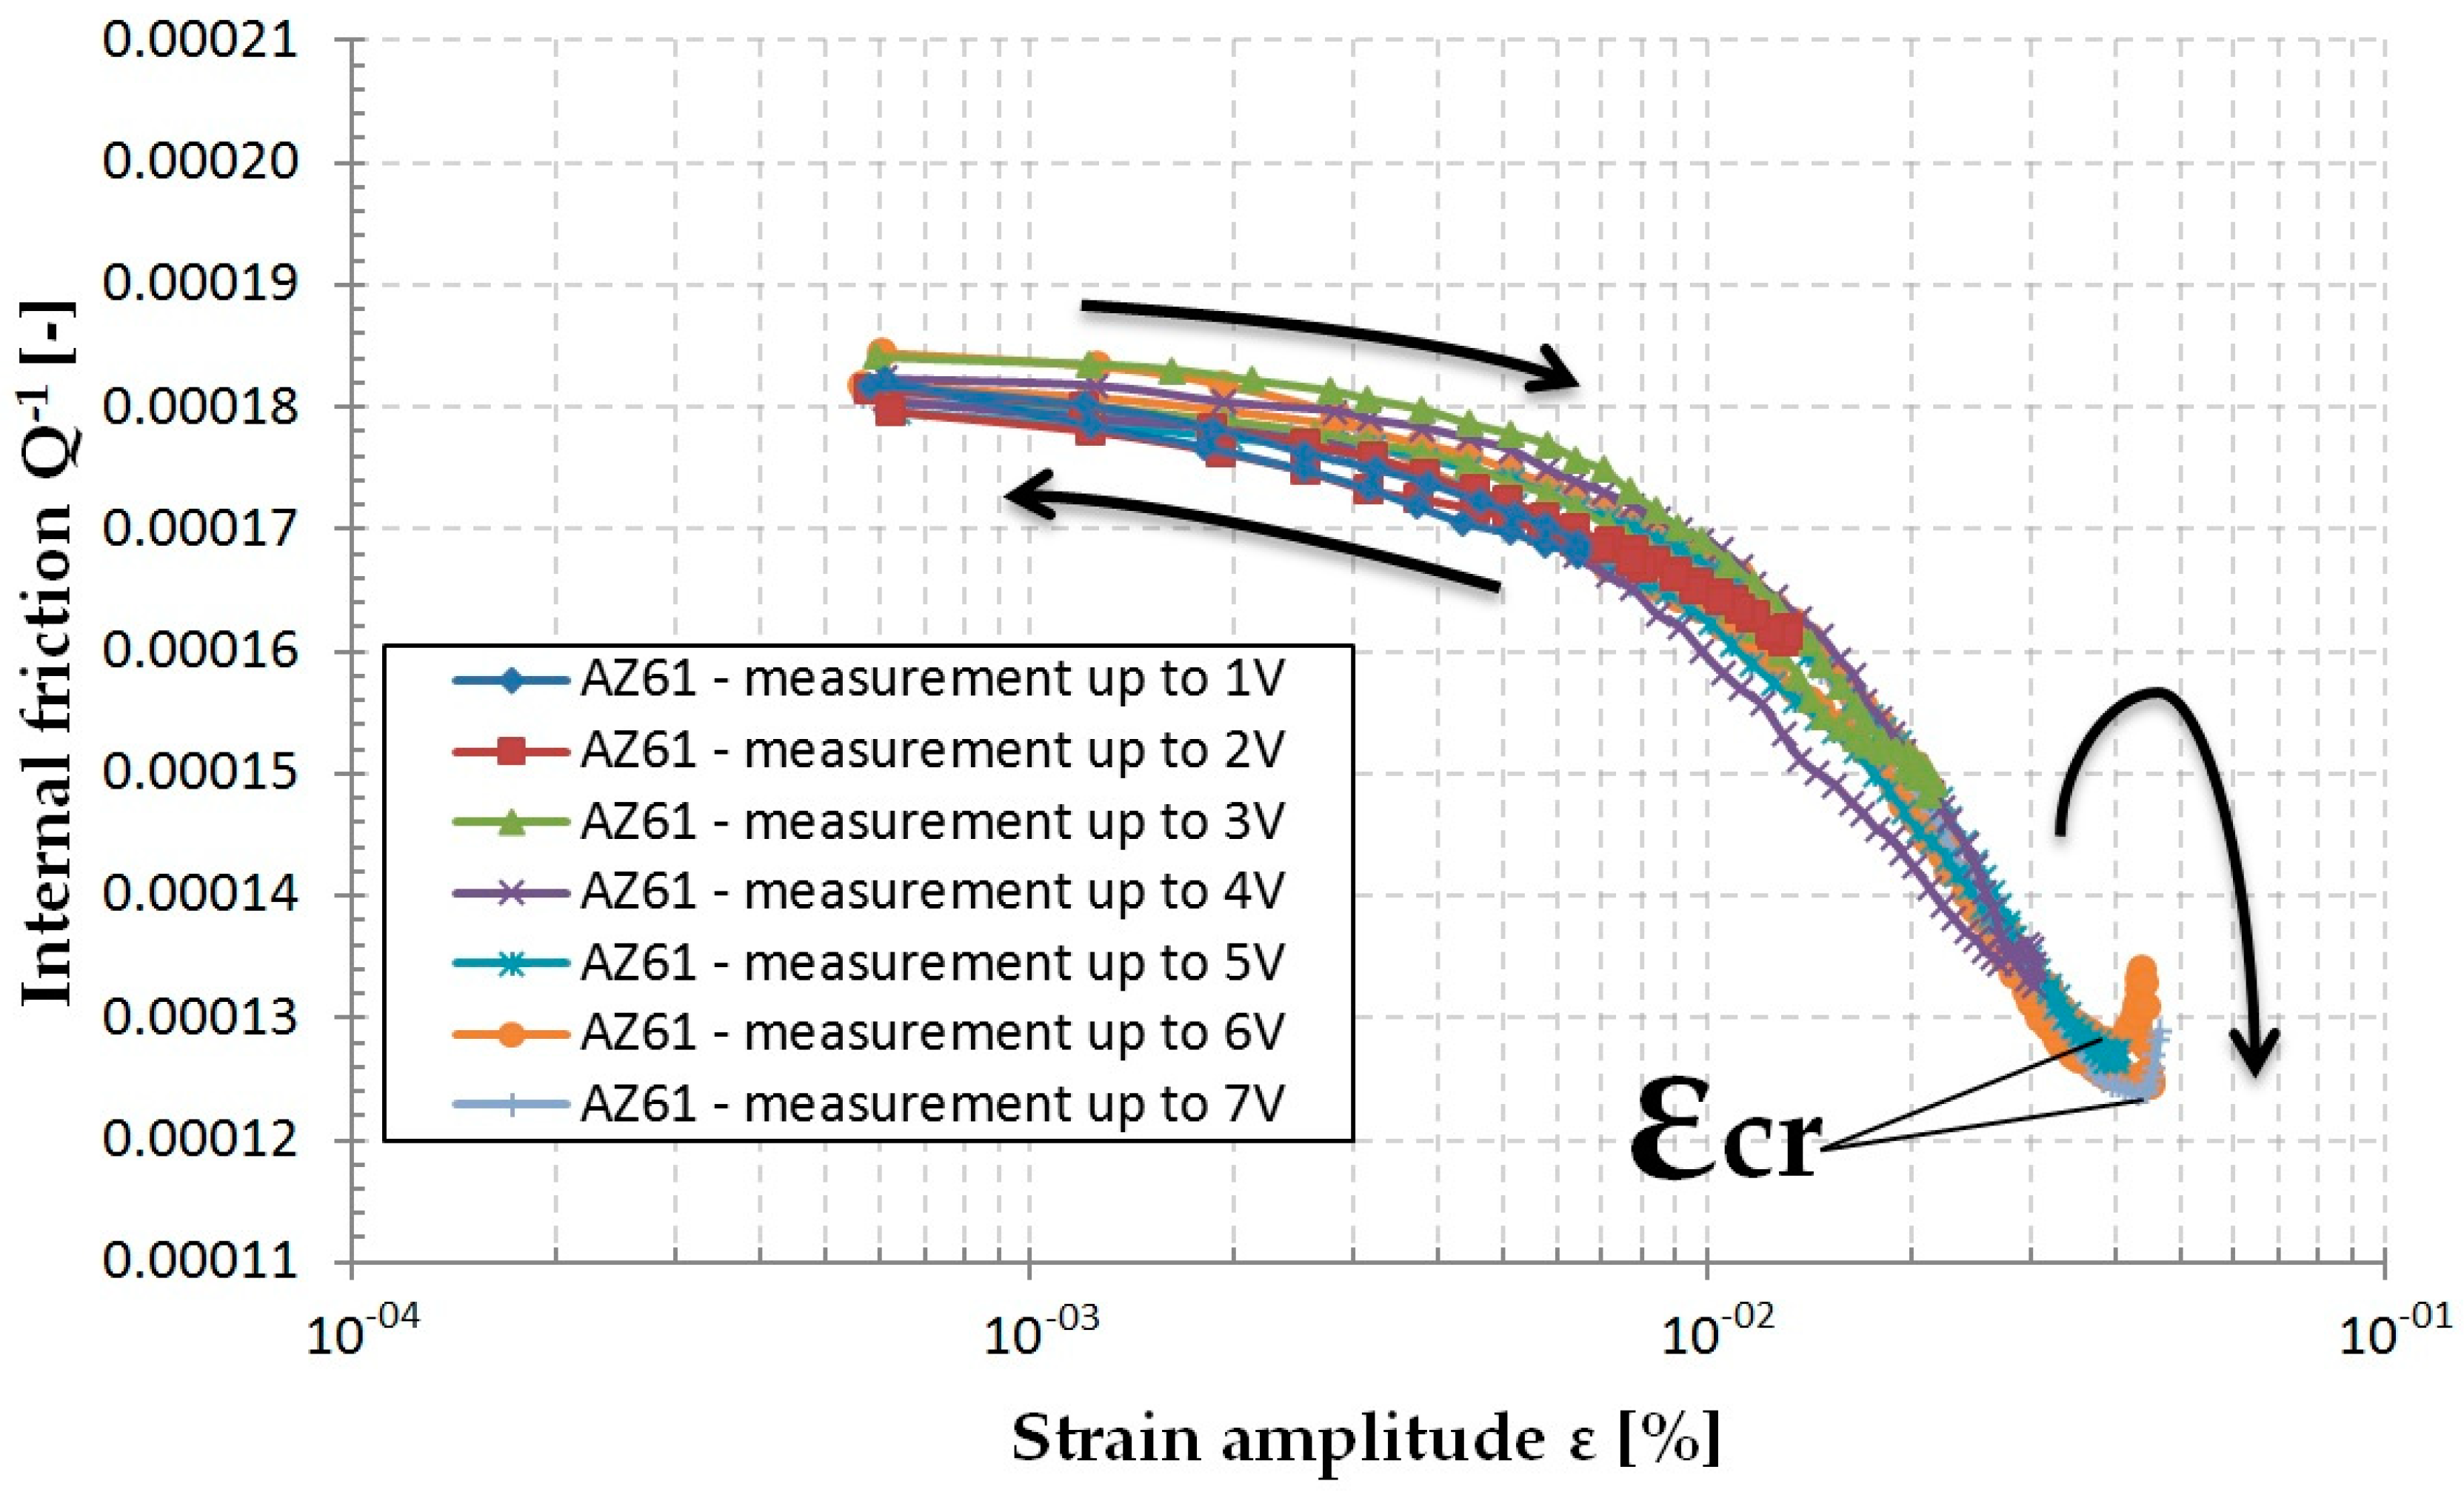
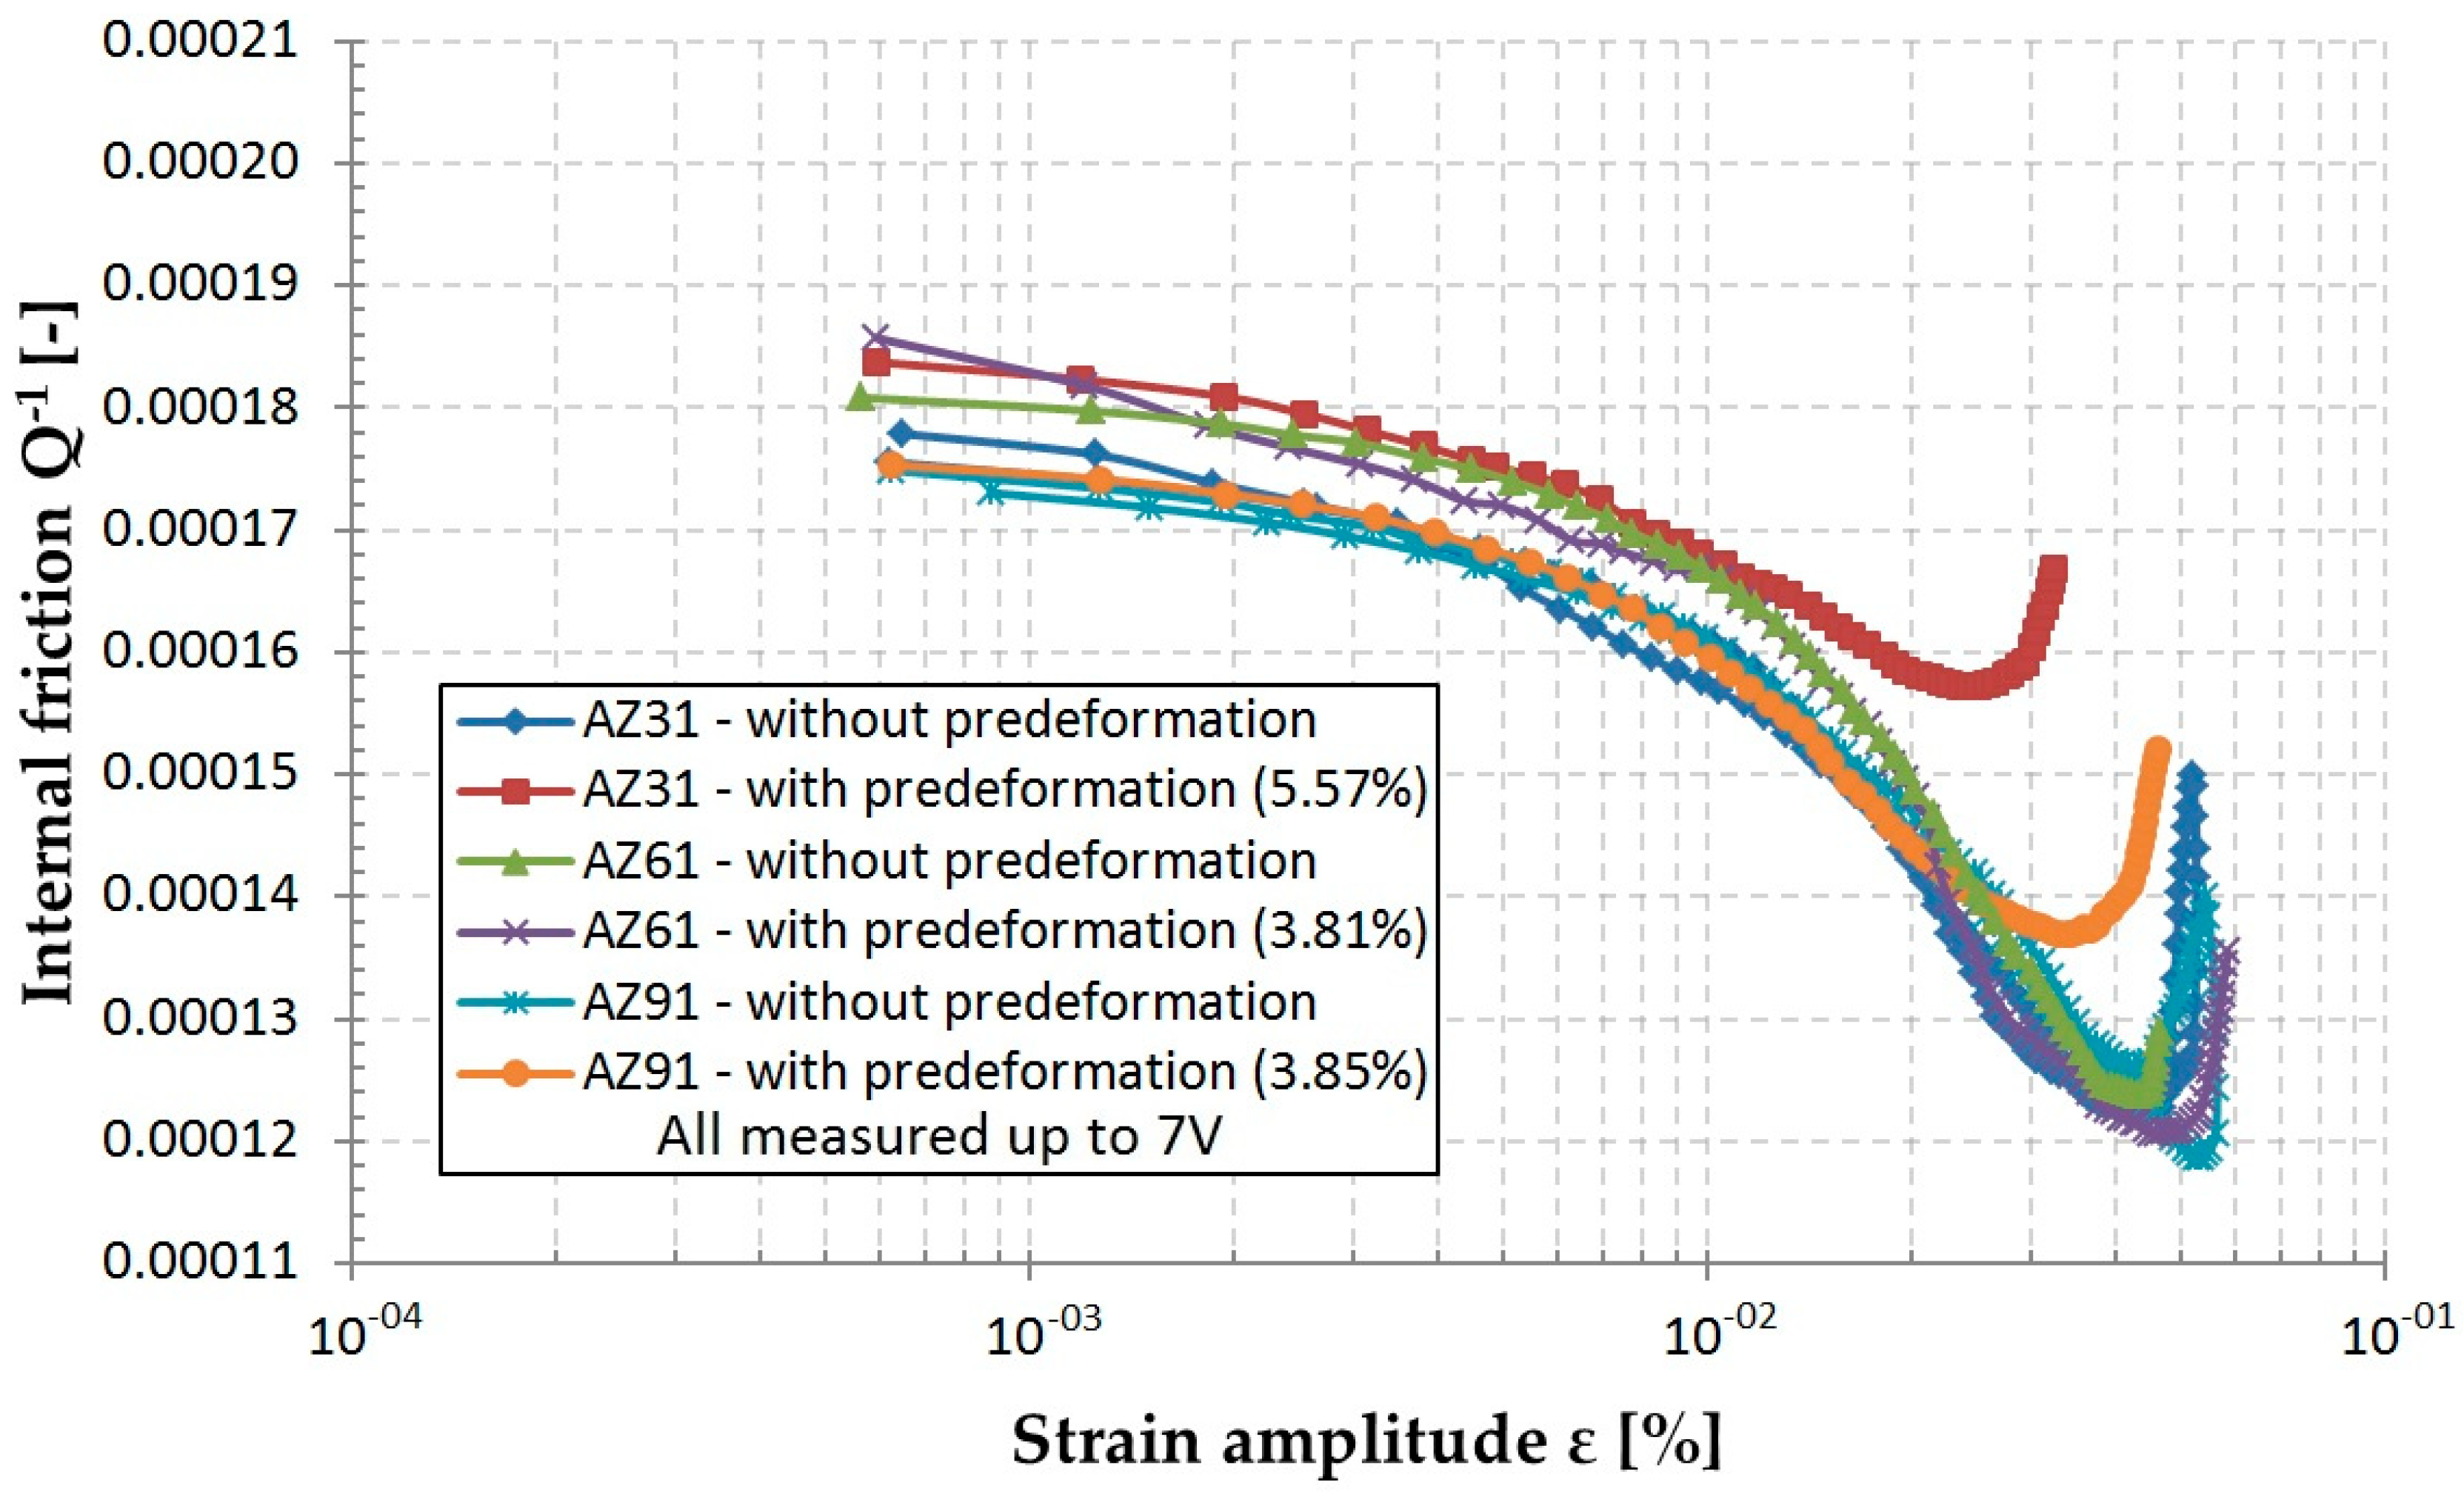
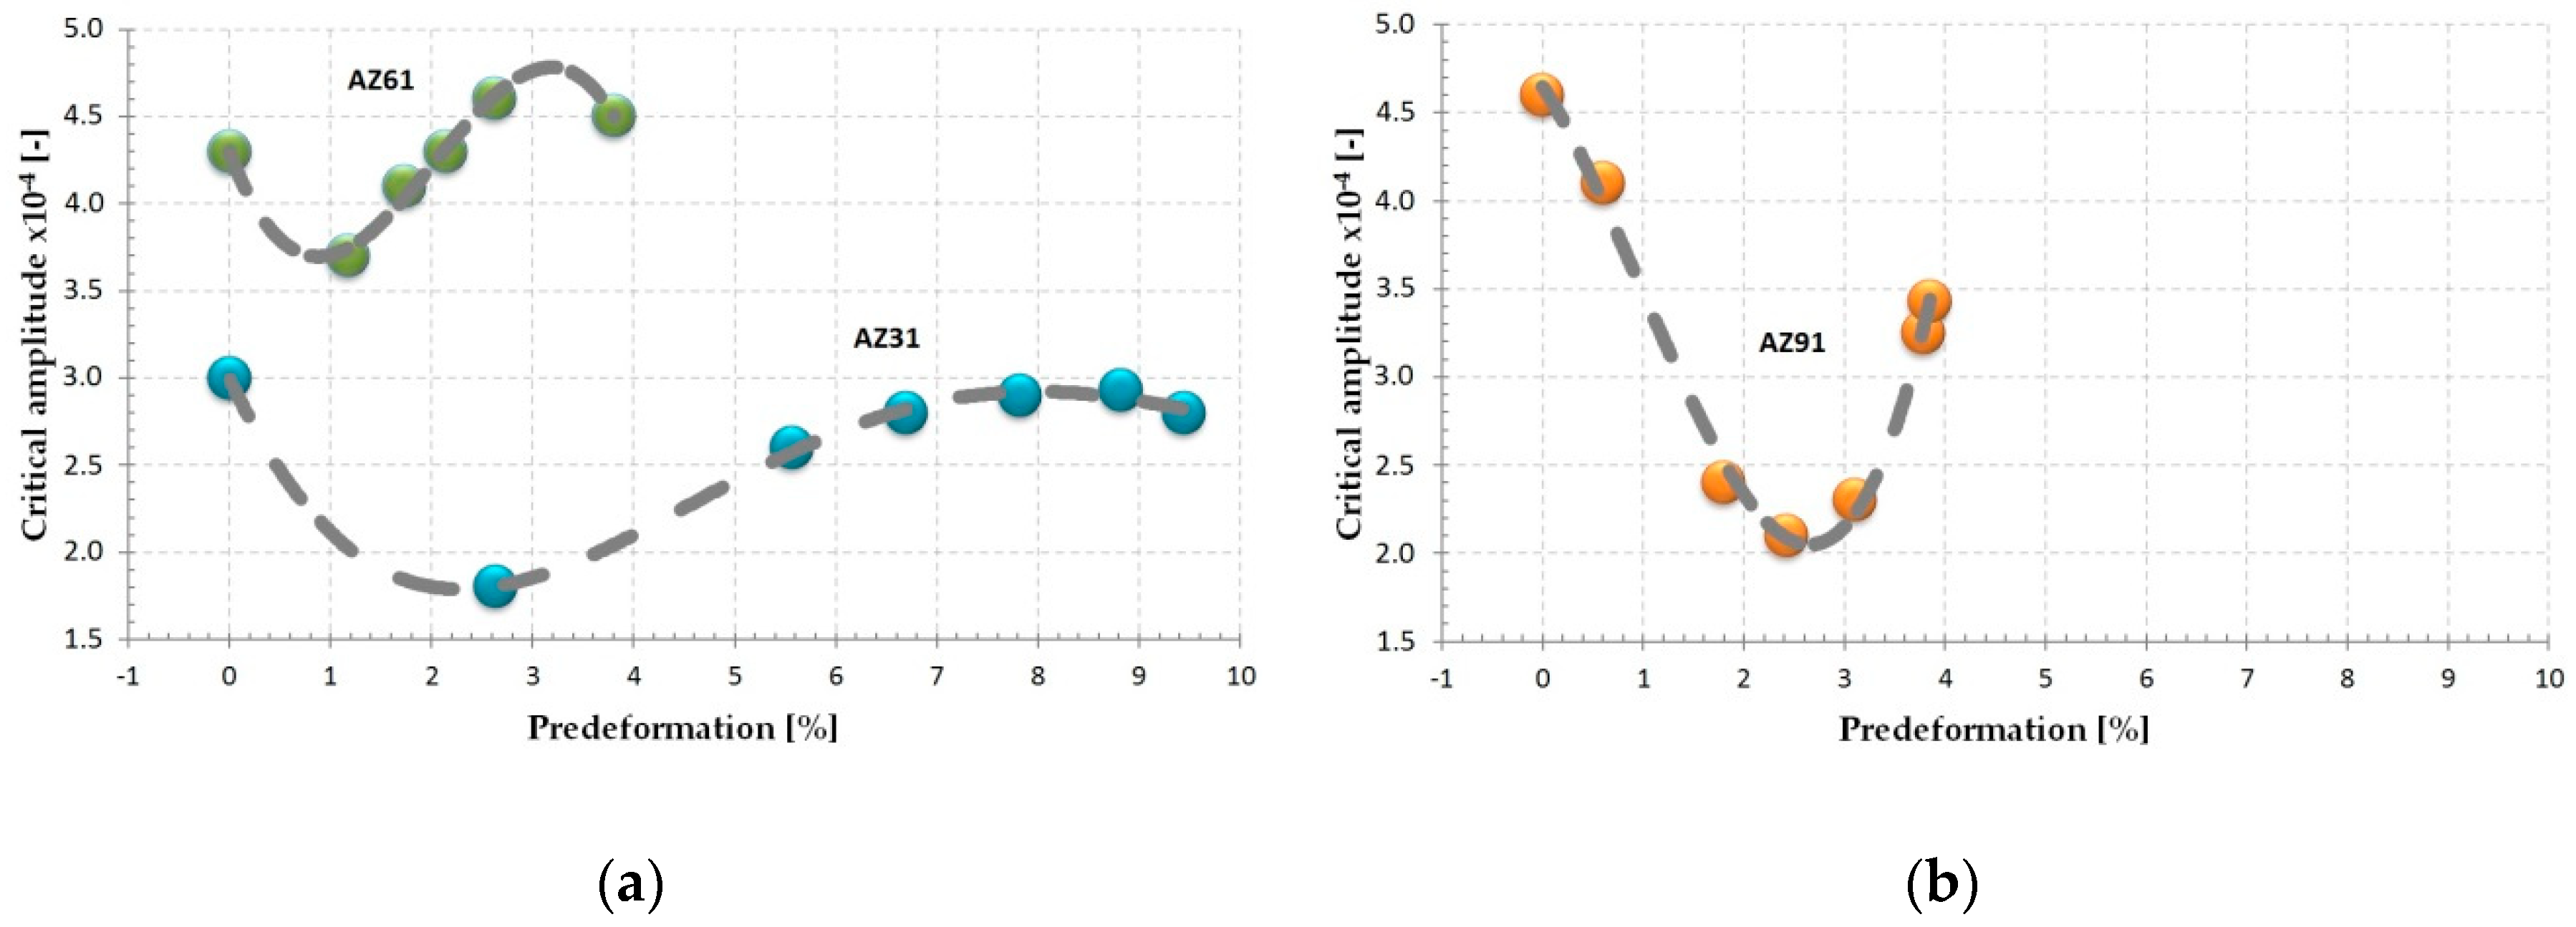
An indirect ultrasonic method was used for the internal friction measurements. This method is based on continuous sample excitation to oscillations at a frequency close to the resonant frequency. The quality factor Q−1 was used as a measure of internal friction. The quality of the resonance system was calculated by measuring the resonance peak (see Figure 7) and finding its width at three decibel levels:
Q 1 = Δ f r 3 d B f r
where fr is the resonant frequency in Hz and Δfr3dB = f2f1 is the width of the resonance peak for the three decibel levels in Hz.
The internal friction measurements were carried out using a precise in-home made apparatus (University of Žilina, Žilina, Slovak Republic) consisting of a transducer, waveguide, and electronic part (Figure 8a). The transducer is the source of ultrasonic waves and in the same time as the detector. All specimens were manufactured from ingots of the relevant material. Their dimensions and shape should fulfill the resonance condition (i.e., the natural frequency must be approximately the same as the frequency of the test equipment ± 10 Hz). Samples rods exhibited the shape of an hourglass with the length of 78 mm and the diameter of 12 mm. In the narrowest point of the sample shaft, the diameter was 5 mm (see Figure 8b) [32].
The resonant system was actuated by piezoceramic elements. The vibration amplitudes of a specimen were controlled by the loading voltage amplitude and measured by an electric current in the circuit. The experiment was controlled by the computer [32]. Internal friction experiments and predeformation of samples were performed at room temperature. For comparison, the ADIF was measured in pure magnesium.
Internal friction measurements were carried out seven times, with the increasing maximum strain amplitude characterized by the increase of the exciting voltage from 1 up to 7 V. The voltage was step by step increased up to the chosen maximum strain amplitude and then the amplitude was again dropped back to zero.
Samples were predeformed step by step in the uniaxial compression test. The strain was calculated from the shortening of samples. The ADIF was measured at the increasing strain amplitudes with a step of 0.1 V up to the maximum amplitude of 7 V.
All measurements of the ADIF were performed on the heat-treated samples (solution annealing at 390 °C with a residence time of 22 h and rapid cooling in water) to ensure a homogeneous structure.

3. Results

Amplitude dependencies of the quality factor Q−1 estimated for the AZ31 alloy and various maximum amplitudes are shown in Figure 9. For small voltages from 1 to 3 V, the internal friction decreased with the increasing amplitude. Reaching the maximum amplitude, the internal friction again decreased with the decreasing amplitude to the default value. The curve obtained for the maximum amplitude of 4 V decreased with increasing strain amplitude, followed by a short region where the internal friction is independent of the strain amplitude. During the measurement back from the maximum amplitude, the internal friction values were practically the same as in the increasing branch. Curves obtained for the three highest three maximum amplitudes exhibited different characteristics. There was a critical amplitude, εcr, at which the initial IF decrease changed into an increase up to the maximum amplitude. During the measurement with the decreasing strain amplitude, estimated IF values were different to values in the increasing branch. In the vicinity of the critical amplitude, both branches again followed the same dependency.
The amplitude dependencies of IF in the AZ61 alloy was performed in a similar manner as that in the case of the AZ31 alloy for the maximum strain amplitudes from 1 V to 7 V (see Figure 10). During the measurement at the highest amplitude of 7 V, the sample broke. Amplitude dependencies of IF exhibited a similar course as in the case of AZ31 alloy. The critical amplitude was found only for the two highest amplitudes.
The amplitude dependencies of IF measured for the AZ91 alloy and the maximum amplitudes from 1 to 7 V are reported in Figure 11. The internal friction values decreased with increasing strain amplitudes and the maximum voltage from 1 to 4 V. The IF values obtained during the measurement with the decreasing amplitude were practically identical to those in the increasing branch. The critical amplitudes were found for the three highest strain amplitude of 5–7 V.
The ADIF measurements were performed for all three alloys after predeformation in compression. The curves estimated for various steps of the plastic deformation of the AZ31 alloy are shown in Figure 12. The IF values decreased with increasing strain amplitude up to a critical amplitude, εcr. For the strain amplitudes higher than the critical amplitude, the IF values again increased. From Figure 12, it follows that the predeformation step strongly influences the critical amplitude, which shifted to higher amplitudes with the increasing plastic strain; some effect of the saturation of this tendency was obvious.
Traces of plastic deformation on the surface of the AZ31 alloy, deformed to ε = 9.44%, are shown in Figure 13a,b. Plenty of deformation bands formed in particular grains was a typical feature of the microstructure of the sample submitted to plastic deformation and the fine structure of the strain bands is visible in Figure 13b.
Amplitude dependencies of IF measured on deformed samples of the AZ61 alloy is are presented in Figure 14. Due to the low plasticity, two samples were examined. Both broke after a small plastic deformation. As above-mentioned, the limited plasticity of the AZ61 samples was most likely due to the higher Zn content in this alloy. The IF decreased with the increasing strain amplitude up to a critical amplitude. Reaching the saddle point, IF increased up to the chosen maximum amplitude. The critical strain amplitude, εcr, increased with the increasing predeformation step. The saturation region was not achieved in this case because of lower compressive predeformation compared with the AZ31 alloy.
Deformation bands and mechanical twins were visible on the surface of the predeformed AZ61 alloy (Figure 15a,b). Brittle γ was broken whereas the region of the discontinuous precipitate was not deformed. Deformation bands were formed inside of grains.
Amplitude dependencies of IF measured for the AZ91 alloys are shown in Figure 16. Two samples were used because the first sample broke during the predeformation procedure. A lower step of deformation was chosen for the second sample with the aim to obtain more than two curves. For both samples, a shift of the critical amplitude to higher values was observed. An exception was the dependency measured after a very low prestrain of 0.67%. This curve exhibited the highest value of the critical strain amplitude.
Figure 17a illustrates the manifestation of plastic deformation on the surface of the AZ91 alloy. Formation of strain bands and twins can be better seen in the enlarged square shown in Figure 17b.
The amplitude dependencies of the internal friction obtained for non-deformed and predeformed alloys are shown in Figure 18. From Figure 18, it can be seen that the influence of the predeformation in parts of the curves lower than the critical strains was only moderate. On the other hand, the critical strain depends on the predeformation step, as reported in Figure 19a,b.

4. Discussion

Regarding the amplitude dependent internal friction, the Granato and Lücke (G–L) model is usually mentioned [16,17]. According to this model, the amplitude dependence of IF may be divided into two regions: for small amplitudes, the quality factor, Q−1, is independent on the amplitude; in the region of higher amplitudes, Q−1 increases with increasing strain amplitude.
Q 1 = Q 0 1 + Q H 1   ,
where Q0−1 is the amplitude independent component of IF and QH−1 is the amplitude dependent or hysteresis IF component. This course of the ADIF was observed many times and also in the case of magnesium and its alloys [13,25,29,33,34,35,36]. The amplitude independent component Q0−1 may be the sum of various contributions; all inhomogeneities in the material, grain boundaries, and particles of the second phase may dampen ultrasonic waves. Dislocations are a very effective source of IF and represent the main contribution to IF in metals and metal matrix composites. Dislocation segments with the length of, , between weak pinning points (vacancies, solute atoms) vibrate in the slip plane and consume mechanical energy carried by ultrasonic waves in collisions with phonons and electrons. Longer dislocation segments with a length L, « L, are pinned in strong pinning points. If the strain amplitude exceeds a critical value, the break-away of longer dislocation segments from weak pinning points and their movement in the slip plane is a source of IF in the amplitude dependent region. If the periodic stress is applied, the longer dislocation segments move in the second half cycle into the opposite direction and the break-away process repeats. The G–L model in its original form was constructed for low temperatures. At high temperatures, the influence of thermal activation must be considered. The amplitude dependent component of IF can be written depending on strain amplitude, ε0, [20]:
Q H 1 = C 1 ε 0 e x p ( C 2 / ε 0 )
where the C1 and C2 parameters depend on dislocation density, ρ, activation energy, U, and length of the longer, L, and shorter, , dislocation segments; C1 parameter ~ 2/3. The stress, σT, which is necessary for a thermal break-away of dislocation loops, σT, at a finite temperature is given by [4]:
σ T = σ M [ 1 ( k T U 1 l n A ) 2 / 3 ]   ,
where A is a parameter and, U1, activation energy; kT has its usual meaning. σM is assumed to be break-away stress in a pure mechanical process. For a double loop with the loop length 1 and 2, it occurs at the stress:
σ M = 2 F m b ( 1 + 2 )
where Fm is the maximum force between dislocations and the pinning point and b is the Burgers vector of dislocations. As the stress and strain amplitudes are related by Hooke’s law, Equation (5) may be rewritten with εcr = σT/E, where E is the unrelaxed Young’s modulus. According to the relationship (5), the critical strain, εcr, depends on the length of shorter dislocation segments, . All experiments were performed at room temperature, thus we may consider that the activation energy is, in the first approximation, constant for all alloys.
The amplitude independent region of IF was not in the reported measurements observed as shown in Figure 9, Figure 10 and Figure 11. Anomalous behavior of IF in the amplitude independent region has been observed by several authors [26,27]. Göken and Riehemann observed a local maximum in the “amplitude independent” region studying the ADIF in an AZ91 alloy submitted to thermal treatment [26]. They described the additional damping to cracks, which were formed after annealing at high temperature (higher than 400 °C) and quenching into water. Opening and closing of cracks consumed mechanical energy carried by the sonic wave. A similar effect of cracks, which were created due to the fatigue of a material after the mechanical loading, was observed in [27]. ADIF dependencies estimated for the increasing strain amplitude measured for pure magnesium are shown in Figure 20. In contrast to AZ alloys, IF increased with the increasing strain amplitude. Pronounced hysteresis was found, which had different character compared with the alloys measured in this study. The decreasing branch of the measured loop was higher than the increasing one. Predeformation in compression increased the IF values up to ε = 5.51%; higher predeformation again decreased the IF (see Figure 21). Such behavior may by explained in terms of the G–L model. Increased dislocation density due to plastic predeformation increased IF and decreased the critical amplitude, εcr. Considering the constant number of pinning points (mainly impurities in Mg) and increased dislocation density, then the effective length of the shorter dislocation segments distended. Amplitude dependencies of the internal friction measured for all three alloys exhibited a different character. These experimental results indicate that solute atoms are most likely responsible for these findings.
The G–L model was developed for “pure” metals, with a relatively small concentration of impurities. In alloys, the dislocation lines may be occupied with solute atoms diffused to the dislocation cores where they find places with lower position energy. An anomalous internal friction peak observed in the “amplitude independent” region of aluminum, containing Cu and Mg solute atoms, was reported by Kệ [37,38]. The basic assumption of the model by Kệ is the existence of geometrical kinks on dislocation lines. These kinks may interact with solute atoms during the dislocation motion, realized by the sidewise motion of kinks. The critical stress necessary to drag the solute atom by the moving kinks at the critical speed should be much smaller than the drag by moving dislocations. Under the action of periodic stress perpendicular to the dislocation line, the kink moves sidewise to and from in the direction of the dislocation line. This means that the solute atom has thus been dragged by a moving kink. Thus, the solute atom always migrates along the dislocation core so that its migration can be much faster than in the lattice. This mechanism is a source of an additional internal friction peak at very low amplitudes. Observed decrease of IF at low amplitudes is very likely due to the decreasing branch of this peak. Reaching a critical strain, amplitude dislocation segments break away from solute atoms and glide in the slip plane. In the next half cycle, dislocations move in the opposite direction and are again trapped by solute atoms. Movement of dislocation segments in the slip plane is the reason for the observed hysteresis at the high amplitudes. The interaction of solute atoms (mainly Al) with the dislocation line in the AZ magnesium alloys during plastic deformation is manifested by the Portevin–LeChâtelier effect, observed for these alloys at room temperature [39,40,41,42]. This fact testifies that solute atoms are, at room temperature, movable for a short distance in the stress field around the dislocation core. Note that the deformation experiments are performed at a considerably lower frequency of 10−5–10−3 Hz.
In experiments with the step by step increasing maximum strain amplitude, the critical strain, εcr, increased with the increasing maximum strain amplitude. This result is very probably due to the presence of solute atoms. Vibrating dislocation segments are occupied by solutes rather than when the length of shorter dislocation segments is smaller. According to (3) and (4), the stress (strain) for the dislocation break-away must be higher. This hypothesis was supported by the experiment in which the sample was held at 5 min on the maximum amplitude. In this case, the critical amplitude increased (see Figure 22).
The critical amplitude, εcr, decreased for the lower predeforation steps (up to approximately 2% of plastic deformation) and then increased again (see Figure 19a,b) approaching the saturated region in the AZ31 and AZ61 alloys. Predeformation of samples higher than ~2% increased the critical strain at which the quality factor started to increase rapidly. Predeformation in compression increased the dislocation density and density of the newly created twins. The influence of twins on IF has been observed in several studies [29,43]; the twin boundaries are due to some inhomogeneity in the material and so influences the IF values. Note that the effect of the twins’ boundary does not depend on the strain amplitude.
Experimental results showed that:
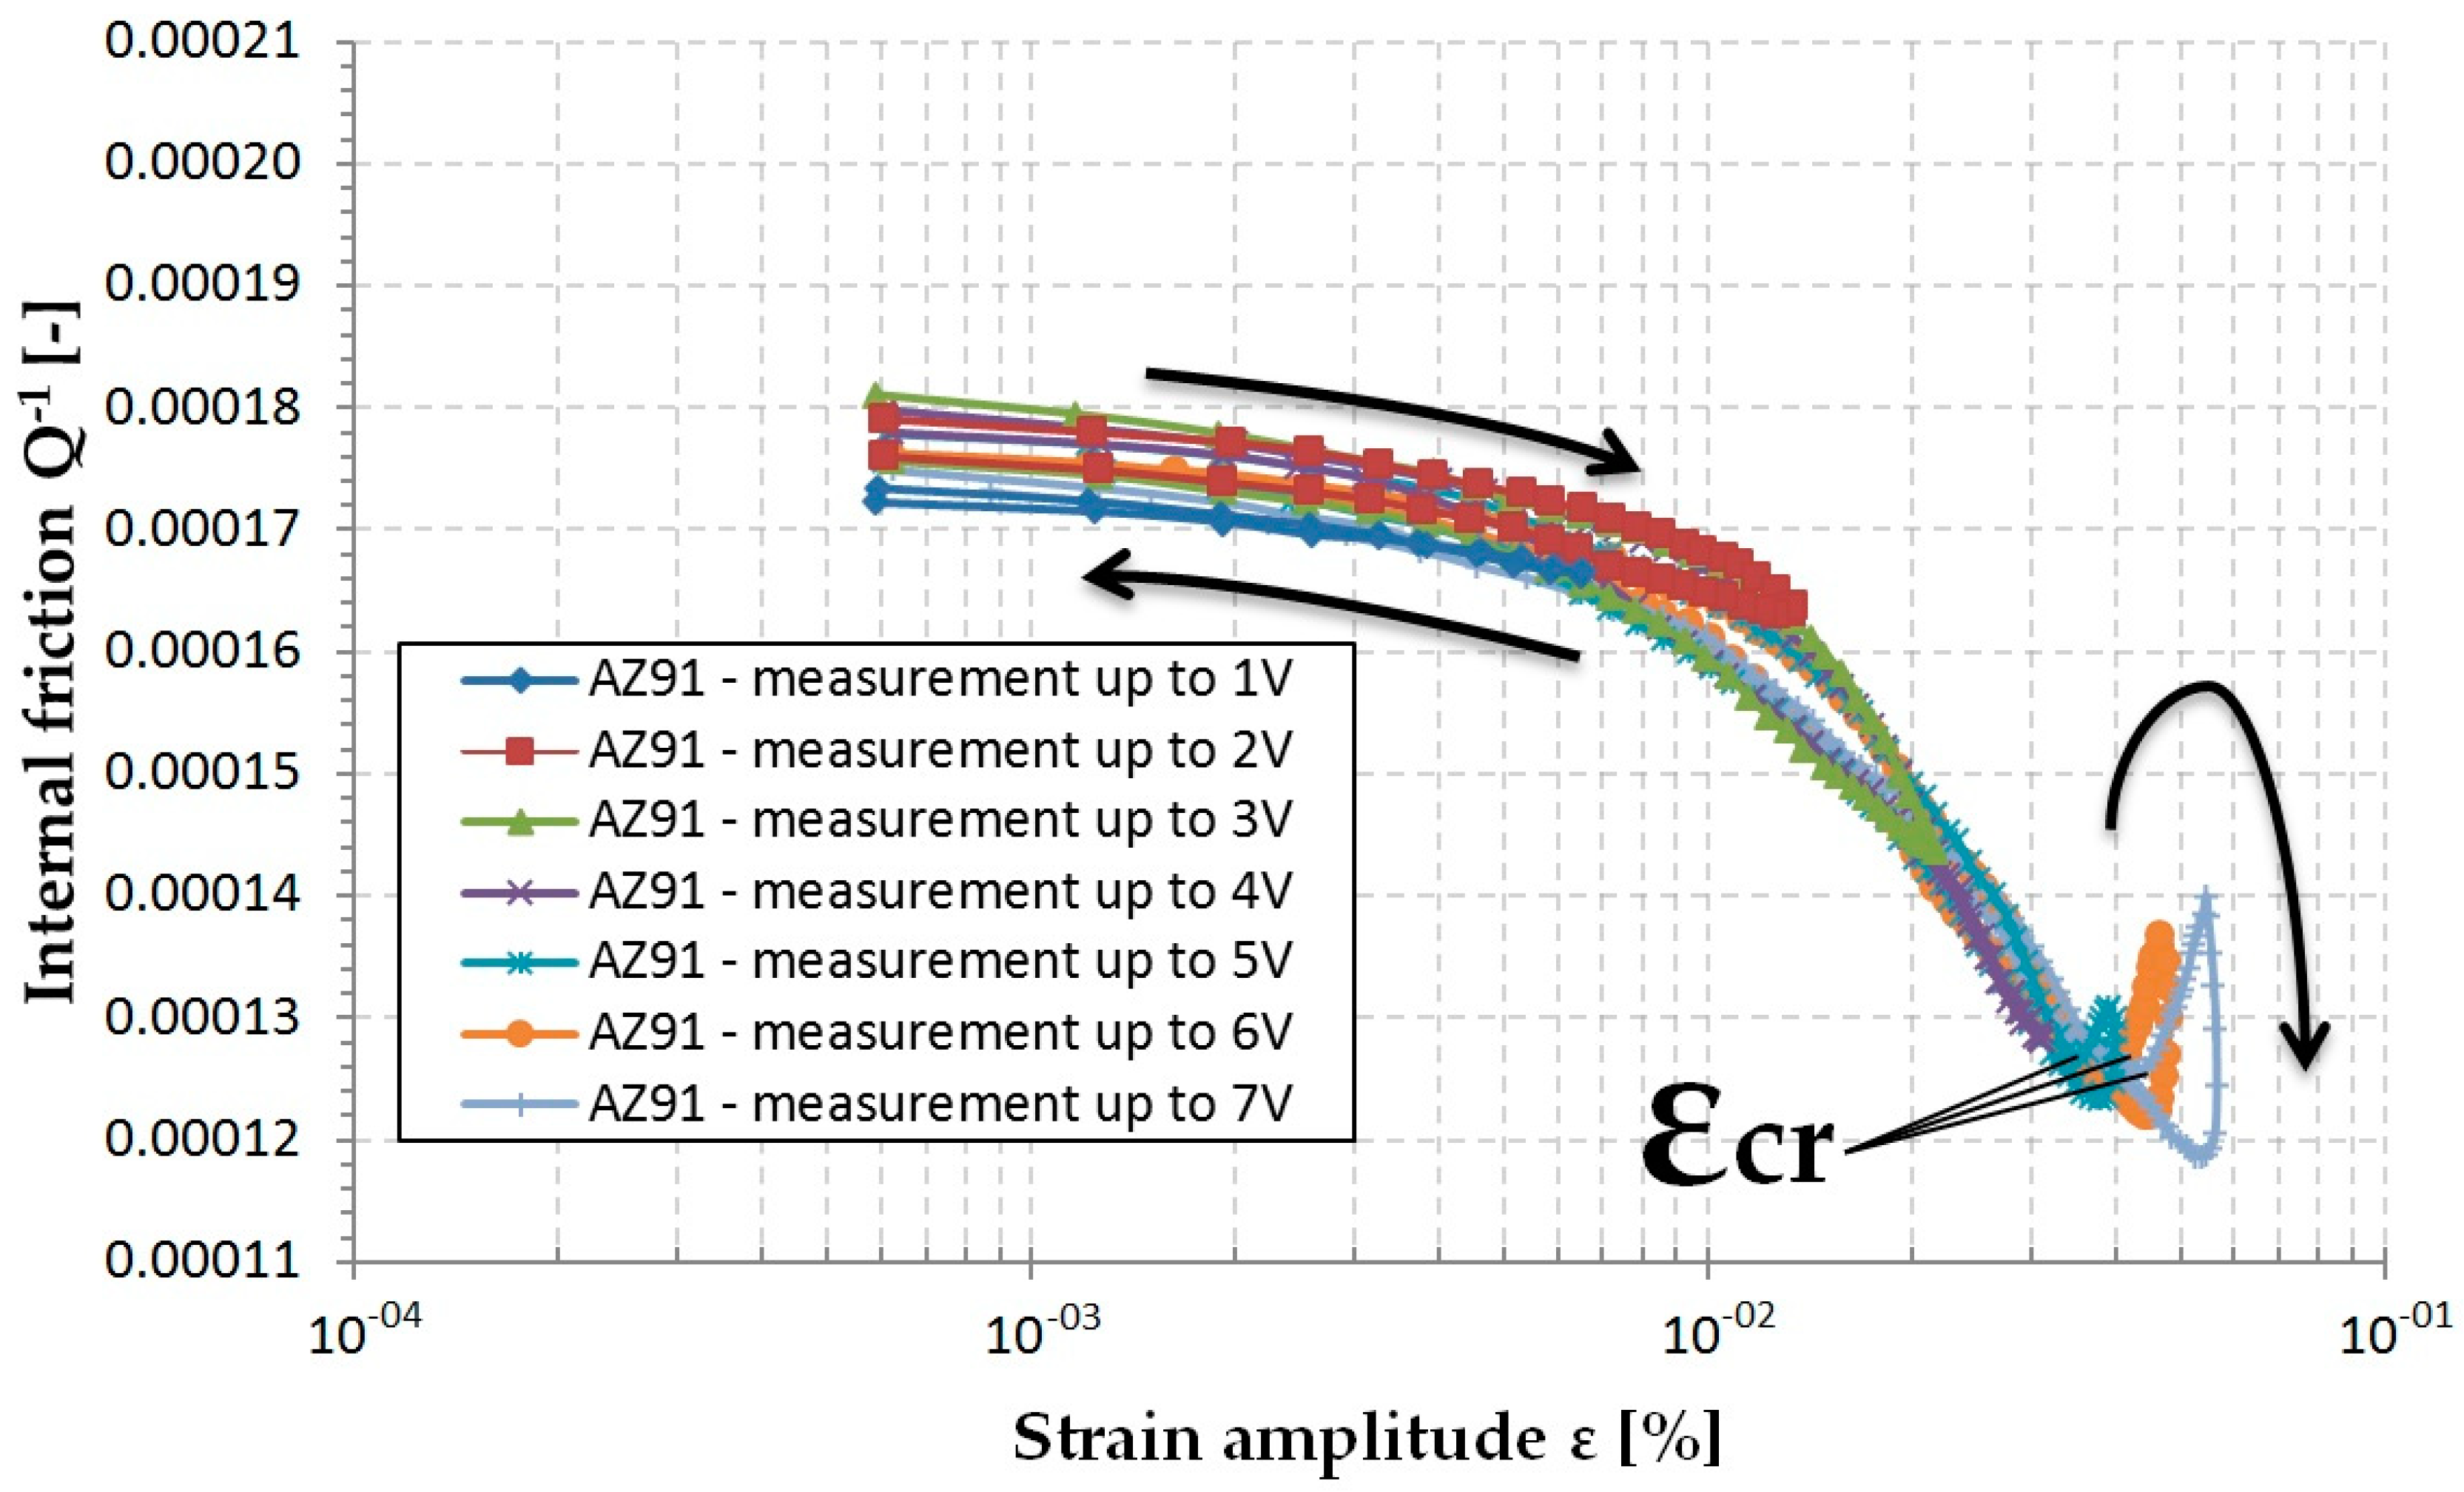
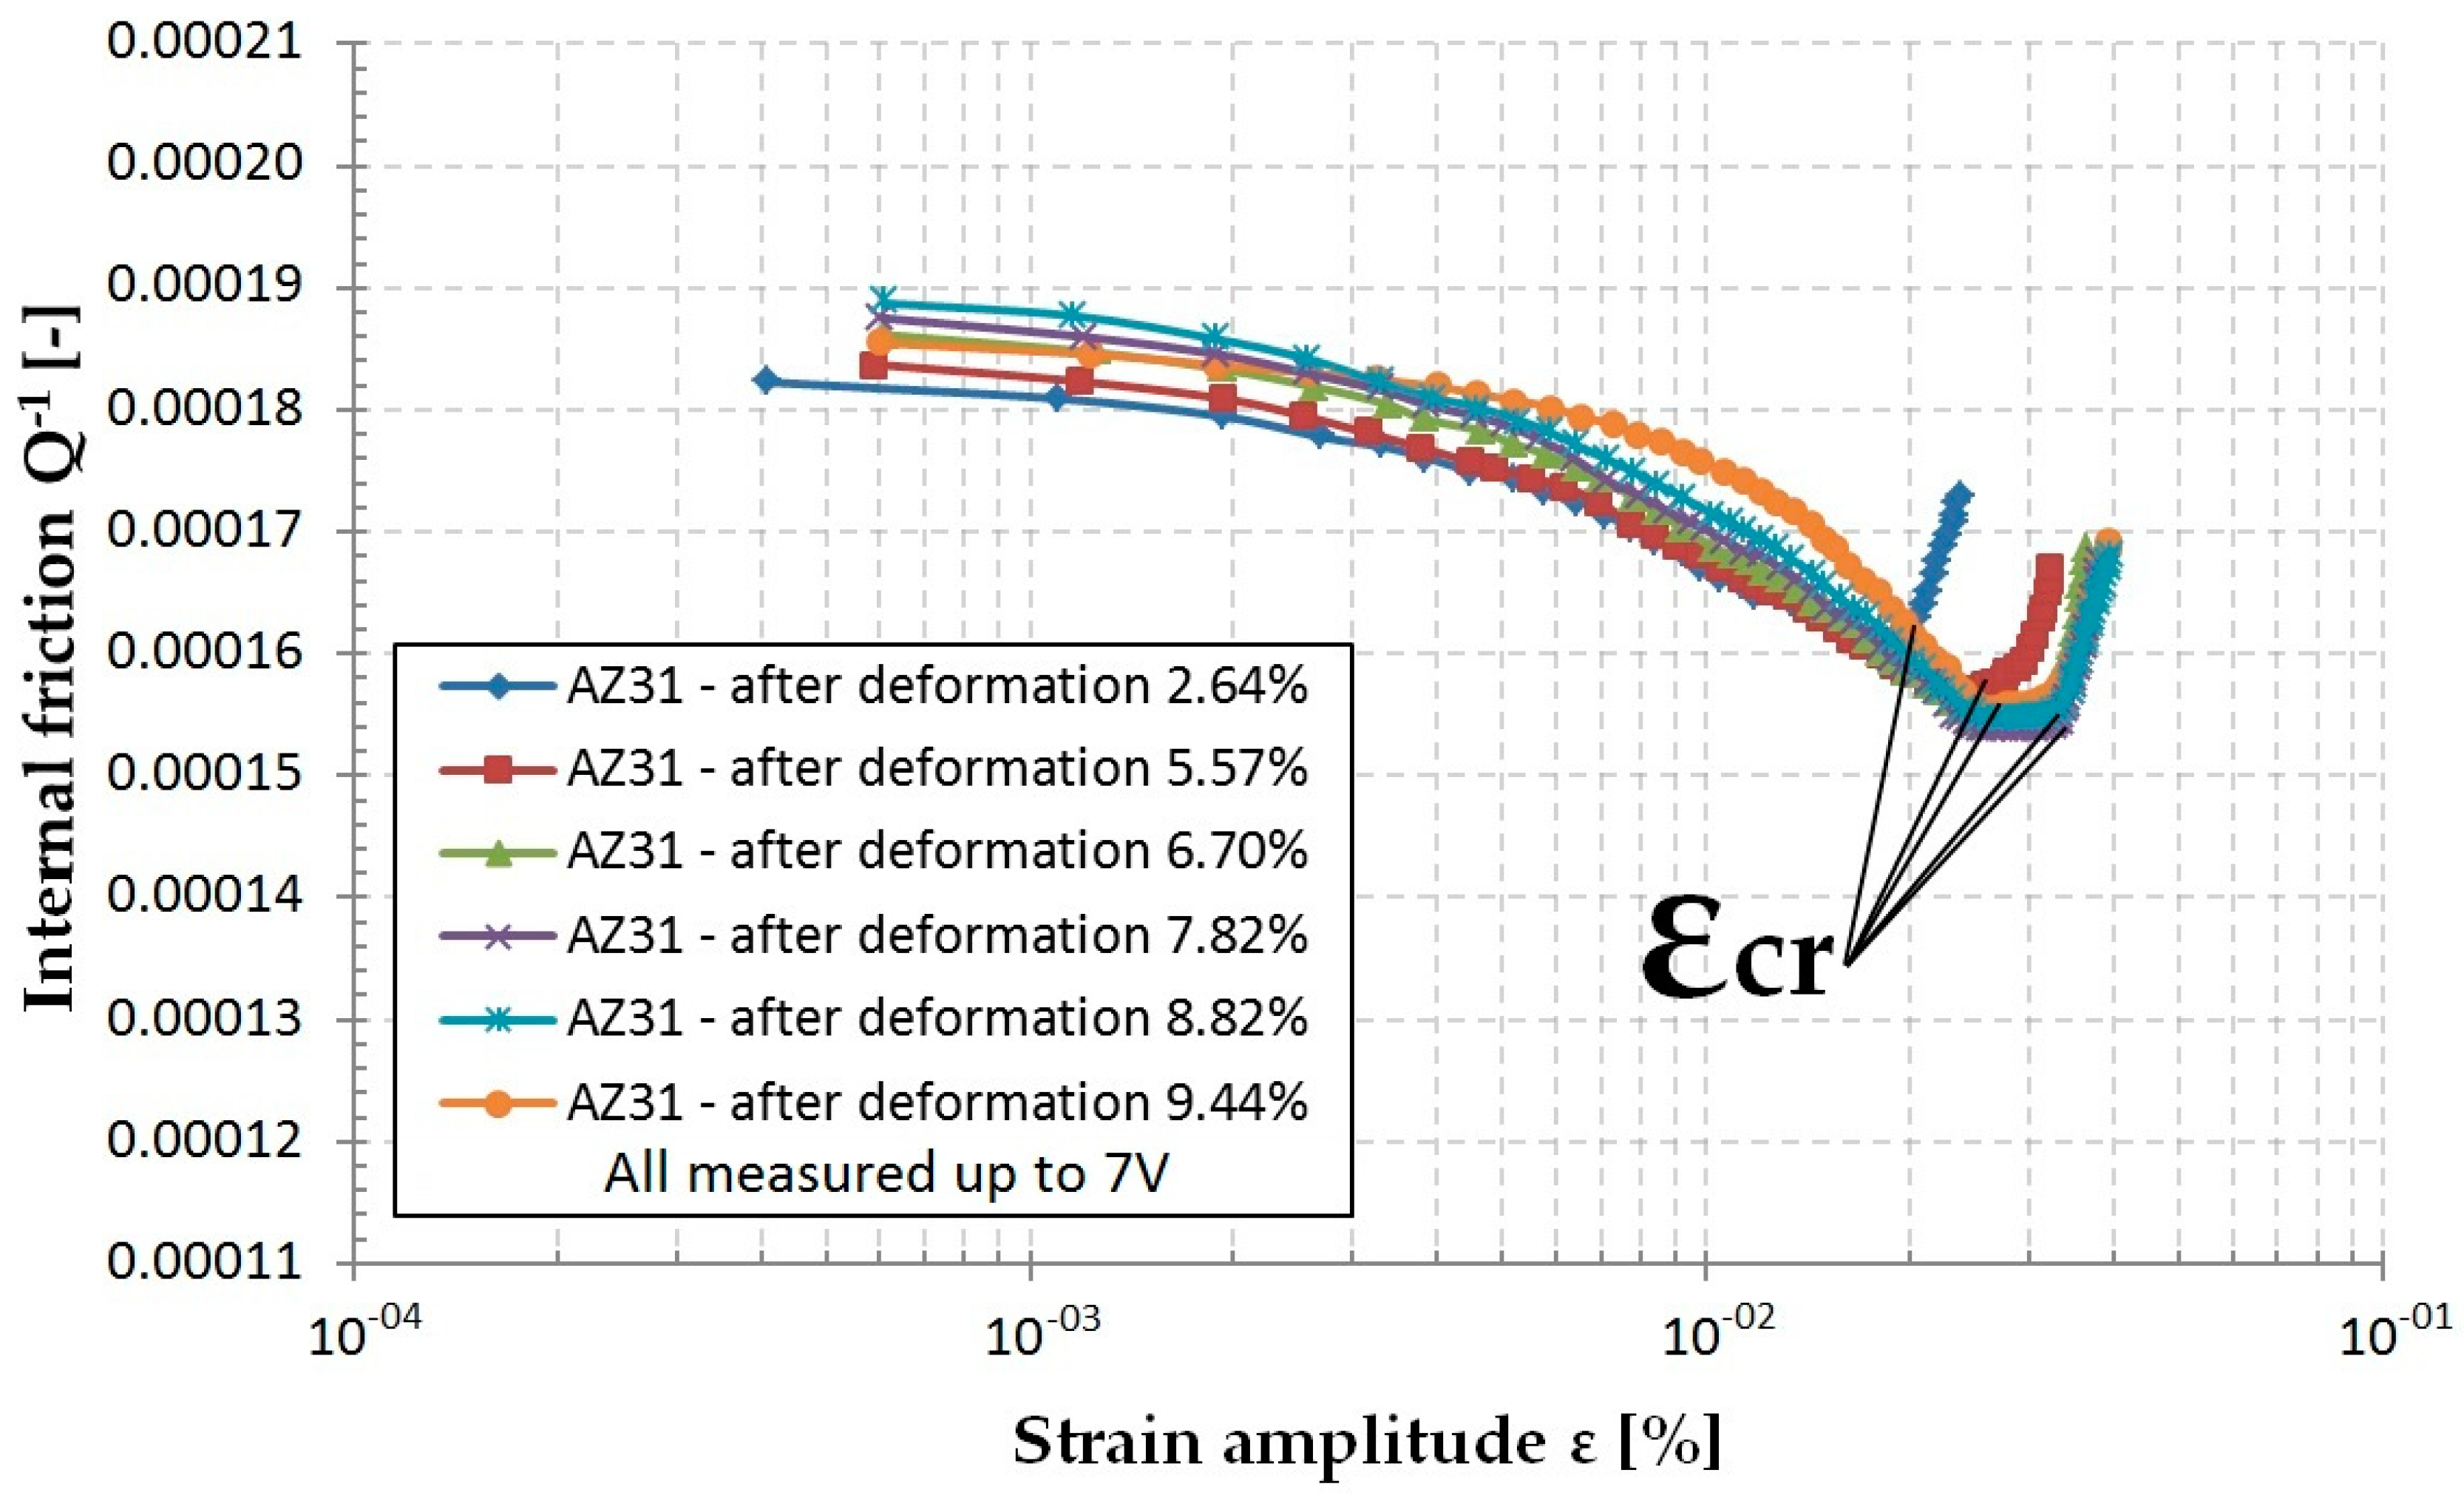
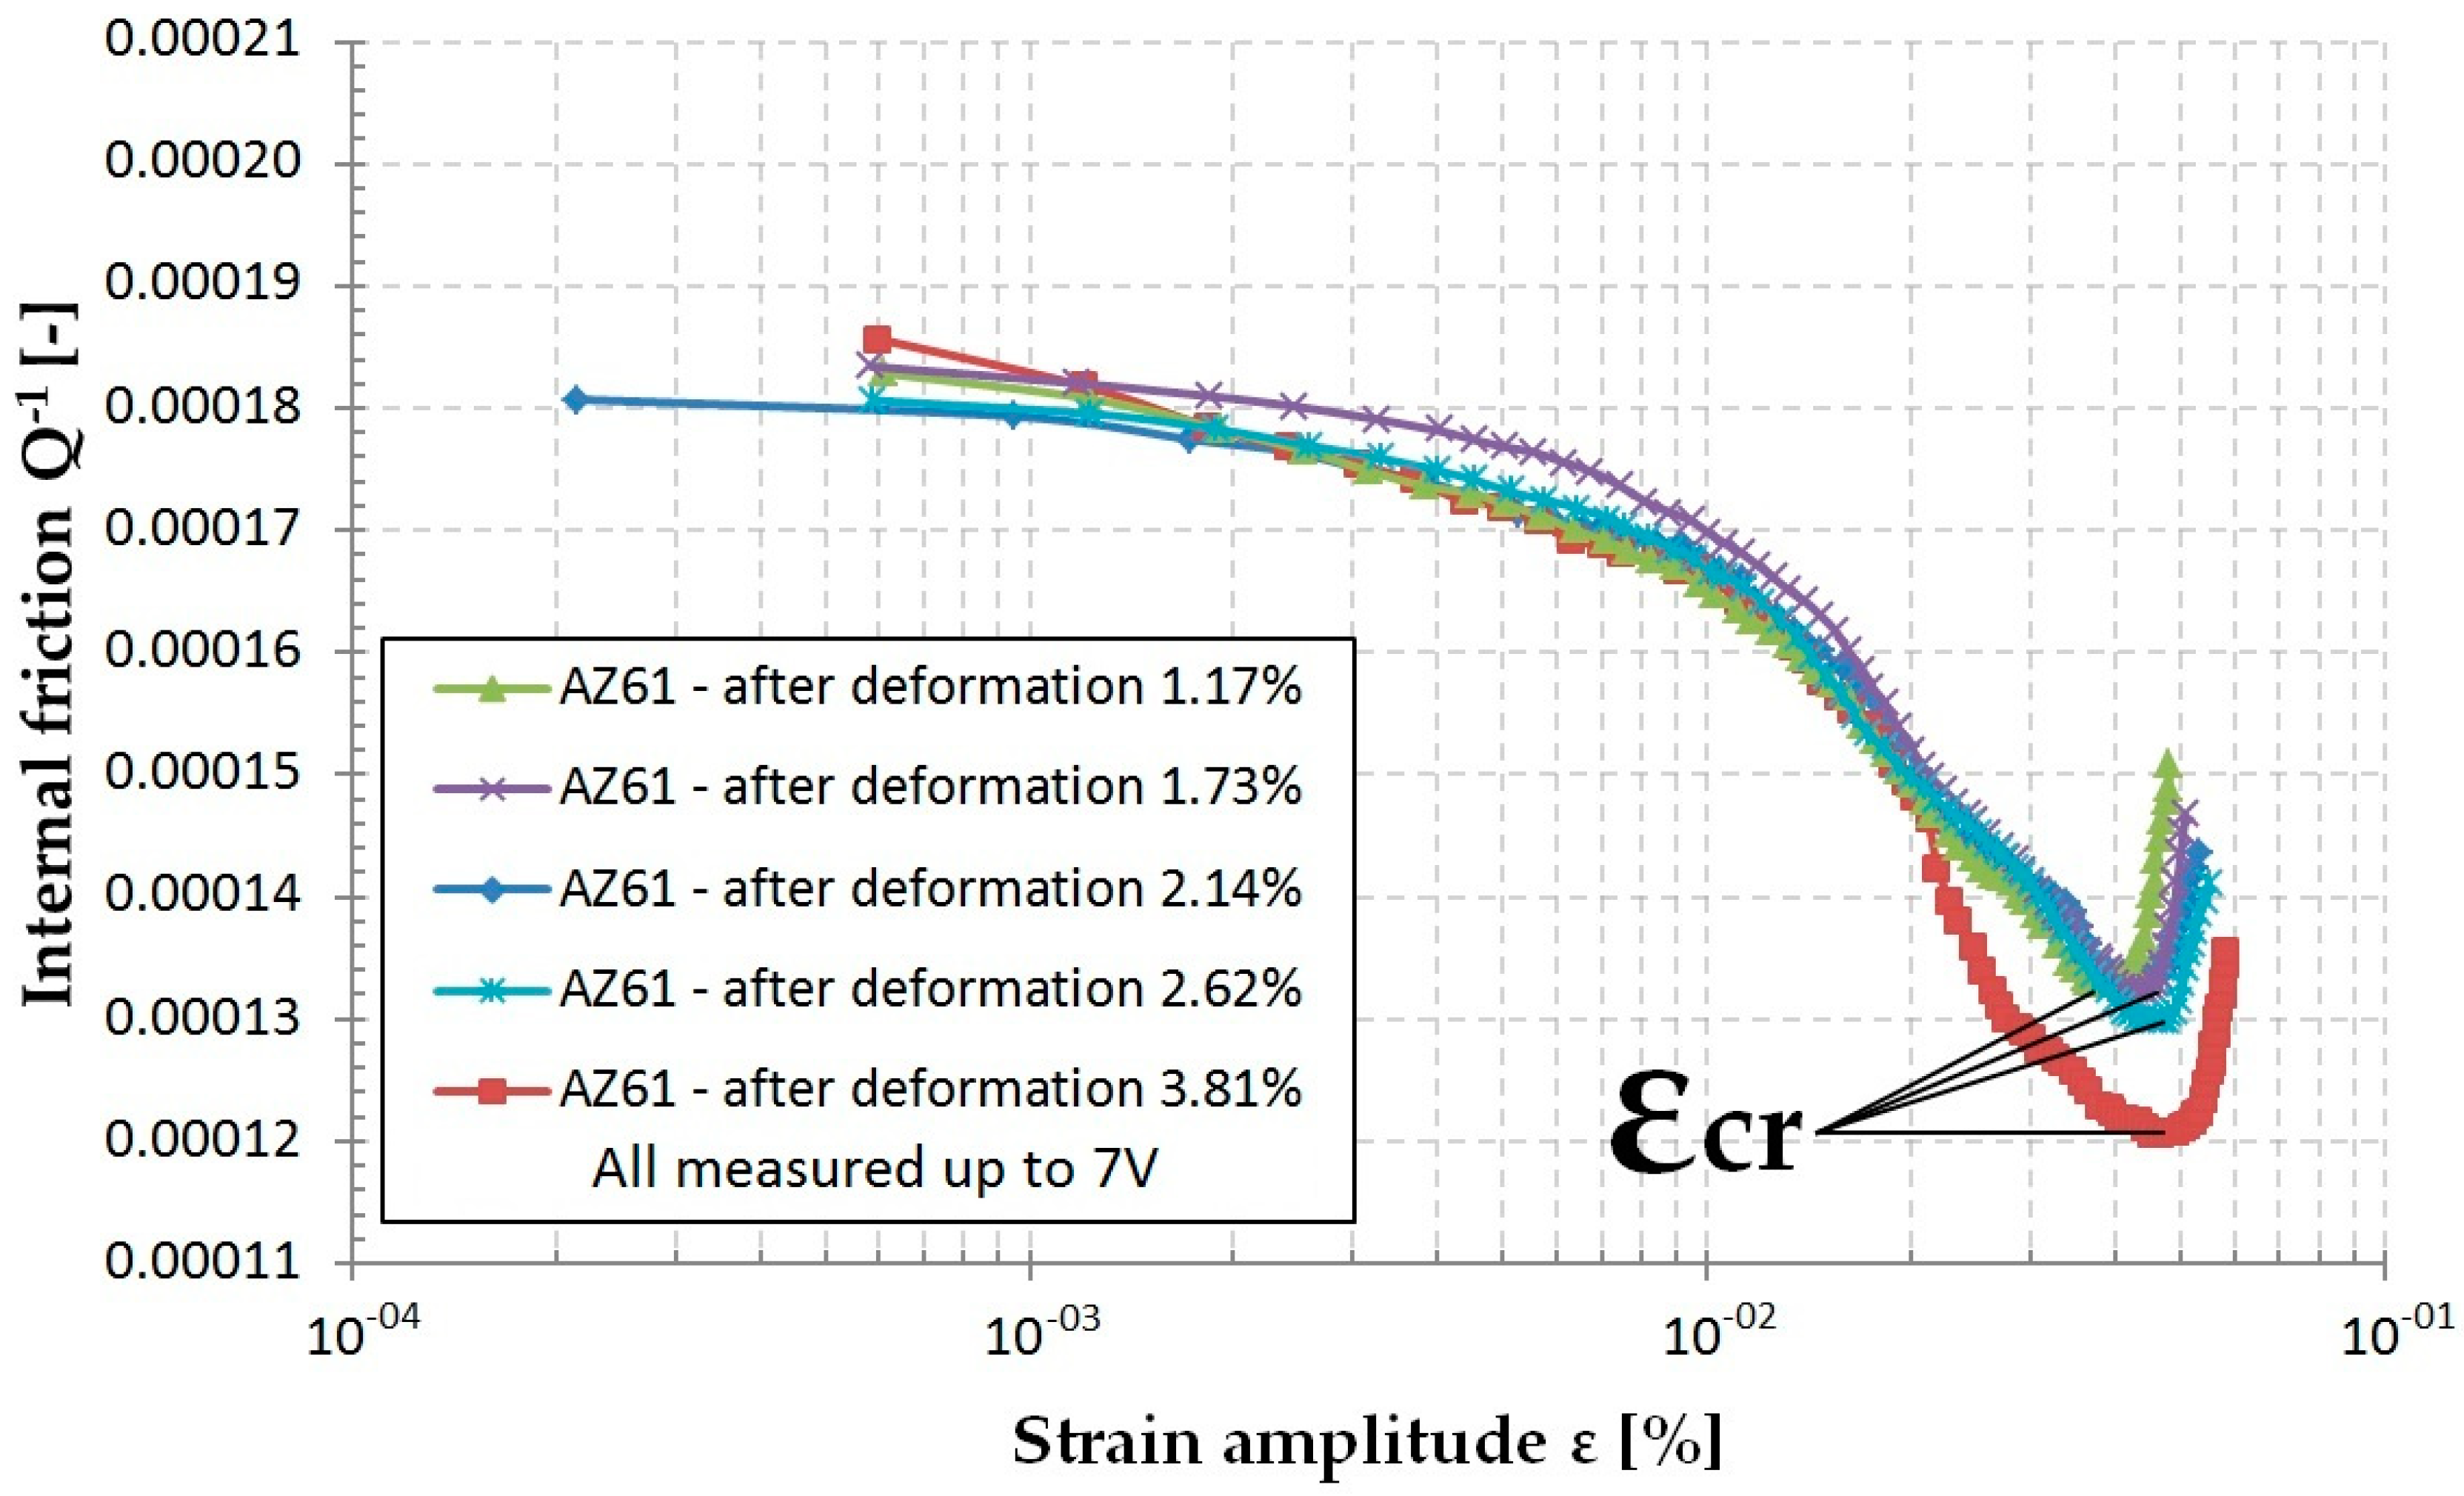
  • The critical strain, εcr, after the initial rapid decrease in the region of small predeformation steps, again increased with the increasing maximum strain amplitude; and
  • A saturation region of the εcr vs % of predeformation was observed for the AZ31 and AZ61 alloys.
Observed decrease of the critical strain is very probably a consequence of the increased dislocation density. “Fresh” newly created dislocations are better movable and exhibit higher length of shorter dislocation segments, . As the critical strain is inversely proportional to , the critical strain decreases. If the dislocation density increases (the predeformation steps higher than 2–3% of plastic deformation), the dislocation mobility is restricted, and solute atoms (mainly dissolved Al) occupy the dislocation lines, and competition between depinning and dragging of solute atoms may take place. The mechanism of interaction depends on the ratio of two interaction energies: the binding energy between the dislocation and solute atoms and migration energy of the solutes. The dislocation line is partially occupied by solute atoms which are dragged, and the higher force is necessary for the depinning act. The existence of competition between dragging and depinning was experimentally observed in cold worked fcc metals [44]. Such behavior may explain why the critical strain increases with increasing maximum strain amplitude. The solute atoms occupied dislocation lines and for the depinning, higher stress (strain) is necessary. With the increasing dislocation density after predeformation, the mobility of dislocation segments decreases. The distance of solutes to the dislocation lines also decreases. This is probably the reason why dislocation lines are fully saturated with the solute atoms and the length of shorter dislocation segments, , is of the order of units b. The stress for the break-away of dislocations is higher due to collective pinning of solute atoms [24]. Note that acoustic phonons carried by the ultrasonic wave may very well activate these processes.

5. Conclusions

Three Mg–Al–Zn alloys were submitted to homogenization annealing. Amplitude dependencies of internal friction were measured at room temperature on non-deformed samples and samples plastically deformed in compression. In the deformed microstructure, deformation bands containing new dislocations and twins were observed. IF decreased with increasing strain amplitude, then approaching a critical amplitude, the internal friction rapidly increased. Such shape of the ADIF curves was estimated for all alloys while the curves obtained for pure Mg were different. The critical amplitude changed, depending on the maximum strain amplitude. Predeformation of samples up to 2–3% decreased the critical strain amplitude. Higher plastic deformation increased the critical amplitude. Such behavior cannot simply be explained by the Granato and Lücke model of the amplitude dependent internal friction in which dislocation segments oscillate in the field of not mobile pinning points. In the presented study, amplitude dependencies of IF showed that solute atoms may migrate at low amplitudes along the dislocation lines and in the region of higher amplitudes, competition between the dragging of solute atoms and break-away from dislocations play important roles.

Author Contributions

Conceived and designed the experiments, P.P. and Z.T.; Performed the experiments, M.U. and Z.D.; Analyzed the data, M.U., Z.D., P.H., P.P., and M.C.; Contributed reagents/materials/analysis tools, M.U., Z.D., P.P., and Z.T.; Wrote the paper, M.U. and Z.T. All authors have read and agreed to the published version of the manuscript.

Funding

This work was supported by the Scientific Grant Agency of Ministry of Slovak Republic and Slovak Academy of Science, No. 013ŽU-4/2019 (KEGA), No. 016ŽU-4/2020 (KEGA), No. 1/0398/19 (VEGA) and No. 1/0134/20 (VEGA).

Conflicts of Interest

The authors declare no conflict of interest.

References

  1. Polmear, I.; StJohn, D.; Nie, J.F.; Qian, M. Light Alloys, 5th ed.; Butterworth-Heinemann: Waltham, MA, USA, 2017; pp. 109–156. [Google Scholar]
  2. Luo, A.A.; Sachdev, A.K. Advances in Wrought Magnesium Alloys, 1st ed.; Bettles, C., Barnett, M., Eds.; Woodhead Publishing: London, UK, 2012; pp. 393–426. [Google Scholar]
  3. Luo, A.; Pekguleryuz, M.O. Cast magnesium alloys for elevated temperature applications. J. Mater. Sci. 1994, 29, 5259–5271. [Google Scholar] [CrossRef]
  4. Bettles, C.; Gibson, M. Current wrought magnesium alloys: Strengths and weaknesses. JOM 2005, 57, 46–49. [Google Scholar] [CrossRef]
  5. Yang, Z.; Li, J.P.; Zhang, J.X.; Lorimer, G.W.; Robson, J. Review on research and development of magnesium alloys. Acta Metall. Sin. (Engl. Lett.) 2008, 21, 313–328. [Google Scholar] [CrossRef]
  6. Witte, F.; Fischer, J.; Nellesen, J.; Crostack, H.-A.; Kaese, V.; Pisch, A.; Beckmann, F.; Windhagen, H. In vitro and in vivo corrosion measurements of magnesium alloys. Biomaterials 2006, 27, 1013–1018. [Google Scholar] [CrossRef] [PubMed]
  7. Doležal, P.; Zapletal, J.; Fintová, S.; Trojanová, Z.; Greger, M.; Roupcová, P.; Podrábský, T. Influence of processing techniques on microstructure and mechanical properties of a biodegradable Mg-3Zn-2Ca alloy. Materials 2016, 9, 880. [Google Scholar] [CrossRef] [Green Version]
  8. Zhang, S.X.; Zhang, X.N.; Zhao, C.L.; Li, J.N.; Song, Y.; Xie, C.Y.; Tao, H.R.; Zhang, Y.; He, Y.H.; Jiang, Y.; et al. Research on an Mg-Zn alloy as a degradable biomaterial. Acta Biomater. 2010, 6, 626–640. [Google Scholar] [CrossRef]
  9. Mordike, B.L.; Ebert, T. Magnesium: Properties—Applications—Potential. Mater. Sci. Eng. A Struct. Mater. Prop. Microstruct. Process. 2001, 302, 37–45. [Google Scholar] [CrossRef]
  10. Wan, D.; Wang, J.; Wang, G.; Lin, L.; Feng, Z.; Yang, G. Precipitation and responding damping behavior of heat-treated AZ31 magnesium alloy. Acta Metall. Sin. (Engl. Lett.) 2009, 22, 1–6. [Google Scholar] [CrossRef] [Green Version]
  11. Zhang, Z.; Zeng, X.; Ding, W. The influence of heat treatment on damping response of AZ91D magnesium alloy. Mater. Sci. Eng. A Struct. Mater. Prop. Microstruct. Process. 2005, 392, 150–155. [Google Scholar] [CrossRef]
  12. Celotto, S. TEM study of continuous precipitation in Mg-9 wt% Al-1 wt% Zn alloy. Acta Mater. 2000, 48, 1775–1787. [Google Scholar] [CrossRef]
  13. González-Martínez, R.; Göken, J.; Letzig, D.; Steinhoff, K.; Kainer, K.U. Influence of aging on damping of the magnesium-aluminium-zinc series. J. Alloys Compd. 2007, 437, 127–132. [Google Scholar] [CrossRef]
  14. Mato, R.R.A.M.; Mufuruki, T.S. Noise pollution associated with the operation of the Dar es Salaam International Airport. Transp. Res. Part D Transp. Environ. 1999, 4, 81–89. [Google Scholar] [CrossRef]
  15. Ritchie, I.G.; Pan, Z.L.; Sprungmann, K.W.; Schmidt, H.K.; Dutton, R. High damping alloys—The metallurgist’s cure for unwanted vibrations. Can. Metall. Q. 1987, 26, 239–250. [Google Scholar] [CrossRef]
  16. Granato, A.V.; Lücke, K. Theory of mechanical damping due to dislocations. J. Appl. Phys. 1956, 27, 583–593. [Google Scholar] [CrossRef]
  17. Granato, A.V.; Lücke, K. Application of dislocation theory to internal friction phenomena at high frequencies. J. Appl. Phys. 1956, 27, 789–805. [Google Scholar] [CrossRef]
  18. Granato, A.V. Internal studies in dislocation motion. In Dislocation Dynamics; Rosenfield, A.R., Hahn, G.T., Bement, A.L., Jr., Jaffee, R.I., Eds.; McGraw-Hill: New York, NY, USA, 1968; p. 117. [Google Scholar]
  19. Granato, A.V.; Lücke, K. Temperature dependence of amplitude-dependent dislocation damping. J. Appl. Phys. 1981, 52, 7136–7142. [Google Scholar] [CrossRef]
  20. Teutonico, L.J.; Granato, A.V.; Lücke, K. Theory of the thermal breakaway of a pinned dislocation line with application to damping phenomena. J. Appl. Phys. 1964, 35, 220–234. [Google Scholar] [CrossRef]
  21. Marchesoni, F.; Segoloni, D. The string model of dislocation damping revisited. Acta Phys. Pol. Ser. B 1993, 24, 865–889. [Google Scholar]
  22. Gremaud, G.; Kustov, S. Non-linear elasticity due to dislocation-solute atom interactions in solid solutions. J. Alloys Compd. 2000, 310, 85–90. [Google Scholar] [CrossRef]
  23. Gremaud, G. Dislocation-point defect interaction. In Mechanical Spectroscopy; Schaller, R., Fantozzi, G., Graemaud, G., Eds.; Trans Tech Publications LTD: Uetikon-Zuerich, Switzerland, 2001; Volume 366–368, pp. 178–246. [Google Scholar]
  24. D´Anna, G.; Benoit, W.; Vinokur, V.M. Internal friction and dislocation collective pinning in disordered quenched solid solutions. J. Appl. Phys. 1997, 82, 5983–5990. [Google Scholar] [CrossRef]
  25. González-Martínez, R.; Göken, J.; Letzig, D.; Timmerberg, J.; Steinhoff, K.; Kainer, K.U. Influence of heat treatment on damping behaviour of the magnesium wrought alloy AZ61. Acta Metall. Sin. (Engl. Lett.) 2007, 20, 235–240. [Google Scholar] [CrossRef]
  26. Göken, J.; Riehemann, W. Damping behaviour of AZ91 magnesium alloy with cracks. Mater. Sci. Eng. A 2004, 370, 417–421. [Google Scholar] [CrossRef]
  27. Trojanová, Z.; Mielczarek, A.; Riehemann, W.; Lukáč, P. Cyclic bending and the damping behaviour of short fibre-reinforced magnesium alloy AZ91. Compos. Sci. Technol. 2006, 66, 585–590. [Google Scholar] [CrossRef]
  28. Jun, J.-H. Damping behavior of Mg-Zn-Al casting alloys. Mater. Sci. Eng. A 2016, 665, 86–89. [Google Scholar] [CrossRef]
  29. Trojanová, Z.; Lukáč, P.; Džugan, J.; Halmešová, K. Amplitude dependent internal friction in a Mg-Al-Zn alloy studied after thermal and mechanical treatment. Metals 2017, 7, 433. [Google Scholar] [CrossRef] [Green Version]
  30. Hurtalová, L.; Tillová, E.; Chalupová, M.; Belan, J.; Vaško, A. Microstructure control of secondary A 231 cast alloy used in automotive industry. Manuf. Technol. J. Sci. Res. Prod. 2014, 14, 326–333. [Google Scholar]
  31. Belan, J.; Kuchariková, L.; Vaško, A.; Tillová, E. Applied heat treatment and its influence on IN 718 alloy fatigue life. Manuf. Technol. J. Sci. Res. Prod. 2016, 16, 865–870. [Google Scholar]
  32. Palček, P.; Porubčan, J.; Blažek, D.; Trojanová, Z. Internal friction in commercial aluminium alloy AW-2007. Procedia Eng. 2011, 10, 1226–1231. [Google Scholar] [CrossRef] [Green Version]
  33. Trojanová, Z.; Chmelík, F.; Lukáč, P.; Rudajevová, A. Changes in the microstructure of QE22 composites estimated by non-destructive methods. J. Alloys Compd. 2002, 339, 327–334. [Google Scholar] [CrossRef]
  34. Trojanová, Z.; Lukáč, P.; Chmelík, F.; Riehemann, W. Microstructural changes in ZE41 composite estimated by acoustic measurements. J. Alloys Compd. 2003, 355, 113–119. [Google Scholar] [CrossRef]
  35. Trojanová, Z.; Drozd, Z.; Lukáč, P.; Minárik, P.; Džugan, J.; Halmešová, K. Amplitude-dependent internal friction in AZ31 alloy sheets submitted to accumulative roll bonding. Low Temp. Phys. 2018, 44, 1233–1240. [Google Scholar] [CrossRef]
  36. Blažek, D.; Palček, P.; Trojanová, Z.; Porubčan, J. Amplitude dependent internal friction of magnesium alloy AZ31 at room temperature. Solid State Phenom. 2012, 184, 179–184. [Google Scholar] [CrossRef]
  37. Kê, T.S. Low frequency internal-friction peaks as a function of strain amplitude in cold-worked dilute aluminium alloys. J. Phys. Colloq. 1981, 42, 307–312. [Google Scholar] [CrossRef]
  38. Kê, T.S. Anomalous internal friction peaks as function of strain amplitude. J. Phys. Colloq. 1985, 46, 267–275. [Google Scholar] [CrossRef]
  39. Cáceres, C.H.; Griffiths, J.R.; Davidson, C.J.; Newton, C.L. Effects of solidification rate and ageing on the microstructure and mechanical properties of AZ91 alloy. Mater. Sci. Eng. A 2002, 325, 344–355. [Google Scholar] [CrossRef]
  40. Corby, C.; Cáceres, C.H.; Lukáč, P. Serrated flow in magnesium alloy AZ91. Mater. Sci. Eng. A 2004, 387–389, 22–24. [Google Scholar] [CrossRef]
  41. Trojanová, Z.; Cáceres, C.H. On the strain to the onset of serrated flow in a magnesium alloy. Scr. Mater. 2007, 56, 793–796. [Google Scholar] [CrossRef]
  42. Trojanová, Z.; Cáceres, C.H.; Lukáč, P.; Čížek, L. Serrated flow in AZ91 magnesium alloy in tension and compression. Kov. Mater. 2008, 46, 249–256. [Google Scholar]
  43. Watanabe, H.; Sasakura, Y.; Ikeo, N.; Mukai, T. Effect of deformation twins on damping capacity in extruded pure magnesium. J. Alloys Compd. 2015, 626, 60–64. [Google Scholar] [CrossRef]
  44. Lebedev, A.B.; Ivanov, V.I. The temperature dependences of internal friction and yield stress in Al alloys. Mater. Sci. Forum 1993, 119–121, 245–250. [Google Scholar] [CrossRef]
Figure 1. Microstructure of the AZ31 alloy in the initial state. (a) Light micrograph. (b) Electron micrograph. Picric acid was used for etching.
Crystals 10 00608 g001
Figure 2. Microstructure of the AZ31 alloy after heat treatment. (a) Light micrograph. (b) Electron micrograph. Picric acid was used for etching.
Crystals 10 00608 g002
Figure 3. Microstructure of the AZ61 alloy in the initial state. (a) Light micrograph. (b) Electron micrograph. Picric acid was used for etching.
Crystals 10 00608 g003
Figure 4. Microstructure of the AZ61 alloy after heat treatment. (a) Light micrograph. (b) Electron micrograph. Picric acid was used for etching.
Crystals 10 00608 g004
Figure 5. Microstructure of the AZ91 alloy in the initial state. (a) Light micrograph. (b) Electron micrograph. Picric acid was used for etching.
Crystals 10 00608 g005
Figure 6. Microstructure of the AZ91 alloy after heat treatment. (a) Light micrograph. (b) Electron micrograph. Picric acid was used for etching.
Crystals 10 00608 g006
Figure 7. Schematic drawn of the resonant curve and estimation of the limiting frequencies f1 and f2.
Crystals 10 00608 g007
Figure 8. Parts of the experimental ultrasonic resonance device for internal friction measurement. (a) Electromechanical part of the apparatus. (b) The test bar for the measurement of the damping measurements.
Crystals 10 00608 g008
Figure 9. Amplitude dependencies of IF measured for AZ31 alloy and increasing maximum strain amplitudes.
Crystals 10 00608 g009
Figure 10. Amplitude dependencies of IF measured for the AZ61 alloy and increasing maximum strain amplitudes.
Crystals 10 00608 g010
Figure 11. Amplitude dependencies of IF measured for the AZ91 alloy and increasing maximum strain amplitudes.
Crystals 10 00608 g011
Figure 12. Amplitude dependent internal friction measured for the predeformed samples of AZ31.
Crystals 10 00608 g012
Figure 13. Microstructure of the deformed AZ31 alloy containing many deformation bands. (a) Deformation bands of two slip systems in particular bands. (b) Fine structure of the strain band.
Crystals 10 00608 g013
Figure 14. Amplitude dependent internal friction measured for the predeformed AZ61 alloy.
Crystals 10 00608 g014
Figure 15. Deformation traces on the surface of the AZ61 alloy. (a) Massive deformation bands in particular grains. (b) Detail of strain bands.
Crystals 10 00608 g015
Figure 16. Amplitude dependent internal friction measured in the AZ91 alloy after plastic deformation.
Crystals 10 00608 g016
Figure 17. Traces of plastic deformation on the AZ91 alloy surface. (a) Deformation bands of two slip systems. (b) Details of the strain bands.
Crystals 10 00608 g017
Figure 18. The influence of predeformation on the amplitude dependent internal friction curves.
Crystals 10 00608 g018
Figure 19. The critical amplitude, εcr, depending on the predeformation step estimated for the (a) AZ31 and AZ61 alloys; (b) AZ91 alloy.
Crystals 10 00608 g019
Figure 20. ADIF measured for different maximum strain amplitudes.
Crystals 10 00608 g020
Figure 21. ADIF measured in the predeformed magnesium samples.
Crystals 10 00608 g021
Figure 22. ADIF curve measured when the sample was held at 5 min on the maximum strain amplitude.
Crystals 10 00608 g022
Table 1. The chemical composition of magnesium alloys in wt. %.
ElementsAlZnMnSiFePMg
AZ312.9800.6550.2020.0670.0070.002balance
AZ616.8801.2000.2290.0790.0070.005balance
AZ917.8100.6450.1950.0530.0170.005balance

