Article

Defects and Lattice Instability in Doped Lead-Based Perovskite Antiferroelectrics: Revisited

Institute of Physics, Univeristy of Silesia, ul. 75 Pułku Piechoty 1, 41-500 Chorzów, Poland
Crystals 2020, 10(6), 501; https://doi.org/10.3390/cryst10060501
Submission received: 3 May 2020 / Revised: 4 June 2020 / Accepted: 8 June 2020 / Published: 12 June 2020
(This article belongs to the Special Issue Electronic Phenomena of Transition Metal Oxides)

Abstract

:
This paper is a summary of earlier results that have been completed with recent investigations on the nature and sequence of phase transitions evolving in the antiferroelectric PbZrO3 single crystals doped with niobium and Pb(Zr0.70Ti0.30)O3 ceramics doped with different concentration of Bi2O3. It was found that these crystals undergo new phase transitions never observed before. To investigate all phase transitions, different experimental methods were used to characterize the crystal properties. Temperature and time dependencies have been tentatively measured in a wide range, including a region above Tc, where precursor dynamics is observed in the form of non-centrosymmetric regions existing locally in crystal lattices. Also, coexistence of antiferroelectric phase and one of the intermediate phases could be observed in a wide temperature range. The phase transition mechanism in PbZrO3 is discussed, taking into account the local breaking of the crystal symmetry above Tc and the defects of crystal lattices, i.e., those generated during crystal growth, and intentionally introduced by preheating in a vacuum or doping with hetero-valent dopant.

1. Introduction

Ferroelectrics and antiferroelectrics with perovskite structure which contain oxygen octahedrons are of great interest to scientists not only because of their numerous applications, but also because of their versatile properties. Although many of them have been known for over 60 years and many theoretical and experimental works have already been reported, there is a range of newly discovered phenomena that remain unknown. They concern mainly lattice dynamics and type-of-phase transitions, i.e., whether they are of the order–disorder or displacement type [1]. In the literature, one can find contradictory experimental data supporting the mechanism associated with pure order–disorder or displacement type. However, investigations of macroscopic properties show characteristic phonon softening associated with displacement type transition, and studies of local properties support the order–disorder one [1,2,3,4,5,6,7,8,9]. Experiments concerning local properties also show the existence of polar clusters that appear far above Tc temperature. With the lowering of temperature, these regions increase in volume and eventually merge into the ferroelectric state below Tc [10]. Such scenario explains well the surprising occurrence of birefringence in BaTiO3 single crystals above Tc, i.e., in the centrosymmetric phase that excludes birefringence altogether [11].
Polar regions (precursors) in the paraelectric phase of BaTiO3 crystals have also been observed by means of other experimental methods, such as Brillouin light scattering. The appearance of these regions was correlated with the softening of longitudinal acoustic mode some 80 K above Tc [12]. This experiment proved that the origin of precursor appearance is mainly connected with (flexoelectric) interactions between the optic and acoustic phonon leading to the so-called lattice instabilities. It is worth noting that picosecond laser techniques were used to show that the size of polar regions increases while transition is approached from the high temperature side [13]. Similar lattice instabilities were found in other crystals as PbTiO3 [14], PbHfO3 [15,16,17], or model antiferroelectric PbZrO3 (PZO) [18].
The lead zirconate PbZrO3 is particularly interesting, due to its antiferroelectric properties and due to the occurrence of ferroelectric properties just below Tc phase, also under the influence of even small electric fields [19,20,21,22,23]. Often the occurrence of this phase is associated with the presence of defects in lead and oxygen sublattices [24,25,26,27,28]. It is worth noting that mentioned defects do not influence the room temperature crystal structure. However, this could be stated only by standard X-ray diffraction methods which are not so sensitive for changes in oxygen ions positions. Recently, the nature of this phase was characterized by Brillouin light scattering method and described as the coexistence of paraelectric and antiferroelectric phases. At the same time, polar regions above Tc were detected [29]. Hence, it is worth noting that on the one hand the occurrence of the intermediate phase depends on crystal lattice defects, and on the other hand polar regions, according to the theory of Bussmann-Holder et al. [30], occur in centrosymmetric phase without any defects. This contradiction became the main motivation for investigations presented in this paper.
The purpose of research has been to determine the impact of crystal lattice defects, and their nature, on phase transitions and local symmetry breaking in crystals and ceramics based on PbZrO3. Achieving such a goal can be divided into the following parts:
  • Determination of the influence of defects generated under high vacuum conditions on phase transitions temperature in pure PbZrO3 [31],
  • Determination of the influence of donor dopant in the form of niobium on the lattice dynamics in PbZrO3 crystal and breaking of local symmetry above Tc [32,33,34,35,36],
  • Determination of the role of crystal surface and volume in dielectric properties of the PbZrO3 crystal doped with niobium, in which defect segregation was generated by alternating electric field action [37].
Additionally, investigations will be presented concerning the presence of polar regions above and below Tc in PbZr0.70Ti0.30O3 ceramics doped with bismuth [38].

2. Materials and Methods

Three types of materials were used in these investigations:
  • Pure PbZrO3 crystals obtained by high temperature spontaneous crystallization from solvent: the substrates in the form of PbO, B2O3, and PbZrO3 ceramics were weighed in correct proportions and mixed together; the preparation of PbZrO3 ceramics is described in detail in [23], while the exact process of crystal growth is described in [39]; crystals in the form of red plates were obtained; these crystals were deliberately defected by remaining for 15 min in high temperatures and under high vacuum (approximately 10−5 mbar) [31];
  • PbZrO3 crystals doped with niobium were obtained by two methods: the same as that used in growing crystals of pure PbZrO3 and the other based on PbZrO3 ceramics doped with niobium; the preparation of ceramics used for breeding is described in [40], while the preparation of crystals is described in [32]; crystals were in the form of red colored plates and bars; the latter method which used substrates consisting of oxides alone (without the use of ceramics) is described in [34]; the resulting crystals were plate-shaped and slightly yellow in color;
  • Pb(Zr0.70Ti0.30)O3 ceramics doped with different concentration of Bi2O3; their preparation process is described in detail in [38].
Lead zirconate is a model antiferroelectric discovered in the 1950s [41]. It is one of the components of lead titanate zirconate (PZT), which is widely used as a piezoelectric or energy storage material [42,43]. A very interesting problem in PbZrO3 appears to be the occurrence of both polar regions above Tc and the so-called intermediate phase [25,27,29,30], which under the influence of electric field has ferroelectric properties. Its nature has been discovered only recently [29] and has been described as coexistence of phases (paraelectric and antiferroelectric) over a temperature range below Tc. The occurrence of this phase is explained in the literature by the presence of various types of technological pollution or lattice defects [44,45,46,47]. However, most of the research concerning the problem of lattice defects in PbZrO3 relates to intentionally defective ceramics in a vacuum [26,27,28]. The use of ceramics, however, causes uncertainty as to the place, in which the defects developed under vacuum condition arise: whether it is grain boundary or grain interior. Thus, it seems difficult to find the answer concerning the impact of crystal lattice defects arising only in the crystal lattice of lead zirconate. Therefore, it seemed important to conduct similar investigations using crystals. Of importance is which sublattice defects are responsible for the occurrence of the intermediate phase, and what their type is. The issue was whether we must deal with vacancies or with change of oxidation states of the elements and even with the migration of atoms in the volume of crystal. This problem was presented in [31].
Another method of introducing controlled change in the number of defects is doping the base material with a hetero-valent dopant. In this case, niobium dopant was chosen due to the proven fact of stabilizing the intermediate phase in PbZrO3 ceramics this dopant was responsible for [40]. As in the case of non-doped PbZrO3 ceramics, it is difficult to determine how much the stress between ceramic grains is responsible for this state, and how niobium ions are embedded in crystalline structure. That is why single crystals are relevant to control the concentration and types of defects appearing due to doping. It should be remembered, however, that it is not easy to obtain good quality crystals doped with hetero-valent ions, due to the difficulty of incorporating such type of ion into the crystal lattice. Therefore, attempts were made to obtain crystals by two techniques to check whether crystal properties depend on the way in which there were obtained. The impact of dopant concentration on both pre-transient effects above Tc and on phase transitions mechanism is presented in [32,33,34,35,36]. In addition, PbZrO3 crystal doped with niobium served as a crystal in which the migration of defects in the crystal lattice due to the action of strong alternating electric field was observed and appears to have a substantial impact on research of dielectric properties [37], particularly on the temperature dependence of maximum of permittivity that is defined by Tc value.
The third group concerns ceramics Pb(Zr0.70Ti0.30)O3 (PZT 70/30) doped with different amount of Bi2O3. It is extremely difficult to obtain PZT crystals with high titanium content. Up to now it has been achieved only in two academic centers worldwide, but without dopant [48,49,50,51,52,53]. Because of that, it was decided to use PZT ceramics doped with Bi. Ceramics PZT 70/30 was selected since in the range of 0.3 ≤ x ≤ 0.4 rhombohedral symmetry, as an effect of long-range interacting regions with local monoclinic symmetry induced by shifts of lead ions, has been ascertained [54]. This interesting phenomenon needs to be checked from the point of view of the role that lead atoms play in the PZT 70/30 structure and how they affect the dielectric properties of this compound. Bismuth ion, having ionic radius equal to 117 pm, only about 2 pm smaller than lead ion and of similar electronic structure, was chosen to substitute for lead. Such doping should make a slight change in the charge balance of the tested material, and should influence the symmetry of crystal structure. It should be due to defects in the Pb2+ sublattice created by introduction of bismuth ions with valence 3+ or due to compensation of charge carriers appearing as a result of lead vacancy appearance during technological process. The results of research on this compound are presented in [38].
The results presented in this report were obtained using the following experimental methods:
capacitance and electrical conductivity measurements. It allowed determining temperature changes of permittivity and dielectric loss of tested materials. The measurements were performed with the use of an automated measurement system with impedance analyzer HP 4192A, multimeter HP 34401 and temperature controller Shiemaden FP23;
birefringence (Δn) measurement as a function of temperature, using the method described in [55] and observations of domain structures using polarizing microscope and temperature heating stage THSE600 from Linkam;
piezoelectric and electrostrictive properties as a function of temperature were determined using the measuring system described in [56];
pyroelectric effect was observed by measurement of thermally stimulated depolarization currents using electrometer Keithley 6514, multimeter HP 34401 and temperature controller Shiemaden FP23;
Raman light scattering measurements were performed in cooperation with the Department of Physics and School of Nano Convergence Technology at Hallym University Chuncheon, Korea. The measurements were carried out in a micro-backscattering system using a 532 nm wavelength laser and a conventional Raman spectrometer (LabRam HR800, Horiba, Co., Kyoto, Japan) combined with a temperature adapter (THMS600, Linkam, Surrey, UK). Olympus BX41 optical microscope was used for this geometry. The Raman spectrum was measured to approximately 10 cm−1 using a holographic cut-off filter. A single diffraction grating with the density of 1800 lines/mm was used, resulting in the resolution of 0.5 cm−1;
conventional Fabry–Perot coupled interferometer was used to measure the Brillouin scattering spectrum in the range of ±60 GHz. The sample was placed in Linkam THMS 600 temperature adapter; BX41 manual Olympus microscope was used to measure scattering in backscattering geometry. Solid-state laser (Excelsior 532–300, Spectra Physics, Santa Clara, CA, USA) with a wavelength of 532 nm was used as the excitation source. Details of the spectrometer used in the study can be found in [57]. Brillouin scattering studies were performed in collaboration with the Department of Physics and School of Nano Convergence Technology at Hallym University Chuncheon, Korea;
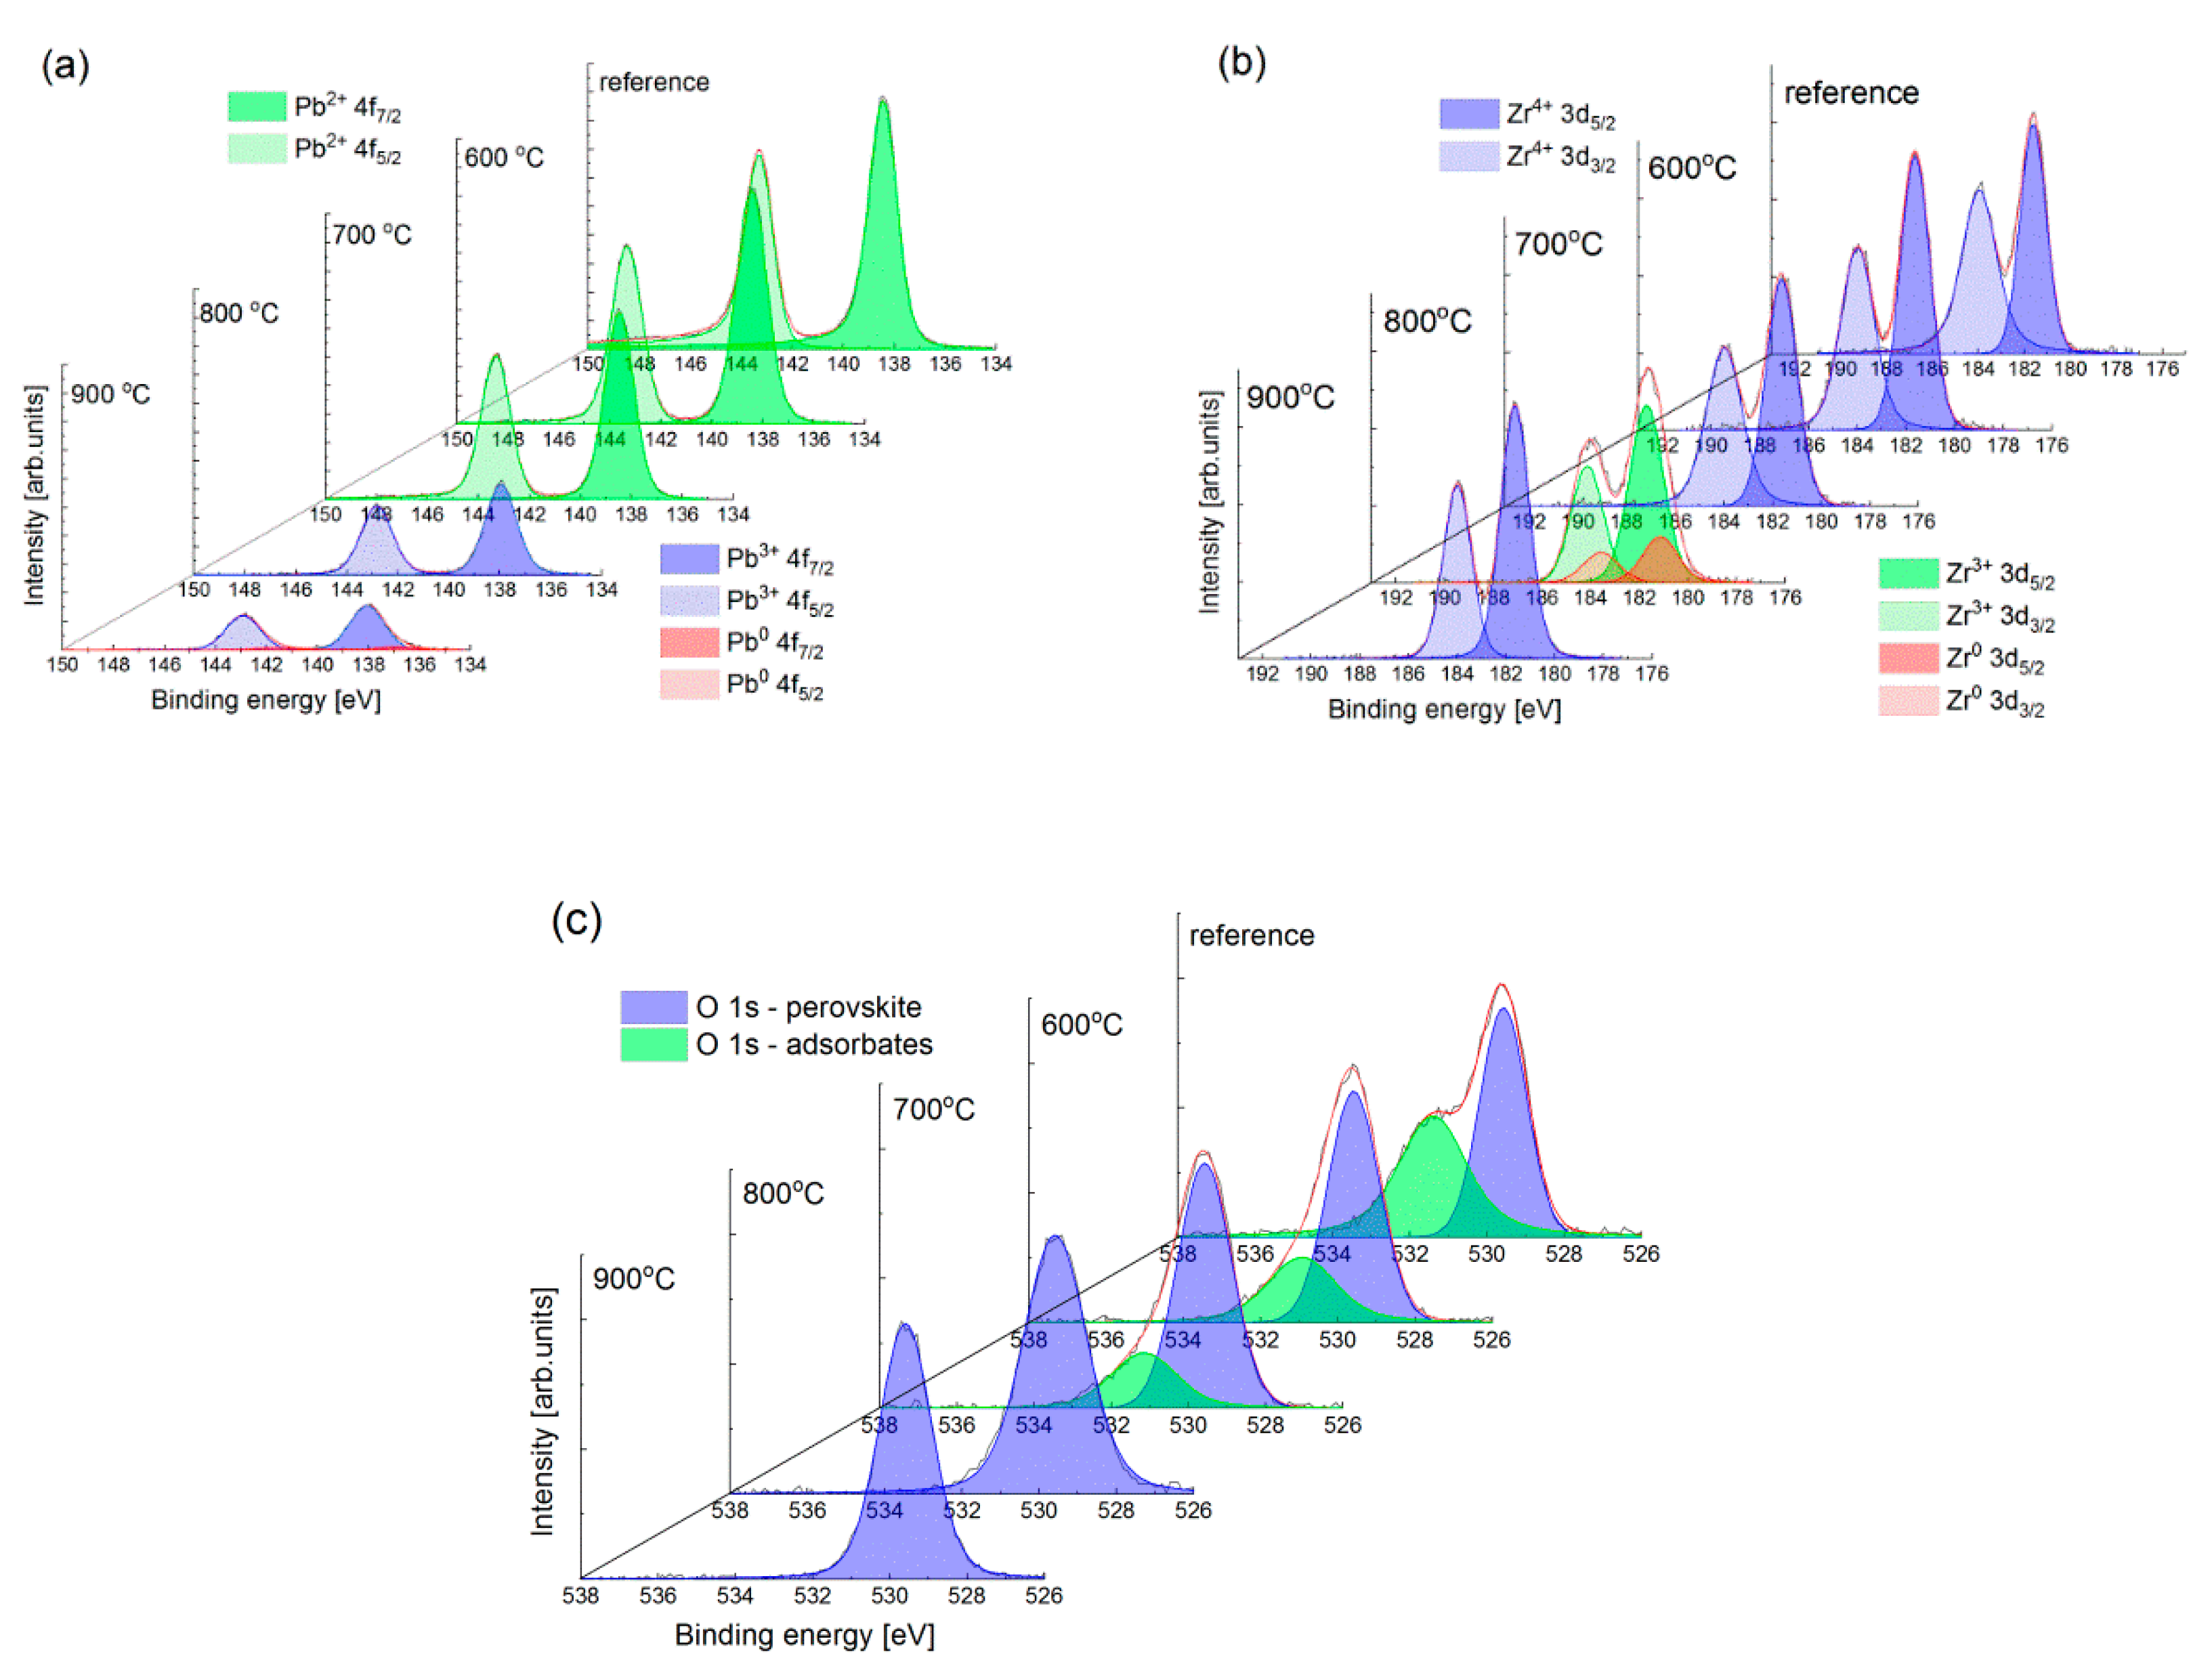
electron structure studies were performed using X-ray photoelectron spectroscopy (XPS), using Physical Electronics PHI 5700/660 spectrometer with monochromatic Al Kα radiation (1486.6 eV). An electron gun was used to compensate for the charge generated on the surface during irradiation of the sample. A detailed description of the data analysis is presented in [31];
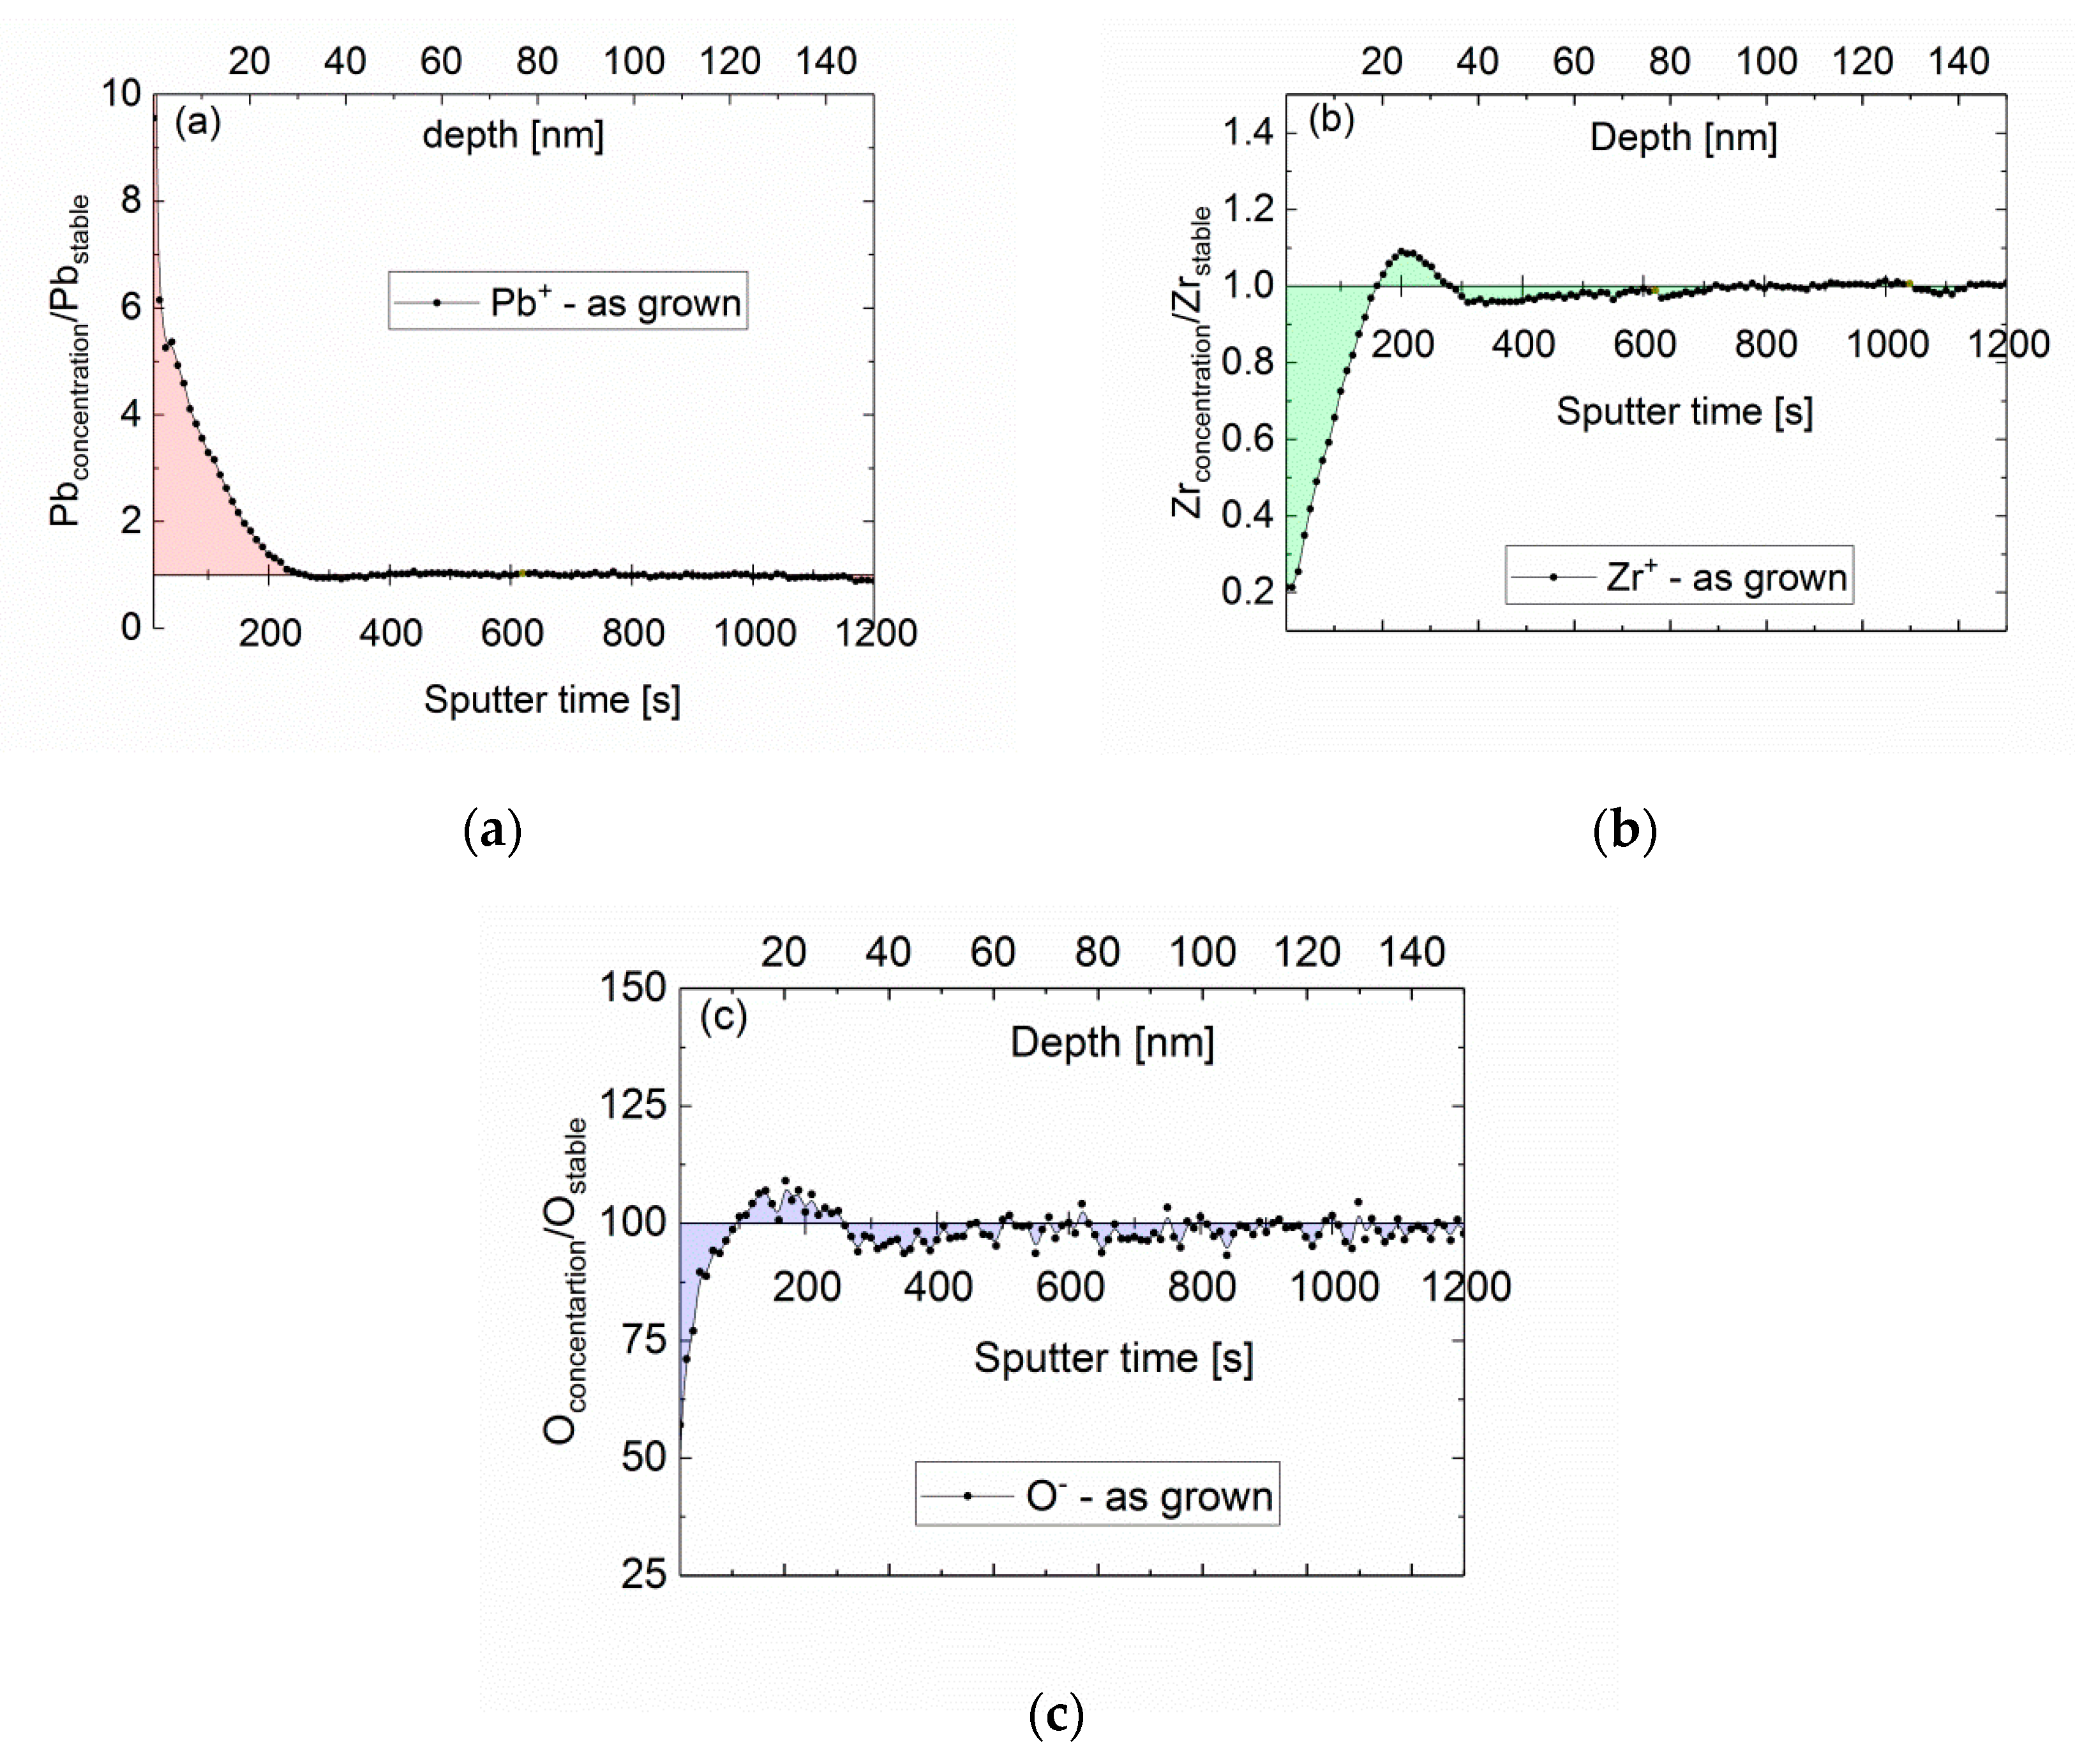
the analysis of ion distribution in PbZrO3 crystals, in the form of depth profiles, was carried out using IONTOFToF-SIMS V spectrometer, a high-energy beam that emits secondary ions (and ion clusters from the surface of the sample), and a low-energy etching beam that operated in double-beam mode. The analysis was carried out using a single isotope ion beam emitted in the form of high-energy pulses (Bi+ ion beam with 30keV energy, with target current of approximately 1.4 pA). Digestion was carried out using high current, but with lower source energy (Cs beam operating at 1 kV and 50 nA). This beam etched a 600 × 600 μm2 crater, while the bismuth ion beam gradually analyzed the crater bottom. Due to the need to eliminate the effects associated with the heterogeneity of emissions at the edges of the crater, the analysis area has been narrowed down to 167 × 167 μm2. The details of the analysis and the experiment are described in [31];
structural tests were carried out using the powder method, by means of PANalytical PW1050 diffractometer using a nickel filter and CuKα1.2 X-ray source operating at 30 kV/30 mA. Structure refinement was carried out using the Rietveld method [58], applying FULLPROF software [59]. The details of individual experiments are presented in [32,33,38];
crystals of PbZrO3 doped niobium were characterized for chemical composition by using energy-dispersive X-ray fluorescence spectrometer (EDXRF), epsilon 3 (Panalytical, Almelo, the Netherlands) with mercury pipe as the X-ray source at the maximum voltage of 30 keV and 9 W. The spectrometer was equipped with a thermoelectrically cooled silicon drift detector (SDD) with 8mm beryllium window and the resolution of 135 eV at 5.9 keV. Quantitative analysis was performed using Omnian software. Details of the measurements are presented in [33];
chemical analysis of pure PbZrO3 crystals and Bi2O3 doped PZT 70/30 ceramics was performed using JSM-5410 scanning electron microscope from Jeol, equipped with energy-dispersive X-ray spectrometer (EDS) from Oxford Instruments.

3. Results and Discussion

The summary can be divided into four main sections: 1. The effect of defects on phase transitions in pure PbZrO3 crystals [31]. 2. The effect of an admixture of niobium on compensation or creation of defects in the PbZrO3 crystal lattice, and the impact of these phenomena on local breaking of symmetry above Tc, connected with instability of crystal lattice vibrations [32,33,34,35,36]. Special attention should be paid to the fact that these studies were used in a variety of research techniques, allowing researchers to look at the problem from the point of view of local structure changes and macroscopic properties of the tested materials. The self-organization of a crystal structure at a constant temperature, not known well as yet, will also be presented [36]. 3. The third problem considered is the segregation of defects caused by the action of an alternating electric field [37]. This issue is particularly important in the context of potential applications of the tested materials. 4. The fourth issue raised in [38] is the impact of lead sublattice defects on polar regions, occurring above Tc in PZT 70/30 ceramics doped with Bi. The relationship between polar regions and instability of vibrations in the crystal lattice of the examined materials is discussed.
Therefore, this summary aims demonstrate—based on pure and doped antiferroelectric PbZrO3, and materials synthesized as based on it—an influence (a role) of defects on crystal lattice instabilities which de facto decide on type of transitions which these materials undergo, and on local symmetry breaking phenomenon that start appearing in ABO3 perovskites already far above Tc.

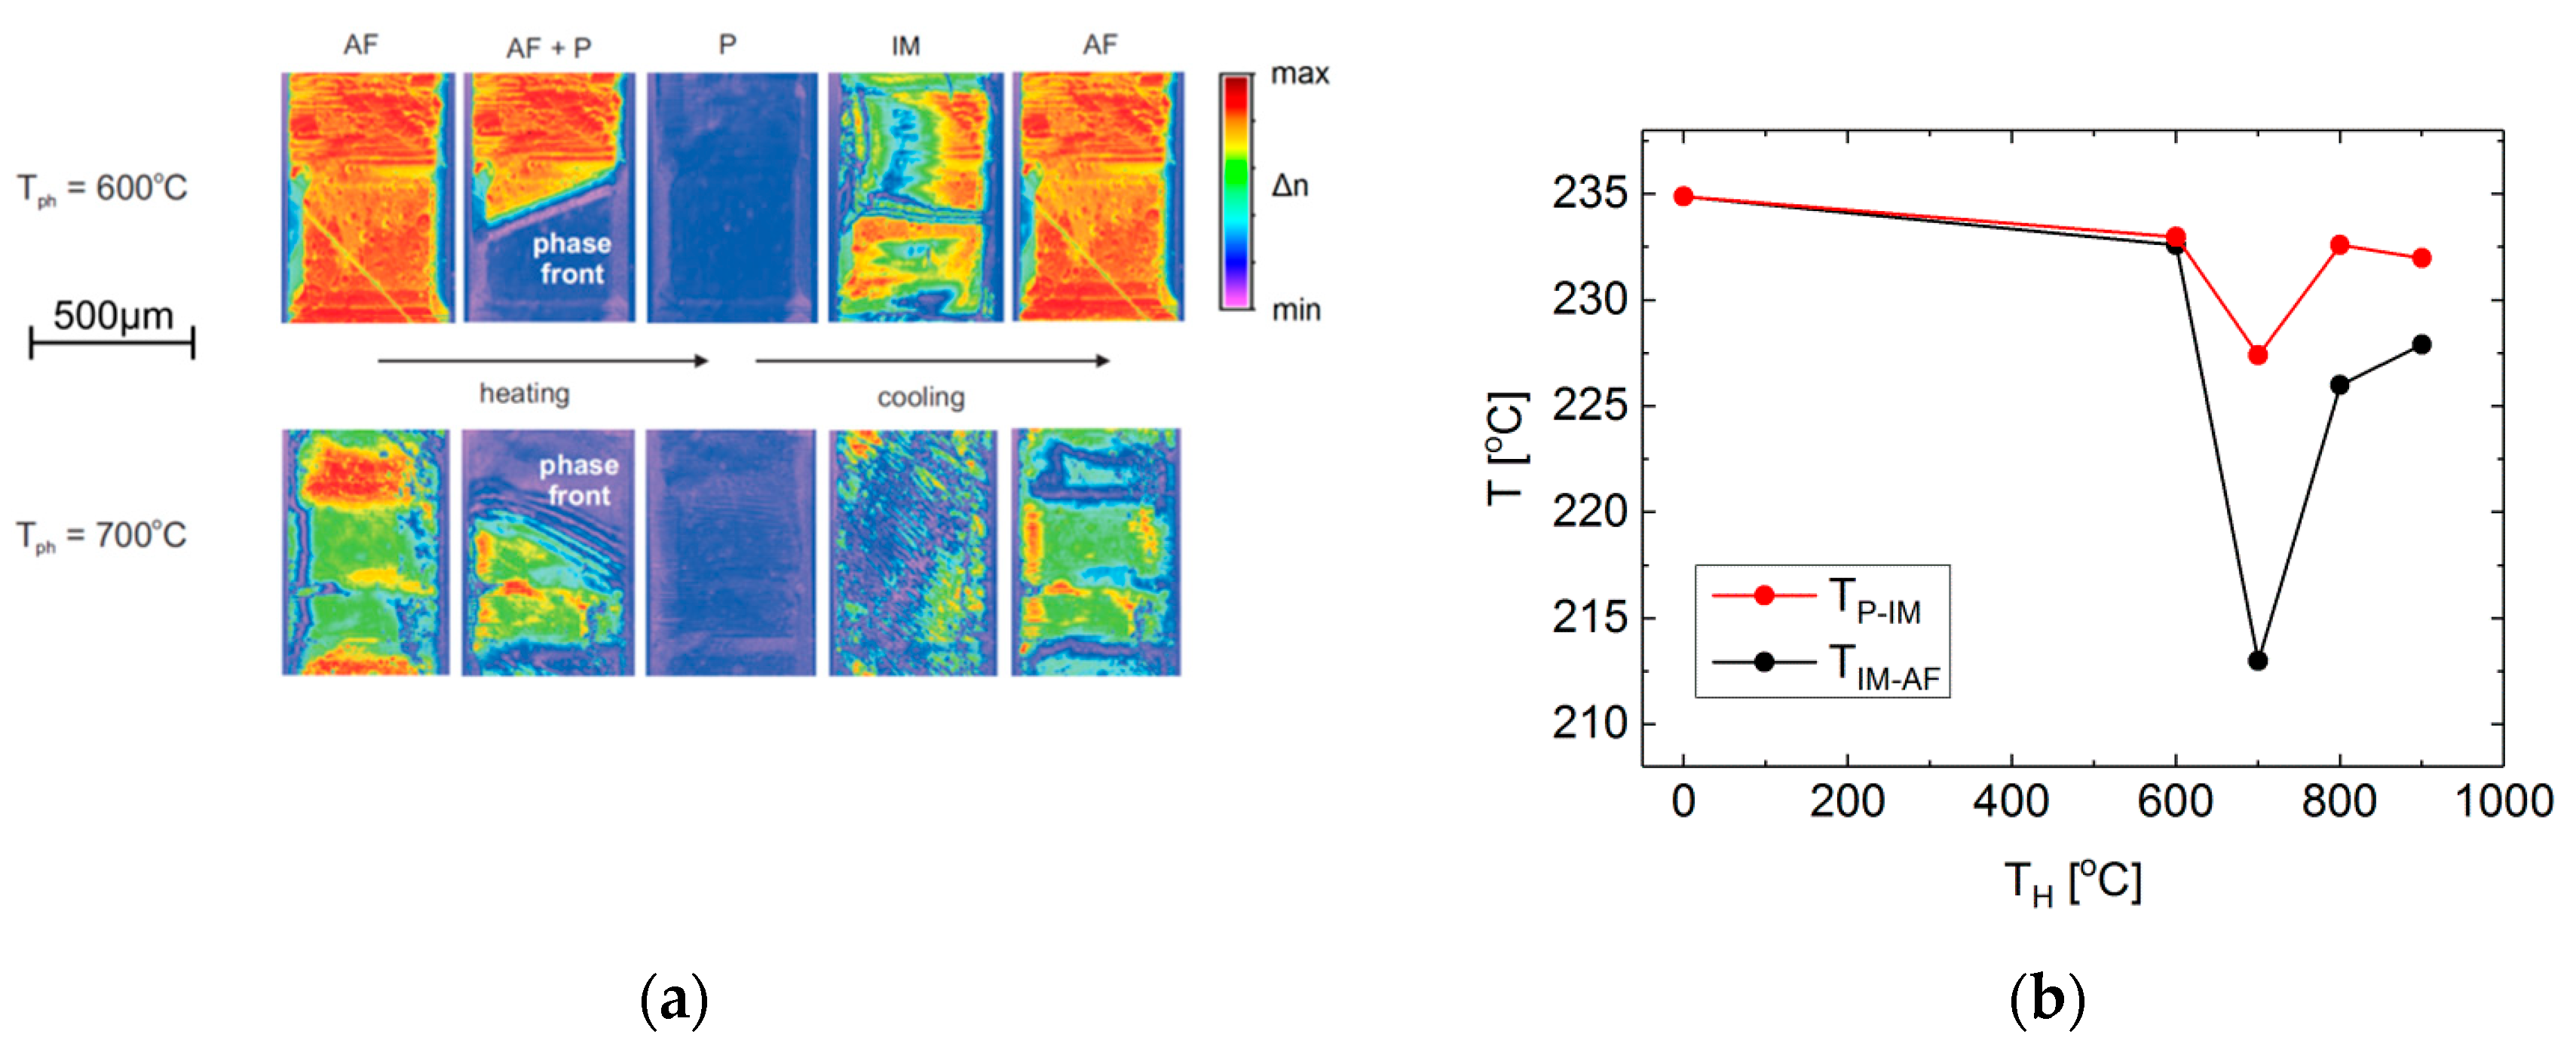
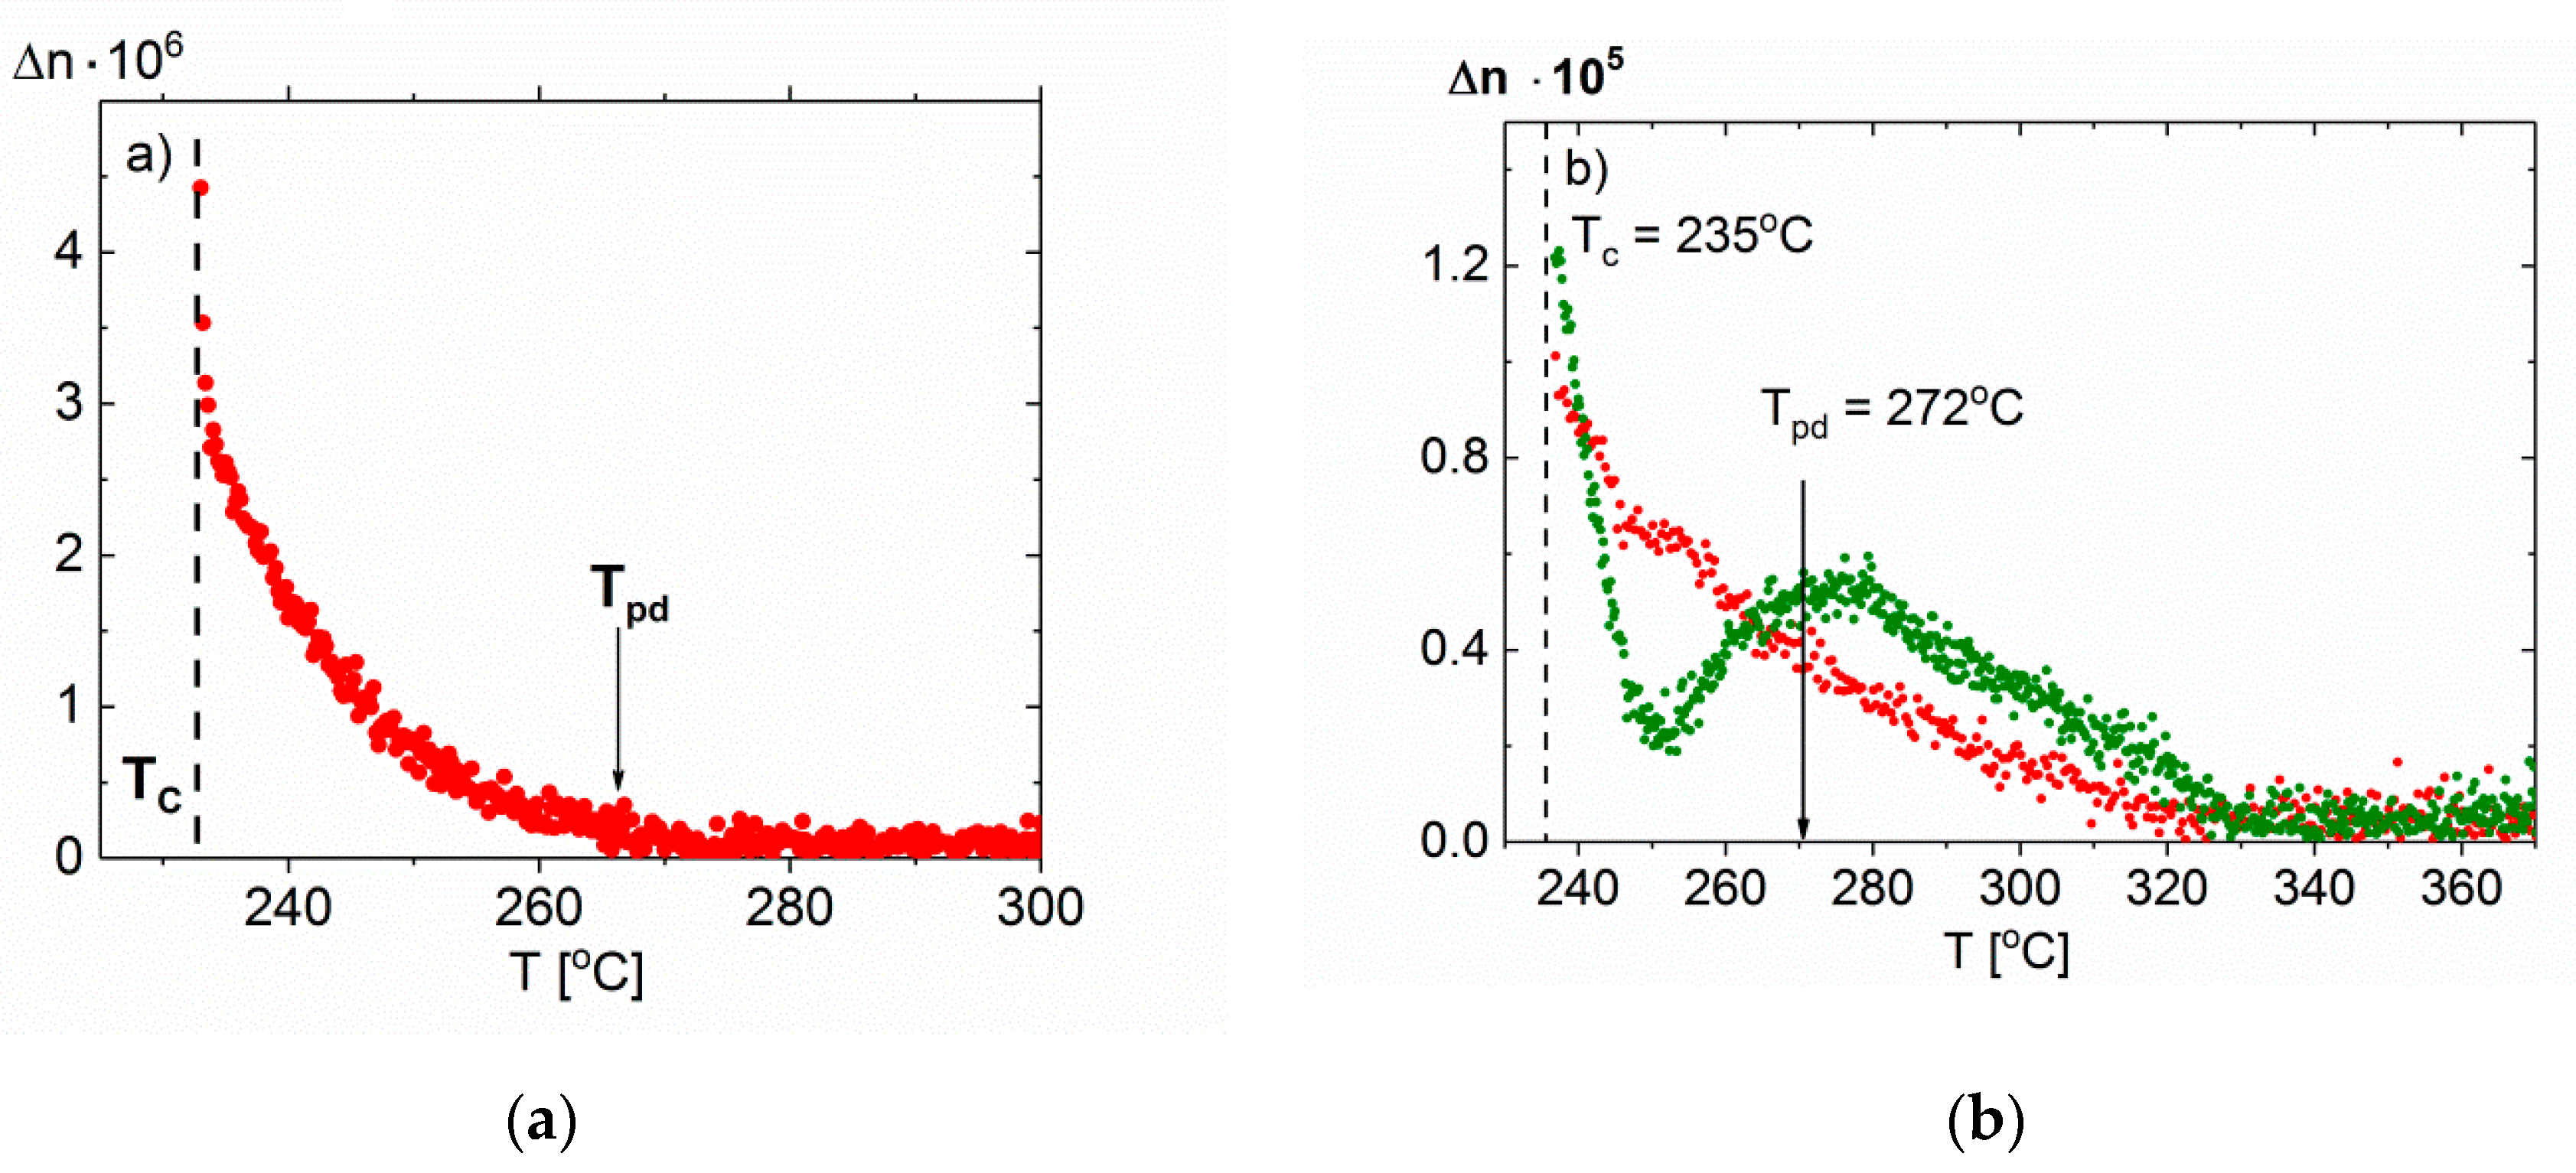
3.1. Induction of the Intermediate Phase by Means of Crystal Lattice Defects in PbZrO3 Single Crystals [31]

Calculations of the total energy of lead zirconate structure show that there is instability in terms of antiferroelectric and ferroelectric distortion of lattice, indicating a delicate balance between them [60,61,62]. Therefore, we deal with a state of unstable equilibrium, where an additional factor, such as network of defects or weak electric field, can induce the ferroelectric phase inside the antiferroelectric phase in PZO ceramics [63]. Recent studies of lattice dynamics showed that the intermediate phase is a result of coexistence of the antiferroelectric and paraelectric phases below Tc [29]. This fact is related to the occurrence of lattice instability above Tc, causing the existence of polar regions, as mentioned in the introduction. As stated in [64], these regions occur due to disorder in the lead sublattice above Tc. This disorder results from the hybridization of lead electrons and oxygen p electrons in the paraelectric phase [65]. It could therefore be concluded that defects both in the oxygen and lead sublattice affect only the lattice instability in PbZrO3 and polar fluctuations above Tc. In the literature, however, the role of zirconium and defects in the zirconium sublattice is completely ignored, considering this sublattice as stable and with no impact on those instabilities. However, looking at the basic order parameter of the phase transition in PbZrO3, which is associated with the anti-parallel arrangement of pairs of lead atoms and tilts of ZrO6 octahedra, both conditions may lead to the appearance of antiferroelectricity in this material [24]. Therefore, the role of zirconium and the presence of defects in the zirconium sublattice should not be overlooked in the consideration of phase transitions that PbZrO3 undergoes.
With a PbZrO3 crystal in which there is no intermediate phase, one can prove that defects are responsible for the occurrence of intermediate phase [31]. It is enough to deliberately produce crystal defects in a controlled manner, e.g., in high vacuum conditions in specified time, and at a certain high temperature [31]. Observations of the birefringence maps in a virgin crystal, in which no intermediate phase was observed, and then in the same crystal defected in a vacuum, showed a dependence of the width of temperature range, in which an intermediate phase could be observed, with the concentration of lattice defects. It was directly related to the annealing temperature TH of crystal in a vacuum (Figure 1).
Figure 1 shows that dependence of transition temperature on annealing temperature, i.e., on the concentration of defects, is not a monotonic function. Systematic studies of both the distribution of elements within the sample, their mutual concentration and oxidation states, could create a coherent picture of defect chemistry in PbZrO3 and thus their impact on transition phase.
Tests using the TOF-SIMS method showed a substantial chemical heterogeneity of virgin crystal to the depth of approximately 35–40 nm in all sublattices (Figure 2).
The absence of a phase transition in such crystal may be due to the presence of an external factor, such as chemical pressure produced by non-stoichiometric crystal surface layer. When the crystal is annealed at relatively low temperatures (500, 600 °C), the amount of lead released from the surface layer decreases and the crystal can be considered to be a compensated semiconductor governed by the equation:
P b 1 x Z r O 3 x y P b 1 x 2 + Z r 4 + O 3 x y 2 ( x V P b ) ( x V Ö ) ( y V O )
where V P b , V Ö and V O stand for the lead vacancy with a double positive charge, oxygen vacancy with a double negative charge and electrically neutral oxygen vacancy, respectively.
Research of the electronic structure allowed the determination of degree of oxidation for individual elements, in particular lead and zirconium (Figure 3).
Knowing the relative changes in the concentration of individual ions, it was possible to determine the chemistry of defects for specific characteristic ranges of soaking temperatures. Thus, for temperature TH in the range between 600 and 700 °C, the crystal can be considered to be a compensated n-type semiconductor, wherein an important role is performed by double-ionized oxygen vacancies and ionized zirconium vacancies. These defects can be trapping centers for holes or electrons, which can be filled on cooling and emptied on heating. For the annealing temperature of 700 °C, the concentration of these traps results in a significant extension of the temperature range in which the intermediate phase appears. On microscopic scale, in some parts of the crystal volume these traps become full, and at the same time remain empty in other parts. Based on recent Brillouin light scattering, which shows that transition phase is the coexistence of the paraelectric and antiferroelectric phases [29], it can be concluded that the existence and states of filling of these traps are responsible for the phase transitions. It means that filled traps help the occurrence of antiferroelectric phase, and vacant traps help the occurrence of paraelectric phase. One can simply say, as presented on heating [31], that the trap centers are systematically emptied, and all are empty at a certain temperature. On cooling, these centers are filled up again. Depending on the energy levels of the trap centers, their “empty” or “full” state depends on temperature. Therefore, in the lead or zirconium sublattice, some centers may become full and some may remain empty. These centers (and in fact their effective charges) affect the vibrations of crystal lattice, thus the occurrence of two states of trap centers can strengthen the coexistence of phases in connection with interrelation between optical and acoustic vibrations. To some extent, the existence of such defects may affect the stabilization of “precursors” at temperatures higher than TBH known from theoretical model (TBH = 1.1 Tc).
As can be seen in Figure 4, further increase of defects concentration in PbZrO3 leads to changes in the valence of lead from Pb2+ to Pb3+, and at 900 °C metallic lead can also be observed. In the case of zirconium, metallic state appears at 800 °C, and after further heat treatment it is re-oxidized by oxygen ions from the inside of the crystal. At the same time, a drastic reduction of the temperature range is noticed, in which the intermediate phase occurs. This means that these types of defects negatively affect the coexistence of phases, favoring the antiferroelectric phase. In [31], an in-depth analysis of such cases was also carried out in terms of defect chemistry.
The following facts should be considered now:
  • the occurrence of transition phase depends on the ratio of donor and acceptor centers. Because this ratio is not in equilibrium, full or empty centers act as a local stress fields, thus locally affecting lattice vibrations and the occurrence of intermediate phase, disturbing the delicate energy balance mentioned above;
  • defects in the zirconium sublattice should also be taken into account as being responsible for the existence of intermediate phase;
  • all occurring centers, being in different states of filling/ionization, strengthen the possibility of phase coexistence. Thus, it was found that the occurrence of these centers is the main cause of local symmetry violation, which plays an important role in the occurrence of intermediate phase in PbZrO3.

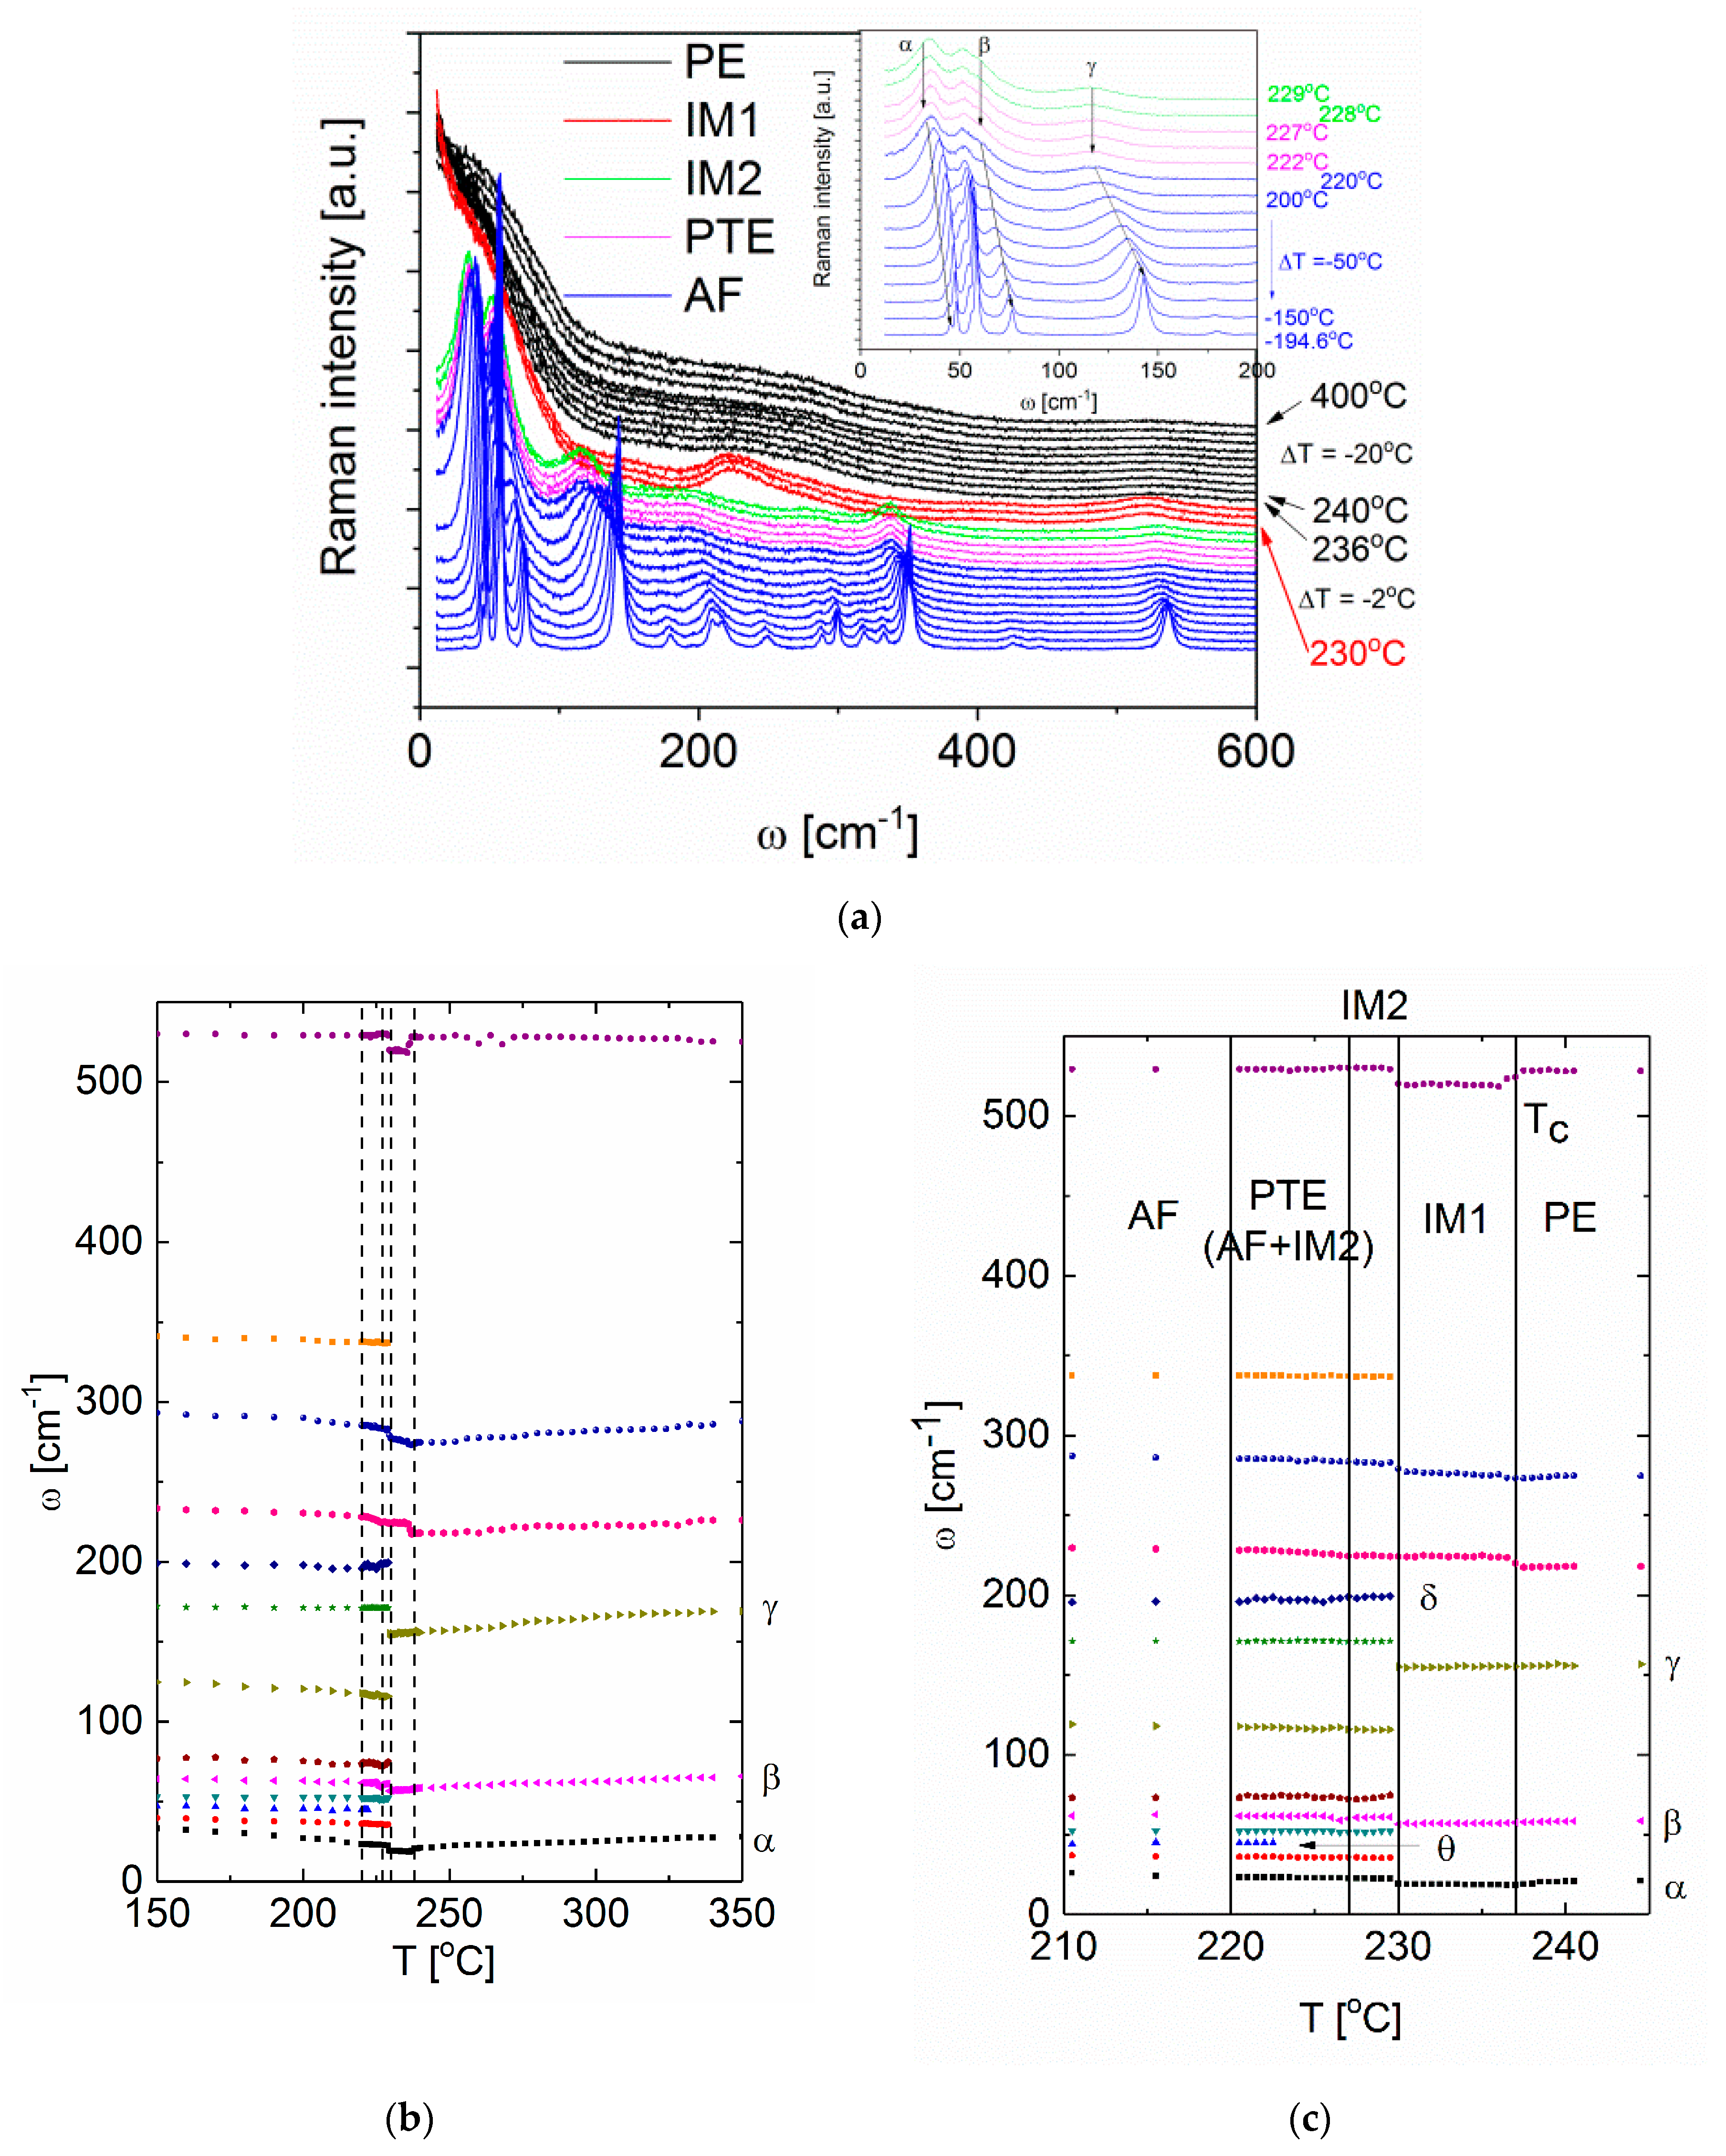
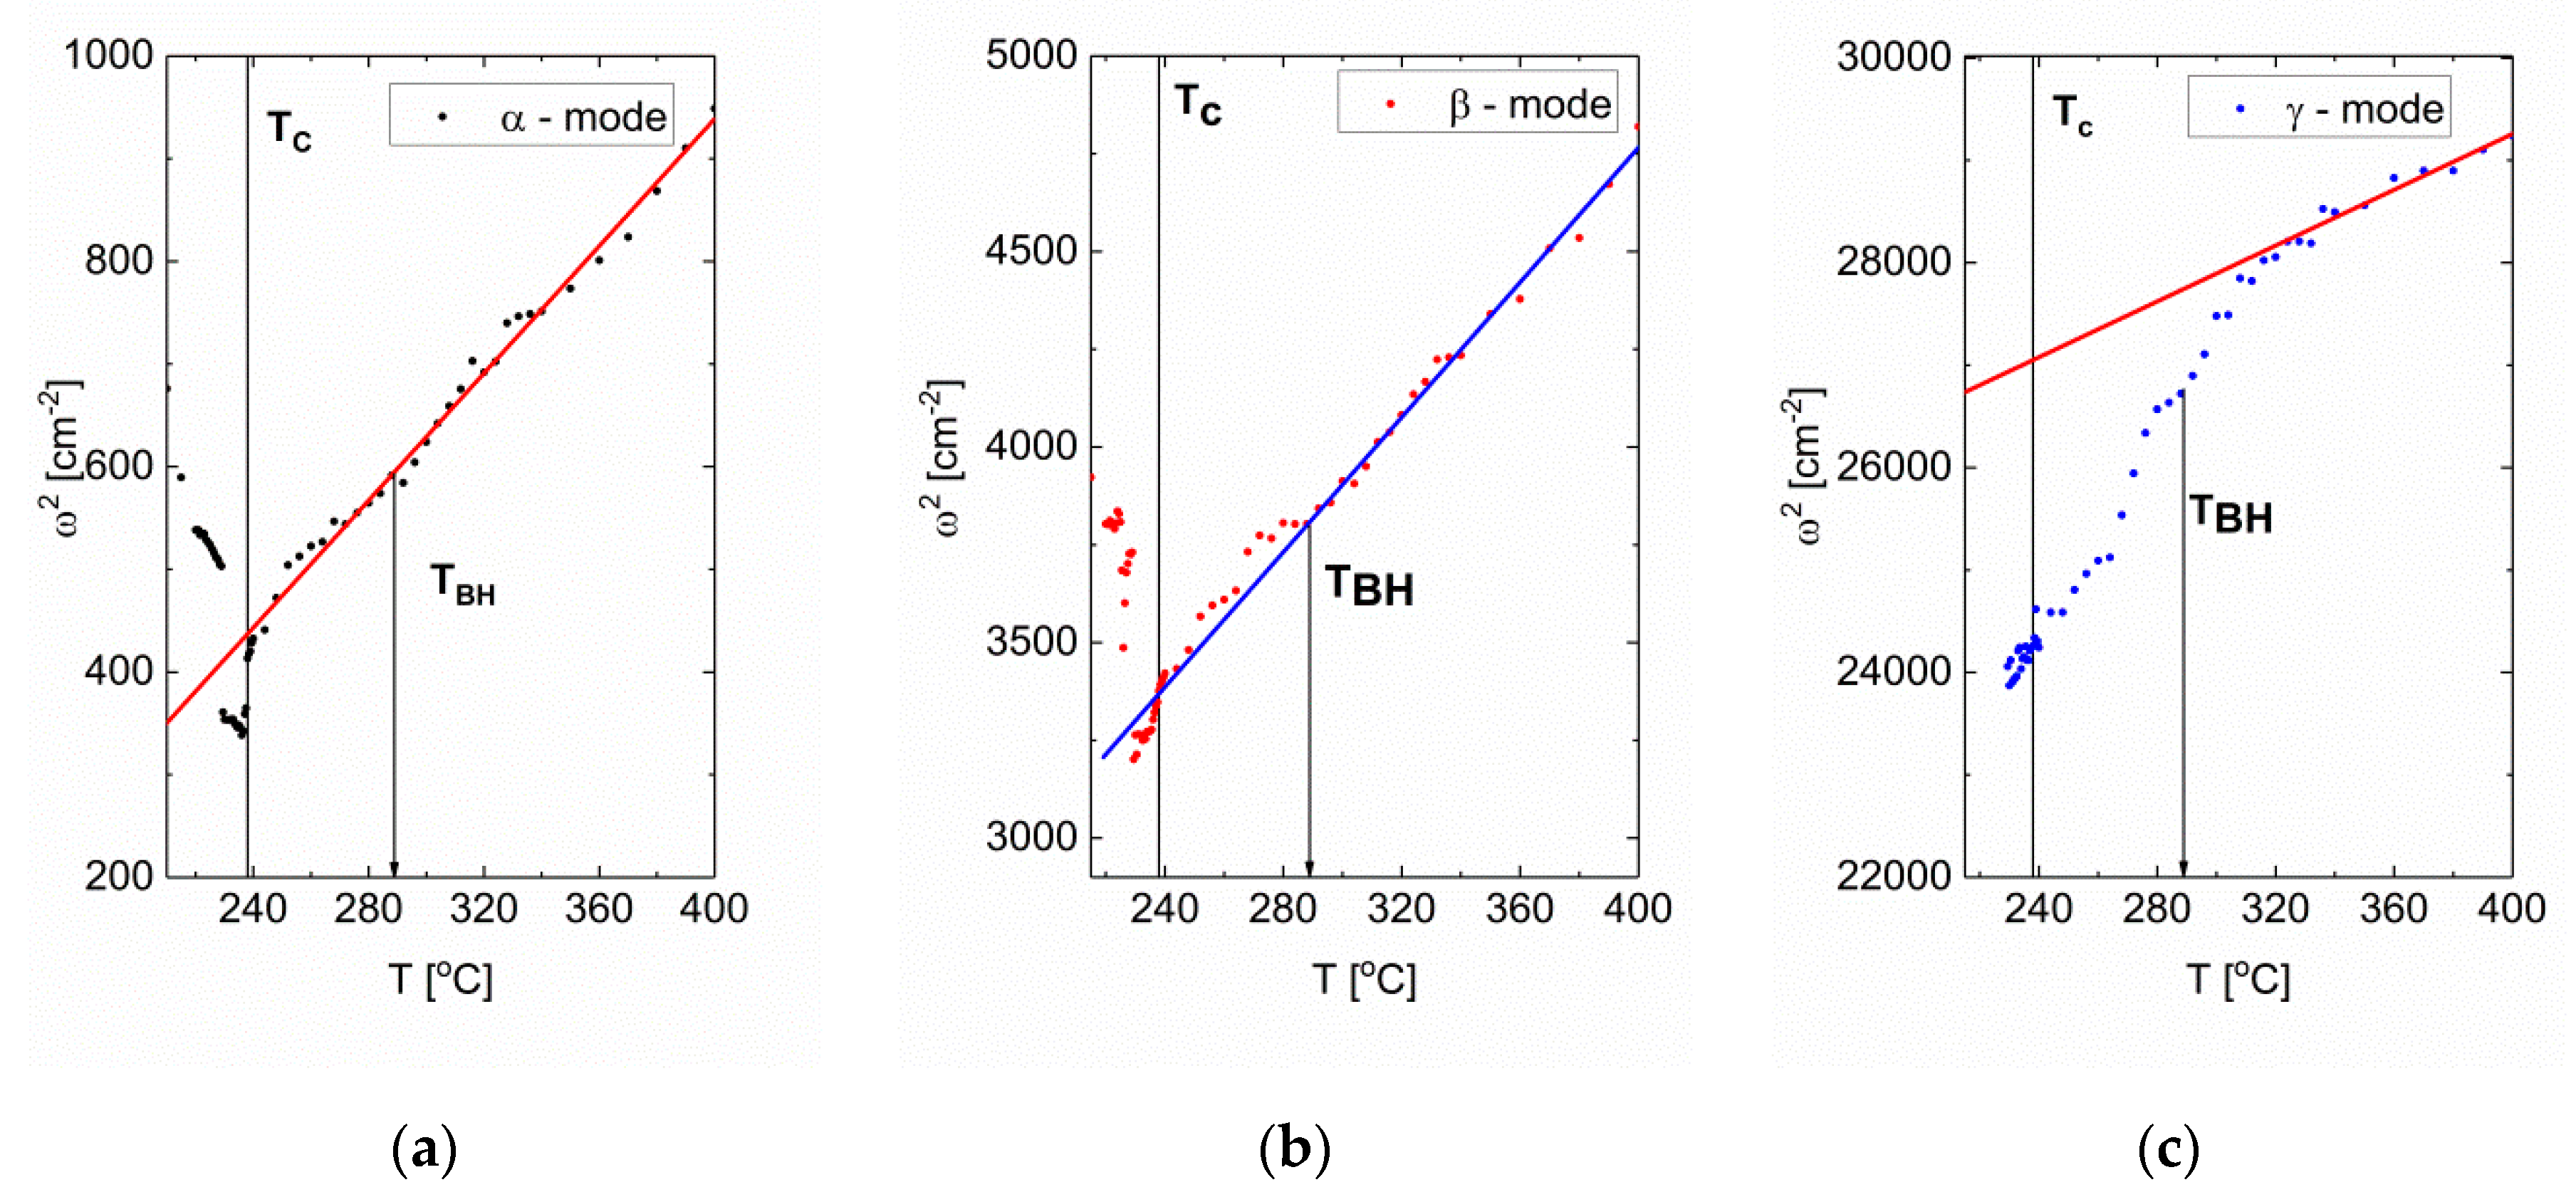
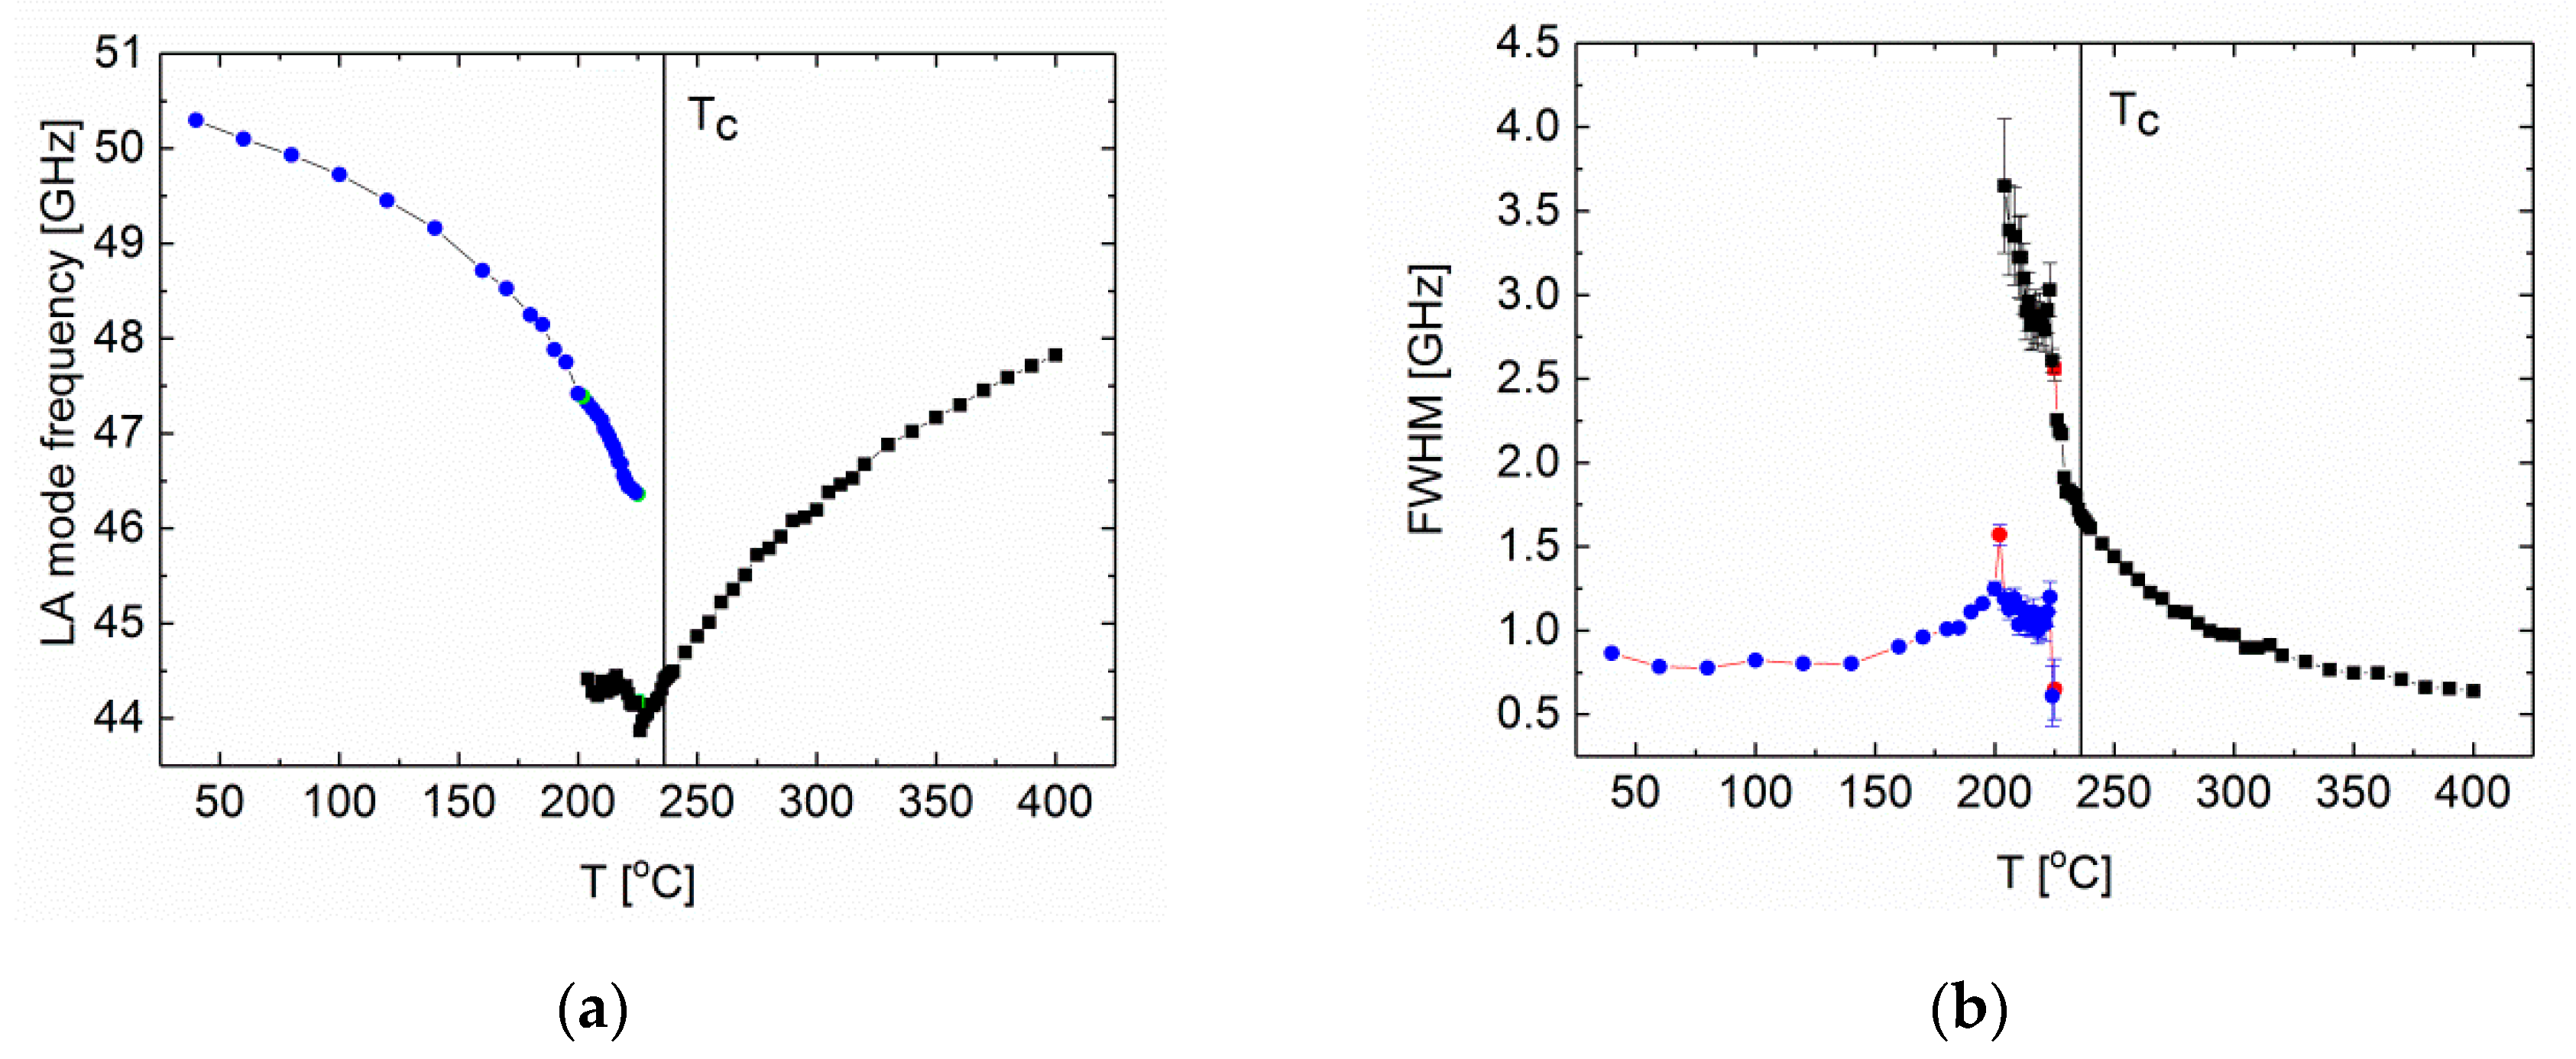
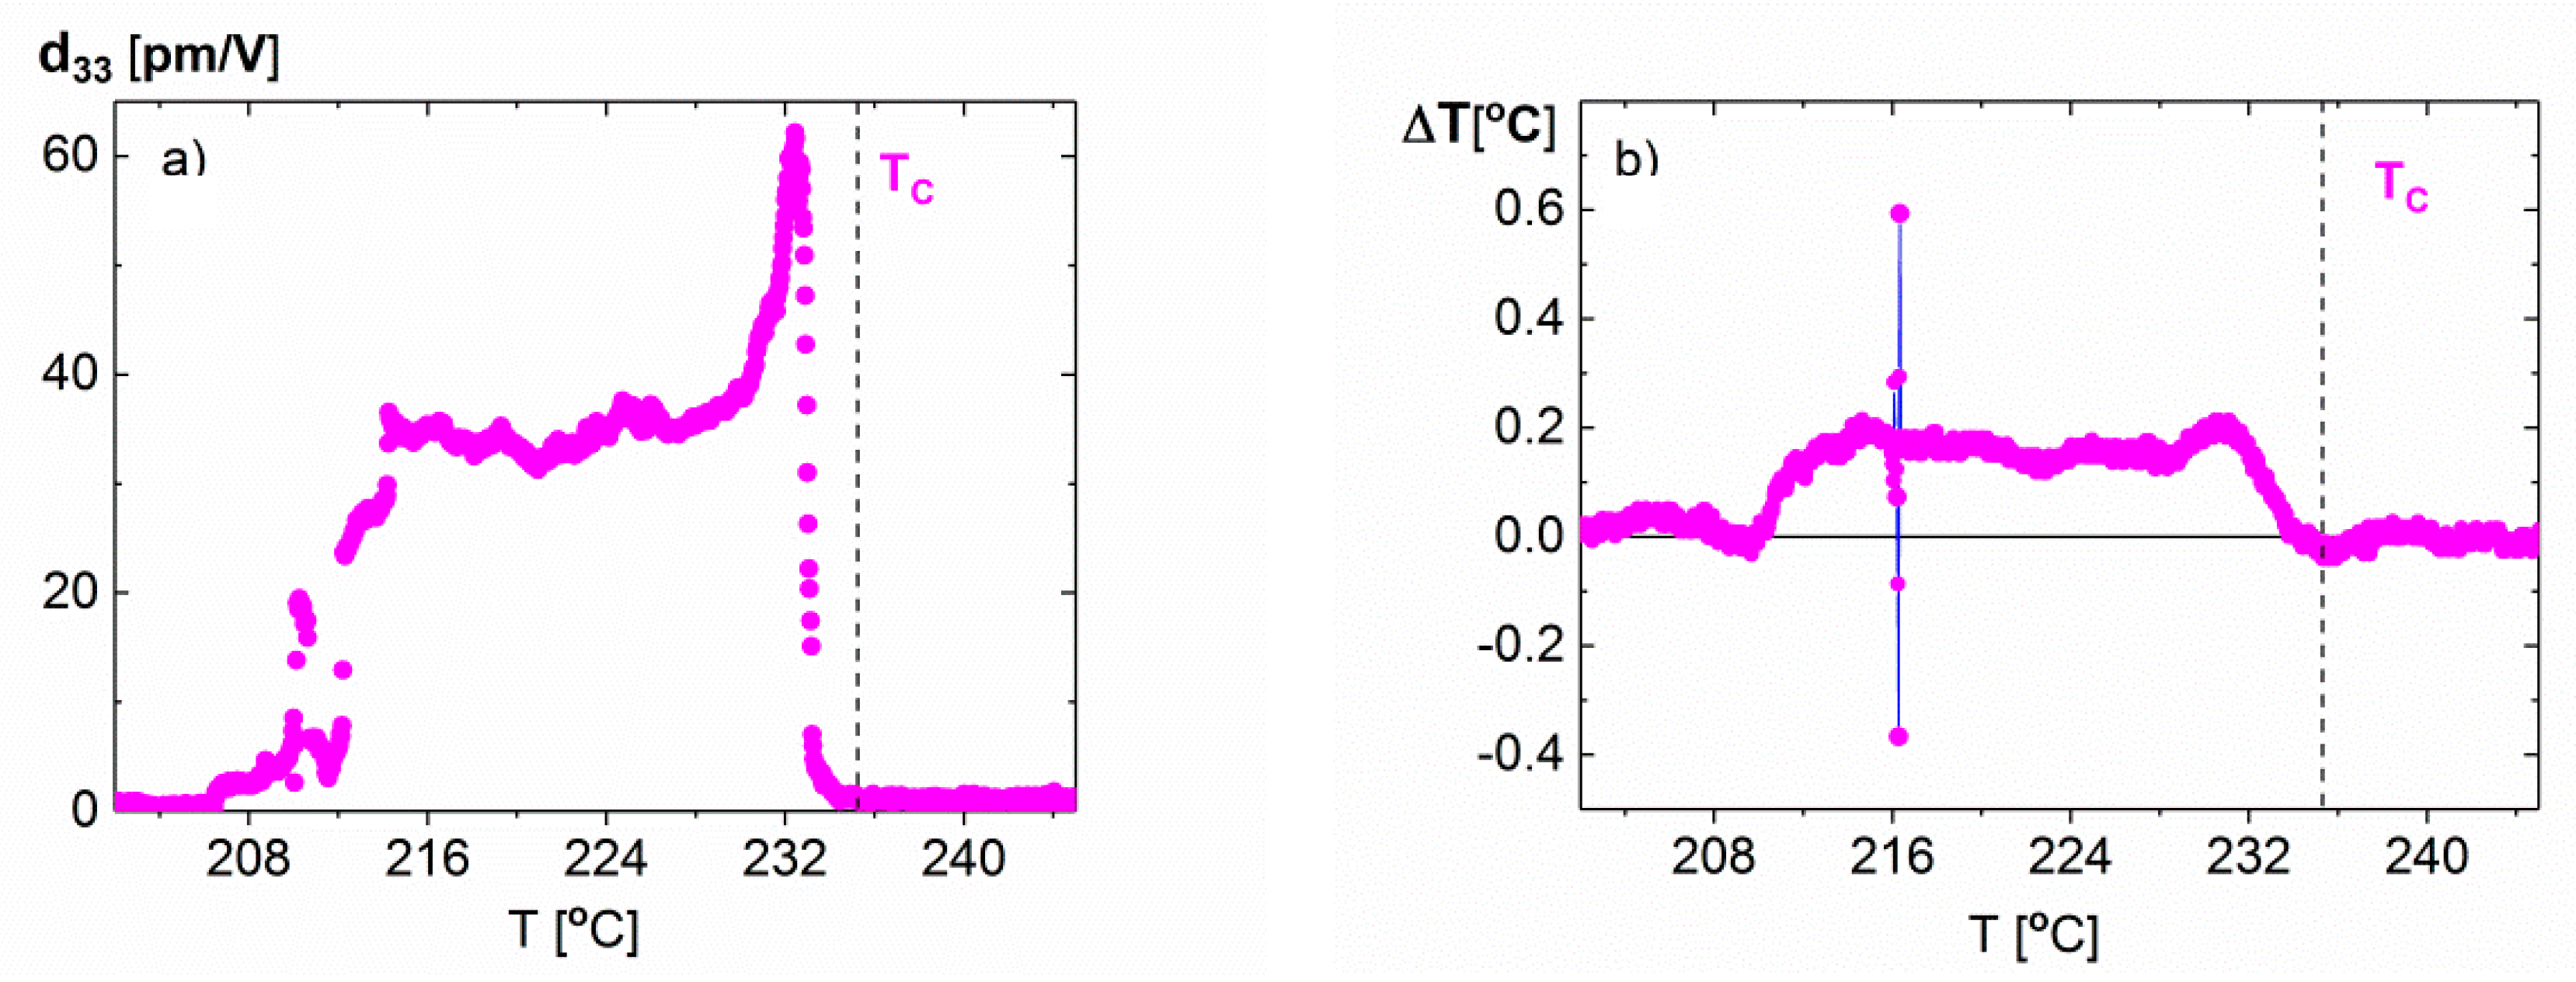
3.2. Influence of Donor Dopant in the form of Niobium Atoms on the Dynamics of the PbZrO3 Crystal Lattice and Local Symmetry Breaking Above Tc [32,33,34,35,36]

The introduction of admixtures with similar ionic radii in relation to the ionic radius of ions replaced in the lattice, but with different valence will lead to the creation or compensation of network defects. Compensation or creation of defects will take place depending on the ratio of the amount of dopant to natural defects, which occur during the production of the material. In the case of lead zirconate, defects arising during growth are discussed in [31]. The articles [32,33,34,35,36] directly show the effect of a hetero-valent dopant, which was niobium atoms, on both breaking of local symmetry and phase transitions observed in the tested materials.
The first important fact is the observation of a new phase transition for samples with different dopant concentrations [32,33] and for crystals obtained in other growth process [34]. Regardless dopant concentration or growth process, the additional phase transition, previously not observed in PbZrO3 ceramics doped with niobium, was observed by means of various research techniques: observation of domain structures and birefringence [32,33,34], dielectric tests [32,33,34], electromechanical tests [32,33], Raman [34] and Brillouin [35] light scattering.
Domain structure studies using birefringence maps or a polarizing microscope have clearly demonstrated the existence of different domain structures indicating the existence of new phase transition (Figure 4)
In addition, the so-called post-transitional effects (Figure 4e) in the temperature range from about 210 °C to 200 °C, in which the coexistence of second phase transition (IM2) and antiferroelectric phase (AF) was postulated.
Studies of the piezoelectric phenomenon have shown that both intermediate phases are polar under the influence of the applied electric field [32,33]. Piezoelectric effect above Tc has also been found. This fact was confirmed by birefringence studies of crystals (Δn) (Figure 5), showing that local symmetry violations can occur even at temperatures higher than those at which piezoelectric effect appears. This difference results directly from the greater sensitivity of the method of birefringence measurements [33]. The temperature range in which non-zero birefringence exists is broadened with increasing dopant concentration [32,33], including temperatures higher than TBH = 1.1 Tc (in Kelvins) for higher dopant concentrations [33,34]. This fact is directly related to the types of defects described in [32]. Specifically, the admixture of niobium—due to its ionic radius—most likely takes replaces zirconium in the crystal lattice. Therefore, 4 scenarios are possible:
(1)
niobium changes its oxidation state to 4+ giving one electron to the conductivity band,
(2)
niobium is situated next to lead vacancy, which means that two niobium atoms can compensate for the double-ionized lead vacancy,
(3)
two niobium atoms generate one compensated lead vacancy.
(4)
one should take into account the possibility of contaminants in the used culture substrates, such as sodium or potassium, which are ionized to generate oxygen vacancies. In this case, two niobium atoms will compensate for a double-ionized oxygen vacancy.
As in pure lead zirconate, in doped crystal the atom in the middle of oxygen octahedrons is responsible for the stabilization of intermediate phase, and even for the generation of a new, not observed as yet, second transition phase.
In the case of a crystal with nominal niobium content of 0.6 mol% Nb2O5, the temperature of birefringence and piezodeformation decay (TBH) is consistent with theoretical predictions; the TBH for this material is about 280 °C [32]. On the other hand, for crystals with admixture concentration of 1 mol%, the temperature of birefringence decay is distinctly higher than TBH and equal to 285 °C. This fact can be easily explained by the fact that in the first case niobium led to compensation of the charge of lead vacancies, while in the second case niobium led to the creation of new defects, by which the local symmetry breaking has taken place at temperatures above TBH [33].
The presence of an additional phase transition prompted us to try to obtain crystals from other chemical substrates, excluding PbZrO3 ceramics doped with Nb2O5. The results were crystals used in investigations reported in [34] and [35]. They also showed an additional phase transition both in observations of the domain structures using a polarizing microscope and in dielectric studies [34], which proves that intermediate phase is appropriate for this group of materials. Also, in these materials the so-called pre- and post-transition effects occur, i.e., breaking of local symmetry above Tc, and below the transition from the second intermediate phase to AF state [34].
To understand better the nature of those two intermediate phases and to answer the question concerning the exact reason for local symmetry breaking above Tc, investigations in microscale of Raman [34] and Brillouin light scattering [35] were performed.
The study of Raman scattering revealed the first order Raman spectrum above Tc, which would not be possible if the paraelectric phase was centrosymmetric [66]. These studies confirm local violation of symmetry above Tc in niobium-doped PbZrO3 crystals [34]. The Raman spectra obtained (Figure 6a) were fitted with a function containing a set of suppressed harmonic oscillators (Equation (2)), where: Si, ωi, γi are the oscillator strength, the frequency and the damping factor of i-th phonon mode, respectively. Sr and γr denote the strength and relaxation rate of a relaxor, respectively. The terms (n(ω) + 1) and n(ω) are the Bose–Einstein factors that correspond to the Stokes and anti-Stokes scattering. It allowed determining the frequency of individual vibrations of the crystal lattice (Figure 6b,c) [34]. Because the investigated crystals were in multi-domain state, direct indexation of the modes was impossible. However, due to small light spot used it was possible to observe the partly polarized Raman modes, although crystallographic orientation of the domain was not known.
I R ( ω ) = { n ( ω ) + 1 n ( ω ) } ( S r γ r ω ω 2 + γ r 2 + i S i ω i 2 γ i ω ( ω i 2 ω 2 ) 2 + γ i 2 ω 2 )
It was found that on cooling, after exceeding Tc the number of modes does not change, which may suggest that polar regions in the paraelectric phase determine the structure of the first intermediate phase. Because the Raman spectra of the first intermediate phase resemble the spectra of Pb(Zr,Ti)O3 with low titanium content, it can be assumed that this phase has a rhombohedral structure. Only the transition to the second intermediate phase causes an increase in the number of lattice vibrations (Figure 6b,c). In the temperature range at which transient effects were noted, the coexistence of a second intermediate phase and antiferroelectric phase was demonstrated, the appearance of which was noted by the appearance of a mode marked θ (Figure 6c). This mode occurred at temperature below the temperature range, in which intermediate effects occur [34].
Among the matched modes, the occurrence of three softening modes shown in Figure 6a and c as α, β and γ was found, which confirms the tests carried out for pure PbZrO3 [67], in which softening at least of several branches of the crystal lattice modes is responsible for phase transition in PbZrO3. However, after careful analysis, it turns out that only α vibration softens when approaching Tc and hardens below it. After plotting the ω2(T) dependence for these three modes, which according to Cochran’s law should be a linear function of temperature, it turned out that two of them, i.e., β and γ, do not satisfy this law in a certain temperature ranges (Figure 7).
Thanks to papers [68,69] it was possible to determine which atoms these three modes are related to. The α mode is associated with the vibrations of lead ions. Its observation above Tc must be related to structural disorder in this sublattice, causing local symmetry breaking. However, as one can see, it is not subject to any anomaly in TBH. This disorder is, however, responsible for phase transition to macroscopically polar phase, which is the first intermediate phase (IM1). The β mode can also be attributed to the vibration associated with lead atoms. As can be seen, this mode experiences a noticeable anomaly in TBH, which complies with theoretical assumptions [30]. It can therefore be concluded that the admixture of niobium does not affect this type of local symmetry violation, because it concerns directly sublattice A, but not B, in which—as was assumed—niobium is present. The oscillation of γ mode should point to oxygen octahedra vibration as being responsible for their tilts. Thus, it can be seen that the admixture of niobium affects the vibrations of oxygen octahedrons, which leads to breaking the symmetry well above the limit set by temperature TBH. This confirms the earlier conclusions from studies [32] and [33] that the admixture of niobium stabilizes the local symmetry breaking above Tc and is placed inside the BO6 octahedron. Also, due to the greatest discontinuity of changes in the γ frequency at transition temperature between the IM1 and IM2 phases, it can be stated that the admixture of niobium is responsible for the occurrence of this phase transition and the appearance of a new intermediate phase, not observed as yet (IM2). The phase transition itself should be realized mainly by a change in the tilts of oxygen octahedra.
Paper [34] is a report concerning observations of the quasi-elastic light scattering that contains the so-called central peak. This suggests that phase transitions observed can be caused either by a relaxation process existing above Tc or by some kind of disorder in sublattices, being of static or dynamic character. The reason for that may be clustering of niobium-containing cells in the crystal lattice, which would confirm the assumptions made in [32] in connection with the observed birefringent circular regions of micro-meter size in the antiferroelectric phase. It is worth mentioning that niobium clustering process was observed in SrTiO3 just doped with niobium [70].
As continuation of the studies of crystal lattice dynamics, Brillouin light scattering studies were performed [36] in the backscattering geometry. Only longitudinal acoustic mode (LA) was observed, which on cooling there was a split at 227 °C, i.e., at the temperature at which post-transitional effects occur. These two modes were coexisting up to 200 °C (Figure 8) which would mean that coexistence of phases occur in a much wider temperature range than previously found [35]. Therefore, it points to the phase transition nature different from that in pure PbZrO3, in which the antiferroelectric and paraelectric phases coexisted in the intermediate phase [29].
Unexpectedly, the LA mode frequency and half-width appear to be insensitive to phase transition at Tc and at transition between IM1 and IM2 phases. The derivative of half-width versus temperature shows an increase of the speed of mode damping at temperature about 320 °C. This temperature is associated with the appearance of polar regions observed in the Raman light scattering [34] and corresponds very well to the mode describing tilts of oxygen octahedra mentioned above. Therefore, it is another proof that in the paraelectric phase local polarity is induced due to an interaction between acoustic and optical modes (lattice instability), as suggested in theoretical model by Bussmann-Holder in [30].
Due to large temperature hysteresis of properties observed for niobium-doped crystals in the IM1 and IM2 phases on cooling and heating, one can suspect that it stems from a metastable process [32,33,34]. In [35], the stability of IM1 phase in time was controlled through measurements of the dielectric, optical, and pyroelectric properties at constant temperature and over time. That was carried out on cooling when the width of temperature range of the IM1 phase is greater than on heating. Examples of time changes of the permittivity are shown in Figure 9.
These experiments show that while temperature is stabilized at 217 °C, a phase transition from the phase IM1 to IM2 takes place spontaneously after a defined time. The same results were obtained by measuring the pyroelectric current. After approximately 21 min, changes in the current flowing in the system maintained at constant temperature were of the same character as those observed later during IM1 to IM2 transition on cooling. It means that we must deal with isothermal phase transition, at which at constant temperature a part of the sample transforms to the IM2 phase. This kind of transition was observed for all investigated samples, i.e., samples with different Nb concentrations, and for samples obtained in different technological processes. This proves that we deal with a process of self-organization of crystal lattice at a constant temperature, which is appropriate for lead zirconate crystals doped with Nb and has long-term relaxation character.
The most important conclusions from the experiments presented above, described tentatively in [32,33,34,35,36] papers, include:
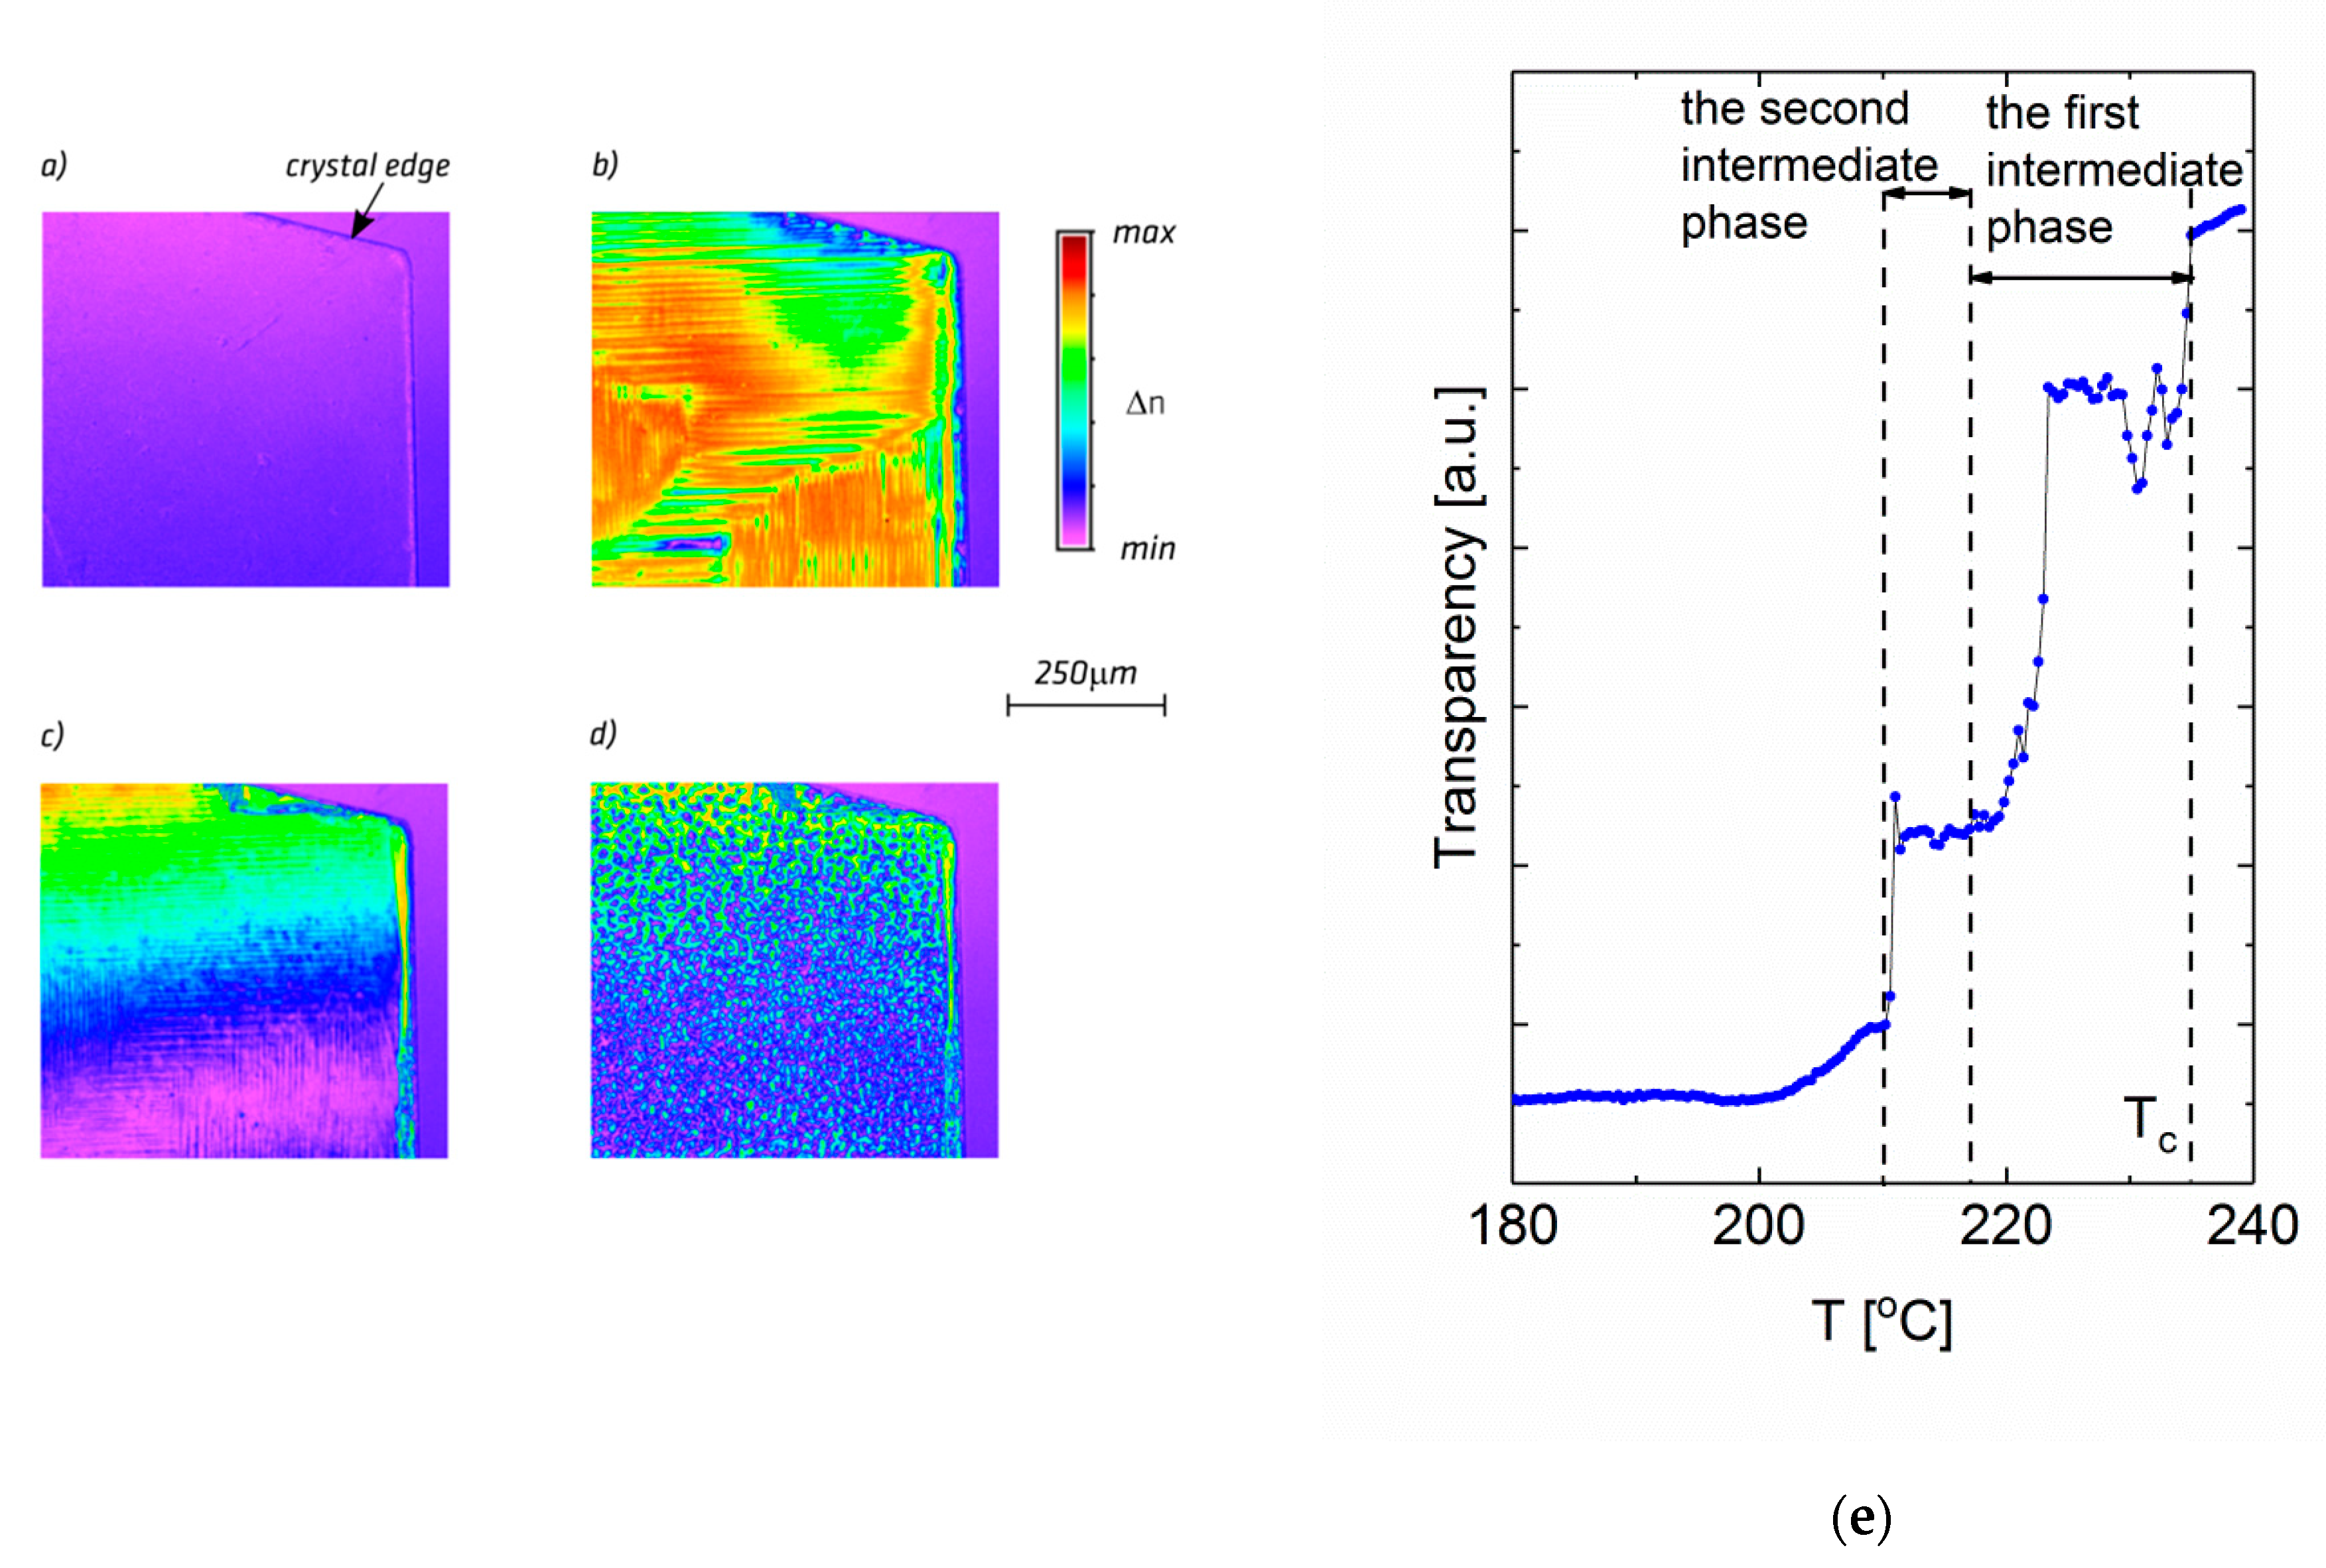
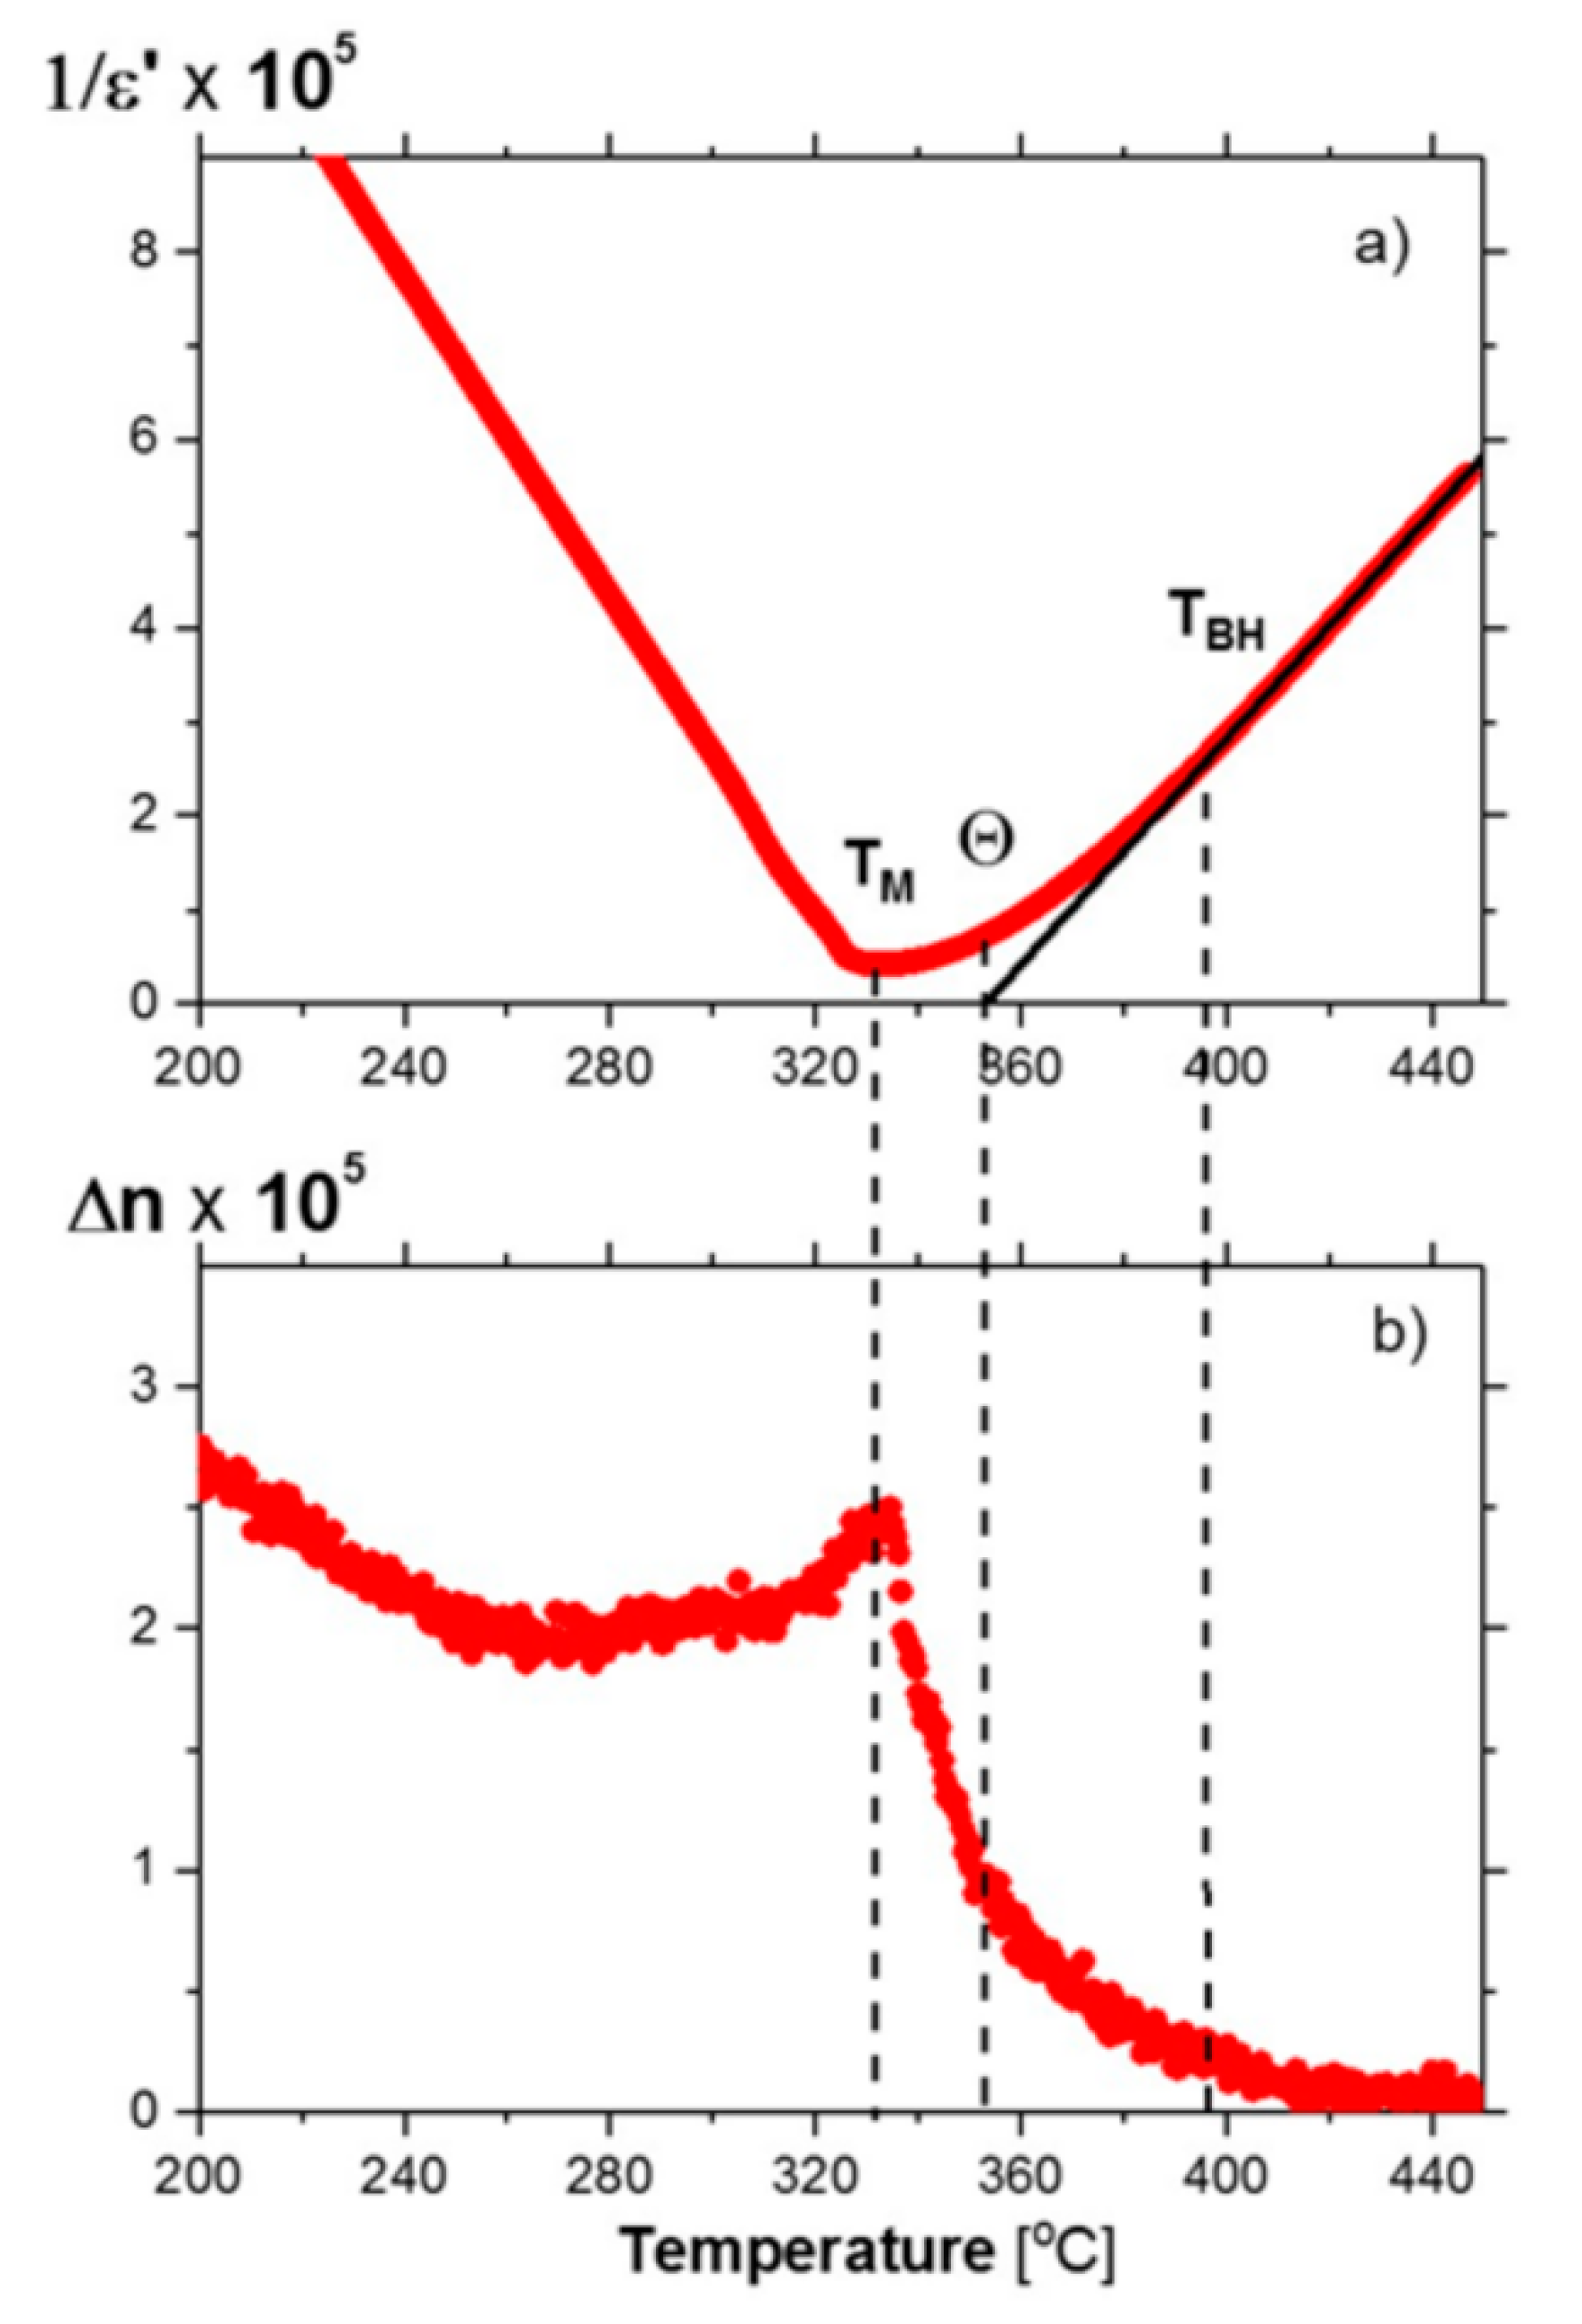
  • discovery of new, previously unobserved, phase transition and characterization of the nature of two intermediate phases,
  • determination of the role of central ion in oxygen octahedron in polar regions, occurring above Tc,
  • experimental confirmation of a specific interrelation (coupling) between acoustic, and optical modes of crystal lattice above Tc,
  • demonstration of coexistence of intermediate phase (IM2) and antiferroelectric phase (AF), and the relaxing nature of phase transition between IM2 and IM1 phases.

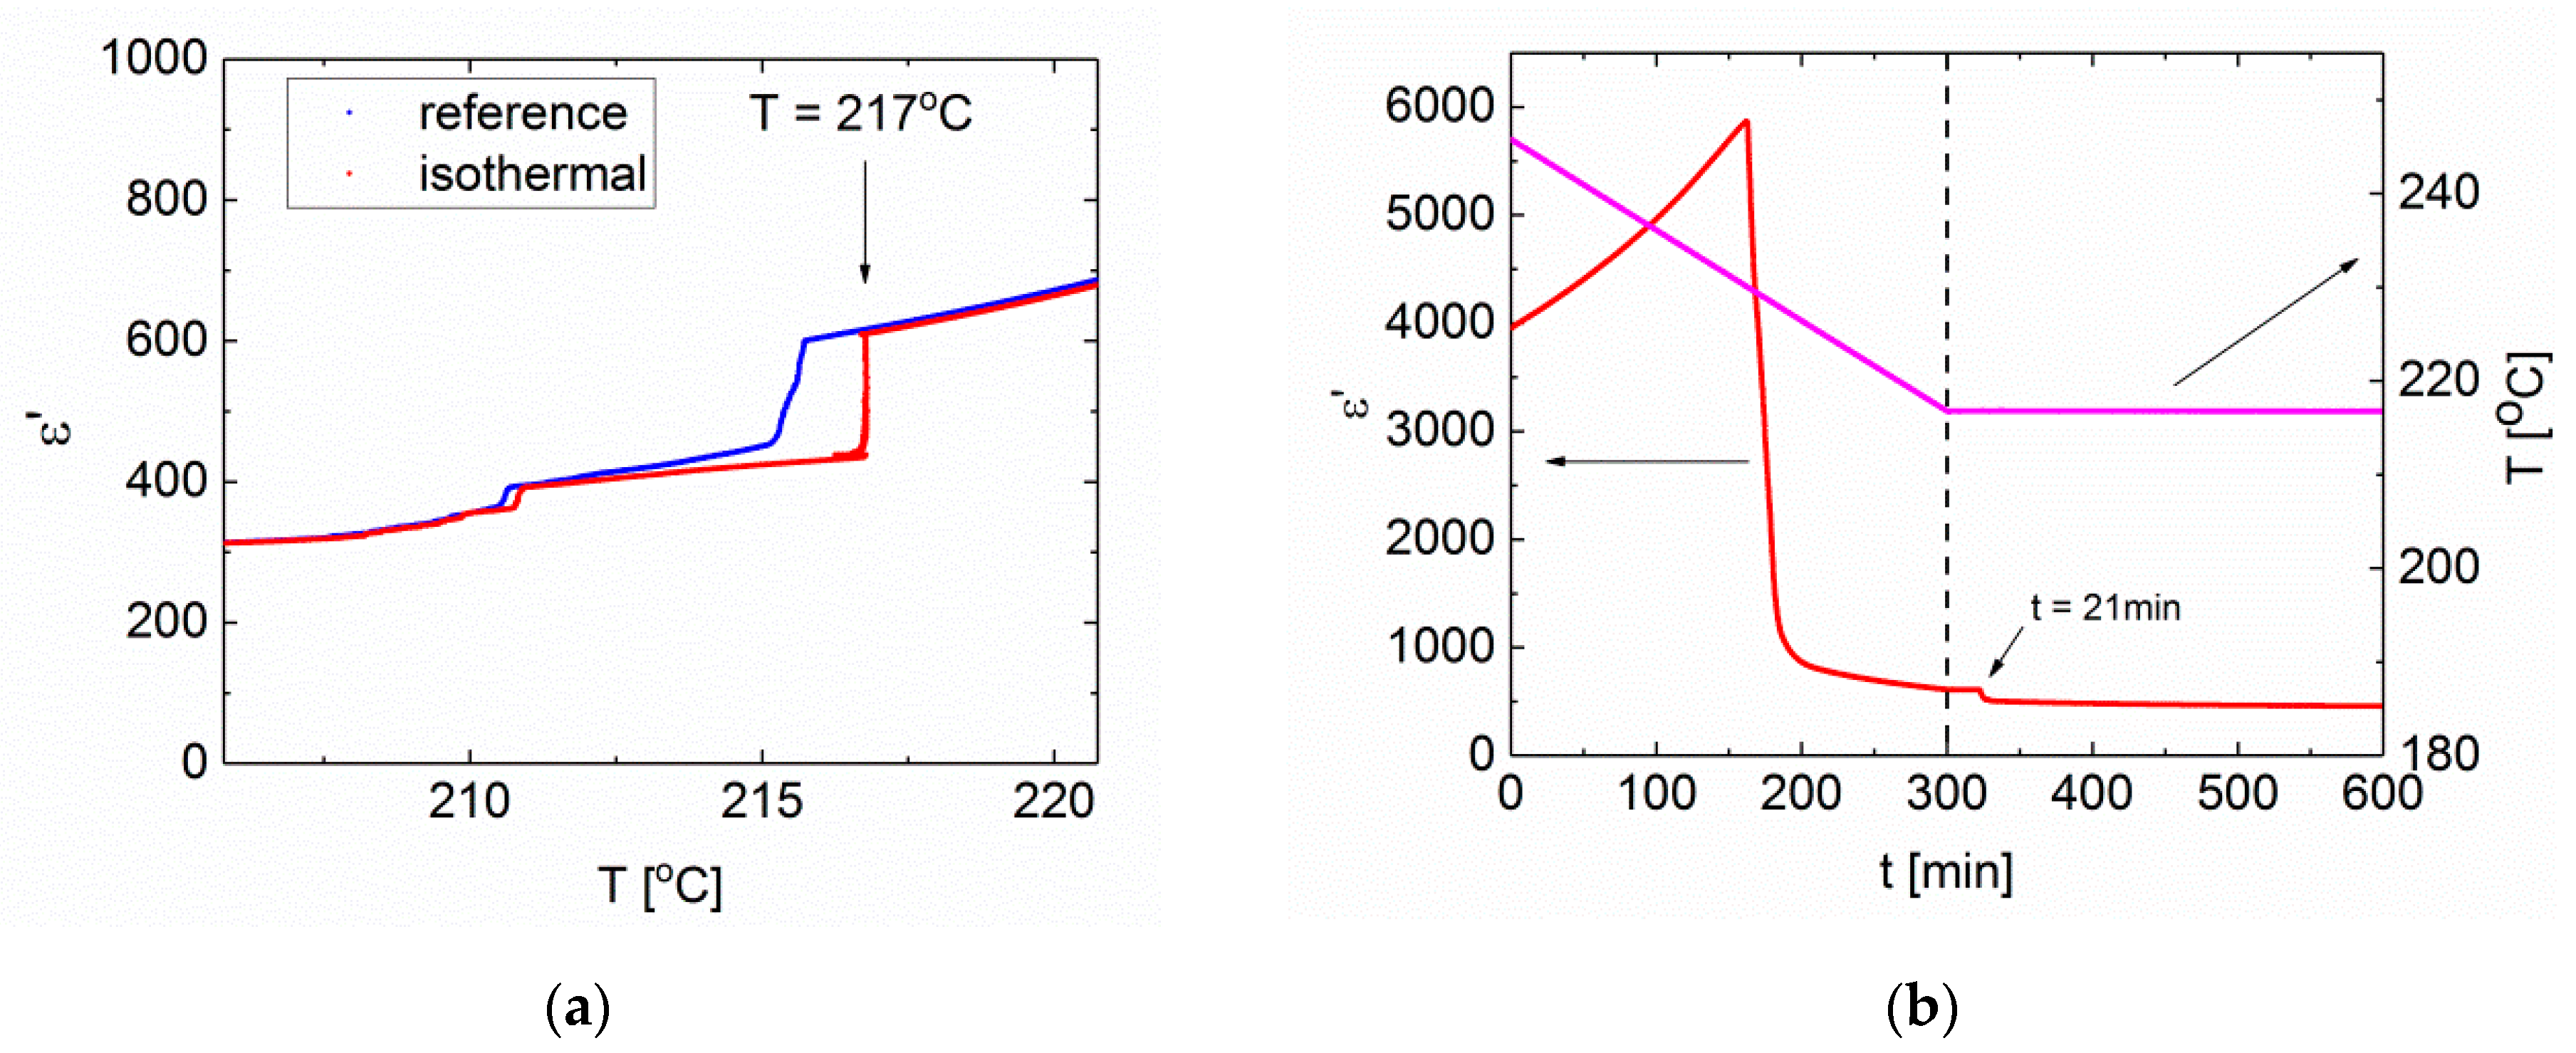
3.3. Segregation of Lattice Defects in PbZrO3 Crystal Doped with Niobium by Alternating Electric Field [37]

In the investigation of dielectric and electromechanical properties of perovskites containing oxygen octahedra, well known as functional materials, alternating or constant electric fields are used. However, the effect of these fields on surface properties is not taken into account sufficiently. For this reason, studies have been undertaken on the impact of alternating electric field on phase transitions and chemical properties of niobium-doped PbZrO3 crystals surface. That is why crystals, in which the concentration of admixture was high enough to create defects in the crystal lattice, have been investigated [37].
It has been found that alternating electric field changes the share of crystal part directly under the electrodes (surface) and its interior in the dielectric response. Study [37] has shown for the first time how important it is and what misleading conclusions may be drawn without that knowledge of phenomena presented in that paper. What is unique about that research is that measurements were performed on two parts of the same crystal, while only one was connected to an electrode (part B in Figure 10). Hence, only one part of the crystal was subjected to an electric field. It was, however, obvious that both parts of the crystal had the same “history” from the point of view of temperature changes it was subjected to.
As Figure 10 shows, the action of alternating electric field increases the temperature at which the maximum of ε(T) run, pointing to Tc, takes place, and decreases the transition temperature between IM1 and IM2 phases. However, temperature changes of the sample clearly demonstrate that linking the maximum of the ε(T) run with Tc is incorrect. Due to internal friction during sample vibrations in alternating field, heat is generated in the sample, which can be determined by measurement the deformation and temperature of the sample simultaneously. An example of such measurement is shown in Figure 11.
The observed temperature changes (Figure 11) clearly indicate that temperatures of phase transitions have not changed. Therefore, a question is raised why different runs of permittivity as function of temperature have been observed. The answer is that there is a change of physical properties mainly in crystal surface after application of a.c. field. The use of XPS techniques has shown that as a result of this action, the crystal surface is oxidized and lead appears in the fourth degree of oxidation, observed only inside the virgin part of the crystal. Moreover, valence band studies have shown the expansion of energy gap after electric field action in relation to the energy gap inside the virgin crystal [37]. This means that from the inside of the crystal, the defects were transported towards the surface, improving the quality of the interior and changing the chemical properties of surface. Thus, dielectric response measured after a.c. field action is a kind of “averaged” response from the surface–interior–surface system.
The most important conclusions are the following ones:
  • there is a complex relation between the interior and surface of a crystal subjected to a strong alternating field that may cause misleading interpretation of the dielectric response,
  • a possibility exists of “cleaning” the interior of the crystal by transporting defects towards the surface, enabled by alternating electric fields.

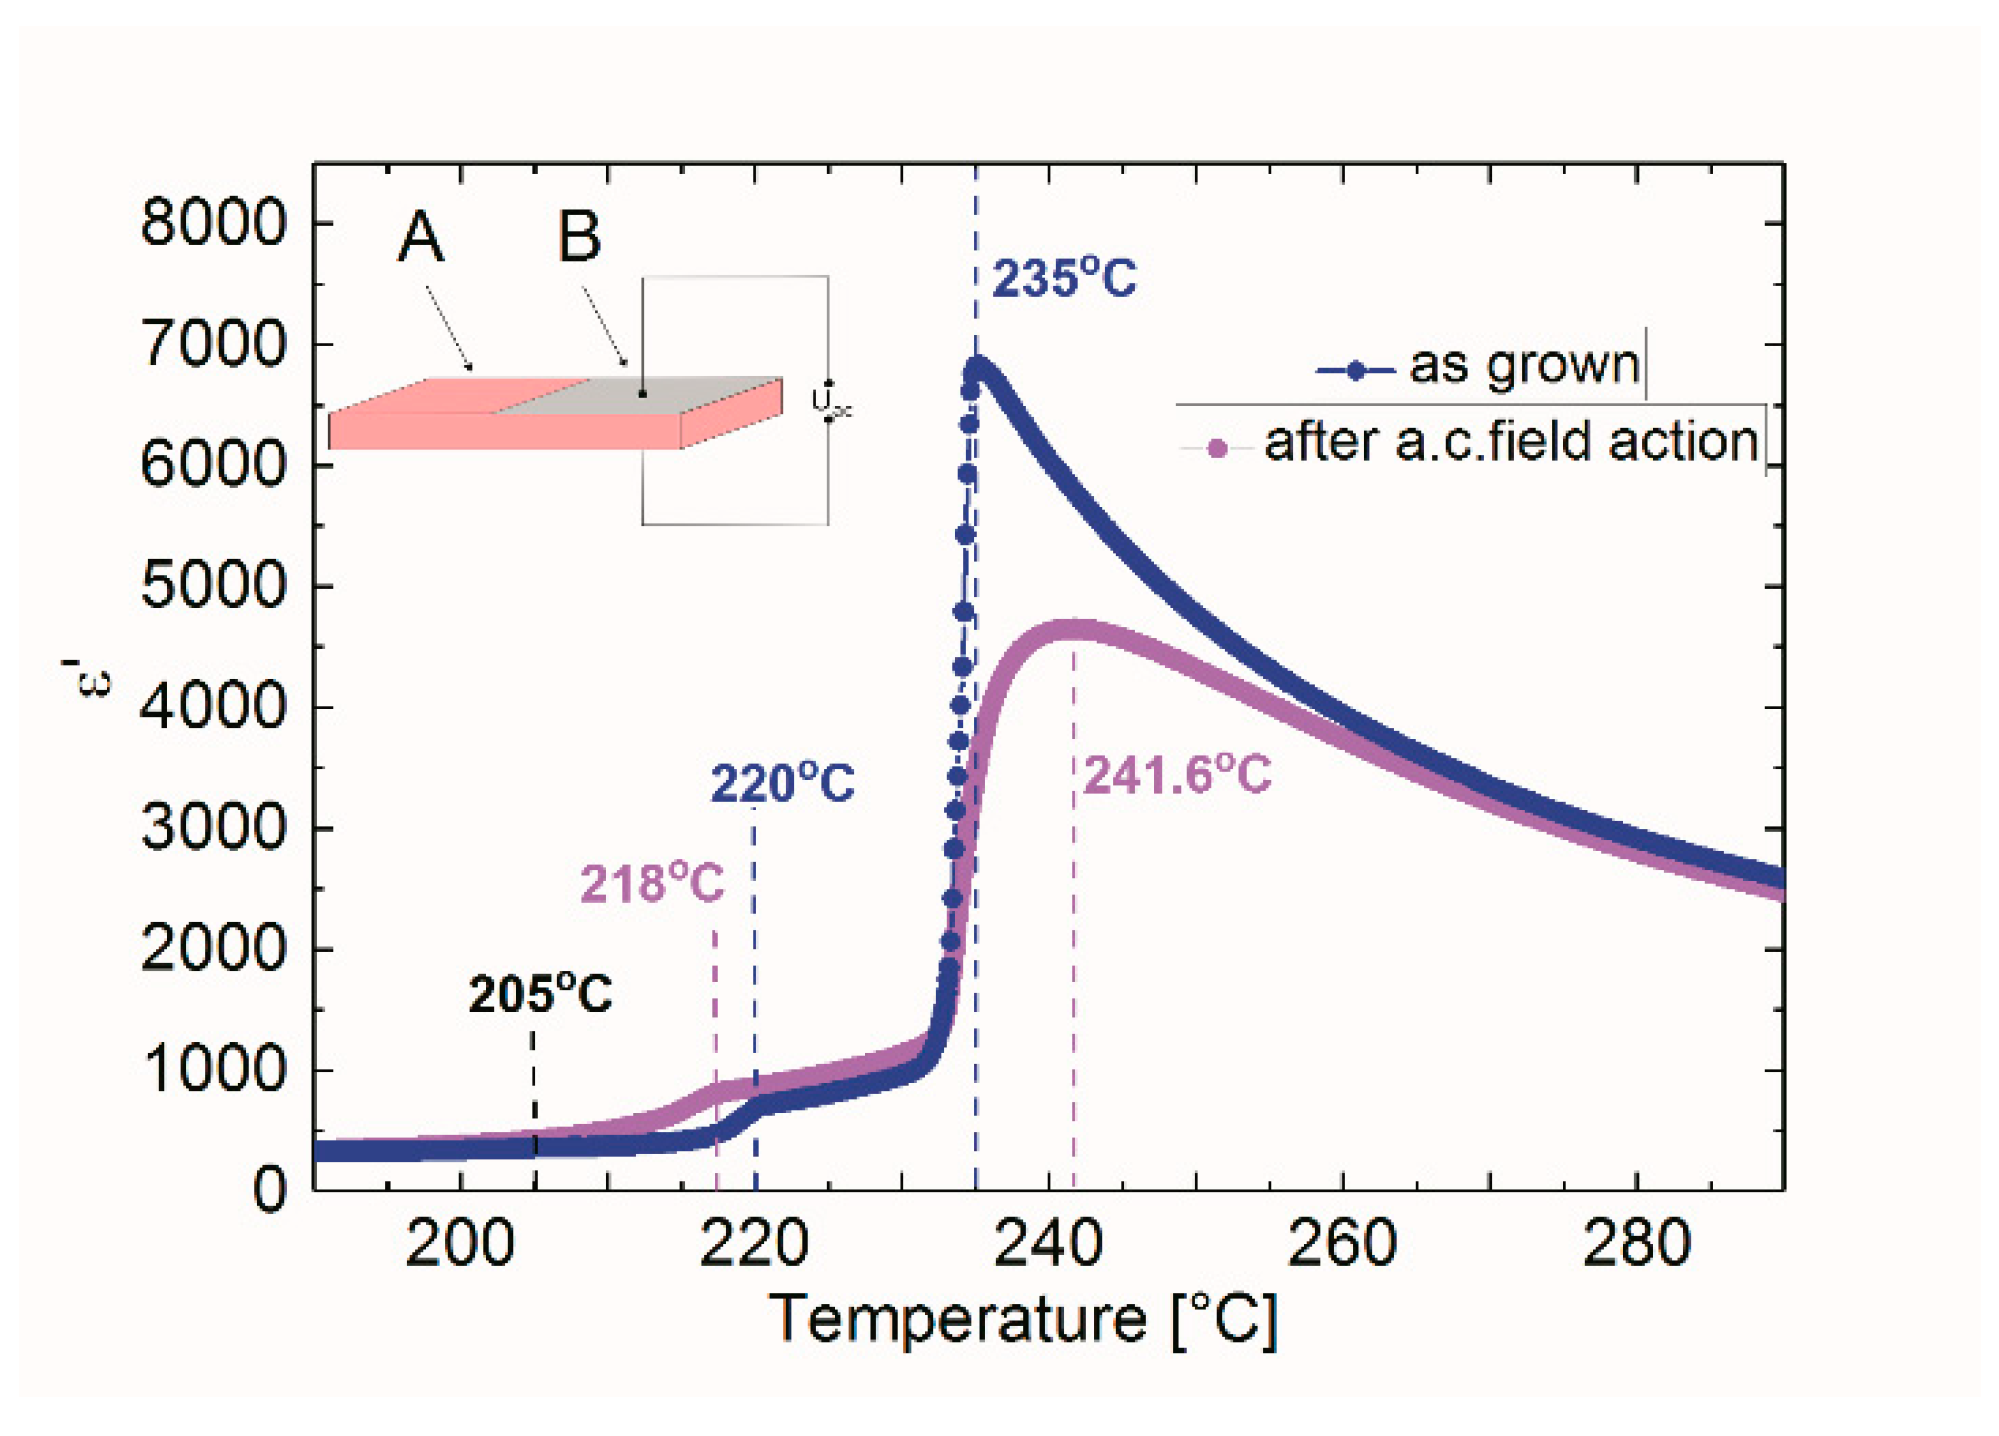
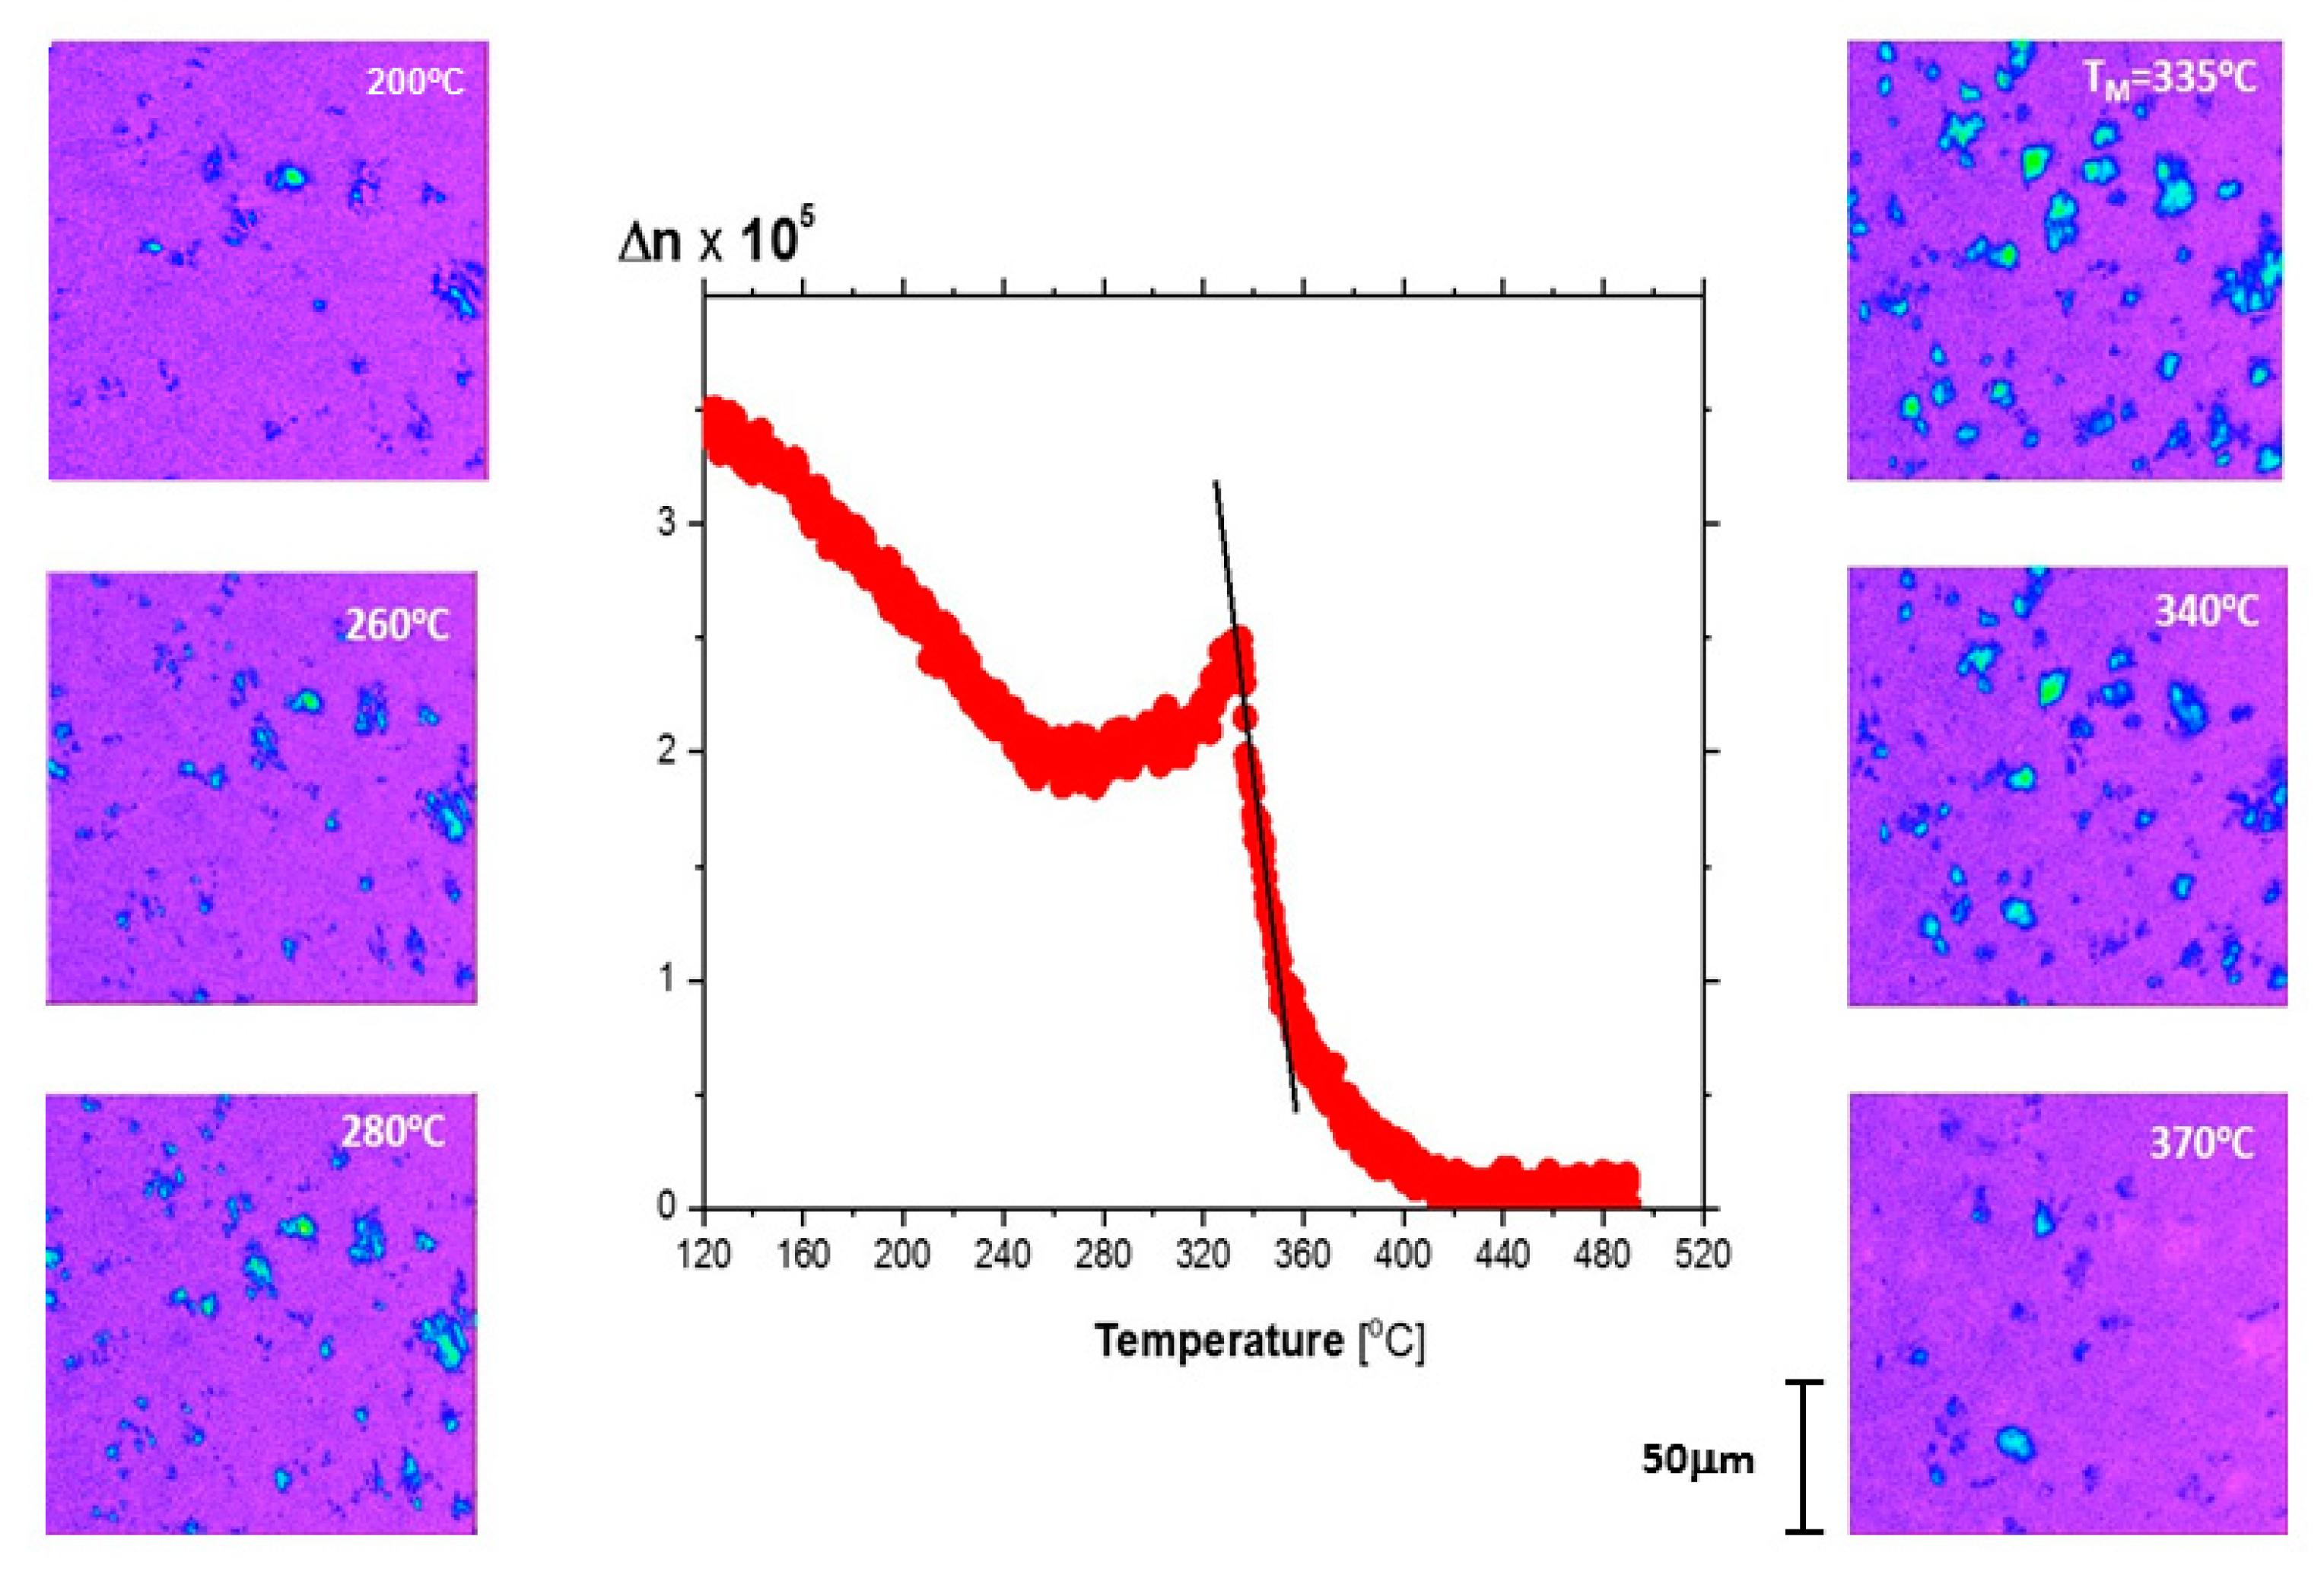
3.4. Interactions between Polar Regions Occurring Above Tc in PbZr0.70Ti0.30O3 Ceramics Doped with Bismuth [38]

Lead zirconate titanate (PZT) with higher content of titanium than zirconium and with different admixtures is widely used in applications. The paper [38] shows the influence of bismuth on physical properties of PZT 70/30 ceramics. It shows that increase in the concentration of bismuth reduces the temperature of phase transition from paraelectric to ferroelectric phase and reduces dielectric dispersion. This is probably due to the occurrence of four scenarios, whose probability varies with the amount of dopant concentration [38]. Namely:
(1)
two Bi3+ ions compensate for a double-ionized lead vacancy formed in the process of synthesis,
(2)
two Bi3+ ions produce one lead vacancy,
(3)
one ion of Bi3+ compensates for Ti3+ ion, which may occur due to the existence of oxygen vacancies [71],
(4)
Bi3+ ion leads to a change in oxidation state of ion in the middle of oxygen octahedron from 4+ to 3+. The most likely reason for it is a change in the valence of titanium due to its lower chemical stability than that of zirconium; such effects have also been observed in PZT 70/30 ceramics doped with BiMnO3 [72].
However, the most important fact presented in [38] is the interaction between polar regions. They were observed by measuring birefringence and dielectric properties of PZT doped with Bi (Figure 12 and Figure 13) [38]
As can be seen from Figure 13, the polar regions increase in size up to the temperature at which the maximum of permittivity occurs. The comparison of average changes of birefringence with changes of inverse permittivity gives very interesting correlation and explains the fact that temperature θ, which in the Curie–Weiss law should be less than or equal to TM, is apparently higher than TM (Figure 13).
As can be seen from Figure 13, the Curie–Weiss law is not obeyed below TBH, which is in line with theoretical predictions [30] However, this fact was observed only for the lowest concentration of Bi, and with further increase in concentration, the temperature at which deviation from the Curie–Weiss law was observed was higher than TBH. This fact can be explained by creating defects in the lead sublattice, as was case of Nb-doped crystals, or by changing the valence of the cation located in the middle of oxygen octahedron, i.e., titanium which changes its valence to Ti3+. This additional defect produces local stress that stabilizes the occurrence of polar regions at higher temperatures.
Further analysis of Figure 13 allows the drawing of a conclusion that the maximum of permittivity appears as a result of increased sizes of polar regions, and thus their long-range interactions. Therefore, the maximum of permittivity does not have to be associated with any structural phase transition. As can be seen, above temperature TM, the material is not in paraelectric phase in its entire volume, due to the presence of polar regions at least up to TBH.
However, how to interpret temperature θ remains to be explained. Based on the results presented in Figure 13, it may be assumed that θ is related to the temperature at which the size of polar regions begins to expand rapidly [38].
Therefore, the most important conclusions from this part are connected with:
  • connection between temperatures of characteristic anomalies of dielectric properties and evolution of temperature of polar areas,
  • confirmation that crystal lattice defects increase the temperature at which polar regions disappear.

4. Perspectives

It has proved in this manuscript that occurrence of the intermediate phase in the antiferroelectric PbZrO3 is related to the ratio of the donor to acceptor centers. This ratio is not in equilibrium, and centers being filled or emptied act similar to local stresses. Therefore, they influence local vibration of the crystal lattice. Because of small energy difference between the ferro- and antiferroelectric states, these defects—producing extra stresses in all PbZrO3 sublattices—are also responsible for the intermediate phase appearance. Moreover, it was shown that in zirconium sublattice a local symmetry breaking also takes place. All those centers, being in different charge states, enhance the probability of phase coexistence.
However, even small amount of hetero-valent dopant on B-side, such as niobium, leads to extraordinary changes in electrical conductivity and phase transitions sequence. As has been already shown, new phase transition PZO single crystal doped with Nb can appear. Such dopant, depending on its concentration, must create or compensate defect so that to guarantee electrical neutrality of crystal. Therefore, mechanism of structural transformations in PZO:Nb crystal, including effect of coexistence of phases, seems to be much more complicated than in pure PZO. Investigations of the electron–phonon interactions in PZO:Nb would help to understand how to steer the properties of this functional antiferroelectric material through hetero-valent doping. Therefore, it would be interesting to study electronic structure of doped PZO.
The ambient pressure XPS tests are very sufficient to perform electron structure and resonant photoemission studies on pure and niobium-doped PZO crystal. Also defected PZO single crystals could be measured since under ultrahigh vacuum (needed for experiment) new defects are created. This experiment would allow the investigation of electronic structure and valence band in neutral conditions for PZO samples (i.e., in oxygen reach atmosphere) through the resonant photoemission in the case of Pb, Zr, O, and Nb elements. It would also provide information about niobium (or other dopands) concentration and oxidation states which could be checked only using synchrotron radiation because of very small amount of Nb which is non-delectable by classical fixed energy XPS. This information would support recent investigation on the influence of electrical field on defects distribution in PZO doped with Nb. This experiment could also provide information on the depth profiles of elements and their oxidation states which would accomplish previous work.
With the obtained data from the experiment could answer some questions, such as “What is the Nb ion crystallographic site(s) in the perovskite ABO3 structure”, “Is the Nb ions distribution in the PZO lattice homogeneous or depends on the depth from the surface”, “What kind of chemical structures the Nb may, if any, form on the crystal surface”, “What is an electronic state of Zr ions in the surface and bulk of the pure and doped PZO crystal.” All those answers would help in understanding electron–phonon interaction, and reasons of the intermediate phase’s appearance in PZO. To the best of my knowledge this kind of information is not presented in the literature on the PZO crystal doped with foreign ions, even for so intensively studied famous PZT materials. In particular, the Zr ionic states in lead zirconate has not been discussed so far and because it was presented in this manuscript, it cannot be neglected.
Another important field which should be investigated, is crystal structure studied by synchrotron radiation and neutron diffraction. This would allow investigating subtle changes of crystal structure caused by doping and would bring essential information on intermediate phases’ structure. Also, in the context of recent studies of the incommensurate phase occurring in PbZrO3 and PbHfO3, it may be interesting to examine thoroughly the intermediate phases in this respect. In particular, when time-dependent phase transitions observed in them were characteristic for modulated phases (commensurate or incommensurate). Studies by means of neutron diffraction allow observation of subtle shifts of oxygen ions forming octahedrons. Those tilts of oxygen octahedrons are an important phenomenon accompanying phase transitions in this group of compounds. Such tilts, apart from the natural occurrence in PZO crystals, may be caused by defects in the crystal lattice occurring in each sublattices. Therefore, the key in further exploring the mechanism of phase transitions seems to be a thorough analysis of the impact of defects on the oxygen octahedron and lead ion shifts in the same on the phase transitions occurring in both doped and undoped PZO crystals.

5. Conclusions

The series of investigations presented provides a coherent picture of the impact of defects on the instability of crystal lattice vibrations in materials based on antiferroelectric PbZrO3. The most important conclusions are the following ones:
  • The electronic state of point defects in sublattices A, B, and O has a significant impact on the appearance of the so-called intermediate phase in PbZrO3 below Tc. It has been shown that the defects in the zirconium sublattice, previously omitted in the literature, also influence the properties of PbZrO3;
  • admixture of niobium Nb5+ and bismuth Bi3+, i.e., ions with a valence different from ion A and B in the structure A2+B4+O2−3, causes defects in the lead sublattice, leading to breaking of local symmetry at temperatures above TBH, i.e., the temperature determined for pure perovskite compounds with ABO3 structure;
  • experimental confirmation has been provided of interrelation between acoustic and optical modes in PbZrO3 predicted by theory, and indicating the presence of polar regions at temperatures above Tc.

Funding

This work was supported by the National Science Centre, Poland, within the project 2016/21/B/ST3/02242.

Acknowledgments

The author is thankful for experimental and technical support and fruitful discussions to Zbigniew Ujma, Jae Hyeon Ko, Annette Bussmann-Holder, Irena Jankowska-Sumara, Paweł Zajdel, Rafał Sitko, Katarzyna Balin, Jerzy Kubacki, Andrzej Majchrowski, Iwona Lazar, Julita Piecha, Andrzej Soszyński, Janusz Koperski, and Krystian Roleder.

Conflicts of Interest

The author declares no conflict of interest. The funders had no role in the design of the study; in the collection, analyses, or interpretation of data; in the writing of the manuscript, or in the decision to publish the results.

References

  1. Müller, K.A.; Berlinger, W. Microscopic probing of order-disorder versus displacive behavior in BaTiO3 by Fe3+ EPR. Phys. Rev. B 1986, 34, 6130–6136. [Google Scholar] [CrossRef] [PubMed]
  2. Müller, K.; Berlinger, W.; Blazey, K.; Albers, J. Electron paramagnetic resonance of Mn4+ in BaTiO3. Solid State Commun. 1987, 61, 21–25. [Google Scholar] [CrossRef]
  3. Müller, K.A.; Fayet, J.C. Structural Phase Transitions II; Müller, K.A., Thomas, H., Eds.; Springer: Berlin/Heidelberg, Germany, 1991; pp. 1–82. [Google Scholar]
  4. Comès, R.; Lambert, M.; Guinier, A. The chain structure of BaTiO3 and KNbO3. Solid State Commun. 1968, 6, 715–719. [Google Scholar] [CrossRef]
  5. Ravel, B.; Stern, E.A.; Vedrinskii, R.I.; Kraizman, V. Local structure and the phase transitions of BaTiO3. Ferroelectrics 1998, 206, 407–430. [Google Scholar] [CrossRef]
  6. Zalar, B.; Laguta, V.V.; Blinc, R. NMR Evidence for the coexistence of order-disorder and displacive components in barium titanate. Phys. Rev. Lett. 2003, 90, 37601. [Google Scholar] [CrossRef] [PubMed]
  7. Zalar, B.; Lebar, A.; Seliger, J.; Blinc, R.; Laguta, V.V.; Itoh, M. NMR study of disorder in BaTiO3 and SrTiO3. Phys. Rev. B 2005, 71, 064107. [Google Scholar] [CrossRef]
  8. Chaves, A.S.; Barreto, F.C.S.; Nogueira, R.A.; Zẽks, B. Thermodynamics of an eight-site order-disorder model for ferroelectrics. Phys. Rev. B 1976, 13, 207–212. [Google Scholar] [CrossRef]
  9. Völkel, G.; Muller, K.A. Order-disorder phenomena in the low-temperature phase of BaTiO3. Phys. Rev. B 2007, 76, 094105. [Google Scholar] [CrossRef]
  10. Geneste, G.; Kiat, J.-M. Ground state of ca-doped strontium titanate: Ferroelectricity versus polar nanoregions. Phys. Rev. B 2008, 77, 174101. [Google Scholar] [CrossRef]
  11. Ziębińska, A.; Rytz, D.; Szot, K.; Górny, M.; Rolder, K. Birefringence above Tc in single crystals of barium titanate. J. Phys. Condens. Matter 2008, 20, 142202. [Google Scholar] [CrossRef]
  12. Ko, J.-H.; Kojima, S.; Koo, T.-Y.; Jung, J.H.; Won, C.J.; Hur, N. Elastic softening and central peaks in BaTiO3 single crystals above the cubic-tetragonal phase-transition temperature. Appl. Phys. Lett. 2008, 93, 102905. [Google Scholar] [CrossRef] [Green Version]
  13. Tai, R.Z.; Namikawa, K.; Sawada, A.; Kishimoto, M.; Tanaka, M.; Lu, P.; Nagashima, K.; Maruyama, H.; Ando, M. Picosecond view of microscopic-scale polarization clusters in paraelectric BaTiO3. Phys. Rev. Lett. 2004, 93, 087601. [Google Scholar] [CrossRef] [PubMed] [Green Version]
  14. Kwapuldński, J.; Pawełczyk, M.; Dec, J. Thermal vibrations in PbTiO3 crystals. Ferroelectrics 1997, 192, 307–311. [Google Scholar] [CrossRef]
  15. Kwapulinski, J.; Kusz, J.; Böhm, H.; Dec, J. Thermal vibrations in PbTiO3 single crystals. J. Phys. Condens. Matter 2005, 17, 1825–1830. [Google Scholar] [CrossRef]
  16. Kwapulinski, J.; Pawelczyk, M.; Dec, J. On the Pb thermal vibrations in PbHfO3 crystals. J. Phys. Condens. Matter 1994, 6, 4655–4659. [Google Scholar] [CrossRef]
  17. Bussmann-Holder, A.; Kim, T.H.; Lee, B.W.; Ko, J.-H.; Majchrowski, A.; Soszyński, A.; Roleder, K. Phase transitions and interrelated instabilities in PbHfO3 single crystals. J. Phys. Condens. Matter 2015, 27, 105901. [Google Scholar] [CrossRef]
  18. Bussmann-Holder, A.; Ko, J.-H.; Majchrowski, A.; Górny, M.; Roleder, K. Precursor dynamics, incipient ferroelectricity and huge anharmonicity in antiferroelectric lead zirconate PbZrO3. J. Phys. Condens. Matt. 2013, 25, 212202. [Google Scholar] [CrossRef]
  19. Tennery, V.J. A study of the phase transitions in PbZrO3. J. Electrochem. Soc. 1965, 112, 1117. [Google Scholar] [CrossRef]
  20. Tennery, V.J. High-temperature phase transitions in PbZrO3. J. Am. Ceram. Soc. 1966, 49, 483–486. [Google Scholar] [CrossRef]
  21. Goulpeau, L. Phase Transitions in Lead Zirconate. Sov. Phys. Solid State 1967, 8, 1970–1971. [Google Scholar]
  22. Scott, B.A.; Burns, G. Crystal growth and observation of the ferroelectric phase of PbZrO3. J. Am. Ceram. Soc. 1972, 55, 331–333. [Google Scholar] [CrossRef]
  23. Ujma, Z.; Hańderek, J. Phase transitions and spontaneous polarization in PbZrO3. Phys. Status Solidi (a) 1975, 28, 489–496. [Google Scholar] [CrossRef]
  24. Whatmore, R.W.; Glazer, A.M. Structural phase transitions in lead zirconate. J. Phys. C Solid State Phys. 1979, 12, 1505. [Google Scholar] [CrossRef]
  25. Roleder, K.; Dee, J. The defect-induced ferroelectric phase in thin PbZrO3 single crystals. J. Phys. Condens. Matter 1989, 1, 1503–1510. [Google Scholar] [CrossRef]
  26. Ujma, Z.; Hańderek, J. The influence of defects in the Pb and O sub-lattices on dielectric properties and phase transitions in PbZrO3. Phase Transit. 1983, 3, 121–130. [Google Scholar] [CrossRef]
  27. Ujma, Z. Dielectric properties and phase transitions in PbZrO3 with oxygen vacancies. Phase Transit. 1984, 4, 169–181. [Google Scholar] [CrossRef]
  28. Ujma, Z.; Dmytrow, D.; Handerek, J. The intermediate ferroelectric phase in PbZrO3 with high concentration of defects. Ferroelectrics 1988, 81, 107–110. [Google Scholar] [CrossRef]
  29. Ko, J.-H.; Górny, M.; Majchrowski, A.; Roleder, K.; Bussmann-Holder, A. Mode softening, precursor phenomena, and intermediate phases in PbZrO3. Phys. Rev. B 2013, 87, 184110. [Google Scholar] [CrossRef]
  30. Bussmann-Holder, A.; Beige, H.; Völkel, G. Precursor effects, broken local symmetry, and coexistence of order-disorder and displacive dynamics in perovskite ferroelectrics. Phys. Rev. B 2009, 79, 184111. [Google Scholar] [CrossRef]
  31. Kajewski, D.; Kubacki, J.; Balin, K.; Lazar, I.; Piecha, J.; Bussmann-Holder, A.; Ko, J.-H.; Roleder, K. Defect-induced intermediate phase appearance in a single PbZrO3 crystal. J. Alloys Compd. 2020, 812, 152090. [Google Scholar] [CrossRef]
  32. Kajewski, D.; Ujma, Z.; Zajdel, P.; Roleder, K. Nb-stabilized locally broken symmetry below and above Tc in a PbZrO3 single crystal. Phys. Rev. B 2016, 93, 054104. [Google Scholar] [CrossRef]
  33. Kajewski, D.; Zajdel, P.; Sitko, R.; Lazar, I.; Bussmann-Holder, A.; Ko, J.-H.; Roleder, K.; Roleder, R. Defect induced lattice instabilities and competing interactions in niobium doped lead zirconate single crystals. J. Alloys Compd. 2018, 739, 499–503. [Google Scholar] [CrossRef]
  34. Kajewski, D.; Jankowska-Sumara, I.; Ko, J.-H.; Lee, J.W.; Majchrowski, A.; Bussmann-Holder, A.; Roleder, K. Influence of Nb+5 ions on phase transitions and polar disorder above Tc in PbZrO3 studied by Raman spectroscopy. J. Am. Ceram. Soc. 2020, 103, 3657–3666. [Google Scholar] [CrossRef]
  35. Kajewski, D.; Ko, J.-H.; Lee, J.W.; Jankowska-Sumara, I.; Majchrowski, A.; Bussmann-Holder, A.; Roleder, K. Phase coexistence in slightly doped PbZrO3 investigated by brillouin light scattering. In Proceedings of the 5th International Conference on Advanced Electromaterials, Jeju, Korea, 5–8 November 2019. [Google Scholar]
  36. Kajewski, D.; Ko, J.-H.; Lee, J.W.; Jankowska-Sumara, I.; Majchrowski, A.; Roleder, K. Isothermal self-ordering in niobium doped lead zirconate single crystals. In Proceedings of the European Meeting on Ferroelectricity, Lausanne, Switzerland, 14–19 June 2019. [Google Scholar]
  37. Kajewski, D.; Kubacki, J.; Bussmann-Holder, A.; Roleder, K. Surface–bulk interrelation in a PbZrO3 single crystal. J. Mater. Chem. C 2017, 5, 10456–10461. [Google Scholar] [CrossRef]
  38. Kajewski, D.; Zajdel, P.; Soszyński, A.; Koperski, J.; Lazar, I.; Roleder, K. Bismuth doped PbZr0.70Ti0.30O3 ceramics and their properties driven by high temperature local polarity. Ceram. Int. 2019, 45, 9871–9877. [Google Scholar] [CrossRef]
  39. Wojcik, K.; Ujma, Z. Nonstoichiometry and optical absorption in PbZrO3 and PbTiO3 single crystals. Ferroelectrics 1989, 89, 133–142. [Google Scholar] [CrossRef]
  40. Ujma, Z.; Dmytrow, D.; Pawełczyk, M. Structure and electrical properties of PbZrO3 doped with Nb2O5. Ferroelectrics 1991, 120, 211–224. [Google Scholar] [CrossRef]
  41. Shirane, G.; Sawaguchi, E.; Takeda, A. On the phase transition in lead zirconate. Phys. Rev. 1950, 80, 485. [Google Scholar] [CrossRef]
  42. Vales-Castro, P.; Roleder, K.; Zhao, L.; Li, J.; Kajewski, D.; Catalan, G. Flexoelectricity in antiferroelectrics. Appl. Phys. Lett. 2018, 113, 132903. [Google Scholar] [CrossRef] [Green Version]
  43. Vales-Castro, P.; Faye, R.; Vellvehí, M.; Perpinya, X.; Kajewki, D.; Roleder, K.; Defay, E.; Perez-Tomas, V.; Catalan, G. Direct measurement of large negative and positive electrocaloric effects in antiferroelectric PbZrO3, advanced materials. Sci. Adv. 2020. submitted for publication. [Google Scholar]
  44. Benguigui, L. Ferroelectricity and antiferroelectricity in pure and Nb2O5 doped lead zirconate. J. Solid State Chem. 1971, 3, 381–386. [Google Scholar] [CrossRef]
  45. Samara, G.A. Pressure and temperature dependence of the dielectric properties and phase transitions of the antiferroelectric perovskites: PbZrO3 and PbHfO3. Phys. Rev. B 1970, 1, 3777–3786. [Google Scholar] [CrossRef]
  46. Ujma, Z.; Hańderek, J. Electric Properties of PbZrO3 monocrystals. Acta Phys. Polon. A 1978, 53, 665. [Google Scholar]
  47. Ujma, Z.; Hańderek, J. Space-charge polarization and phase transitions in lead zirconate. Phase Transit. 1980, 1, 363–376. [Google Scholar] [CrossRef]
  48. Frantti, J.; Fujioka, Y.; Puretzky, A.A.; Xie, Y.; Ye, Z.-G.; Glazer, A.M. A statistical model approximation for perovskite solid-solutions: A Raman study of lead-zirconate-titanate single crystal. J. Appl. Phys. 2013, 113, 174104. [Google Scholar] [CrossRef]
  49. Burkovsky, R.G.; Bronwald, Y.A.; Filimonov, A.V.; Rudskoy, A.I.; Chernyshov, D.; Bosak, A.; Hlinka, J.; Long, X.; Ye, Z.-G.; Vakhrushev, S. Structural heterogeneity and diffuse scattering in morphotropic lead zirconate-titanate single crystals. Phys. Rev. Lett. 2012, 109, 097603. [Google Scholar] [CrossRef] [PubMed]
  50. Phelan, D.; Long, X.; Xie, Y.; Ye, Z.-G.; Glazer, A.M.; Yokota, H.; Thomas, P.; Gehring, P.M. Single crystal study of competing rhombohedral and monoclinic order in lead zirconate titanate. Phys. Rev. Lett. 2010, 105, 207601. [Google Scholar] [CrossRef] [Green Version]
  51. Lazar, I.; Kajewski, D.; Majchrowski, A.; Soszyński, A.; Koperski, J.; Roleder, K. A contribution to understanding the complex phase diagram of PZT compounds. Ferroelectrics 2016, 500, 67–75. [Google Scholar] [CrossRef]
  52. Lazar, I.; Oboz, M.; Kubacki, J.; Majchrowski, A.; Piecha, J.; Kajewski, D.; Roleder, K. Weak ferromagnetic response in PbZr1−xTixO3 single crystals. J. Mater. Chem. C 2019, 7, 11085–11089. [Google Scholar] [CrossRef]
  53. Lazar, I.; Oh, S.H.; Ko, J.-H.; Zajdel, P.; Kajewski, D.; Majchrowski, A.; Piecha, J.; Koperski, J.; Soszyński, A.; Roleder, K. Additional phase transition in a PbZr0.87Ti0.13O3 single crystal. J. Phys. D Appl. Phys. 2019, 52, 115302. [Google Scholar] [CrossRef]
  54. Zhang, N.; Yokota, H.; Glazer, A.M.; Ren, Z.; Keen, D.A.; Keeble, D.S.; Thomas, P.A.; Ye, Z.-G. The missing boundary in the phase diagram of PbZr1−xTixO3. Nat. Comm. 2014, 5, 5231. [Google Scholar] [CrossRef] [PubMed]
  55. Geday, M.A.; Glazer, A.M. Birefringence of SrTiO3 at the ferroelastic phase transition. J. Phys. Condens. Matter 2004, 16, 3303–3310. [Google Scholar] [CrossRef]
  56. Wieczorek, K.; Ziebiniska, A.; Ujma, Z.; Szot, K.; Górny, M.; Franke, I.; Koperski, J.; Soszyński, A.; Roleder, K. Electrostrictive and piezoelectric effect in BaTiO3 and PbZrO3. Ferroelectrics 2006, 336, 61–67. [Google Scholar] [CrossRef]
  57. Kim, J.H.; Choi, J.-Y.; Jeong, M.-S.; Ko, J.-H.; Ahart, M.; Ko, Y.H.; Kim, K.J. Development of a high-pressure brillouin spectrometer and its application to an ethylene-vinyl acetate copolymer. J. Korean Phys. Soc. 2012, 60, 1419–1423. [Google Scholar] [CrossRef]
  58. Rietveld, H.M. A profile refinement method for nuclear and magnetic structures. J. Appl. Crystallogr. 1969, 2, 65–71. [Google Scholar] [CrossRef]
  59. Rodriguez-Carvajal, J. Recent developments of the program FULLPROF commission on powder diffraction. IUCr Newsl. 2001, 26, 12–19. [Google Scholar]
  60. Waghmare, U.V.; Rabe, K.M. Lattice instabilities, anharmonicity and phase transitions in PbZrO3 from first principles. Ferroelectrics 1997, 194, 135–147. [Google Scholar] [CrossRef]
  61. Singh, D.J. Structure and energetics of antiferroelectric PbZrO3. Phys. Rev. B 1995, 52, 12559–12563. [Google Scholar] [CrossRef]
  62. Kagimura, R.; Singh, D.J. First-principles investigations of elastic properties and energetics of antiferroelectric and ferroelectric phases of PbZrO3. Phys. Rev. B 2008, 77, 104113. [Google Scholar] [CrossRef]
  63. Dai, X.; Li, J.; Viehland, D. Weak ferroelectricity in antiferroelectric lead zirconate. Phys. Rev. B 1995, 51, 2651–2655. [Google Scholar] [CrossRef]
  64. Roleder, K.; Maglione, M.; Fontana, M.D.; Dec, J. Behaviour of a polar relaxation mode around the phase transition point in the antiferroelectric single crystal. J. Phys. Condens. Matter 1996, 8, 10669–10678. [Google Scholar] [CrossRef]
  65. Aoyagi, S.; Kuroiwa, Y.; Sawada, A.; Tanaka, H.; Harada, J.; Nishibori, E.; Takata, M.; Sakata, M. Direct observation of covalency between O and disordered Pb in cubic PbZrO3. J. Phys. Soc. Jpn. 2002, 71, 2353–2356. [Google Scholar] [CrossRef]
  66. Jankowska-Sumara, I.; Jeong, M.-S.; Ko, J.-H.; Majchrowski, A.; Zmija, J. Phase transitions in PbZr0.72Sn0.28O3 single crystals studied by Raman spectroscopy. Phase Transit. 2016, 89, 768–776. [Google Scholar] [CrossRef]
  67. Hlinka, J.; Ostapchuk, T.; Buixaderas, E.; Kadlec, F.; Kužel, P.; Gregora, I.; Kroupa, J.; Savinov, M.; Klic, A.; Drahokoupil, J.; et al. Multiple soft-mode vibrations of lead zirconate. Phys. Rev. Lett. 2014, 112. [Google Scholar] [CrossRef]
  68. Ostapchuk, T.; Petzelt, J.; Zelezny, V.; Kamba, S.; Bovtun, V.; Porokhonskyy, V.; Pashkin, A.; Kužel, P.; Glinchuk, M.D.; Bykov, I.P.; et al. Polar phonons and central mode in antiferroelectric PbZrO3 ceramics. J. Phys. Condens. Matter 2001, 13, 2677–2689. [Google Scholar] [CrossRef]
  69. Pasto, A.E.; Condrate, R.A. Raman spectrum of PbZrO3. J. Am. Ceram. Soc. 1973, 56, 436–438. [Google Scholar] [CrossRef]
  70. Rodenbücher, C.; Speier, W.; Bihlmayer, G.; Breuer, U.; Waser, R.; Szot, K. Cluster-like resistive switching of SrTiO3: Nb surface layers. New J. Phys. 2013, 15, 103017. [Google Scholar] [CrossRef]
  71. Pilch, M.; Molak, A.; Szot, K. Thermal treatment effects in PbTiO3 crystals studied by XPS and electric conductivity tests. Ferroelectrics 2014, 466, 51–62. [Google Scholar] [CrossRef]
  72. Szeremeta, A.; Pawlus, S.; Pilch, M.; Balin, K.; Leonarska, A.; Molak, A.; Paluch, M. Relaxor state and electric relaxations induced by the addition of Bi and Mn ions to Pb(Zr0.70Ti0.30)O3 ceramics. Ceram. Int. 2017, 43, 11699–11709. [Google Scholar] [CrossRef]
Figure 1. (a) Maps of birefringence obtained on heating and cooling. The color change from pink to red (as seen in the phase front of the transition from antiferroelectric (AF) to paraelectric (P) phase) indicates the changes in birefringence from minimum to maximum value. The phase transition from AF to P state could be observed on heating, and from P state to intermediate phase (IM) on cooling. Along with further reduction of temperature, it was possible to observe the transition from IM to AF phase; (b) Phase transition temperatures from P to IM (denoted as TP−IM) and from IM to AF phase (denoted as TIM−AF) as a function of annealing temperature TH, obtained on cooling [31].
Crystals 10 00501 g001
Figure 2. Depth profiles obtained by the TOF-SIMS method for (a) lead, (b) zirconium and (c) oxygen in virgin PbZrO3 crystal [31] (index “stable” means the stable concentration of the element in the crystal interior).
Crystals 10 00501 g002
Figure 3. Core electron states of (a) lead 4f, (b) zirconium 3d, and (c) oxygen 1s for a virgin sample and sample after annealing at 600, 700, 800 and 900 °C [31].
Crystals 10 00501 g003
Figure 4. Birefringence maps of PbZrO3 single crystals with the nominal content of 0.6 mol% Nb2O5 obtained in the cooling process (a) above Tc at 235 °C, (b) below Tc in the first transition phase, at 229 °C, (c) in the second transition phase, at 215 °C, and (d) in the antiferroelectric phase, at 186 °C. The bar with a color gradient represents birefringence values from 0 (pink) to the highest value (red) [32]. The Figure 4e shows the dependence of light absorption at 570 nm wavelength in PbZrO3 with an admixture of nominal amount of 1 mol% Nb2O5 as a function of temperature in the cooling process, for wavelength λ = 570 nm [33].
Crystals 10 00501 g004
Figure 5. Birefringence above Tc for PbZrO3 crystal doped with (a) 0.6 mol% Nb2O5 [32] and (b) 1.0 mol% Nb2O5 [33]. Tpd is the temperature at which the piezo-deformation signal disappears.
Crystals 10 00501 g005
Figure 6. Temperature (a) evolution of Raman spectra and (b) dependence of lattice vibration frequency for the PbZrO3:1%Nb crystal. Dashed lines correspond to the temperatures of phase transitions determined from dielectric and optical studies [34]; (c) temperature lattice vibration frequency in vicinity of phase transitions for the PbZrO3:1%Nb crystal.
Crystals 10 00501 g006
Figure 7. Temperature dependence of the squares of modes’ frequencies (a) α, (b) β and (c) γ. The red and blue lines match in high temperature range. The temperature defined in [34] was determined as TBH.
Crystals 10 00501 g007
Figure 8. Temperature dependence of (a) the LA mode frequency shift and (b) the half-width of this mode, determined from the Brillouin light scattering [35].
Crystals 10 00501 g008
Figure 9. (a) Dielectric changes for the reference ε(T) run (blue curve) and ε(T) run (red) after keeping the sample at 217 °C for 21 min (red); (b) Changes of permittivity (red) and temperature (pink) as a function of time [36].
Crystals 10 00501 g009
Figure 10. Temperature changes of electric permittivity of the virgin crystal part A (blue) and part B of crystal exposed to alternating electric field (magenta). The inset shows the geometry of electrodes used for dielectric and electromechanical measurements. The measuring field frequency in dielectric measurements was 1 MHz and the electric field strength in electromechanical measurements was 3 kV/cm [37].
Crystals 10 00501 g010
Figure 11. (a) Temperature changes of d33 piezoelectric module and (b) changes of sample temperature caused by phase transition enthalpy and/or internal friction caused by movements of domain/polar regions under the influence of an external alternating electric field. The measurement was made on cooling [37].
Crystals 10 00501 g011
Figure 12. (middle part) Temperature changes of birefringence (average values), after subtracting the background generated by the set-up, for areas of 500 × 450 μm2 of ceramics PZT70/30 doped with 0.2 mol% Bi2O3. This area contains over 200 grains. On the left and right side there are birefringence maps for selected temperatures, showing the evolution of polar regions in terms of size. The size of birefringent regions (blue bright spots) is interpreted as size of polar regions. Linear changes of Δn as function of temperature were observed above the Tm temperature (maximum of permittivity) [38].
Crystals 10 00501 g012
Figure 13. Changes in the inverse of permittivity and birefringence (average value) as a function of temperature for PZT 70/30 ceramics doped with 0.2 mol% Bi2O3, obtained on heating. (a) Inverse permittivity showing temperature TM, Curie–Weiss temperature θ, as determined from ε−1(T) run, and temperature TBH calculated from the formula TBH = 1.1 TM; (b) temperature changes of birefringence determined from the area of 500 × 450 µm2 of ceramics with 65µm thickness [38].
Crystals 10 00501 g013

