Article

Study on Visible Light Catalysis of Graphite Carbon Nitride-Silica Composite Material and Its Surface Treatment of Cement

Shandong Provincial Key Laboratory of Preparation and Measurement of Building Materials, University of Jinan, Jinan 250022, China
*
Authors to whom correspondence should be addressed.
Crystals 2020, 10(6), 490; https://doi.org/10.3390/cryst10060490
Submission received: 24 May 2020 / Revised: 5 June 2020 / Accepted: 5 June 2020 / Published: 7 June 2020

Abstract

:
Cement-based composite is one of the essential building materials that has been widely used in infrastructure and facilities. During the service of cement-based materials, the performance of cement-based materials will be affected after the cement surface is exposed to pollutants. Not only can the surface of cement treated with a photocatalyst degrade pollutants, but it can also protect the cement-based materials from being destroyed. In this study, graphite carbon nitride-silica composite materials were synthesized by thermal polymerization using nanosilica and urea as raw materials. The effect of nanosilica content and specific surface area were investigated with the optimal condition attained to be 0.15 g and 300 m2/g, respectively. An X-ray diffractometer, thermogravimetric analyzer, scanning electron microscope, a Brunauer–Emmett–Teller (BET) specific surface area analyzer and ultraviolet-visible spectrophotometer were utilized for the characterization of as-prepared graphite carbon nitride-silica composite materials. Subsequently, the surface of cement-based materials was treated with graphite carbon nitride-silica composite materials by the one-sided immersion and brushing methods for the study of photocatalytic performance. By comparing the degradation effect of Rhodamine B, it was found that the painting method is more suitable for the surface treatment of cement. In addition, through the reaction of calcium hydroxide and graphite carbon nitride-silica composite materials, it was found that the combination of graphite carbon nitride-silica composite materials and cement is through C-S-H gel.

1. Introduction

In recent years, with the continuous improvement of the level of economic development and industrialization, pollution has become more and more serious, and the environment has been greatly damaged and even threatens human health [1,2]. In order to counter these problems, photocatalytic technology has attracted widespread attention as one of the most promising methods for controlling environmental pollution [3,4,5,6]. As the most widely used civil engineering material, cement-based composite is widely used in the construction sector in various countries and regions. It has been suggested to combine photocatalytic technology with building materials [7,8,9,10]. Based on building materials, photocatalytic catalysts are easily excited by the energy of sunlight and can degrade surrounding pollutants [11,12,13]. So far, many efforts have been made to combine TiO2 photocatalysts with cement [14,15] to achieve photocatalytic degradation capabilities [16,17,18] and self-cleaning capabilities [19,20,21,22,23]. With the deepening of research, the emergence of some problems has also hindered the development of titanium dioxide photocatalytic cement [24,25]. First, TiO2 with a wide band gap (3.2 eV) cannot use visible light. Most of the energy of sunlight cannot be used by it, which causes energy to be wasted. Second, after the photocatalyst is coated on the cement surface, the binding between the catalyst and the cement is poor, which will cause the catalyst to fall off during use and thus reduce the photocatalytic efficiency. Therefore, a new type of visible light photocatalytic cement with a stable structure should be designed to solve the above problems.
As for the first problem, although there are a large number of methods reported to extend the spectral response range of photocatalysts [26,27,28], there have been few reports applied to cement materials so far. This may be due to their low activity and poor stability. However, the combination of cement and visible light photocatalysis technology will be an indispensable new requirement for the construction industry. Fortunately, graphite carbon nitride (g-C3N4) has been discovered as a stable visible light photocatalyst since 2008 [29]. Due to its narrow band gap (2.7 eV), g-C3N4 can make full use of visible light for photocatalytic water decomposition [30,31,32], organic matter degradation [33,34], and outdoor pollution control [35,36,37]. In contrast to traditional visible light photocatalysts, g-C3N4 is a polymer semiconductor similar to graphene and has good chemical and thermal stability [38,39].
Regarding the second problem, some scholars have prepared a SiO2/g-C3N4 [40] composite material by heating a mixture of SiO2 and melamine. The specific surface area of the obtained composite material increases, and the degree of aggregation of the graphite carbon nitride decreases. This can improve the catalyst’s adsorption of pollutants so that the SiO2/g-C3N4 composite has higher activity in the process of the photocatalytic degradation of pollutants. In addition, highly reactive nanosilica can react with cement to produce C-S-H gel. The functional layer and the cement matrix are combined by C-S-H gel [41]. This provides a way to counter the problem of bonding.
In this paper, by controlling the specific surface area and the additional amount of nanosilica, the optimal preparation conditions of graphite carbon nitride-silica composite materials are discussed. The effect of nanosilica on the modification of graphite carbon nitride is explored by XRD, TGA SEM, UV–Vis, and Brunauer–Emmett–Teller (BET) methods. Subsequently, the prepared graphite carbon nitride-silica composite material is used to treat the cement surface, and its photocatalytic ability is studied by degrading the dye under visible light. At the same time, the reaction mechanism of graphite carbon nitride-silica composite material and calcium hydroxide is explored.

2. Materials and Methods

2.1. Materials

Rhodamine B (RhB) and urea were purchased from Sinopharm Chemical Reagent Co. Ltd. (Shanghai, China) without any purification. RhB was prepared as a 10 mg/l solution for use. Nanosilica was purchased from Aladdin Reagent Co. Ltd. (Shanghai, China). Its specific surface areas are 200 and 300 m2/g, respectively. P.W 525 white cement was purchased from Shandong Shanshui Cement Co. Ltd. (Jinan, Shandong, China). Its density is 3.2 g/cm3. Distilled water obtained from a water purification system (Direct-Q® 3.5.8, Millipore Co. Ltd., Burlington, MA, USA).

2.2. Preparation of Graphite Carbon Nitride-Silica Composite Materials

First, 50 mL deionized water was added to a 100 mL crucible. Nanosilica with a specific surface area of 200 m2/g was then added to the crucible. The amount of nanosilica added was controlled to 0.05 g, 0.10 g, 0.15 g, and 0.20 g. The nanosilica solution was sonicated for 30 min by using an ultrasonic cell grinder. The purpose was to uniformly disperse the nanosilica in deionized water, and then 12 g urea was added to the crucible. After stirring for 30 s with a glass rod, the crucible was placed in an ultrasonic cleaning machine for 30 min for ultrasonic treatment, with the purpose to completely dissolve the urea. After the treatment, the crucible was dried in an oven at 70 °C. After drying, the crucible was taken out; the crucible mouth was covered with aluminum foil paper, and the crucible lid was covered. The crucible was placed in a muffle furnace and heated to 550 °C in an air atmosphere. The temperature increase rate was 5 °C/min, and the holding time was 2 h. The obtained graphite carbon nitride-silica composite material (g-C3N4-SiO2) was taken out from the crucible after natural cooling, and it could then be used after grinding. By adjusting the specific surface area of SiO2 to 300 m2/g, several other samples were prepared by the same method. It was named CS005-200, CS011-200, CS015-200, CS020-200, CS005-300, CS010-300 CS015-300, CS020-300 according to the amount and specific surface area of nanosilica.

2.3. Characterization of g-C3N4-SiO2

The crystal structure of the sample was determined by an X-ray diffractometer (XRD, D8 Advance, Bruker Co. Ltd., Karlsruhe, Ban-Württemberg, Germany). A thermal gravimetric analyzer (TGA/DSC 1, Mettler, Switzerland) was used to determine the sample composition. The field emission scanning electron microscope (QUANTA 250 FEG, FEI Co. Ltd., Hillsboro, OR, USA) was used to observe the micromorphology of the samples. Its acceleration voltage is 20 kV. The band gap was characterized by a UV–Vis DRS spectrum by an ultraviolet-visible spectrophotometer (U-4100 Hitachi Co. Ltd., Tokyo, Japan). The photocatalytic activity of g-C3N4-SiO2 was evaluated by the degradation of RhB (10 mg/l) under visible light in a photo reactor (Beijing Princes Co. Ltd., Beijing, China). The light source is a xenon lamp with a power of 350 W. The absorbance of RhB was measured by an ultraviolet-visible spectrophotometer (U-4100, Hitachi Co. Ltd., Tokyo, Japan). The degradation rate was calculated by dividing the absorbance of the sample by its original absorbance. The specific surface area was measured by the Brunauer–Emmett–Teller (BET) method using a specific surface area analysis tester (MFA-140 Beijing Peaudi Co. Ltd., Beijing, China).

2.4. Surface Treatment of Cement with g-C3N4-SiO2

Cement paste produced with white cement was made into a cube of 20 mm × 20 mm × 20 mm with a water–cement ratio of 0.35. The cement sample was placed in the curing room for 7 days. The g-C3N4-SiO2 was mixed with water to make a 1 mg/mL suspension. The photocatalyst was attached to the surface of cement by the one-sided immersion method and the brushing method. For the one-sided immersion method, the flank of cement was covered with adhesive tape, and the top surface was surrounded. The suspension was sucked by using a dropper, and it was evenly dropped to the top surface. For the brushing method, the dispersion liquid was dipped by using a brush and then repeatedly brushed onto the cement surface. The treated cement samples were placed in a dark curing cabinet for 7 days. The temperature was 25 °C. The humidity was 50%.

2.5. Evaluation of Visible Light Catalytic Performance of Photocatalytic Cement

The cement sample was taken out of the curing box. The RhB solution (10 mg/L) was sprayed evenly onto the treated surface. The sprayed cement was put in the dark for curing for 24 h. After the RhB solution on the surface of the sample was dried, it was taken out of the curing box. It was placed in the photocatalytic reactor and the test surface was aimed at the light source. Under the condition of visible light irradiation, the picture was taken every 30 min, and its color change was compared.

2.6. Exploration of the Binding Mechanism of Graphite Carbon Nitride-Silicon Dioxide Composite Materials and Cement

We added 60 ml of a saturated calcium hydroxide solution to the plastic bottle. Then, 0.15 g of CS015-300 was added to the solution. After stirring evenly, the pH value of the solution was measured with a pH test paper. The plastic bottle was sealed, and it was stirred at 1000 rpm on the magnetic stirrer for 7 days. After stirring, the resulting sample was taken out, and the pH of the solution was measured again. After the measurement was completed, the sample was dried in a vacuum drying oven, and then it was ground and tested.

3. Results and Discussion

3.1. Crystal Structure

In order to analyze the crystal structure of the synthesized of g-C3N4-SiO2, we characterized it with an X-ray diffractometer. Figure 1a is the XRD pattern of g-C3N4-SiO2 synthesized with SiO2 with a specific surface area of 200 m2/g. There is no obvious diffraction peak in the XRD pattern of SiO2, but there is a steamed bread around 2θ = 23°. The reason is that gas-phase nano-SiO2 is amorphous [42]. This is also the reason why there are only two diffraction peaks of 2θ = 12.9° and 2θ = 27.5° in the XRD pattern of the g-C3N4-SiO2. Here, 2θ = 12.9° and 2θ = 27.5° correspond to the (100) and (002) crystal planes of g-C3N4, respectively [43]. After the addition of SiO2, the intensity of the diffraction peak at 2θ = 12.9° is weaker than that of the single g-C3N4. With the increase of the amount of SiO2 added, the intensity of the diffraction peak showed a trend of gradually decreasing. The change law of the diffraction peak intensity at 2θ = 27.5° is consistent with the change law of the diffraction peak intensity at 2θ = 12.9°. This may be related to the decrease of the proportion of g-C3N4 when the amount of SiO2 in the sample is increased. Figure 1b is the XRD pattern of g-C3N4-SiO2 synthesized with SiO2 with a specific surface area of 300 m2/g. An analysis of the changes in the diffraction peaks of the two graphs reveals that they are basically the same as those shown in Figure 1a. Their rule is that there is no change in the position of the diffraction peak, and the intensity of the same diffraction peak decreases as the amount of SiO2 added increases. This can also be attributed to the reduction of graphite carbon nitride content in the sample. From a comprehensive analysis of Figure 1a and b, it can be concluded that the change in the specific surface area of SiO2 will not affect the crystal structure of the g-C3N4-SiO2.

3.2. Composition

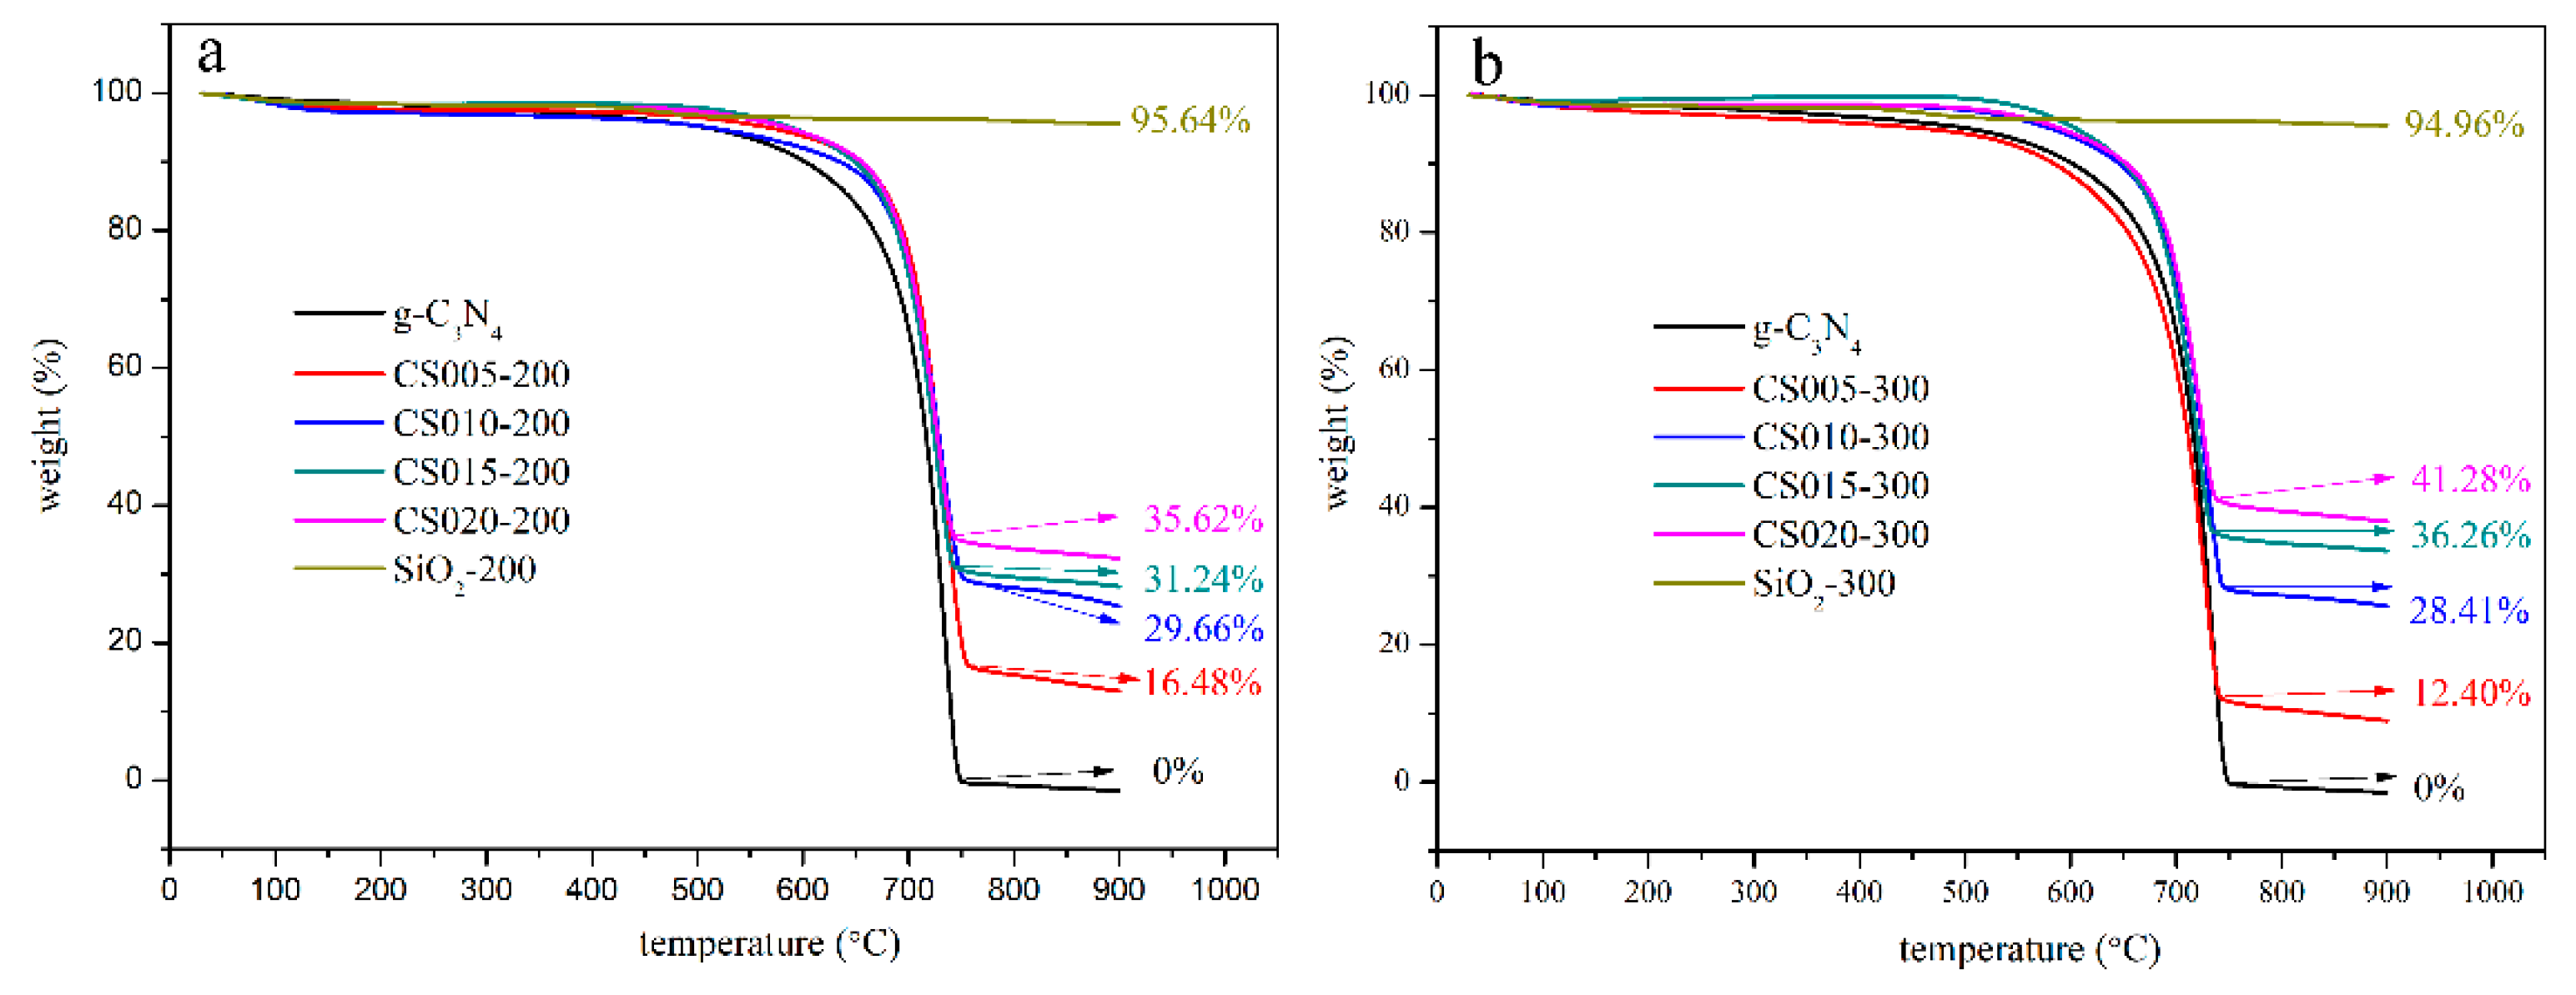
Figure 2 shows the TG curve of SiO2, g-C3N4 and g-C3N4-SiO2, CS005-200, CS010-200, CS015-200, CS020-200, CS005-300, CS010-300, CS015-300, CS020-300. Below 580 °C, the quality of g-C3N4 is basically unchanged. This shows that g-C3N4 has stable chemical properties below 580 °C. The reason is that the internal structure is an aromatic ring conjugated system connected by a covalent bond of carbon and nitrogen. On the other hand, g-C3N4 has a layered structure similar to graphite. The van der Waals force between layers is relatively strong [44]. From the beginning of 580 °C, as the temperature is increased, g-C3N4 is decomposed. The g-C3N4 is completely decomposed at 750 °C. At this time, the mass of g-C3N4 is 0. This corresponds to the position of the inflection point in the curve. SiO2 basically has no mass loss below 900 °C. It has excellent thermochemical stability below 900 °C [45]. According to the characteristics of g-C3N4 and SiO2 in the TG curve, we can determine the proportion of SiO2 in different samples according to the value of the inflection point in the curve. In CS005-200, the content of SiO2 is 16.48%. In CS010-200, the content of SiO2 is 29.66%. In CS015-200, the content of SiO2 is 31.24%. In CS020-200, the content of SiO2 is 35.62%. In CS005-300, the content of SiO2 is 12.40%. In CS010-300, the content of SiO2 is 28.41%. In CS015-300, the content of SiO2 is 36.26%. In CS020-300, the content of SiO2 is 41.28%.

3.3. Surface Morphology and Structure

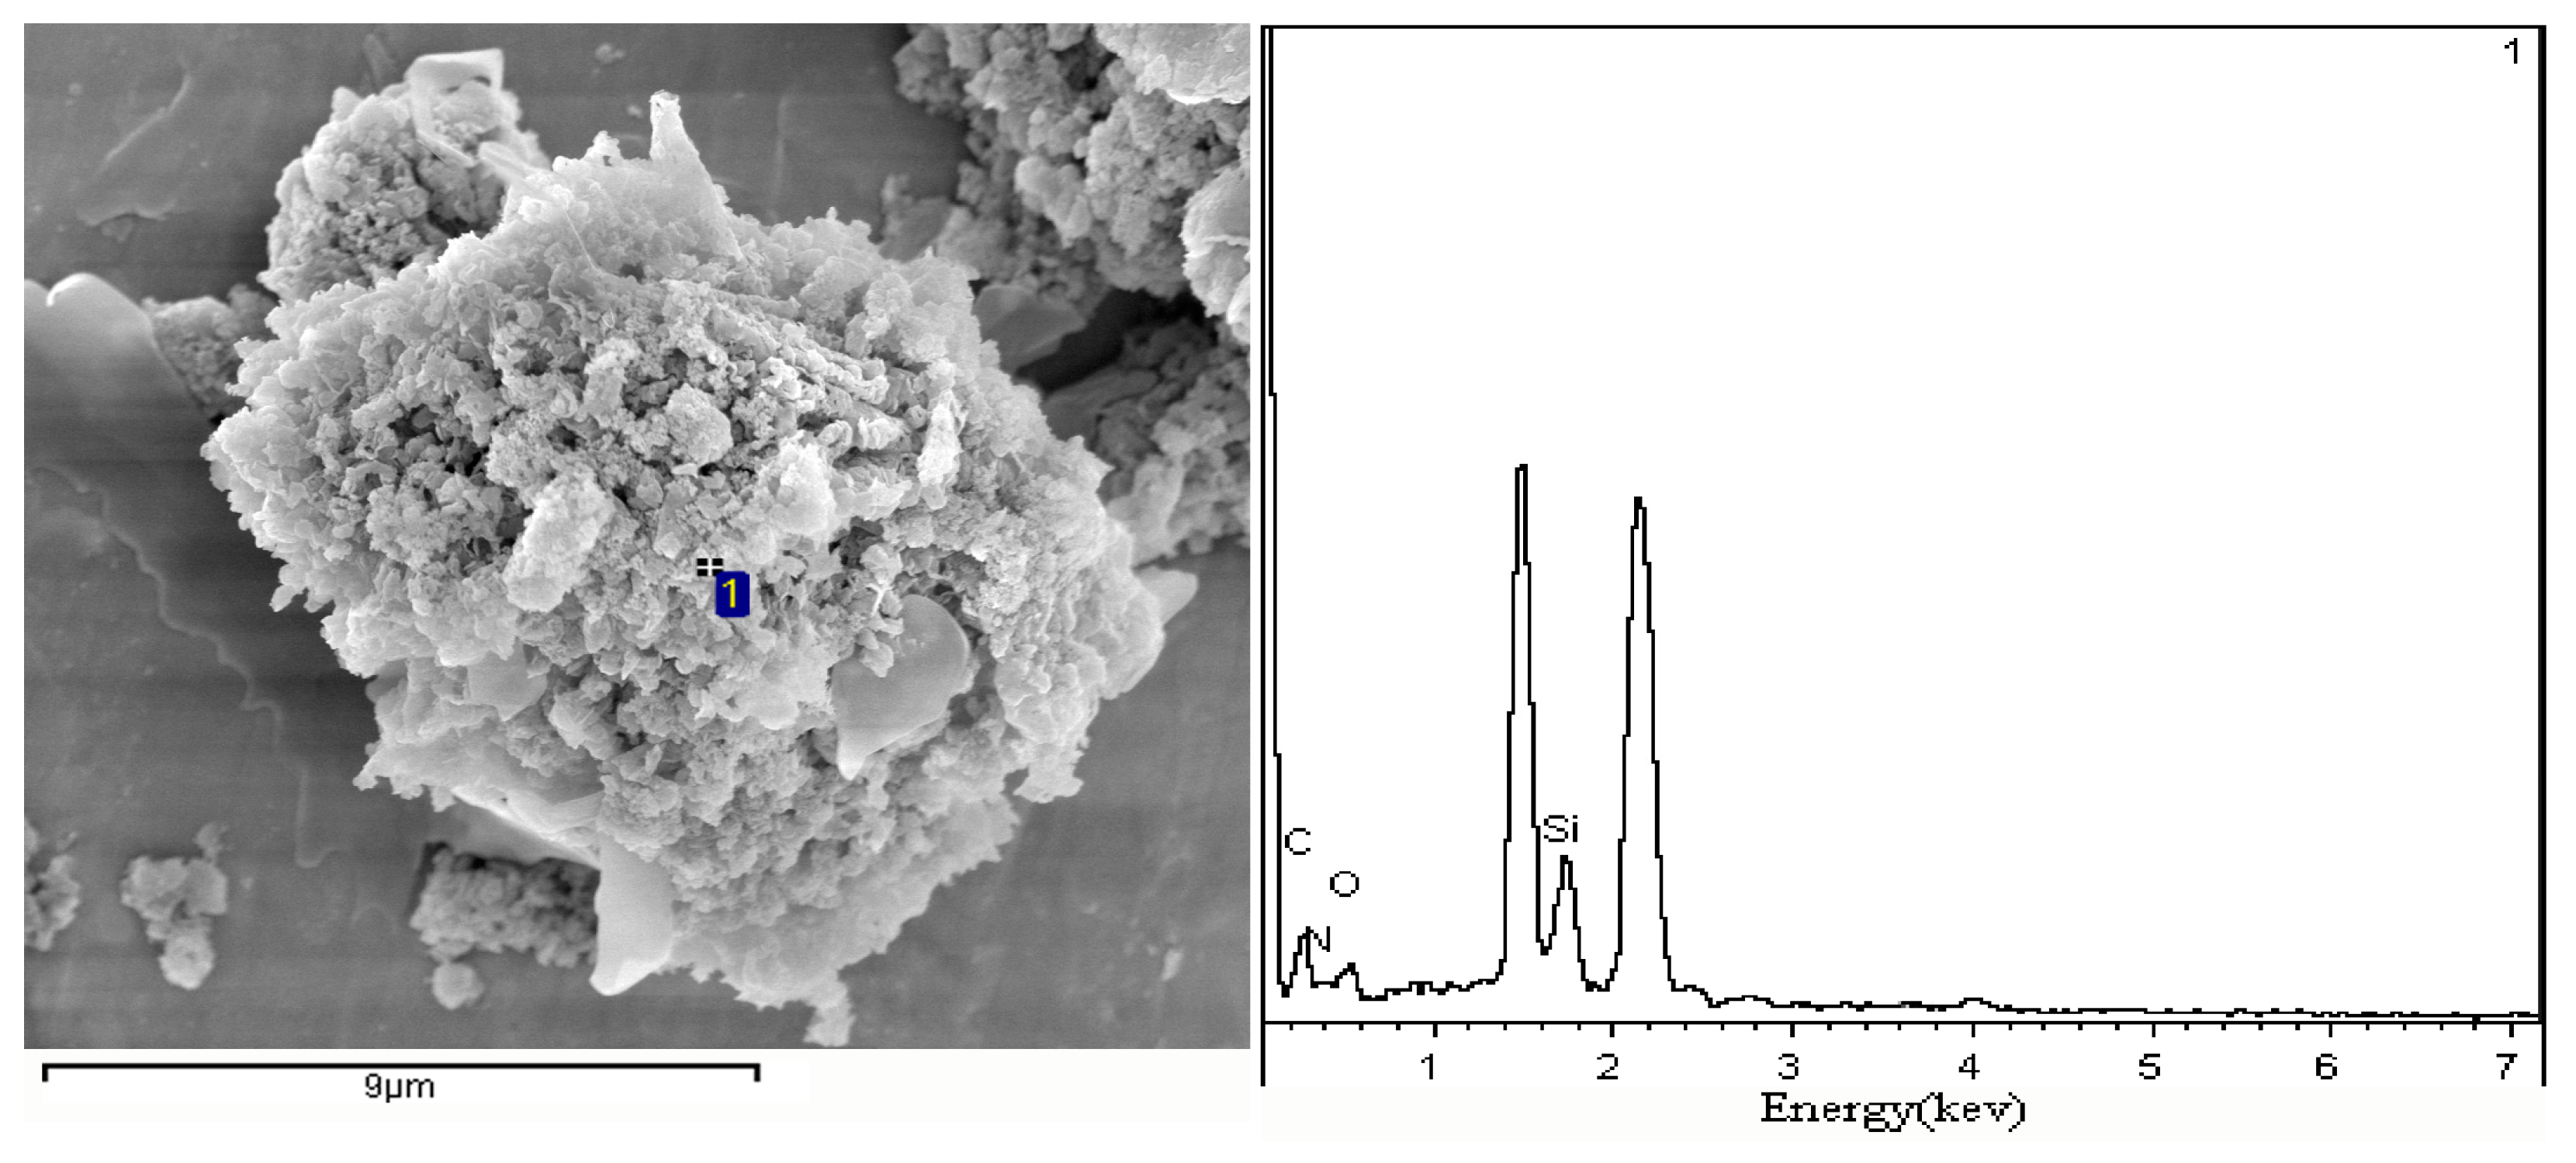
As shown in Figure 3, the structure of CS005-200 is a stacked layer. The spacing between the slices is very obvious; there are holes in the middle of the block. At the same time, there are a few spherical SiO2 particles in the middle of the block, which are attached to both sides of the part of the plate. Obviously, more spherical SiO2 particles were observed in CS010-200 than in CS005-200. The degree of stacking between the sheets becomes weak. The form is developed into a three-dimensional structure. There are more g-C3N4 flakes in the sample than spherical SiO2 particles, which leads to uneven distribution. The spherical SiO2 particles in CS015-200 are evenly embedded in the holes of the g-C3N4 sheet. In CS020-300, spherical SiO2 increased significantly, while g-C3N4 flakes decreased. The distribution of SiO2 and g-C3N4 is also uneven. As the SiO2 content increases, more SiO2 particles are introduced into the pores of the g-C3N4 flake. When the added amount reached 0.15 g, the SiO2 particles evenly entered the pores of the g-C3N4. At this time, the modification effect is the best. The amount of SiO2 continued to increase, and SiO2 was distributed on the surface. Moreover, the porosity in the sample is also reduced, which leads to a poor modification effect. The SEM changes of CS005-300, CS010-300, CS015-300, and CS020-300 are similar to those of the CS200 series. It should be noted that the holes in the CS300 series samples are smaller than those in the CS200 series. The increase in porosity will increase the specific surface area, thereby improving the photocatalytic activity. Therefore, when the specific surface area of SiO2 is 300 m2/g SiO2 and the addition amount is 0.15 g, the obtained g-C3N4-SiO2 has the best performance. The results of the EDS analysis are shown in Figure 4. CS015-300 contains four elements of C, N, Si, and O. Both C and N come from g-C3N4, while Si and O come from SiO2. This indicates that g-C3N4-SiO2 has been successfully synthesized.

3.4. Specific Surface Area and Porosity

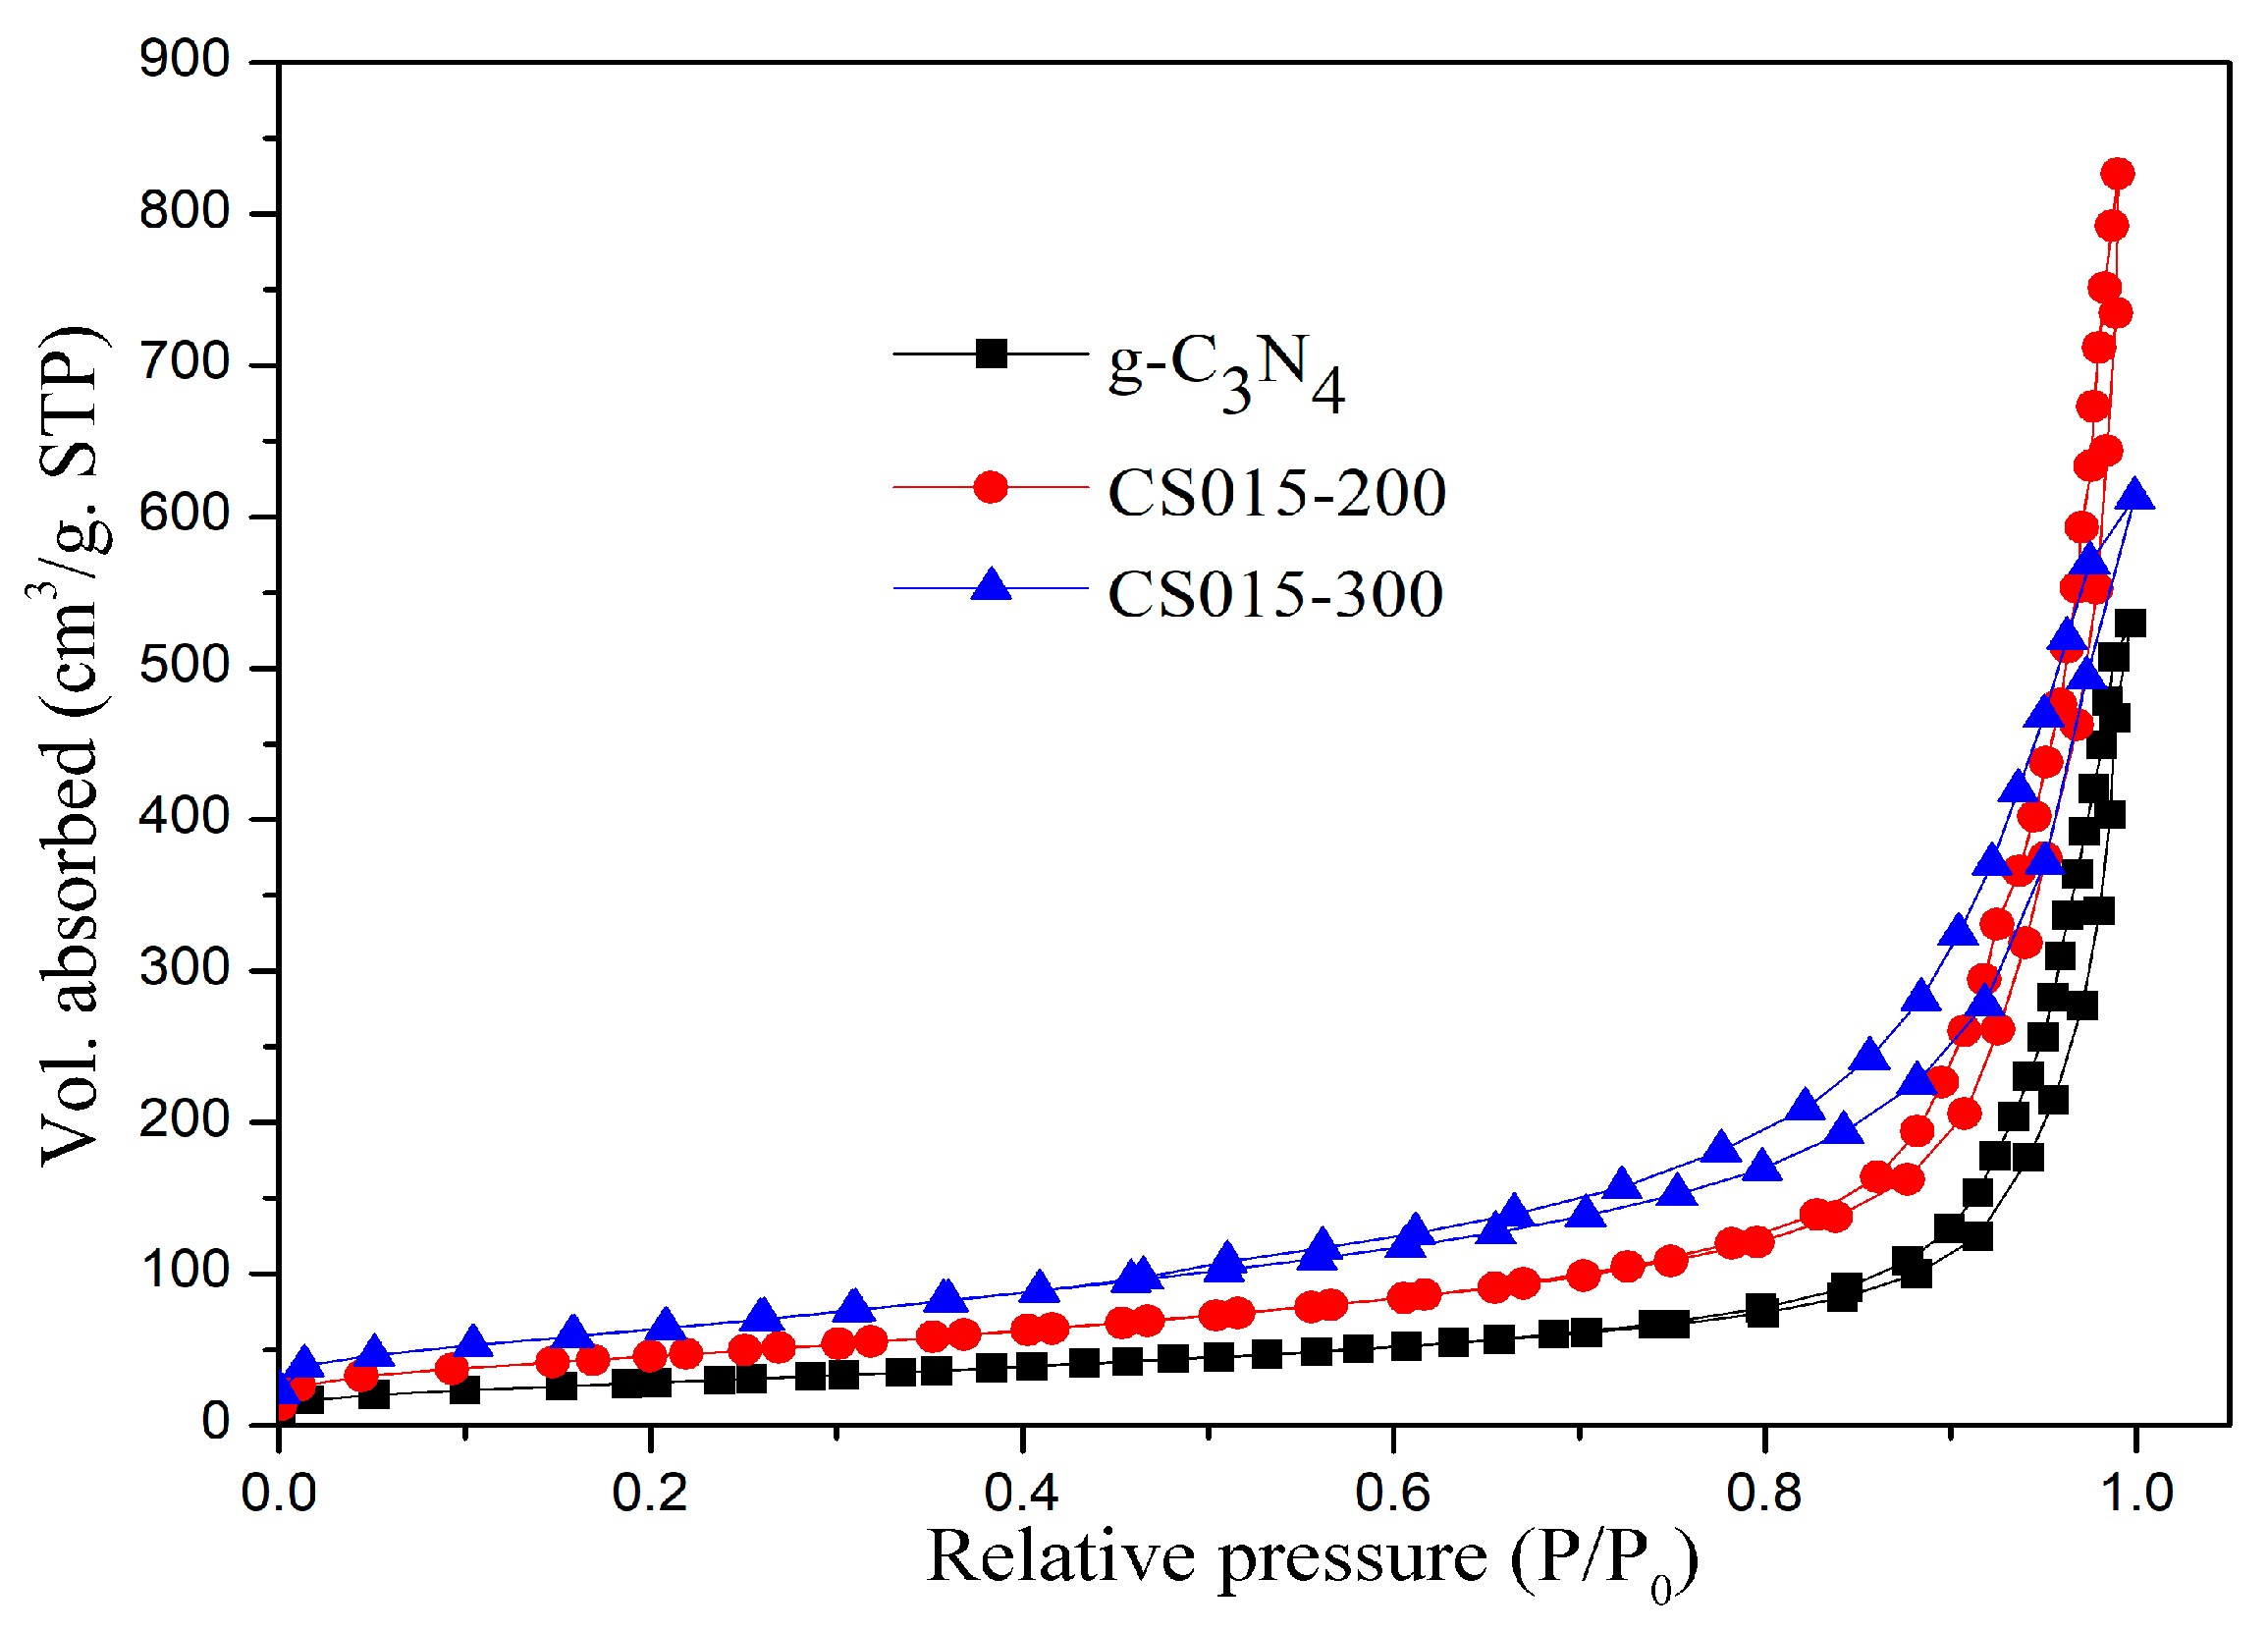
Figure 5 is the nitrogen adsorption and desorption isotherms of g-C3N4, CS015-200, and CS015-300. The specific surface area, the total pore volume and the average pore radius measured by the N2 adsorption-desorption experimental data and the BET model are listed in Table 1. The adsorption-desorption curves of g-C3N4 and CS015-300 indicate a type Π isotherm, which is the characteristic of microporous materials. It can be seen from Table 1 that after the addition of nano-SiO2, the specific surface area of the sample became larger, the total pore volume became smaller, and the average pore radius became smaller. The specific surface area of CS015-200 was increased by 61.68%, the total pore volume was expanded by 56.13%, and the average pore radius was reduced by 3.41%. The specific surface area of CS015-300 was increased by 126.35%, the total pore volume was expanded by 15.70%, and the average pore radius was reduced by 52.99%. The reason is that more pores were introduced with the addition of nano-SiO2, which caused the pore volume to be reduced and the pore size to become smaller. This caused the specific surface area to be increased. Although it was concluded from the previous analysis that the addition of SiO2 has little effect on the band structure of the sample, the specific surface area has greatly improved. As the specific surface area is increased, more active sites are provided [46]. This is conducive to the improvement of catalytic capacity.

3.5. Band Gap and Absorption Edge

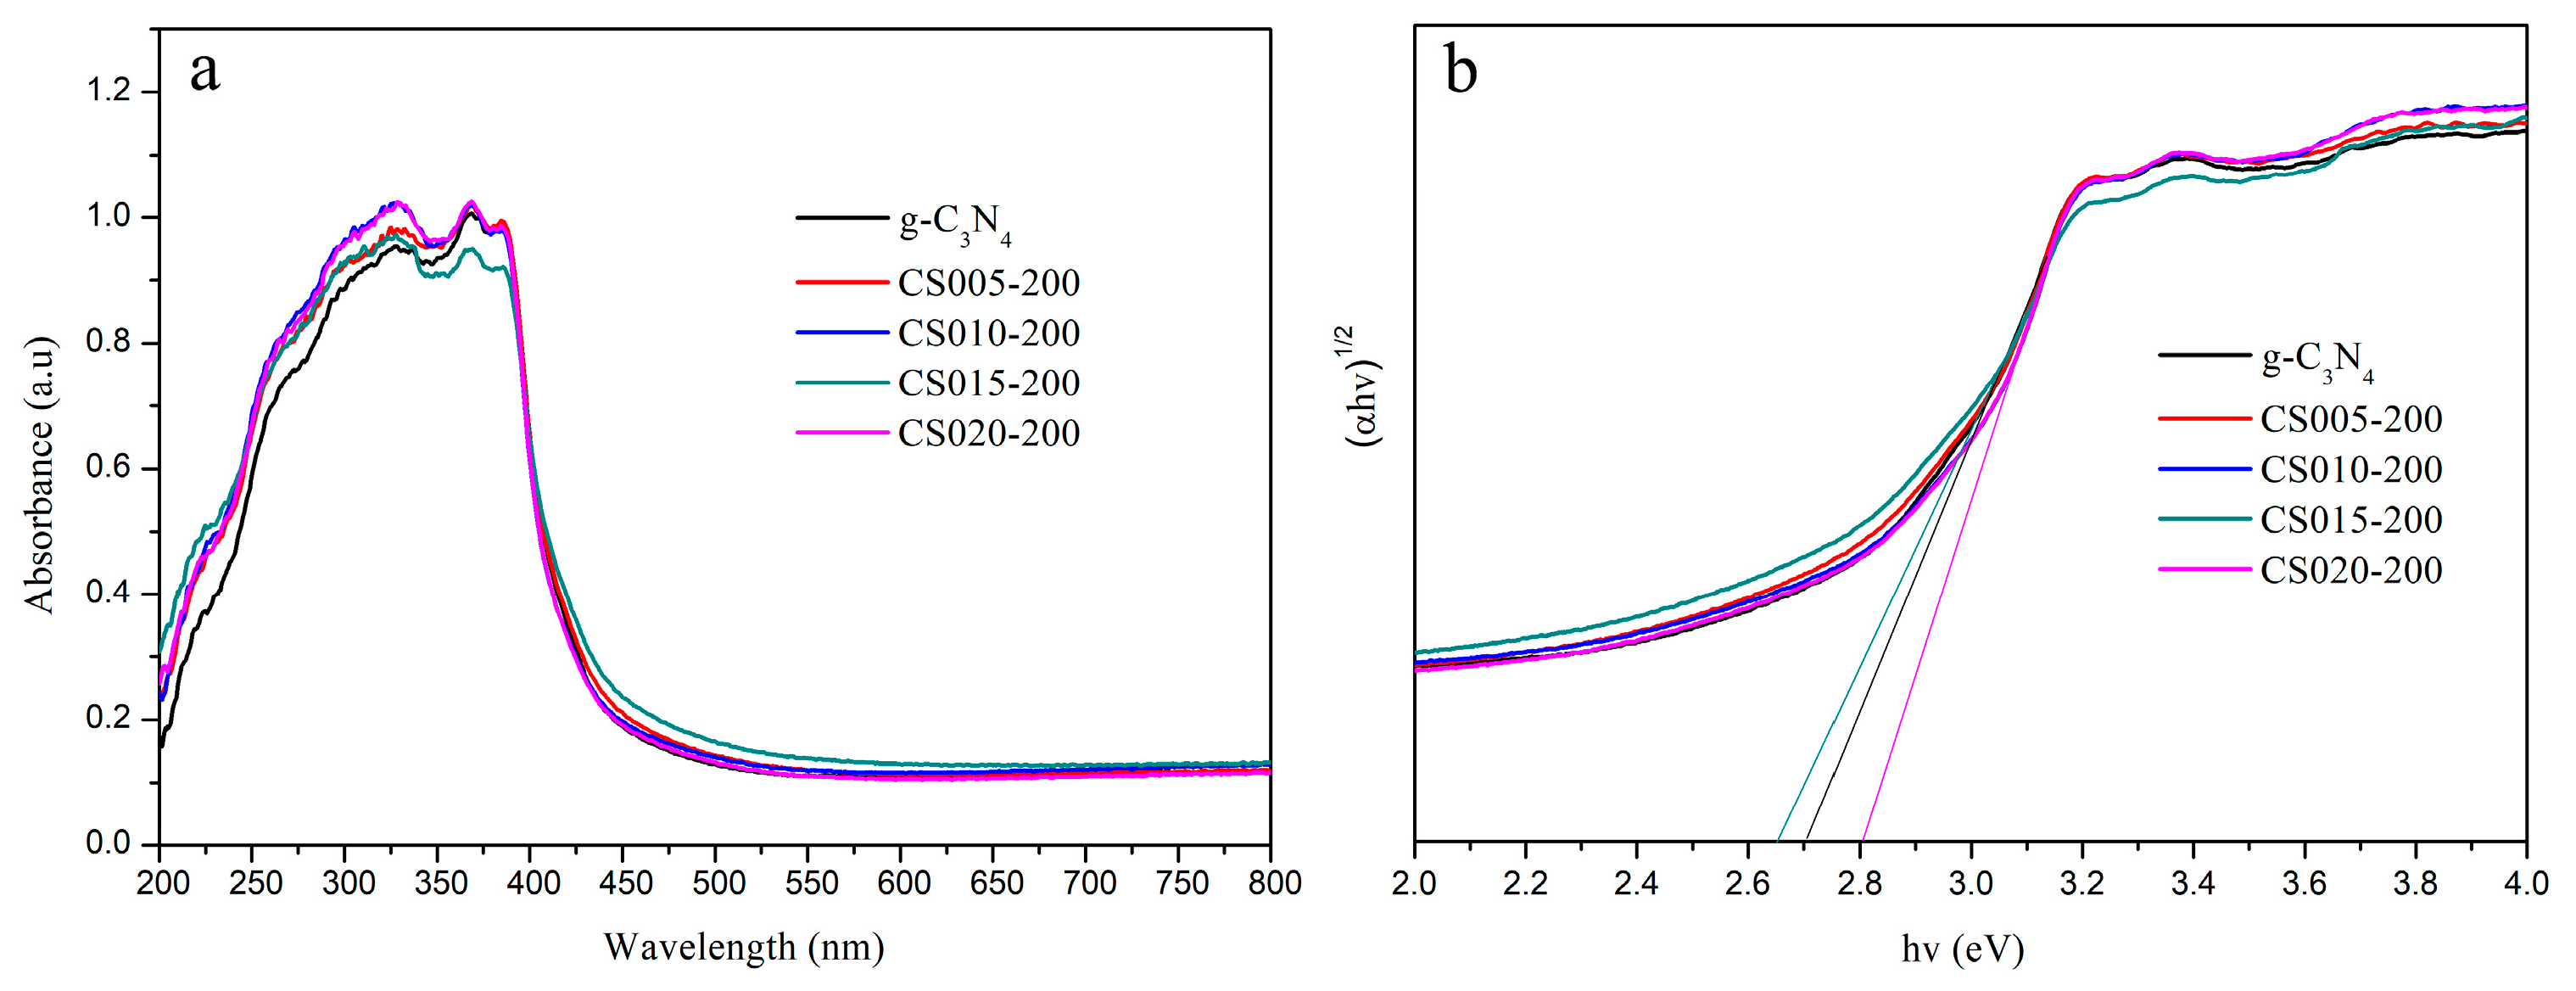
As can be seen from Figure 6a, the UV–Vis spectral curve of CS005-200 and of CS010-200 are similar to that of g-C3N4. The absorption edge does not move. The absorption edge of CS015-200 has a slight red shift. The UV–Vis spectrum of CS020-200 is different from that of the previous materials; its absorption edge has a slight blue shift. Their change rule is that the UV–Vis spectrum of the sample does not change when the amount of SiO2 is low. As the amount of SiO2 is increased, the absorption edge of the sample is red-shifted, but the degree of shift is not large. As the amount of SiO2 is continuously increased, the absorption edge of the sample has a blue shift. This shows that the low additional amount of SiO2 will not affect the visible light absorption range. The addition of SiO2 will expand the visible light absorption range of the sample under the appropriate addition amount. However, when the blending amount is too large, the negative effect will appear. From Figure 6b, we can find that the width of the band gap of CS005-200 and CS010-200 is the same as that of g-C3N4, both of which are 2.7 eV. The width of the forbidden band of CS015-200 was reduced to 2.65 eV, and the absorption edge was increased to 471 nm. The band gap of CS020-200 was expanded to 2.8 eV, and the absorption edge was reduced to 468 nm. The variation law of the band gap of each sample is the same as that of its corresponding ultraviolet-visible diffuse reflection spectrum.
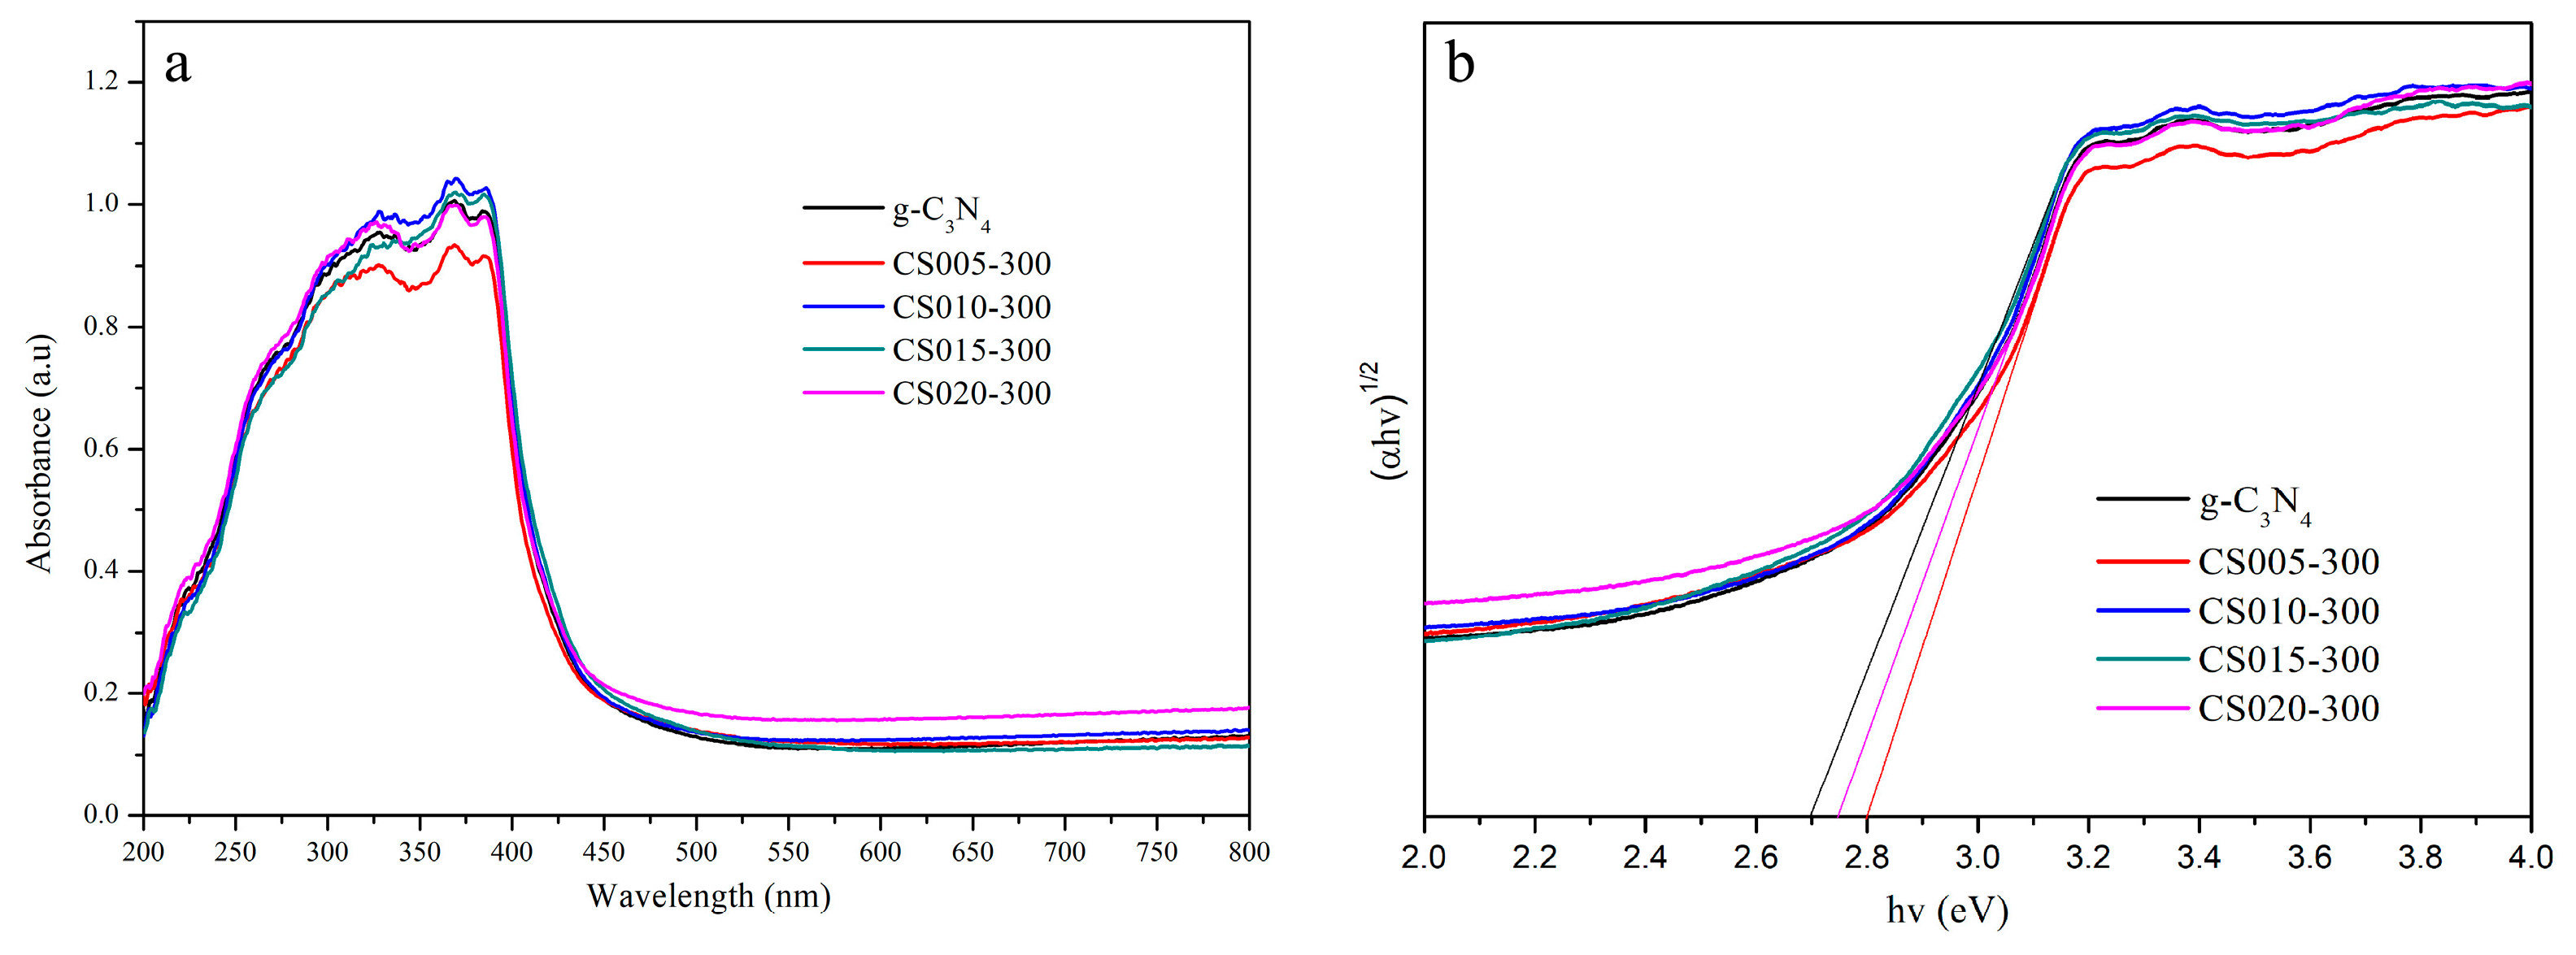
The UV–Vis spectrum of the g-C3N4-SiO2 prepared with SiO2 with a specific surface area of 300 m2/g is shown in Figure 7a. The absorption edge of the sample changed. The absorption edge of CS005-300 and CS020-300 has a slight blue shift compared to g-C3N4. The movement of CS005-300 was slightly larger than that of CS020-300. The curve of CS010-300 coincides with the curve of g-C3N4, and the absorption edge did not change. A slight red shift occurred in the absorption edge of CS015-300. The difference with the graphite carbon nitride-silica (SBET = 200 m2/g) composite material is that the absorption edge of the sample had a blue shift at lower dosing levels and too much doping. The corresponding absorption of visible light was also reduced. From Figure 7b, it can be found that the band gap of CS005-300 expanded to 2.8 eV, and the absorption edge was reduced to 442 nm. The band gaps of CS010-300 and CS015-300 were reduced to 2.68 eV, and the absorption edge expanded to 462 nm. The band gap of CS020-300 expanded to 2.75 eV, and the absorption edge was reduced to 451 nm. The band gap of g-C3N4 is still 2.7 eV. The absorption edge is 460 nm. Because the added SiO2 is amorphous, the changes in the band gap and the absorption edge of g-C3N4-SiO2 were very slight. The change in band gap is due to the quantum size effect of the smaller size g-C3N4 generated on the surface of nano-SiO2 [47].

3.6. Photocatalytic Evaluation

As shown in Figure 8a, RhB is not degraded without adding a catalyst. After 1 h of dark treatment, g-C3N4 has the same dye adsorption rate as the other four samples, which is about 27%. With the extension of visible light exposure time, the absorbance of the dye is gradually reduced, and the dye is continuously degraded. The minimum degradation time of CS015-200 is 55 min. Secondly, the degradation time of CS005-200 is 60 min. Thirdly, the degradation time of CS010-200 is 70 min. Fourthly, the degradation time of g-C3N4 is 75 min. The maximum degradation time of CS020-200 is 90 min. The catalytic performance from strong to weak is ranked as CS015-200, CS005-200, CS010-200, g-C3N4, CS020-200. The reason for the reduced efficiency of CS020-200 may be related to the reduced visible light absorption range caused by the reduction of the absorption edge. Among all the samples, the improvement of the CS015-200 is the most obvious, and the performance has improved by 26.67% compared with the g-C3N4.
From Figure 8b, it can be concluded that the largest k value of CS015-200 is 0.067. Secondly, the k value of CS010-200 is 0.052. Thirdly, the k value of CS005-200 is 0.048. Fourthly, the k value of g-C3N4 is 0.033. The minimum k value of CS020-200 is 0.025. After silica is added, the k value of each sample is changed to varying degrees. CS015-200 is 103.03% higher than g-C3N4. CS010-200 is 57.57% higher than g-C3N4. CS005-200 is 45.45% higher than g-C3N4, and CS020-200 is 24.24% lower than g-C3N4. The performance of CS015-200 is the best among all the samples in the picture.
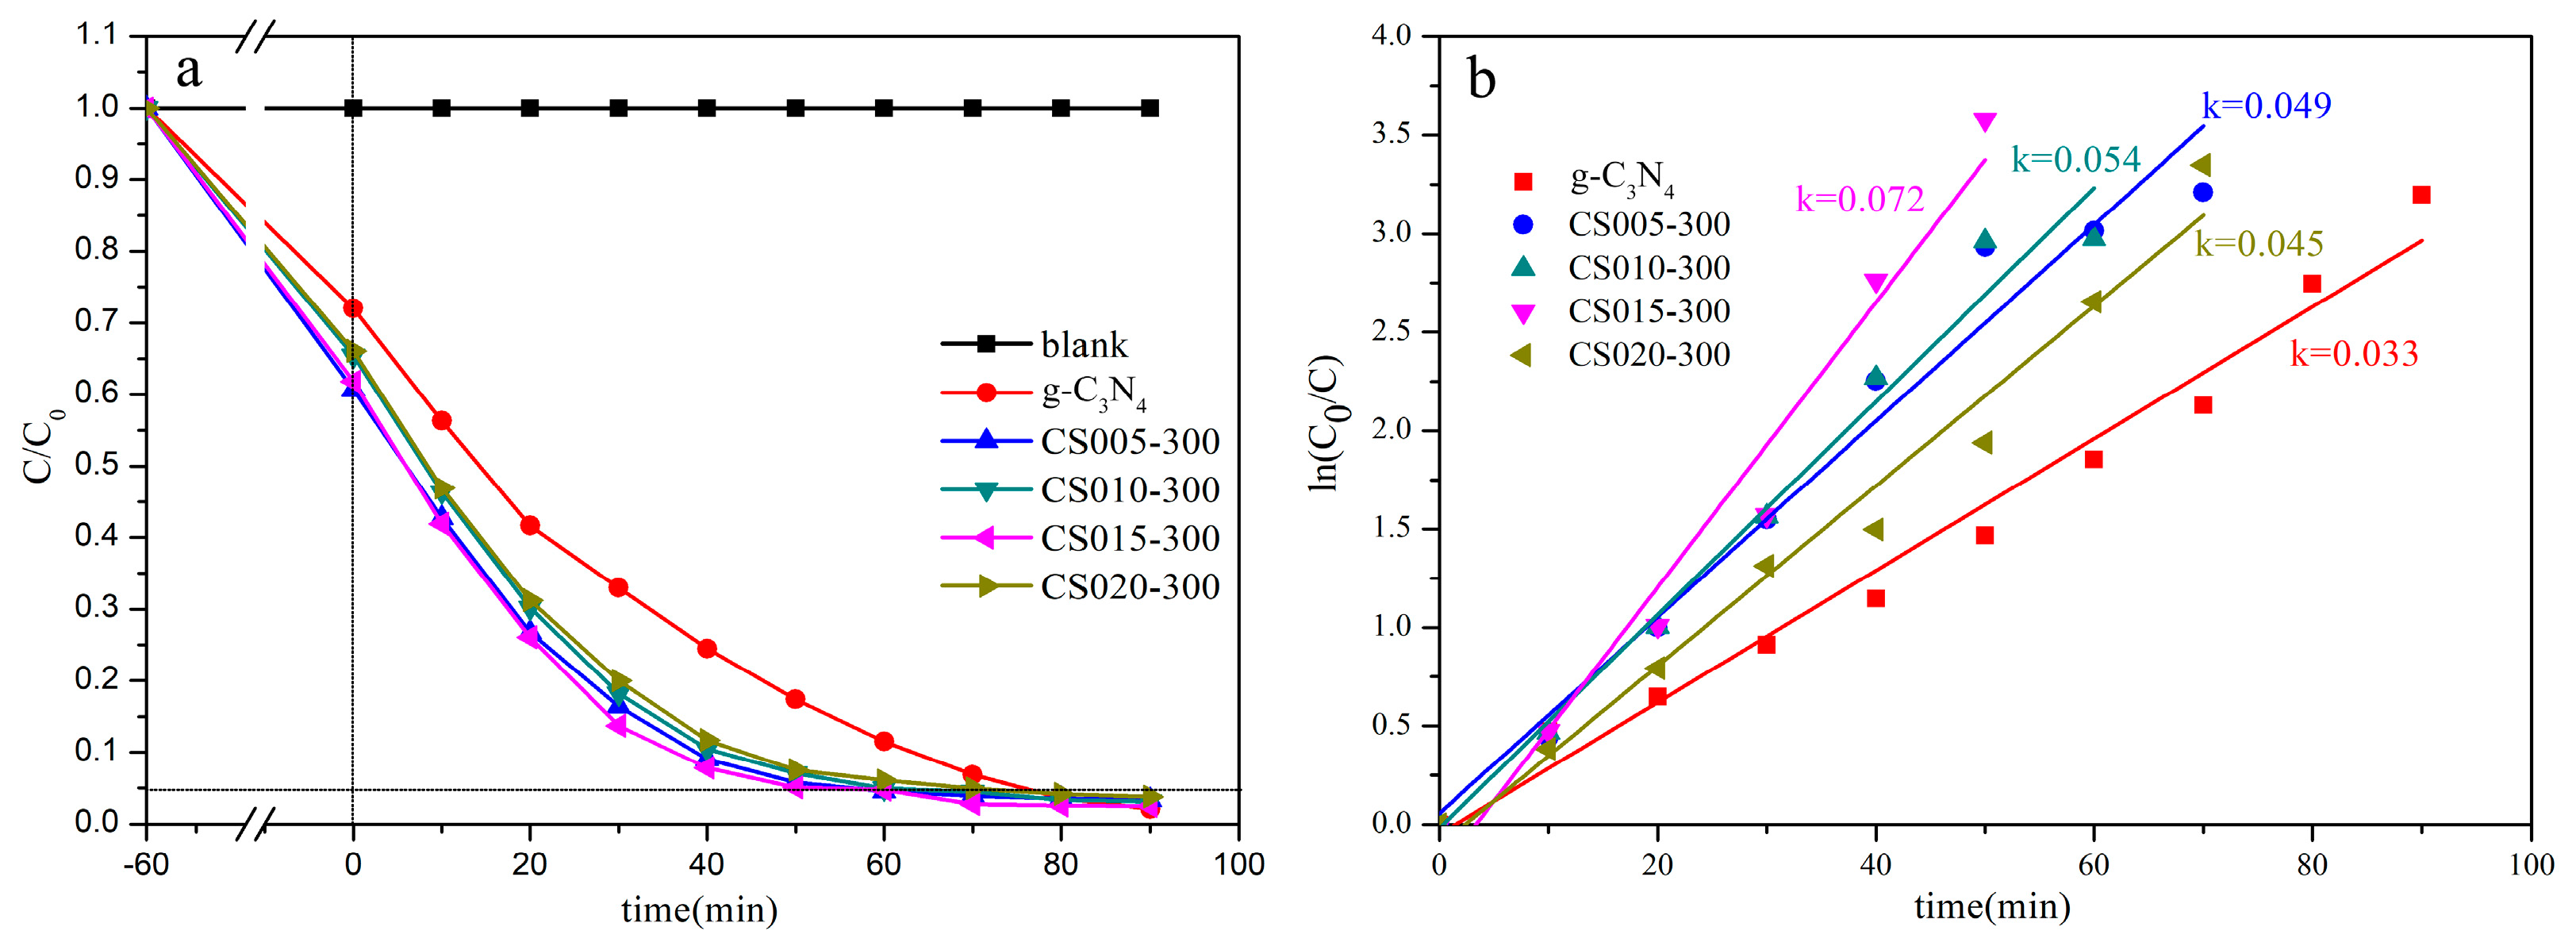
As shown in Figure 9a, after 1 h of dark treatment, different samples have different adsorption rates for dyes. The adsorption rate of composite materials is higher than that of the single g-C3N4, and the adsorption rate of g-C3N4 is about 27%. The adsorption rate of CS010-300 and CS020-300 is about 33%. The adsorption rate of CS005-300 and CS015-300 is about 39%. The minimum degradation time of CS015-300 is 50 min. Secondly, the degradation time of CS005-300 and CS010-300 is 60 min. Thirdly, the degradation time of CS0020-300 is 70 min. The maximum degradation time of g-C3N4 is 75 min. The catalytic performance from strong to weak is ranked as CS015-300, CS005-300 (CS010-300), CS0020-300, g-C3N4. Compared with g-C3N4, the visible light catalytic ability of each sample has improved. This shows that the visible light catalytic ability of the sample is increased with the addition of SiO2 with a specific surface area of 300 m2/g.
From Figure 9b, the maximum k value of CS015-300 is 0.072. Secondly, the k value of CS010-300 is 0.054. Thirdly, the k value of CS010-300 is 0.049. Fourthly, the k value of CS020-300 is 0.045. The minimum k value of g-C3N4 is 0.033. The difference from Figure 9 is that after adding nanosilica with a specific surface area of 300 m2/g, the k value of all samples has improved. CS015-300 is 118.18% higher than g-C3N4. CS010-200 is 63.63% higher than g-C3N4. CS005-200 is 48.48% higher than g-C3N4. CS020-200 is 36.36% higher than g-C3N4. The performance of CS015-300 is the best among all the samples in the picture.
By comparing the degradation rate constants of the two types of samples, we find that the g-C3N4-SiO2 prepared using SiO2 with a specific surface area of 300 m2/g has the best visible light catalytic performance. When the same amount is added, the degradation rate constant is always higher than that of g-C3N4-SiO2 prepared with SiO2 with a specific surface area of 200 m2/g. In addition, the degradation rate constant of heterogeneous graphite carbon nitride-silica prepared with SiO2 with a specific surface area of 300 m2/g is higher than that of g-C3N4. The phenomenon of reduced catalytic performance did not occur.

3.7. Surface Treatment Evaluation

As can be seen from Figure 10, the catalyst distribution on the surface of the cement material treated by the one-sided immersion method is uneven, and the thickness of the coating is different. The color in the middle of the sample is obviously lighter than the color at the edge of the sample. This shows that there are more catalysts on the cement edge than in the middle. Cracking and shedding of the coating appear on the edge of the cement block. The reason is that the solution was dripping onto the cement surface, and the liquid level is affected by the surface tension; it appears to be high in the surroundings and low in the middle [48]. As the water evaporated, the water in the middle disappeared firstly and then gradually spread to the surroundings. This caused the surrounding coating to be too thick, which caused cracking and shedding. The color distribution of the surface of the cement material treated was relatively uniform by the brushing method, which indicates that the distribution of the catalyst was relatively uniform. There is no cracking and shedding of the catalyst on the cement surface, which indicates that the catalyst did not appear on the cement surface. The reason is that the brush dipped in less solution during the application process, and when applied to the cement surface, the surface tension is less affected. At the same time, the catalyst is further uniformly dispersed in the process of the repeated three times of brushing, thereby avoiding cracking and shedding caused by the aggregation of the catalyst.

3.8. Performance Evaluation of Photocatalytic Cement

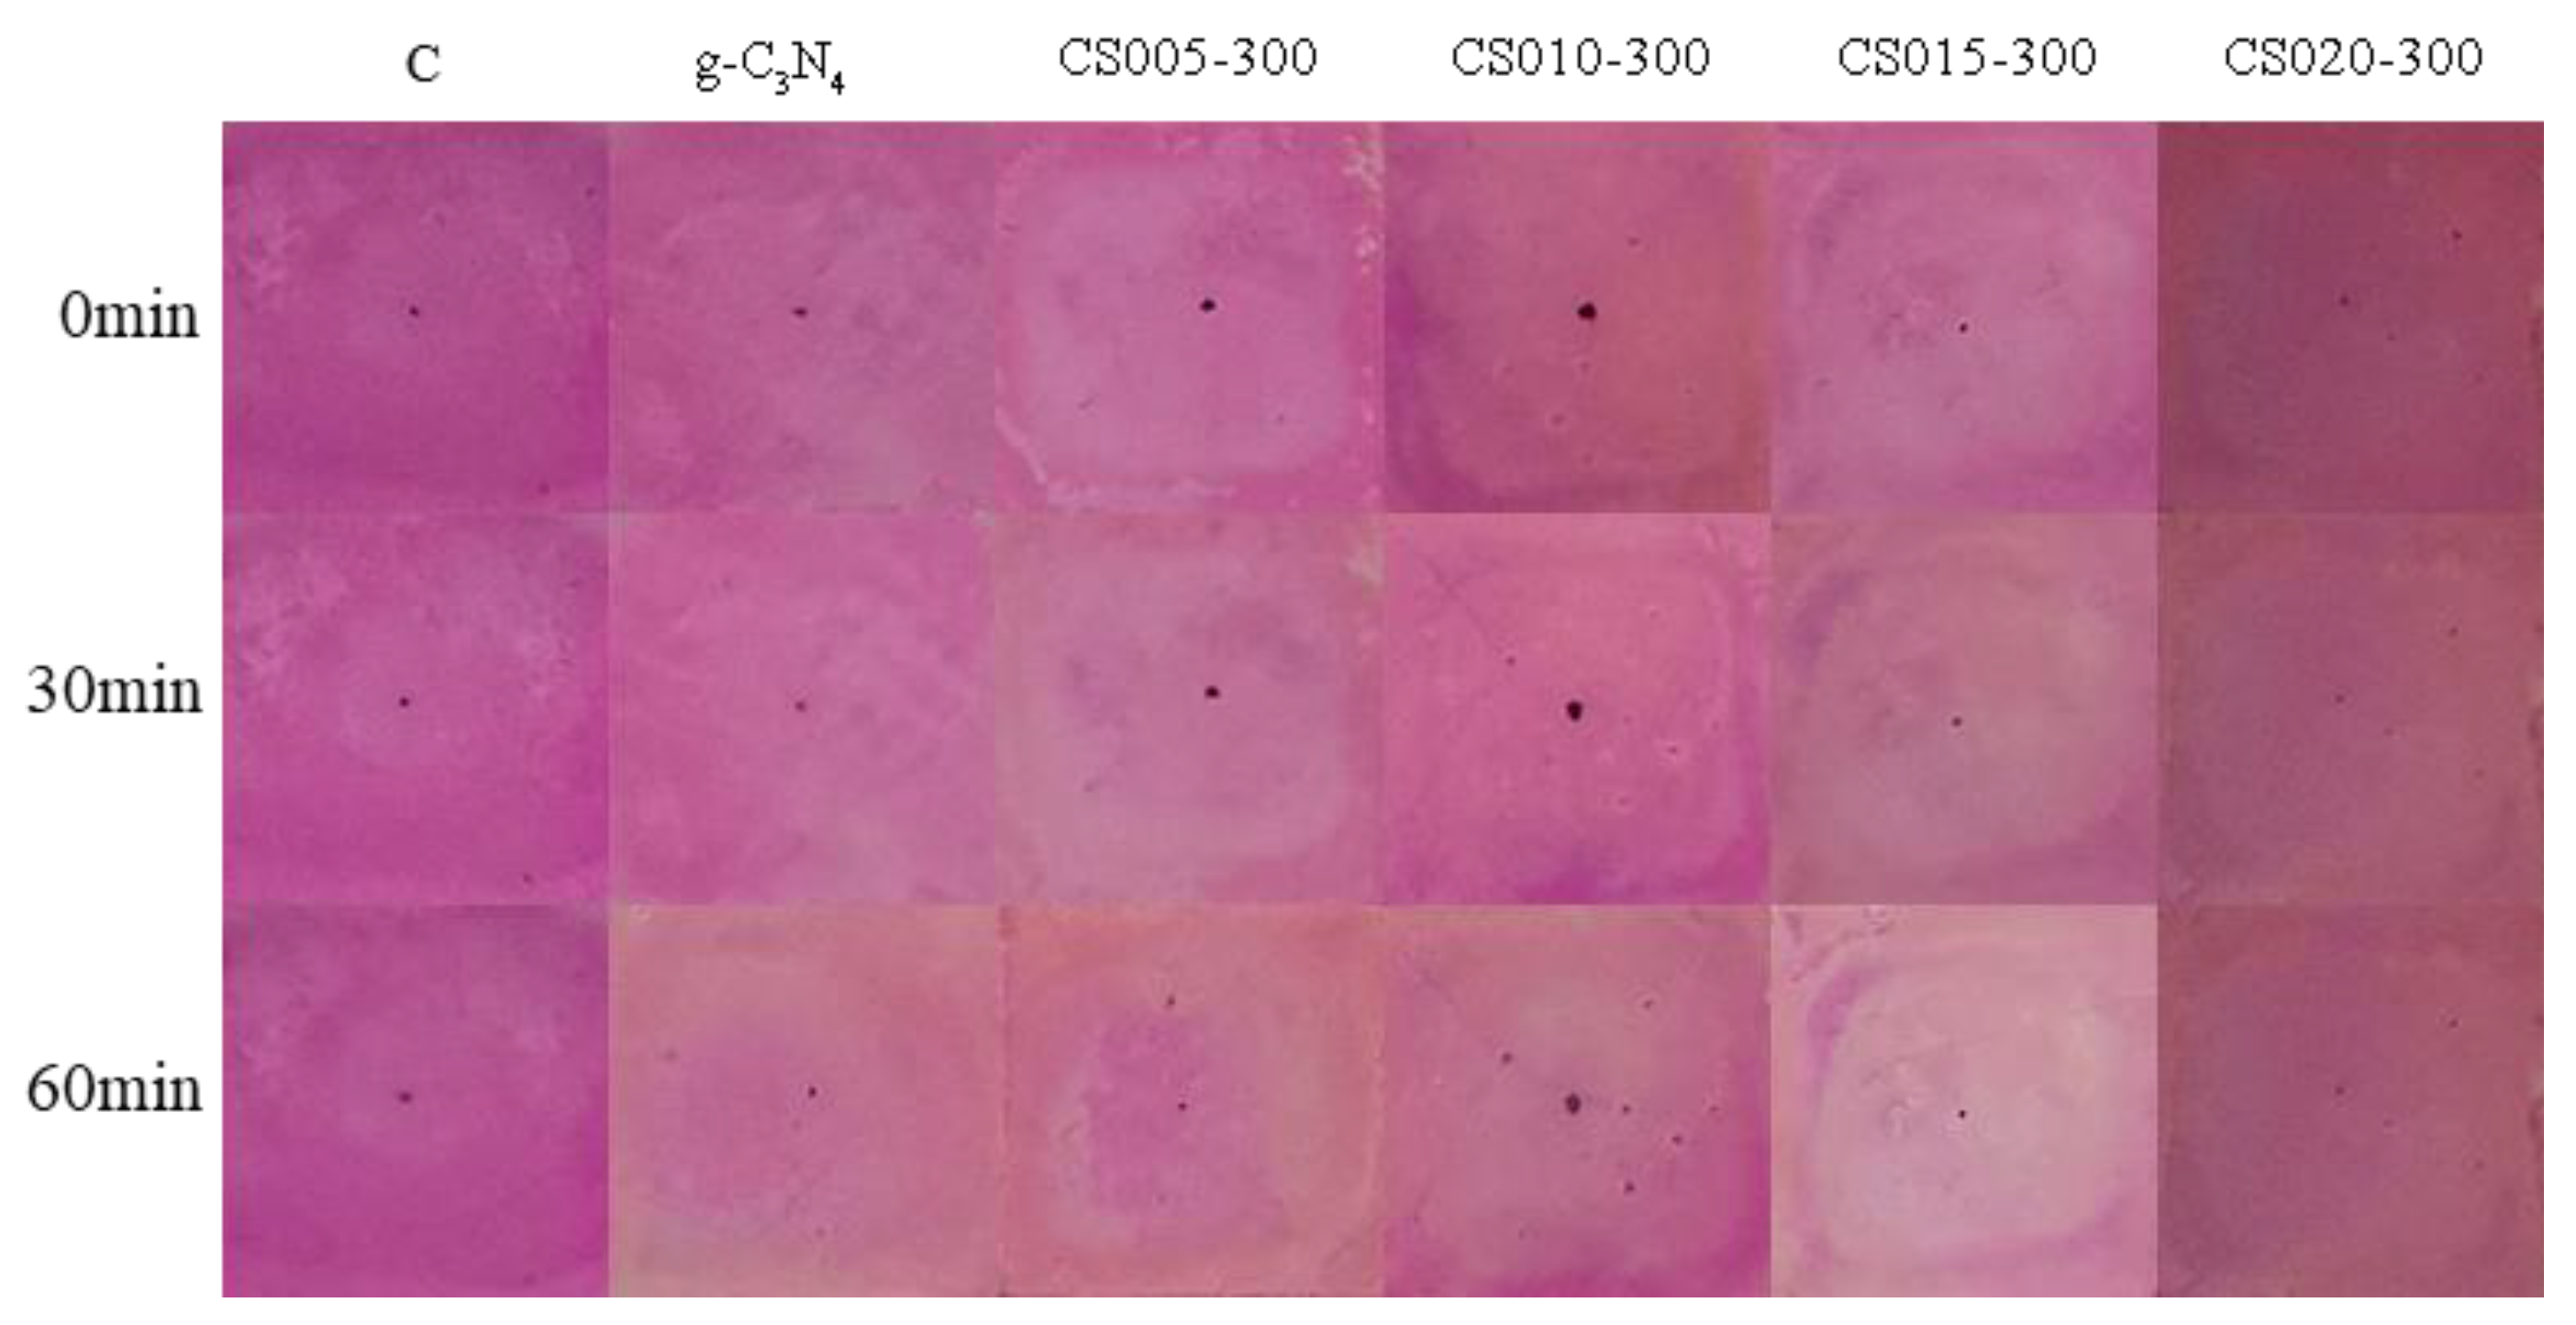
Figure 11 is the color change of RhB after the photocatalytic cement prepared by the one-sided immersion method was exposed to visible light. As shown in Figure 11, comparing the photos of the cement under visible light irradiation, it was found that with the increase of light time, the color of the surface without surface treatment is basically unchanged, but the color of all surface-treated samples was lightened to varying degrees. This shows that the cement had a self-cleaning function after surface treatment. The reason is that the catalyst on the cement surface captures the pollutants, and the dye was degraded under the irradiation of visible light. However, the self-cleaning efficiency of cement materials treated with different catalysts varies. After 60 min of irradiation, the degree of discoloration is ranked as CS015-300, CS010-300, CS005-300, CS020-300, g-C3N4 in order from large to small. This is consistent with the rule of g-C3N4-SiO2 degrading RhB in solution. This shows that the performance of the catalyst did not change after being applied to the cement surface.
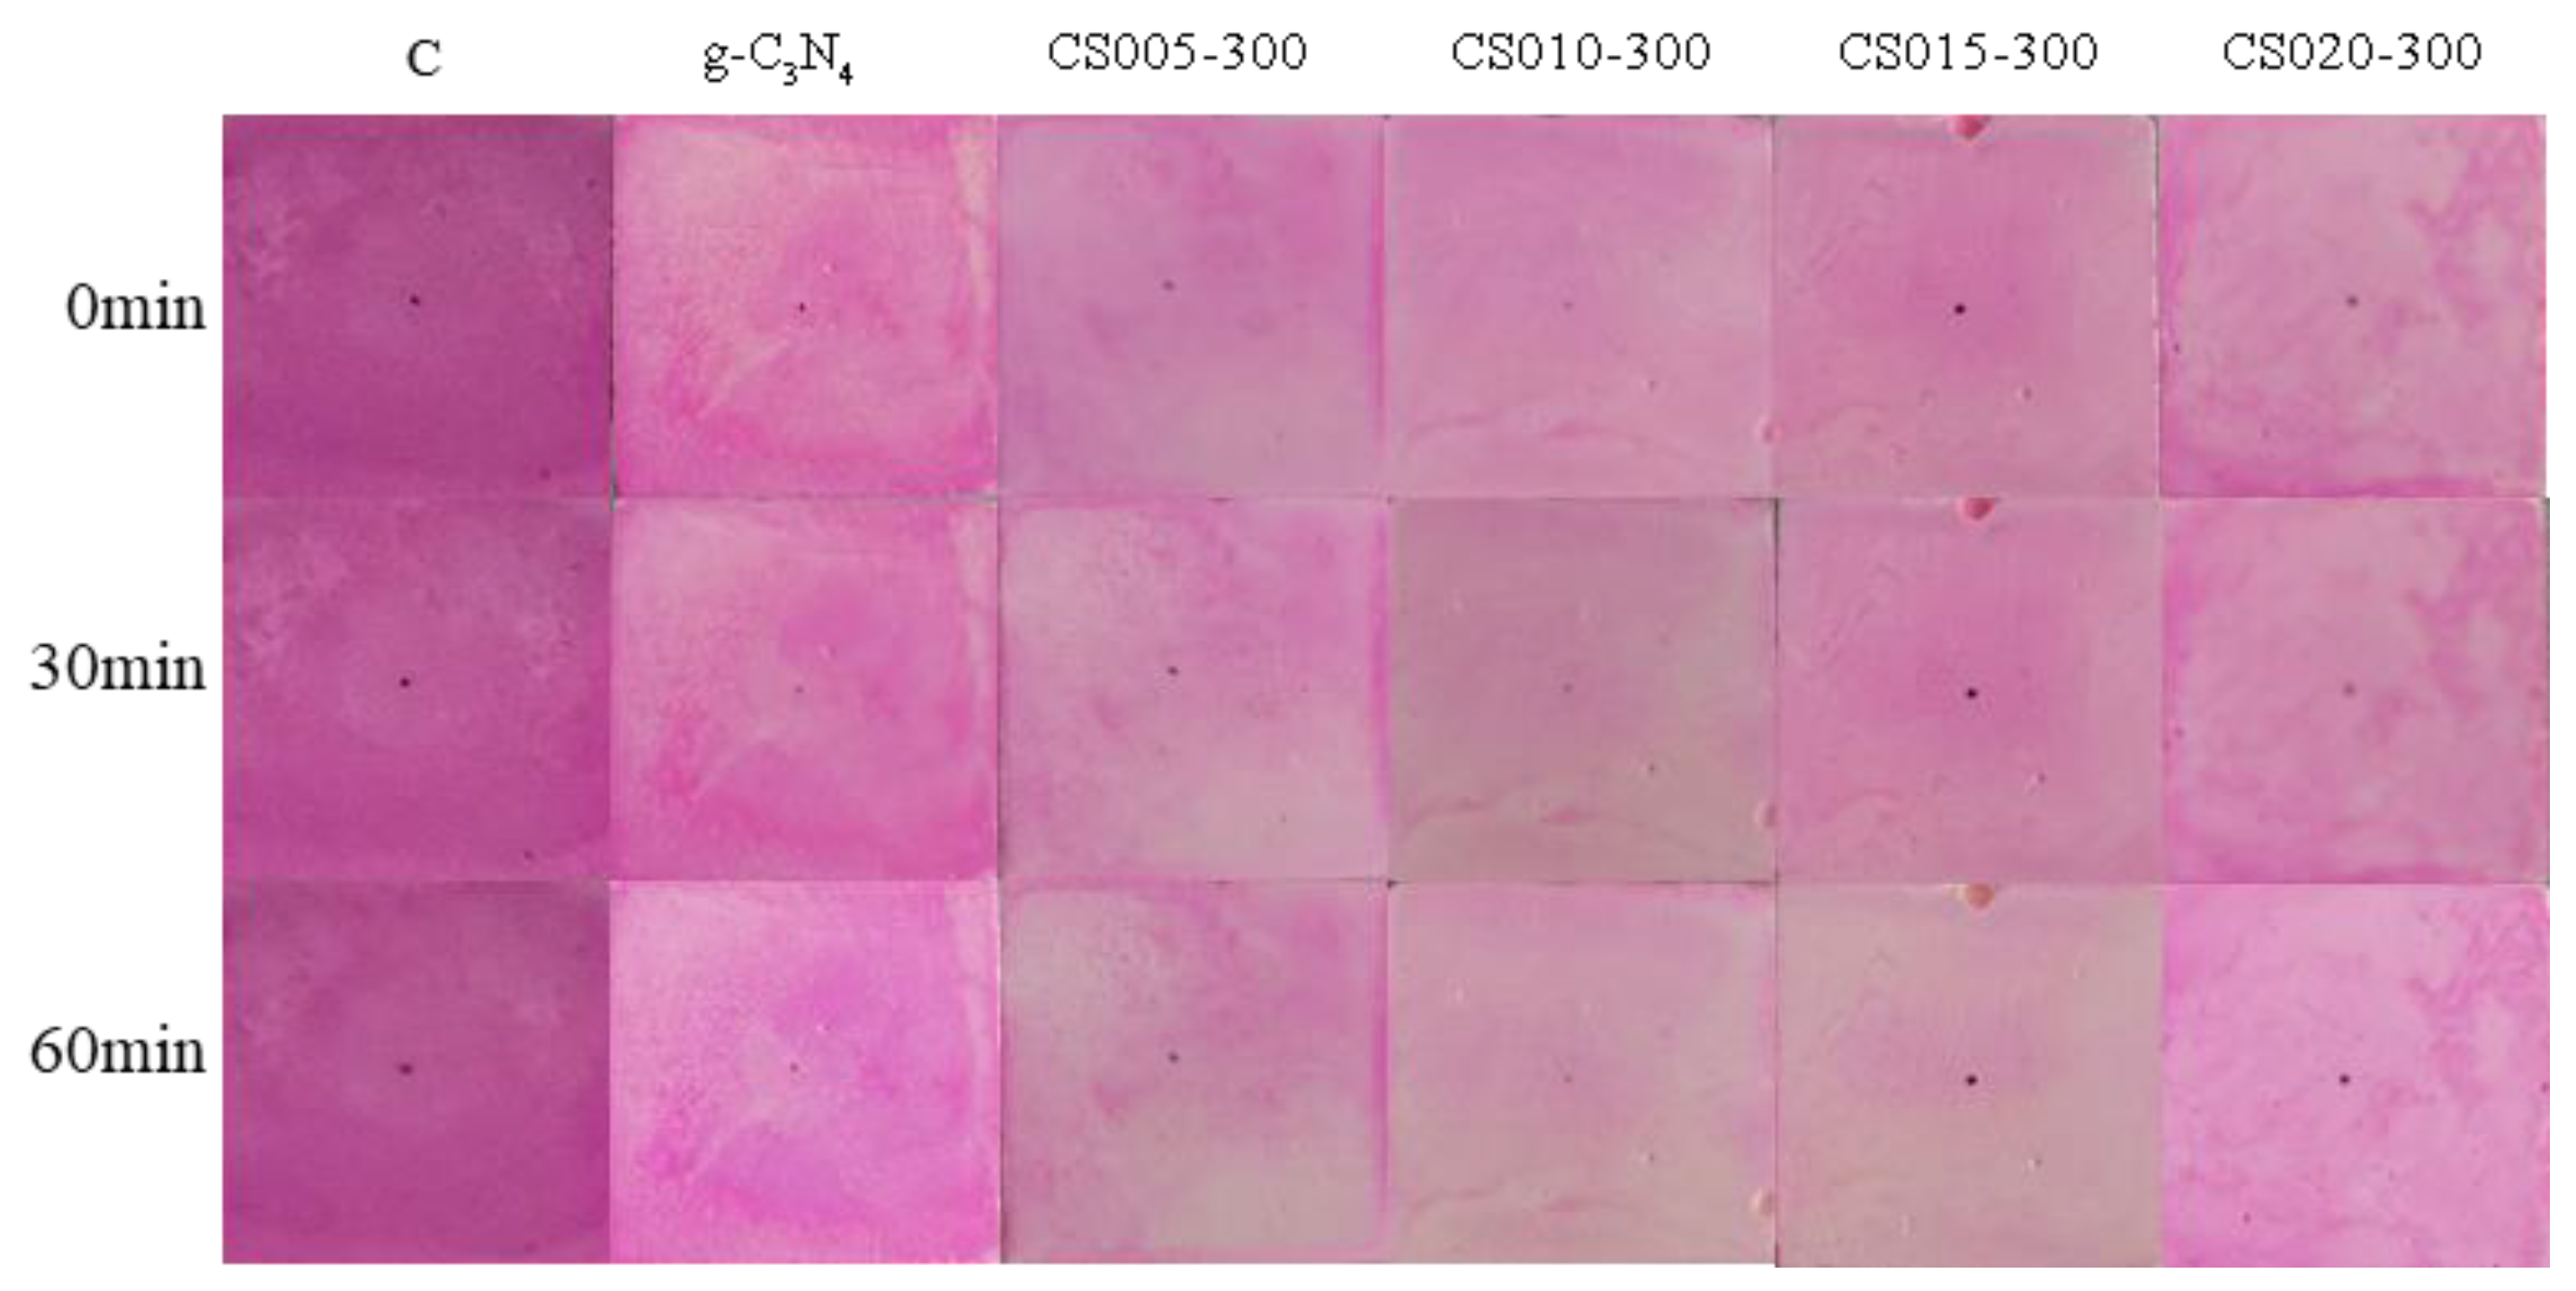
Figure 12 is the color change of RhB after the photocatalytic cement prepared by the brushing method was exposed to visible light. After 60 min of irradiation, the degree of discoloration was ranked as CS015-300, CS010-300, CS005-300, CS020-300, g-C3N4 in order from large to small. The discoloration of CS015-300 is most obvious. However, since the catalyst dispersion on the cement surface treated by the brushing method was more uniform, the color change was more obvious than that of the one-sided immersion method. The performance of the photocatalytic cement obtained by the brushing method was more excellent.

3.9. Exploration of Binding Mechanism

In order to explore the binding mechanism of g-C3N4-SiO2 and cement, we used saturated calcium hydroxide solution to simulate the alkaline environment of cement, and then an appropriate amount of CS015-300 was added. Under sealed conditions, the two substances are reacted. The resulting product was analyzed.
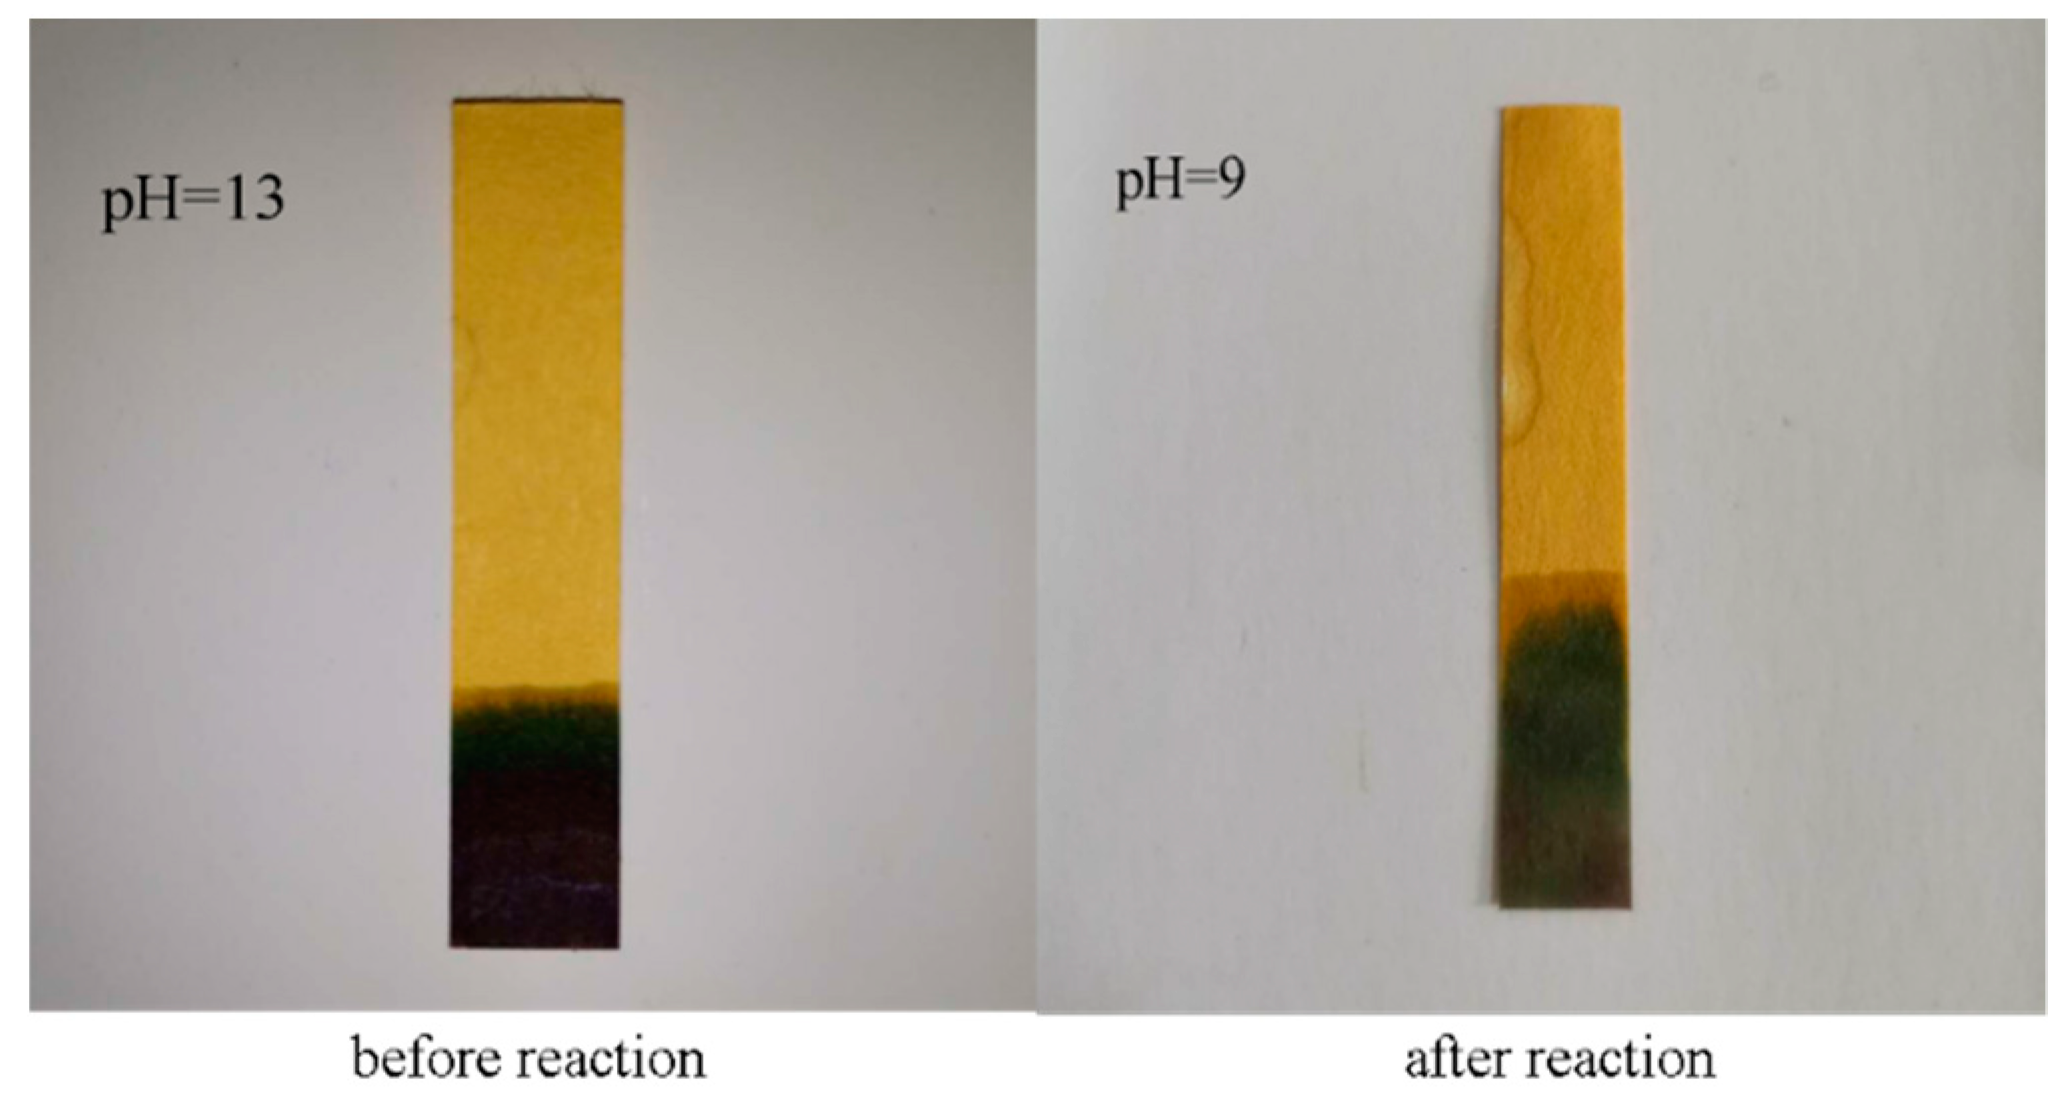
As can be seen from Figure 13, after adding CS015-300 to the saturated calcium hydroxide solution, the pH value of the test mixed solution is 13. After 7 days of reaction, the pH of the solution was reduced to 9. This indicates that the content of OH- in the solution was reduced, and a part of calcium hydroxide was reacted because SiO2 can react with calcium hydroxide by pozzolanic reaction [49]. According to existing research, it has been found that the product is C-S-H gel after the reaction [41,50]. We think that the nanosilica in CS015-300 reacted with the calcium hydroxide in the solution to form C-S-H, and the calcium hydroxide was consumed.
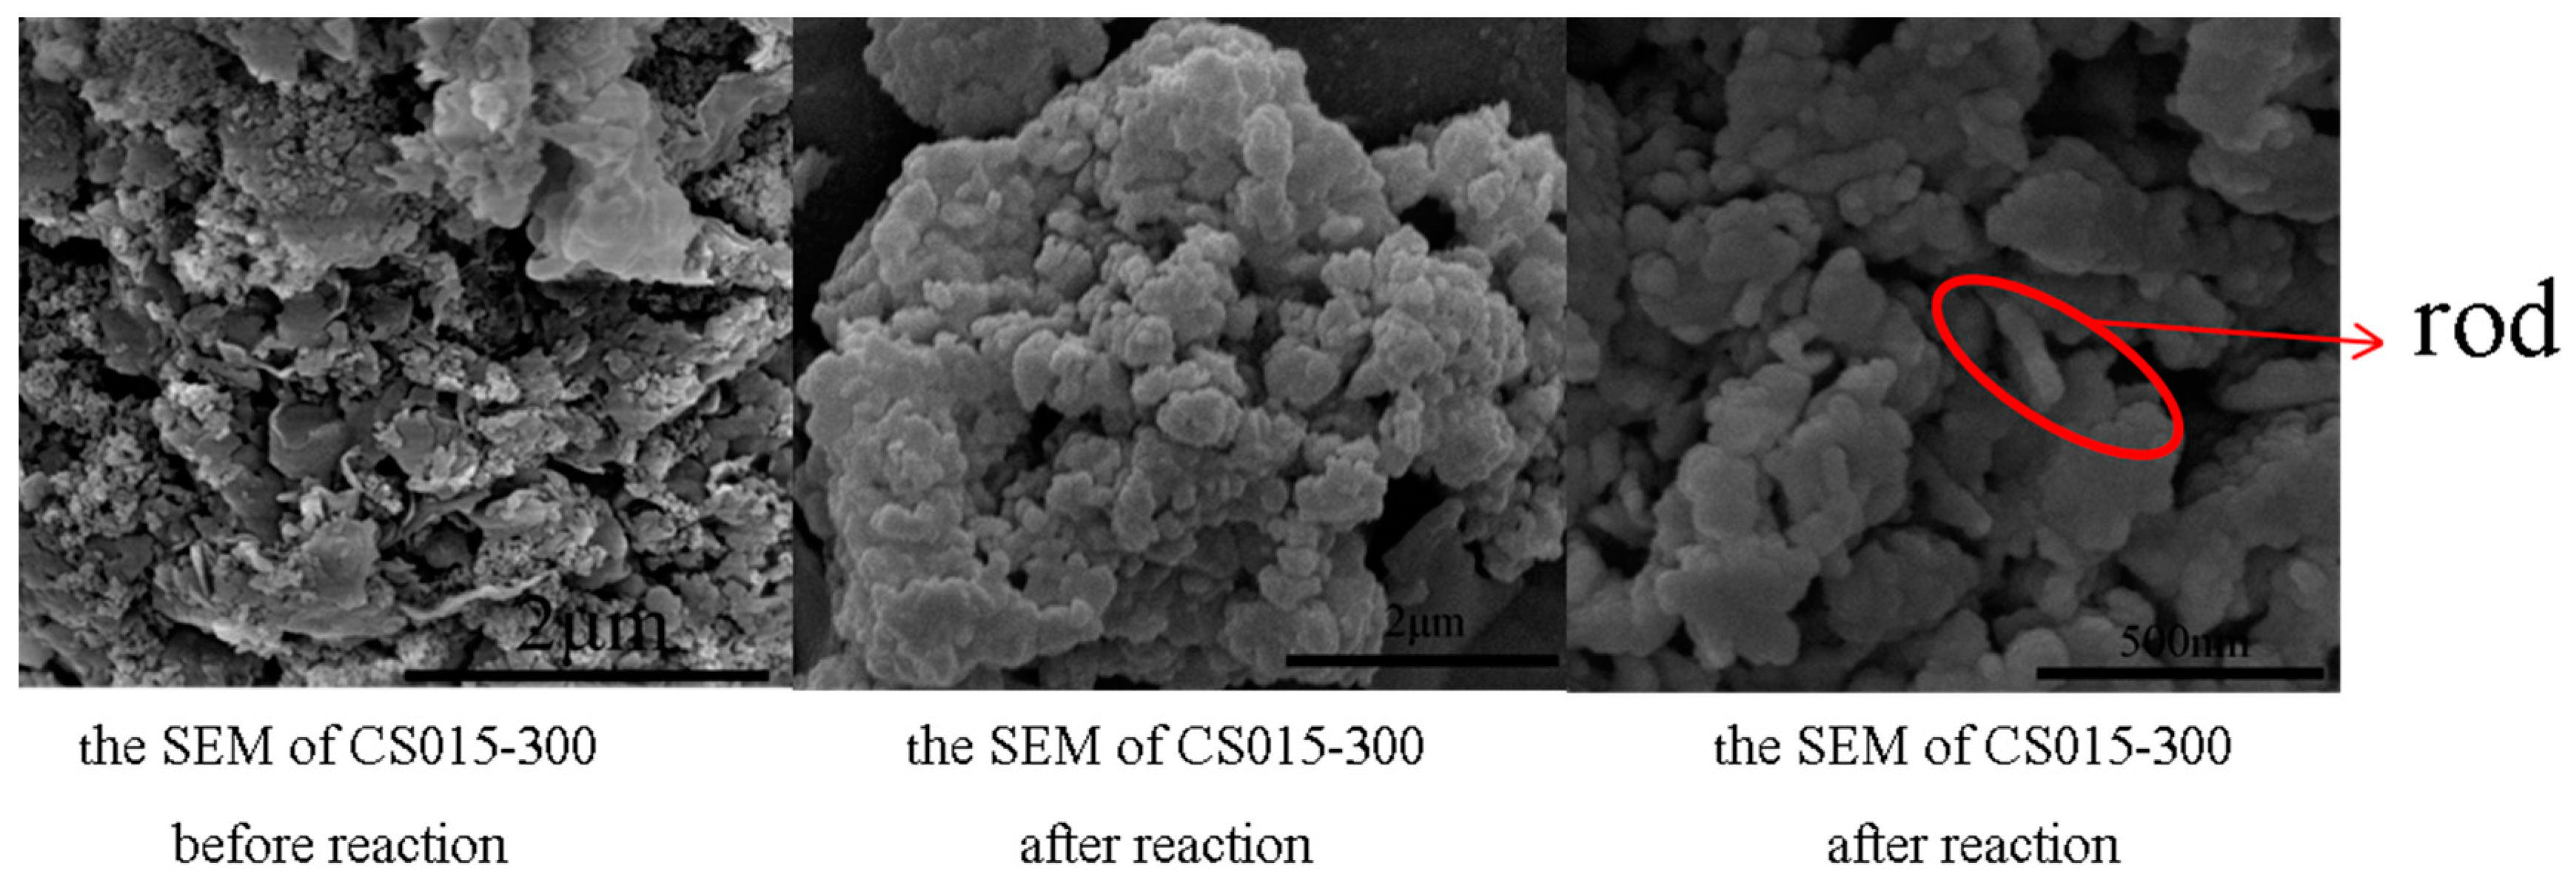
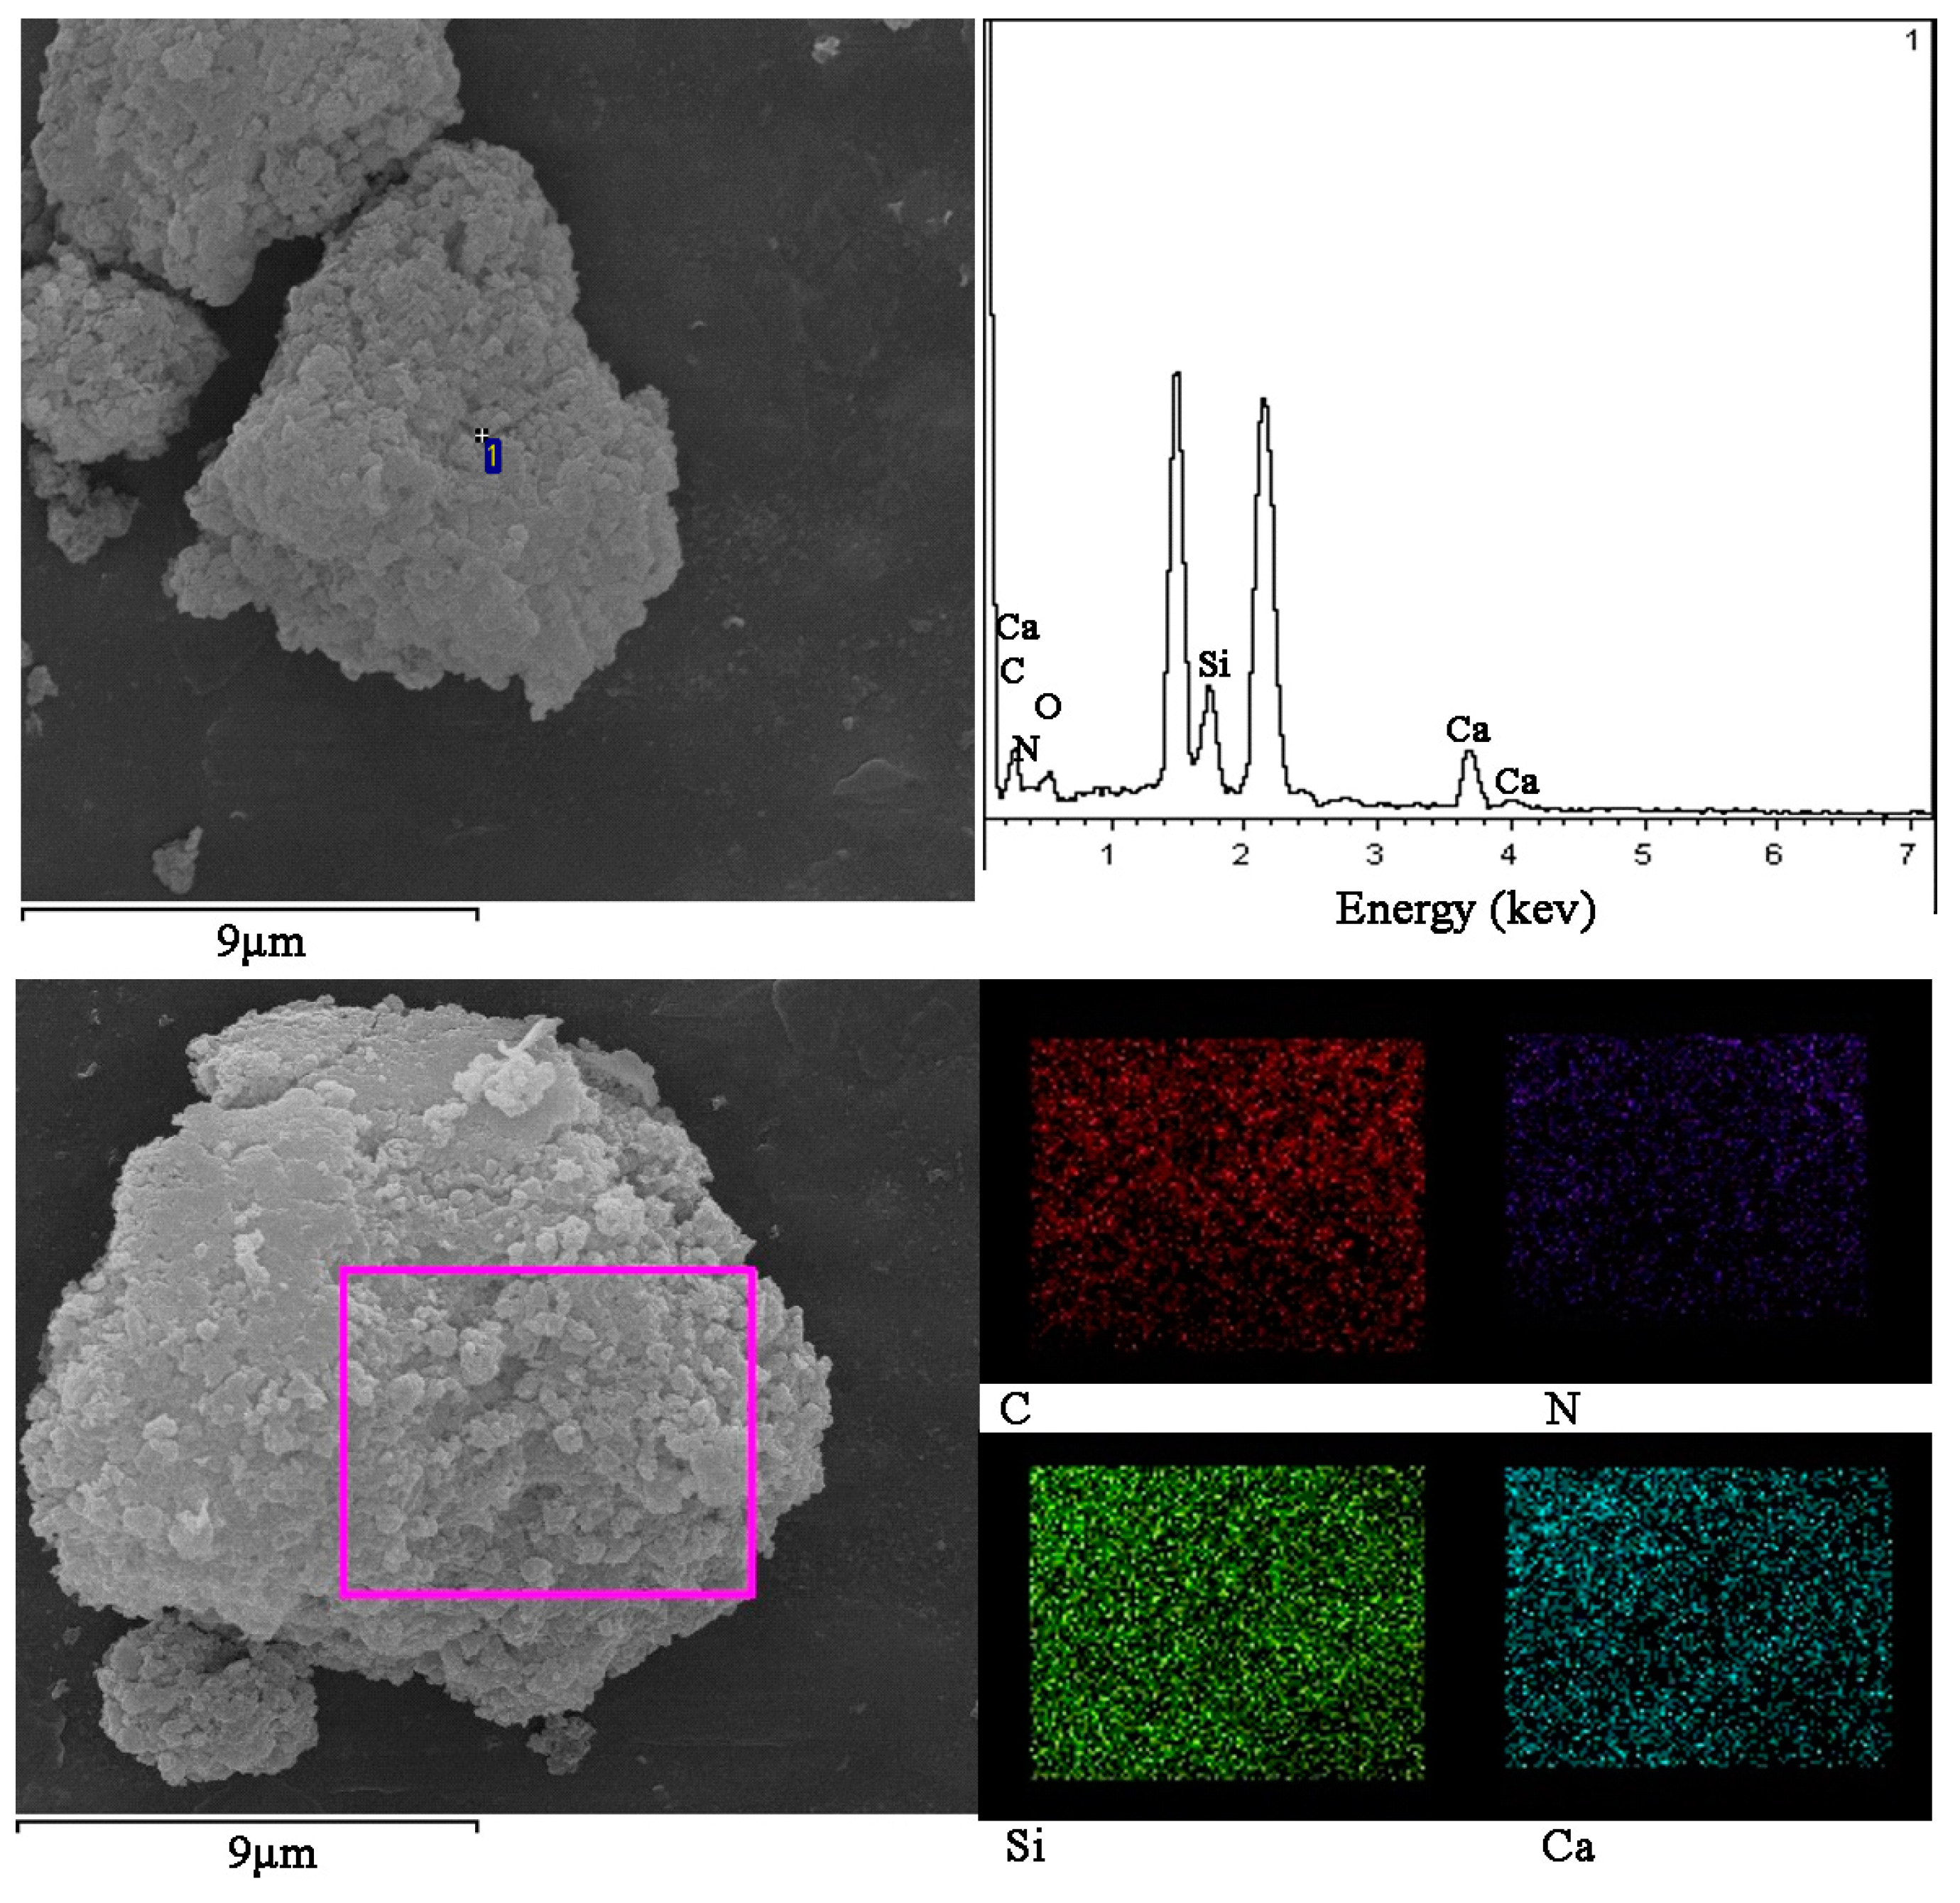
As can be seen from Figure 14, comparing the SEM pictures of the samples before and after the reaction, it was found that the microscopic morphology of the sample changed significantly after the reaction with calcium hydroxide. The microstructure of CS015-300 changed from the previous nanosilica embedded in the pores of g-C3N4 to the accumulation of irregular lumps. After further zooming, the rod was found. This point was analyzed by EDS, and the results are shown in Figure 15. It can be observed from Figure 15 that the main chemical composition of the rod is C, N, Si, O, and Ca. By analyzing the distribution of the four elements C, N, Si, and Ca in the pink area, it was found that the distribution of the four elements is very uniform and no aggregation occurred. This further illustrates that CS015-300 reacted with calcium hydroxide rather than simply piled together. This can further explain that CS015-300 reacted with calcium hydroxide to form a C-S-H gel [50]. Through the simulation experiments of CS015-300 and calcium hydroxide, we can draw the conclusion that the calcium hydroxide produced by cement hydration reacts with the nanosilica in the composite material to form C-S-H gel. The g-C3N4-SiO2 and cement material are combined by C-S-H gel.

4. Conclusions

In summary, the g-C3N4-SiO2 was synthesized by mixing and heating nanosilica and urea. By controlling the amount and the specific surface area of nanosilica, the best synthesis conditions were selected. In this way, the band gap of the graphite carbon nitride was changed, and the specific surface area was increased. The visible light catalytic performance of the material has improved. After the graphite carbon nitride-silicon dioxide composite material was treated by brushing and by one-sided immersion, the cement obtained the photocatalytic function. By comparing the photocatalytic efficiency, the brushing method was more suitable for the surface treatment of cement than the one-sided immersion method. The combination mechanism of calcium hydroxide and g-C3N4-SiO2 was explored. It was found that g-C3N4-SiO2 and cement material were combined by C-S-H gel.

Author Contributions

Conceptualization: W.Z. and X.L.; methodology: all authors; validation: W.Z., D.W., and L.Z.; formal analysis: all authors; investigation: W.Z., L.Z., and C.J.; resources: all authors; writing—original draft preparation: W.Z.; writing—review and editing: all authors; visualization: all authors; supervision: all authors; project administration: L.Z.; funding acquisition: L.Z. and X.C. All authors have read and agreed to the published version of the manuscript.

Funding

This research was funded by the Program for Taishan Scholars Program, the Case-by-Case Project for Top Outstanding Talents of Jinan, the Distinguished Taishan Scholars in Climbing Plan, the Science and Technology Innovation Support Plan for Young Researchers in Institutes of Higher Education in Shandong (2019KJA017), the National Natural Science Foundation of China (Grant No. 51872121, 51632003, and 51902129), the National Key Research and Development Program of China (Grant No. 2016YFB0303505) and the 111 Project of International Corporation on Advanced Cement-based Materials (No.D17001).

Acknowledgments

The authors wish to gratefully thank Shandong Provincial Key Laboratory of Preparation and Measurement of Building Materials, University of Jinan for their support of this work.

Conflicts of Interest

The authors declare no conflicts of interest.

References

  1. Jafari, H.; Afshar, S. Improved photodegradation of organic contaminants using nano-TiO2 and TiO2-SiO2 deposited on Portland cement concrete blocks. Photochem. Photobiol. 2016, 92, 87–101. [Google Scholar] [CrossRef] [PubMed]
  2. Papoulis, D.; Kordouli, E.; Lampropoulou, P.; Rapsomanikis, A.; Kordulis, C.; Panagiotaras, D.; Theophylaktou, K.; Stathatos, E.; Komarneni, S. Characterization and photocatalytic activities of fly ash-TiO2 nanocomposites for the mineralization of azo dyes in water. J. Surf. Interfaces Mater. 2014, 2, 261–266. [Google Scholar] [CrossRef]
  3. Chen, X.; Mao, S.S. Titanium dioxide nanomaterials: Synthesis, properties, modifications and applications. Chem. Rev. 2007, 107, 2891–2959. [Google Scholar] [CrossRef]
  4. Zhang, X.; Pan, J.H.; Du, A.J.; Fu, W.; Sun, D.D.; Leckie, J.O. Combination of one-dimensional TiO2 nanowire photocatalytic oxidation with microfiltration for water treatment. Water Res. 2009, 43, 1186. [Google Scholar] [CrossRef] [PubMed]
  5. Canterino, M.; Somma, I.D.; Marotta, R.; Andreozzi, R.; Caprio, V. Energy recovery in wastewater decontamination: Simultaneous photocatalytic oxidation of an organic substrate and electricity generation. Water Res. 2009, 43, 2710–2716. [Google Scholar] [CrossRef] [PubMed]
  6. Bhatkhande, D.S.; Pangarkar, V.G.; Beenackers, A.A.C.M. Photocatalytic degradation for environmental applications—A review. J. Chem. Technol. Biotechnol. 2002, 77, 102–116. [Google Scholar] [CrossRef]
  7. Huesken, G.; Hunger, M.; Brouwers, H.J.H. Experimental study of photocatalytic concrete products for air purification. Build Environ. 2009, 44, 2463–2474. [Google Scholar] [CrossRef]
  8. Lee, B.Y.; Jayapalan, A.R.; Bergin, M.H.; Kurtis, K.E. Photocatalytic cement exposed to nitrogen oxides: Effect of oxidation and binding. Cem Concr. Res. 2014, 60, 30–36. [Google Scholar] [CrossRef]
  9. Maggos, T.; Plassais, A.; Bartzis, J.G.; Vasilakos, C.; Moussiopoulos, N.; Bonafous, L. Photocatalytic degradation of NOx in a pilot street canyon configuration using TiO2-mortar panels. Environ. Monit. Assess. 2008, 136, 35–44. [Google Scholar] [CrossRef]
  10. Chen, M.; Chu, J. NOx photocatalytic degradation on active concrete road surface-from experiment to real -scale application. J. Clean. Prod. 2011, 19, 1266–1272. [Google Scholar] [CrossRef]
  11. Lin, H.J.; Yang, T.S.; Hsi, C.S.; Wang, M.C.; Lee, K.C. Optical and photocatalytic properties of Fe3+-doped TiO2 thin films prepared by a sol-gel spin coating. Ceram. Int. 2014, 40, 10633–10640. [Google Scholar] [CrossRef]
  12. Cheng, X.; Gotoh, K.; Nakagawa, Y.; Usami, N. Effect of substrate type on the electrical and structural properties of TiO2 thin films deposited by reactive DC sputtering. J. Cryst. Growth 2018, 491, 120–125. [Google Scholar] [CrossRef]
  13. Chen, X.B. Titanium dioxide nanomaterials and their energy applications. Chin. J. Catal. 2009, 30, 830–851. [Google Scholar] [CrossRef]
  14. Sikora, P.; Cendrowski, K.; Markowska-Szczupak, A.; Horszczaruk, E.; Mijowska, E. The effects of silica/titania nanocomposite on the mechanical and bactericidal properties of cement mortars. Constr. Build Mater. 2017, 150, 738–746. [Google Scholar] [CrossRef]
  15. Sikora, P.; Horszczaruk, E.; Rucinska, T. The effect of nanosilica and titanium dioxide on the mechanical and self-cleaning properties of water-glass cement mortar. Procedia Eng. 2015, 108, 146–153. [Google Scholar] [CrossRef] [Green Version]
  16. Mendoza, C.; Valle, A.; Castellote, M.; Bahamonde, A.; Faraldos, M. TiO2 and TiO2-SiO2 coated cement: Comparison of mechanic and photocatalytic properties. Appl. Catal. B 2014, 178, 155–164. [Google Scholar] [CrossRef]
  17. Umar, I.G.; Abdul, H.A. Heterogeneous photocatalytic degradation of organic contaminants over titanium dioxide: A review of fundamentals, progress and problems. J. Photochem. Photobiol. C 2008, 9, 1–12. [Google Scholar]
  18. Chen, J.; Kou, S.C.; Poon, C. Photocatalytic cement-based materials: Comparison of nitrogen oxides and toluene removal potentials and evaluation of self-cleaning performance. Build Environ. 2011, 46, 1827–1833. [Google Scholar] [CrossRef]
  19. Ye, Q.; Mo, R.H.; Yu, Y.C.; Li, G.H.; Huang, Z.Z. Application of polymer cement mortar modified with nitrogen-doped nano-TiO2 photocatalytic material. New Build. Mater. 2009, 36, 15–17. [Google Scholar]
  20. Gao, J.W.; Yang, H.; Shen, Q.H. Research progress of TiO2 in green building materials. J. Ceram. 2007, 28, 237–239. [Google Scholar]
  21. Wang, C.M.; Shi, H.S.; Li, Y. Research progress of nano-TiO2 photocatalytic functional building materials. New Chem. Mater. 2011, 39, 10–12. [Google Scholar]
  22. Dong, R.; Shen, W.G.; Zhong, J.B.; Liao, G.; Chen, H.; Tan, Y. Research progress of photocatalytic self-cleaning concrete. Concrete 2011, 8, 62–65. [Google Scholar]
  23. Meng, T.; Yu, Y.; Qian, X.; Zhan, S.; Qian, K. Effect of nano-TiO2 on the mechanical properties of cement mortar. Constr. Build Mater. 2012, 29, 241–245. [Google Scholar] [CrossRef]
  24. Peng, F.P.; Ni, Y.R.; Zhou, Q.; Kou, J.H.; Lu, C.H.; Xue, Z.Z. New g-C3N4 based photocatalytic cement with enhanced visible-light photocatalytic activity by constructing muscovite sheet/SnO2 structures. Constr. Build Mater. 2018, 179, 315–325. [Google Scholar] [CrossRef]
  25. Bossa, N.; Chaurand, P.; Levard, C.; Borschneck, D.; Miche, H.; Vicente, J.; Geantet, C.; Aguerre-Chariol, O.; Michel, F.M.; Rose, J.; et al. Environmental exposure to TiO2 nanomaterials incorporated in building material. Environ. Pollut. 2016, 220 Pt B, 1160–1170. [Google Scholar] [CrossRef] [Green Version]
  26. Xu, J.; Teng, Y.; Teng, F. Effect of surface defect states on valence band and charge separation and transfer efficiency. Sci. Rep. 2016, 6, 32457. [Google Scholar] [CrossRef] [PubMed] [Green Version]
  27. Teng, F.; Liu, Z.; Zhang, A.; Li, M. Photocatalytic performances of Ag3PO4 polypods for degradation of dye pollutant under natural indoor weak light irradiation. Environ. Sci. Technol. 2015, 49, 9489–9494. [Google Scholar] [CrossRef]
  28. Teng, F.; Chen, M.; Li, N.; Hua, X.; Wang, K.; Xu, T. Effect of TiO2 surface structure on the hydrogen production activity of the Pt@CuO/TiO2 photocatalysts for water splitting. Chem. Cat. Chem. 2014, 6, 842–847. [Google Scholar]
  29. Wang, X.; Maeda, K.; Thomas, A.; Takanabe, K.; Xin, G.; Carlsson, J.M. A metal-free polymeric photocatalyst for hydrogen production from water under visible light. Nat. Mater. 2009, 8, 76–80. [Google Scholar] [CrossRef]
  30. Yan, H.J.; Yang, H.X. TiO2-g-C3N4 composite materials for photocatalytic H2 evolution under visible light irradiation. J. Alloys Compd. 2011, 509, 126–129. [Google Scholar] [CrossRef]
  31. Kang, H.W.; Lim, S.N.; Song, D.; Park, S.B. Organic-inorganic composite of g-C3N4-SrTiO3: RH photocatalyst for improved H2 evolution under visible light irradiation. Int. J. Hydrogen Energy 2012, 37, 11602–11610. [Google Scholar] [CrossRef]
  32. Fu, Q.; Jiu, J.T.; Cai, K.; Wang, H.; Cao, C.B.; Zhu, H.S. Attempt to deposit carbon nitride films by electrodeposition from an organic liquid. Phys. Rev. B 1999, 59, 1693–1696. [Google Scholar] [CrossRef]
  33. Zhao, H.; Yu, H.; Quan, X.; Chen, S.; Zhao, H.; Wang, H. Atomic single layer graphitic-C3N4: Fabrication and its high photocatalytic performance under visible light irradiation. Rsc. Adv. 2014, 4, 624–628. [Google Scholar] [CrossRef]
  34. Sun, X.D.; Li, Y.Y.; Zhou, J.; Ma, C.H.; Wang, Y.; Zhua, J.H. Facile synthesis of high photocatalytic active porous g-C3N4 with ZnCl2 template. J. Colloid Interface Sci. 2015, 451, 108–116. [Google Scholar] [CrossRef] [PubMed]
  35. Wang, H.; He, W.; Dong, X.A.; Wang, H.; Dong, F. In situ FT-IR investigation on the reaction mechanism of visible light photocatalytic NO oxidation with defective g-C3N4. Sci. Bull. 2018, 63, 117–125. [Google Scholar] [CrossRef] [Green Version]
  36. Cui, W.; Li, J.; Cen, W.; Sun, Y.; Lee, S.C.; Dong, F. Steering the interlayer energy barrier and charge flflow via bioriented transportation channels in g-C3N4: Enhanced photocatalysis and reaction mechanism. J. Catal. 2017, 352, 351–360. [Google Scholar] [CrossRef]
  37. Cui, W.; Li, J.; Dong, F.; Sun, Y.; Jiang, G.; Cen, W.; Lee, S.C.; Wu, Z. Highly effificient performance and conversion pathway of photocatalytic NO oxidation on SrO@clusters amorphous carbon nitride. Environ. Sci. Technol. 2017, 51, 10682–10690. [Google Scholar] [CrossRef]
  38. Shi, L. Preparation and Properties of Carbon Nitride-Based Photocatalytic Materials. Ph.D. Thesis, Harbin Institute of Technology, Harbin, China, 2017. [Google Scholar]
  39. Liao, G.; Chen, S.; Quan, X.; Yu, H.; Zhao, H. Graphene oxide modifified g-C3N4 hybrid with enhanced photocatalytic capability under visible light irradiation. J. Mater. Chem. 2012, 22, 2721–2726. [Google Scholar] [CrossRef]
  40. Hao, Q.; Niu, X.; Nie, C.; Hao, S.; Zou, W.; Ge, J.; Chen, D.; Yao, W. A highly efficient g-C3N4/SiO2 heterojunction: The role of SiO2 in the enhancement of visible light photocatalytic activity. Phys. Chem. Chem. Phys. 2016, 18, 31410–31418. [Google Scholar] [CrossRef]
  41. Wang, D.; Yang, P.; Hou, P.K.; Zhang, L.N.; Zhang, X.Z.; Zhou, Z.H.; Xie, N.; Huang, S.F.; Cheng, X. Cement-based composites endowed with novel functions through controlling interface microstructure from Fe3O4@SiO2 nanoparticles. Cem. Con. Com. 2017, 80, 268–276. [Google Scholar] [CrossRef]
  42. Lin, B.; Xue, C.; Yan, X.; Yang, G.; Yang, G.; Yang, B. Facile fabrication of novel SiO2/g-C3N4 core-shell nanosphere photocatalysts with enhanced visible light activity. Appl. Surf. Sci. 2015, 357, 346–355. [Google Scholar] [CrossRef]
  43. Lei, J.; Ying, C.; Wang, L.; Liu, Y.D.; Zhang, J.L. Highly condensed g-C3N4-modified TiO2 catalysts with enhanced photo degradation performance toward acid orange 7. J. Mater. Sci. 2015, 50, 3467–3476. [Google Scholar] [CrossRef]
  44. Cao, S.; Low, J.; Yu, J.; Jaroniec, M. Polymeric photocatalysts based on graphitic carbon nitride. Adv. Mater. 2015, 27, 2150–2176. [Google Scholar] [CrossRef] [PubMed]
  45. Feng, P.; Chang, H.L.; Liu, X.; Ye, S.X.; Shu, X.; Ran, Q.P. The significance of dispersion of nano-SiO2 on early age hydration of cement paste. Mater. Des. 2020, 186, 108320. [Google Scholar] [CrossRef]
  46. Shen, W.Z.; Ren, L.W.; Zhou, H.; Zhang, S.; Fan, W. Facile one-pot synthesis of bimedal mesepormm carbon nitride and its function as a lipase immobilization support. J. Mater. Chem. 2011, 21, 3890–3894. [Google Scholar] [CrossRef]
  47. Wang, X.X.; Wang, S.S.; Hu, W.D.; Cai, J.; Zhang, L.; Dong, L. Synthesis and photocatalytic activity of SiO2/g-C3N4 composite photocatalyst. Mater. Lett. 2014, 115, 53–66. [Google Scholar] [CrossRef]
  48. Tolman, R.C. The effect of droplet size on surface tension. J. Chem. Phys. 2004, 17, 333–337. [Google Scholar] [CrossRef] [Green Version]
  49. Khandaker, M.; Anwar, H. Volcanic ash and pumice as cement additives: Pozzolanic, alkali-silica reaction and autoclave expansion characteristics. Cem. Concr. Res. 2005, 35, 1141–1144. [Google Scholar]
  50. Wang, D.; Yang, P.; Hou, P.K.; Cheng, X. BiOBr@SiO2 flower-like nanospheres chemically-bonded on cement-based materials for photocatalysis. App. Surf. Sci. 2018, 30, 539–548. [Google Scholar]
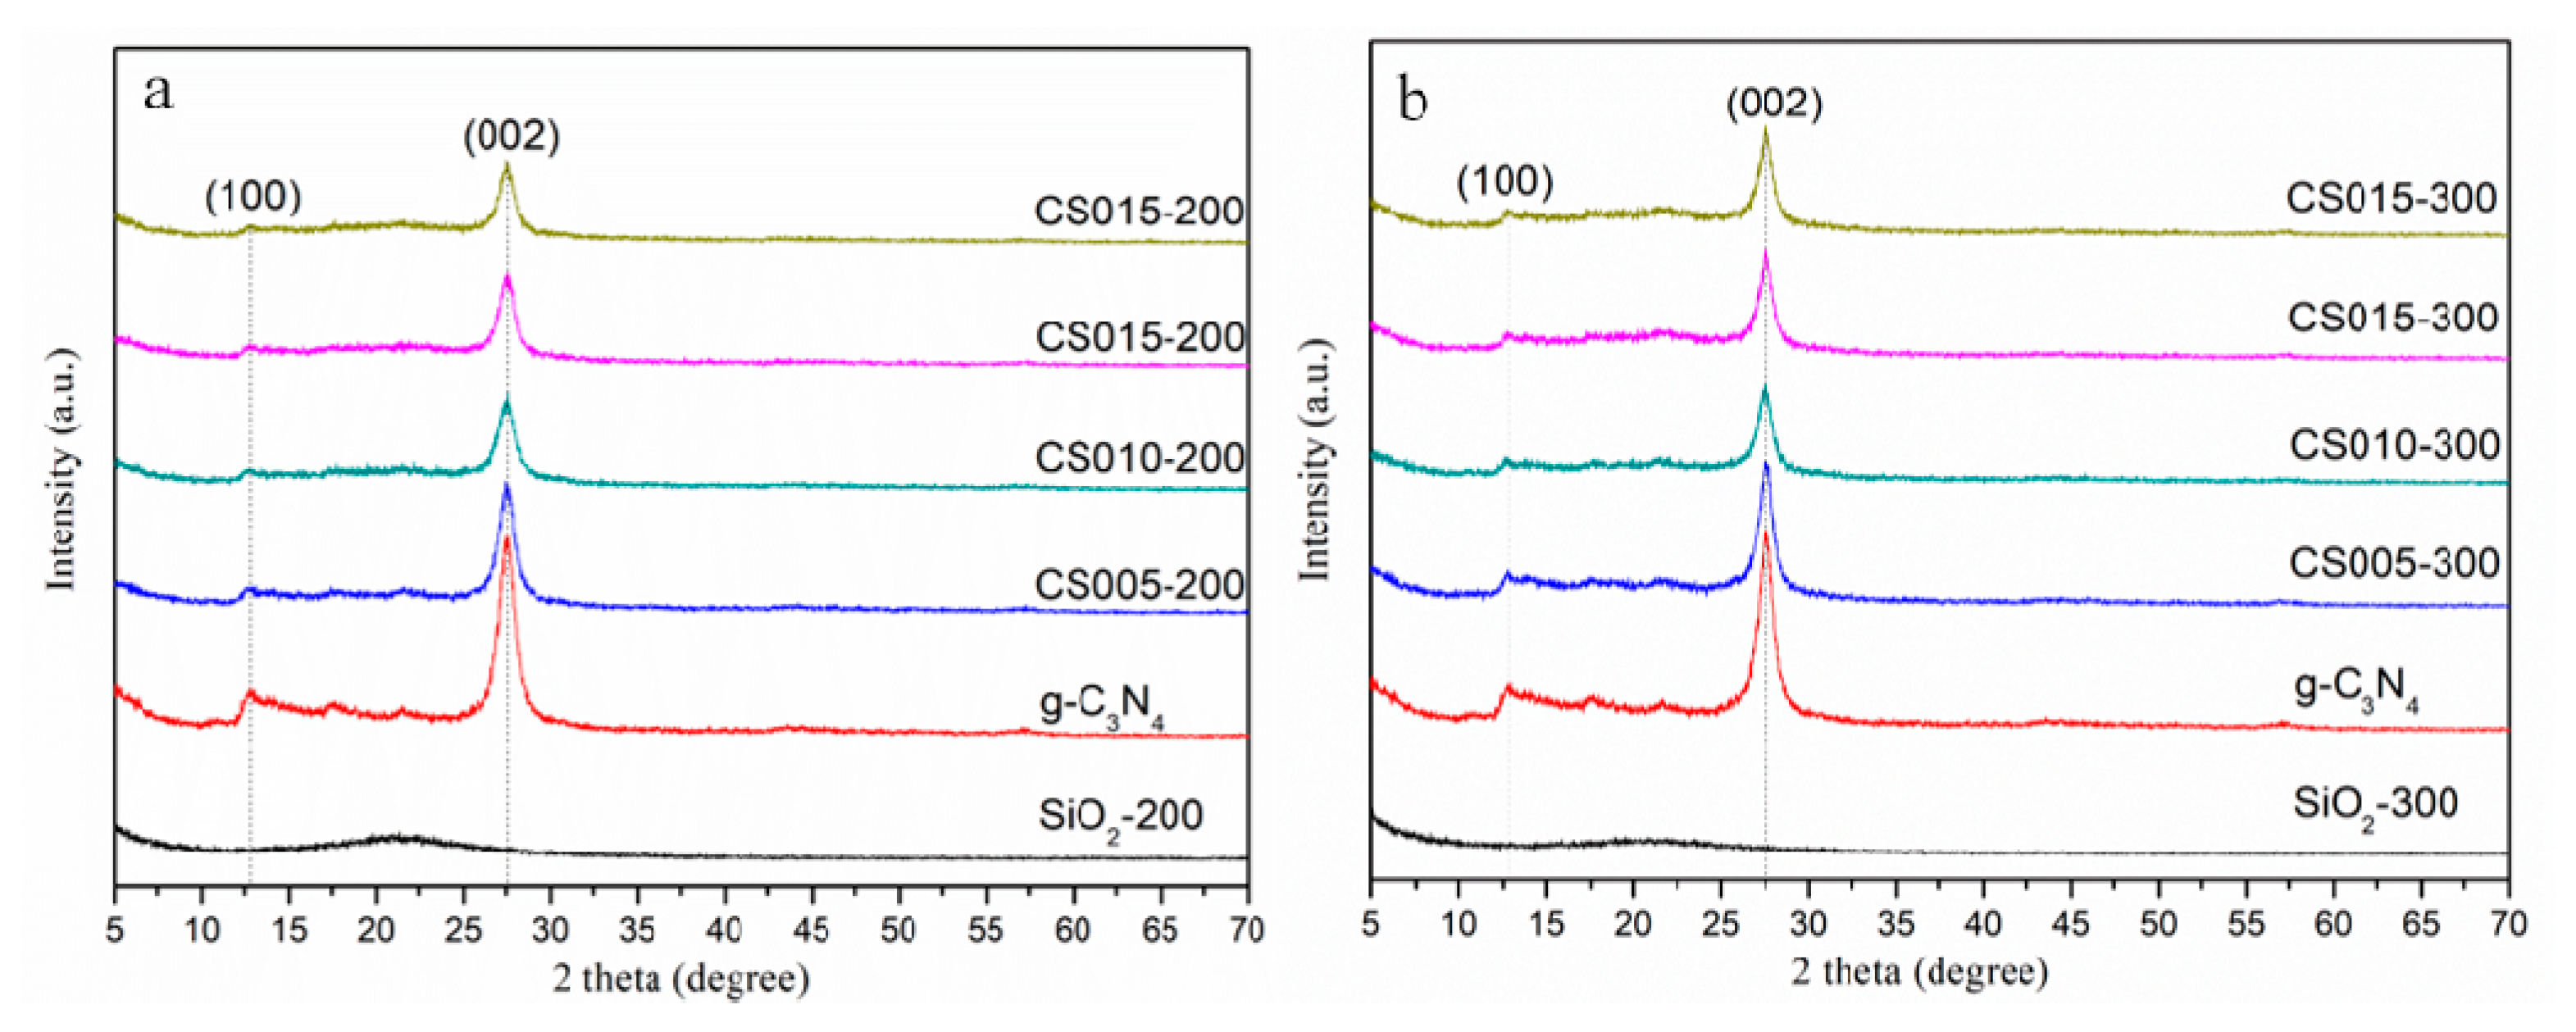
Figure 1. The XRD patterns of SiO2-200, g-C3N4, CS005-200, CS010-200, CS015-200, CS020-200 (a) and SiO2-300, g-C3N4, CS005-300, CS010-300, CS015-300, CS020-300 (b).
Crystals 10 00490 g001
Figure 2. The TGA analysis of SiO2-200, g-C3N4, CS005-200, CS010-200, CS015-200, CS020-200 (a) and SiO2-300, g-C3N4, CS005-300, CS010-300, CS015-300, CS020-300 (b).
Crystals 10 00490 g002
Figure 3. SEM images of CS005-200, CS010-200, CS015-200, CS020-200, CS005-300, CS010-300, CS015-300, CS020-300.
Crystals 10 00490 g003
Figure 4. The EDS analysis of CS015-300.
Crystals 10 00490 g004
Figure 5. N2 adsorption-desorption isotherms of g-C3N4, CS015-200, and CS015-300.
Crystals 10 00490 g005
Figure 6. UV–Vis spectra (a) and band gap (b) of g-C3N4, CS005-200, CS010-200, CS015-200, CS020-200.
Crystals 10 00490 g006
Figure 7. UV–Vis spectra (a) and band gap (b) of g-C3N4, CS005-300, CS010-300, CS015-300, CS020-300.
Crystals 10 00490 g007
Figure 8. Photocatalytic activities (a) and their kinetic constants (b) of g-C3N4, CS005-200, CS010-200, CS015-200, CS020-200.
Crystals 10 00490 g008
Figure 9. Photocatalytic activities (a) and their kinetic constants (b) of g-C3N4, CS005-300, CS010-300, CS015-300, CS020-300.
Crystals 10 00490 g009
Figure 10. Surface treatment of cement by the one-sided immersion method and brushing method.
Crystals 10 00490 g010
Figure 11. Photocatalytic performance of surface treatment cement with the one-sided immersion method.
Crystals 10 00490 g011
Figure 12. Photocatalytic performance of surface treatment cement by the brushing method.
Crystals 10 00490 g012
Figure 13. The pH of solution before and after reaction.
Crystals 10 00490 g013
Figure 14. The SEM of CS015-300 before and after reaction.
Crystals 10 00490 g014
Figure 15. The EDS of CS015-300 after reaction.
Crystals 10 00490 g015
Table 1. The specific surface area, total pore volume, and average hole radius of g-C3N4, CS015-200 and CS015-300.
SampleSpecific Surface AreaTotal Pore VolumeAverage Hole Radius
g-C3N4105.45 m2/g0.81 cm3/g15.53 nm
CS015-200170.49 m2/g1.27 cm3/g15.00 nm
CS015-300238.68 m2/g0.94 cm3/g7.30 nm