Article

Tetrathiafulvalene: A Gate to the Mechanochemical Mechanisms of Electron Transfer Reactions

Department of Chemistry & Biochemistry, Old Dominion University, 4402 Elkhorn Avenue, Norfolk, VA 23529, USA
*
Author to whom correspondence should be addressed.
Crystals 2020, 10(6), 482; https://doi.org/10.3390/cryst10060482
Submission received: 20 May 2020 / Revised: 1 June 2020 / Accepted: 2 June 2020 / Published: 5 June 2020
(This article belongs to the Special Issue Charge Transfer Crystals)

Abstract

:
This report describes aspects of our previous studies of the mechanochemical synthesis of charge transfer complexes of the electron donor tetrathiafulvalene, which are relevant to the use of laboratory X-ray powder diffraction for ex situ monitoring of mechanochemical reactions toward investigating their mechanisms. In particular, the reaction of tetrathiafulvalene and chloranil was studied under neat mechanochemical conditions and liquid-assisted grinding with diethyl ether (1 μL/mg). The product in both cases is the green tetrathiafulvalene chloranil polymorph and the mechanism of the redox reaction is presumably the same. However, while the kinetic profile of the neat mechanochemical synthesis was fitted with a second-order rate law, that of the overall faster liquid-assisted grinding reaction was fitted with the Ginstling-Brounshtein 3D diffusion-controlled model. Hence, the diffusional processes and mass transfer bringing the reactants together and separating them from products must be different. Diffraction measurements sensitive to crystalline phases and amorphous material, combined with in situ monitoring by spectroscopic techniques, will ultimately afford a better understanding of mechanochemical reaction mechanisms, a hot topic in mechanochemistry.

1. Introduction

While the chemical reactivity of substances (for mixtures and conditions which do not lead to a spontaneous reaction) can be enhanced by heating, light irradiation, and electrical energy, mechanical energy can be similarly used to produce mechanochemical reactions. These are mediated by phonons which dissipate energy as heat, a process conjugated with mechanical friction [1], but energy can be also transferred to the electron system, enabling chemical reactions. A typical mechanochemical reaction occurs by manually grinding powders together in a simple mortar with pestle, or in specifically designed instruments such as planetary or shaker ball mills [2]. Since reaction and crystallization solvents are avoided (or their use is largely reduced), mechanochemical reactions are “green” chemistry, leading to environmental benefits and economic cost reduction [3]. A more recent method, liquid-assisted grinding (LAG), involves adding small quantities of liquid additives to the reactants under mechanical treatment [4,5]. LAG can afford reactivity from otherwise unreactive mixtures, it typically increases the crystallinity of the products and the reaction rates, and it can yield selected polymorphs of the products. However, general features of mechanochemical reaction mechanisms [6,7], and the liquid roles in LAG leading to the above outcomes, are not well understood [5]. While the liquid effects are deemed to be specific and most likely different for each reaction, our work has shown trends that are discussed in this article, which might be applicable to other electron transfer reactions.
Mechanochemistry is commonly used as a synthetic method for organic cocrystallization [8,9,10]. As early as 1893, a report of an electron transfer reaction occurring by mechanochemistry [3] mentions the formation of a tetrachloroquinhydrone cocrystal by grinding metadichloroquinone with metadichloroquinol [11]. Recent reports include the cocrystallization of racemic bis-β-naphthol and p-benzoquinone [12], and ternary cocrystals of chiral 6,6′-dibromo-1,1′-bi-2-naphthol, p-benzoquinone and biphenyl [13]. It is also known that single radicals and radical pairs can be formed by mechanochemical treatment [14,15]. The prototype organic metal TTF-TCNQ has also been synthesized by mechanochemistry [16].
Our current work investigates the mechanochemical synthesis of charge transfer complexes (CTC) of the electron donor tetrathiafulvalene (TTF) by neat and liquid-assisted grinding. The preparation of this type of materials has been traditionally made by electrocrystallization [17]. Our work demonstrated that LAG is a promising method for the polymorph screening of CTC, leading to known and new materials of this type, as well as to control of the polymorphic outcome of the reactions [18,19,20], by varying η (the μL of liquid per mg of reactant) to obtain single polymorphic phases. Polymorph control is sought in many research areas (e.g., pharmaceutical, organic electronics, pigments, agrochemicals, etc.) [17]. In addition, our work using modern methods to solve crystal structures from powders [21,22] has led to the structural characterization of a few materials obtained by LAG as single phases: the black polymorph of tetrathiafulvalene chloranil [18]; the ionic form of tetrathiafulvalene 2,3-dichloro-5,6-dicyano-p-benzoquinone [19]; 2,5-dichloro-p-benzoquinone, tetrathiafulvalene chloranilic acid, form II [20]; and tetrathiafulvalene bromanilic acid. This is an advantage of LAG over neat mechanochemistry, which often leads to poorly crystalline materials, and the consequent diffraction peak broadening and background increase often makes difficult solving their crystal structures from powders. Nevertheless, a crystal structure with Z’ = 4 of an amino acid derivative obtained by neat mechanochemistry could also be similarly solved from powders [23].
Tetrathiafulvalene is a prototype electron donor, forming an unusually stable radical cation with remarkable physical properties [24]. Scheme 1 shows its molecular structure, together with those of the electron acceptors most studied. The discovery of the first organic metal, TTF-TCNQ, in early 1970’s [25], led to widespread interest in the synthesis, solid-state characterization and potential applicability of organic conductors based on TTF and its derivatives [26]. However, the applications of these materials then became stagnant for around 30 years, after the emergence of modern organic electronic devices and materials such as solar cells, diodes and organic transistors [26]. The interest in the chemistry of TTF and its derivatives has recently increased due to the ease of their preparation, excellent and optimizable donor properties, low dimensionality, and the wealth of information available from their crystal structures [26], which has also facilitated theoretical studies.
TTF has two polymorphs at ambient conditions, the brown, triclinic β−polymorph [27], and the orange, monoclinic α−polymorph [28]. The orange form has a phase transition at around 190 K, wherein the a-axis is doubled [28], giving rise to the γ-form. Their crystal structures and crystallite morphologies (as received from commercial suppliers [18]) are shown in Figure 1.
X-ray powder diffraction (XRPD) and optical microscopy can be used to distinguish between the orange and brown TTF [18]. Additionally, it has been observed that the orange form leads to the brown form [18] by neat grinding, while LAG with diethyl ether produces the orange polymorph.
The redox behavior of TTF is well understood [29] and its oxidation is driven by the formation of aromatic heterocycles (with 6 π electrons) from each of the two dithiolylidene heterocycles (with 7 π electrons each). The first electron removal leads to a radical cation (TTF+•), while a second electron removal gives rise to the dication, TTF2+, with two aromatic heterocycles. Similarly, the redox behavior of quinones in various solvents shows typical reversible two-way voltammograms corresponding to two successive 1e- transfers forming the radical anion first, and then the dianion [30].
The CTC formed can have different ionicities (ρ) or charge transferred between donors and acceptors. In fully ionic CTC (ρ = 1 e−) all donors and acceptors are ionized, while in neutral complexes (ρ = 0 e−), none of them are. CTC of this type have unique physical properties since mixed-valence CTC can occur, for which 0 e− < ρ < 1 e−, which are called pseudo-neutral or pseudo-ionic, for ρ closer to 0 e− or 1 e−, respectively. In these cases, only a fraction of donor-acceptor pairs are ionized. For example, the green TTF-CA has ρ = 0.3 e− at ambient conditions, which means that 3 in 10 donor (and acceptor) molecules are ionized.
Neat grinding and LAG with different liquids can lead to different CTC polymorphs, with different ionicities, chemical bonding and crystal structures, and consequently different physical properties. While ionic CTC show TTF radical cation dimers as the typical packing motif, leading to diamagnetic and insulator materials [18], columnar stacks of equidistant donors physically segregated from acceptors are the structural signature of 1-D organic metals, such as TTF-TCNQ [31,32]. The metallic properties are due to the TTF mixed-valence leading to partially filled bands, generated by π-stacking of TTF units and the overlap of their π electron systems [32]. Alternated stacks of donors and acceptors give rise to semiconductors/insulators. Among those, TTF-CA (green polymorph) is a model system extensively studied to understand neutral to ionic transitions occurring as a function of the pressure or temperature [31,33]. At atmospheric pressure and 81 K, the green TTF-CA undergoes a neutral to ionic transition simultaneously with a crystallographic transition from P21/n to Pn, leading to the dimerization of the donor-acceptor stacks giving rise to a ferroelectric material [34]. The two TTF-CA polymorphs synthesized by mechanochemistry (in 1:1 molar ratio) and their crystal structures are shown in Figure 2.
The ionic polymorph of TTF-CA has been known since the 1980’s. However, its crystal structure remained only characterized by FT-IR spectroscopy [35], until our recent structural determination from synchrotron XRPD [18], from the material synthesized by LAG with DMSO.
Bernstein [17] has pointed out that alternating donor-acceptor stacks such as in the green TTF-CA are, as a general rule, thermodynamically more stable than segregated stacks leading to 1-D organic metals. While no organic metals are known for this system, the pseudo-neutral, green TTF-CA is in turn expected to be thermodynamically less stable than the ionic form. In fact, the neutral to ionic transition is a symmetry breaking phenomenon (analogous to a Peierls transition), leading to a thermodynamically more stable state [31,33]. As expected, the crystal structure of the black (ionic) TTF-CA remains stable down to 20 K by synchrotron XRPD (with lattice and relevant distances changing no more than 2%), and to 10 K by FT-IR spectroscopy [18].
Furthermore, in solid-state reactions, one could distinguish two distinct processes, the chemical or molecular change (the redox reaction in this case), and the phase transitions (since the reactants and products are in separate crystalline solids). Li et al. [36] mention three types of mechanisms for phase transitions in solids: A continuous model, suitable for single-crystal to single-crystal transformations, which main feature is the progressive reorientation or translation of molecules and concerted movements; amorphous mediation mechanisms, involving the amorphization of a starting material, energy input through some process, and the crystallization of products; and nucleation and growth mechanisms, which imply that the transformation happens at specific sites, such as crystallite surfaces or lattice defects, and it propagates through the solid by a reaction interface. Comparable general mechanisms, based on intermediate phases of increased reactivity and molecular mobility, have been proposed by Friščić and Jones [5]; whereas Kaupp’s work [37] based on AFM measurements emphasizes molecular migration over long distances, as generally underlying solid-state reactions rather than strictly topochemical processes (wherein the reacting molecules within solids must be at quite small distances for reactions to occur). However, the anisotropy of the molecular movements in solids and the different (or increased) reactivity in particular crystallite faces have also been pointed out [38,39]. Paul and Curtin [38] outline a four-step mechanism consisting of: (1) molecular loosening at a reaction site, (2) molecular change, (3) solid-solution formation containing the product, and (4) product separation. However, how the molecular change and the phase transitions are interrelated is a fundamental question that remains unclear, and the answers will likely be quite different according to the reaction types and experimental conditions. Not only the anisotropy of chemical interactions between reactants must be accounted for, but also the effects of additional factors inherent to solid-state reactions, such as particle sizes and shapes, surface area, crystalline defects, and their density [40].
Mechanical processing reduces the particle sizes, and increases the surface area and lattice defects in the powders ground [1], leading to amorphization. While the liquids used in LAG can be good solvents for the reactants (e.g., DMSO in the reaction of Figure 2), or not (e.g., water) [18], the addition of liquids can at least contribute by enhancing diffusion and mass transport (small reactant crystallites can even be suspended in the liquid phase), thus the overall molecular mobility in saturated solutions surrounding the crystallites is increased. Moreover, the liquid phases can additionally give rise to ‘chemical’ effects, such as participating in hydrogen bonding or hydrogen transfer between reactants or products, or through the formation of solvation shells, thus providing one or more key physicochemical properties enabling the mechanism (at the molecular level) yielding the products observed. Hence, it is reasonably expected that the LAG liquid could play roles that are, to some extent, comparable with those in solutions, not merely leading to the loosening of molecules from solids by solvation, diffusion and mass transport enhancement (even without considerable solvation), but also by the formation of solvation shells, proton exchange and/or hydrogen-bonding with reactants or products. These chemical effects can enable reaction mechanisms not possible by neat mechanochemistry.
Furthermore, organic electron transfer reactions in solutions are generally very fast. They typically have large rate constants and low activation energies [41], and they are said to be “diffusion controlled”. Electrons move much faster than the nuclei, hence bond distances cannot considerably change during an electron transition, and this can be extended to electron transfer in the activated complex. However, the energy of the donor and acceptor orbitals must match before electron transfer, and, according to the Markus theory [42], a reorganization energy is needed, as it defines the barrier for electron transfer. The latter has as components an internal molecular reorganization energy, and another term due to the reorganization of the solvent shell.
Moreover, solvent polarity (implied by the solvent’s dielectric constant), determines the strength of electrical interactions among species in the medium [43]. Solvation spheres of polar solvents can stabilize charged species and polar transition states by field effects [42,44], with solvent dipoles being directly involved in the reaction. This can lead to a reduction in the activation energy of the chemical step, leading to the complete ionization of donors and acceptors, hence kinetically enabling the reaction mechanism (for the redox step) leading to ionic CTC. These ideas are represented in Scheme 2, and the following observations from our previous studies are consistent with them:
The formation of the green or black TTF-CA does not necessarily require mechanical energy, since both products have been also obtained by vapor digestion [18]. The mechanisms of vapor digestion reactions are not understood, however, it has been suggested the reactions happen in layers of mobile molecules around reactant crystallites [45]. Both reactions are spontaneous at ambient conditions, ΔG < 0, since the entropy changes for reactions between crystalline solids yielding crystalline products can be assumed to be small, most likely ΔH < 0.
Neat grinding (without added liquid), nonpolar and low-polarity LAG liquids yield the pseudo-neutral CTC [18] by LAG. In general, the green TTF-CA is formed first even when LAG with highly polar liquids is carried out. The green TTF-CA is speculated to be a ‘kinetic’ product, obtained first since the activation energy for the chemical step is lower than that for the redox reaction yielding the thermodynamically most stable ionic product. The reaction forming the green TTF-CA is spontaneous and very fast, and the activation energy might mostly reflect the retarding effects of molecular diffusion [41]. In LAG with low-polarity and nonpolar solvents, diffusion enhancement through reactant solubility, and an increased mass transport through the liquid phase (even if this is not a good solvent) is only expected.
The formation of ionic CTC implies a different mechanism for the redox reaction, likely mediated by the formation of solvation shells. These could stabilize a polar transition state leading to the ionic product reducing the activation energy for the reaction. The black TTF-CA is produced by using highly polar liquids/solvents for LAG (e.g., water, DMSO, and occasionally MeCN) in quantities over threshold values (see Figure 2) [18]. In vapor digestion, it is observed (after reaction times in the order of days) that the above solvents also spontaneously form the ionic polymorph from the brown TTF, although there is a noticeable reactivity difference between the brown and the orange TTF. The latter can yield small quantities of the ionic TTF-CA even from toluene [18].
A “reactant polymorph effect” is observed for mechanochemical and vapor digestion reactions. The quantities (as a threshold η) of water and DMSO required to produce the ionic CTC as a single phase are smaller if the orange TTF is used (see Figure 2), and the ionic form could be produced from MeCN only from the orange TTF. Currently, two potential causes (which could be acting together as well) can be formulated. The different reactivity of organic polymorphs in different crystal faces is not a new concept [39,46]. It is also known that topotactic effects can largely increase reaction rates [47]. Having this in mind, it is thought that the array of TTF molecules in columns and the crystallite habit exposing faces with TTF columns in the orange TTF (see Figure 1), resembling the array of TTF dicationic dimers in the product, could kinetically favor its formation (see Scheme 3).
Moreover, a second explanation is related to crystallite defects. Crystal defects are sites of increased free energy, wherein the chemical reactivity is larger [40], due to the disruption of the interatomic forces holding the crystal together, resulting in a reduced activation energy for reactions [48]. Li et al. argue that the number of defects tends to be larger in large crystals (compared with small crystals [36]), hence the reactivity of large crystals of the same material is increased. Their study used flufenamic acid as a model system, but the authors also mention that 4’-Me ROY large crystals are more reactive than small crystals. For flufenamic acid, a larger surface defect density on the reactive (100) faces was determined by AFM [36]. In our system, one could tentatively expect not only reactivity at the surfaces (see Figure 1 and Scheme 3), but also in crystallite defects (e.g., dislocations, which are said to act as pipes for mass transport), which could exist along the b-axis direction in between columns, thus exposing additional TTF columns; and producing columnar fragments while the orange TTF is ground, if acting as cleavage directions (expected due to weaker intermolecular forces than along the π-stacked TTF columns). It was also once observed that the orange TTF led to the formation of the ionic TTF-BA (with alternated stacks of donors and acceptors), while this did not happen from the brown TTF which remained mostly unreacted, in both cases using toluene for LAG. This is difficult to explain by only a topotactic effect (as in Scheme 3), but it could be rationalized in terms of an increased orange TTF reactivity due to defect types and density.
Furthermore, chemical kinetics studies under chosen and systematically varied experimental conditions are typically carried out toward understanding reaction mechanisms. The latter refers to how reactions occur at a molecular level, what happens to reactants in time and space as they react, and how new chemical substances are formed [36]. While studies in gases and solutions lead to rate constants and activation energies, and their changes under controlled conditions can be used to uncover the individual steps of a reaction, solid-state kinetic studies lead to reaction models, rate constants and activation energies, but information supporting individual mechanistic steps [49] is difficult to obtain. They are often used together with other experimental techniques (e.g., microscopy) to provide further insights toward uncovering reaction mechanisms. Although solid-state kinetics evolved from kinetics studies in homogeneous phases, the former often depend on additional parameters, such as particle sizes and geometrical shape [40], interface advance and defects in solids. Hence, it is expected there will be measurable differences in the rate laws and the reaction models used to fit the kinetic data for vapor digestions, and neat grinding, for LAG using nonpolar, low-polarity and polar liquids.
The kinetics of solid-state reactions can be studied using various solid-state techniques (XRPD, NMR, Raman spectroscopy, thermogravimetry, etc.) if the data can be transformed into a conversion fraction, α (the fraction of reactants that has reacted), defined as [49]:
α = ( m 0 m t ) ( m 0 m )
where m 0 is the initial mass of the product (or reactant), m t is the mass of the product (or reactant) at a reaction time t, and m is the mass of the product (or reactant) once the reaction has been completed. The determination of reaction rate laws and reaction models involves the measurement of the conversion fraction, α, as a function of the reaction time.
Currently, the main solid-state reaction models leading to a mathematical relation between α and t, have been quantitatively derived and reviewed [48,49,50]. Those are applicable to many different types of inorganic and organic reactions (decomposition of a single solid, reaction of a solid with a gas or liquid, and reactions between solids), such as thermal decompositions, dehydrations, metal oxidations, vapor digestions, mechanochemical reactions, etc. The reaction models are: (1) Nucleation models: Power law, Avrami–Erofeyev and Prout–Tompkins; (2) Geometrical contraction models: Contracting area and contracting volume; (3) Diffusion models: 1-D diffusion, 2-D diffusion, 3-D diffusion-Jander, and the Ginstling–Brounshtein 3D diffusion model; (4) Reaction order models: Zero-order, first-order, second-order, and third-order. Note that only the latter models have an equivalent in homogenous media, while the others are characteristic of the solid state, involving nucleation, the establishment of a reaction interface, and the advancing of such an interface into the bulk [48]. It is also a fundamental objective of solid-state kinetic studies to determine the rate-limiting processes [48].
During recent years, in situ kinetic studies of mechanochemical reactions using synchrotron XRPD [51,52,53,54] and Raman spectroscopy [55,56] are considerably advancing this field as promising methods to unravel mechanochemical mechanisms. The purpose of our study has been to use ex situ XRPD for solid-state kinetic studies (due to its availability at the laboratory) and to understand how the data obtained compares with that of in situ measurements. For this purpose, the kinetics of the mechanochemical synthesis of the green TTF-CA has been studied and it is planned to continue this study using in situ XRPD. The amounts of product synthesized by neat grinding were measured ex situ by quantitative phase analysis (QPA) from XRPD [57], stopping the reaction at various reaction times (in the order of minutes), and immediately collecting XRPD data. QPA using the internal standard method was used to calculate m t and α using Equation (1), as a function of the reaction time.

2. Materials and Methods

2.1. Mechanochemical Syntheses

The brown TTF polymorph was used as starting reactant in neat kinetic measurements. TTF (+99% purity) was purchased from ACROS Organics (Pittsburgh, PA, USA). Laboratory XRPD indicated that this material consisted of a mixture of mostly brown TTF and some orange polymorph. The powder was ground without solvent for 20 min in a 5100 SPEX SamplePrep® Mixer/mill (Metuchen, NJ, USA) to totally convert the orange (monoclinic) form to the brown (triclinic) polymorph. This was confirmed by laboratory XRPD. For LAG reactions with diethyl ether, TTF was used as received. Chloranil (+99% purity) was purchased from Sigma Aldrich (St. Louis, MO, USA) and used as received. Glass beads (average 9–13 μm diameter) were purchased from Sigma Aldrich (St. Louis, MO, USA) and ground without liquid additives for 20 min twice, to reduce their average size and produce fragments of irregular shapes. Respirable cristobalite (SiO2) NIST SRM 1879b was purchased from NIST (Gaithersburg, MD, USA) and used as an internal standard for quantitative phase analysis from XRPD.

2.2. Laboratory X-ray Powder Diffraction (XRPD)

The data for quantitative phase analysis (QPA) was collected using a D2 Phaser X-ray powder diffractometer (Bruker AXS, Madison, WI, USA) with Cu Kα radiation and Bragg-Brentano optics. Low-background Si flat-plate sample holders (2.5 cm diameter), a 1 mm air-scatter screen, a 3 mm detector slit, and a 0.6 mm divergence slit were used. The scans were performed from 8° to 40° in 2θ, with step size 0.02° and 0.2 s counting time per step. The diffracted X-rays were measured with a LynxEye position sensitive detector in continuous scan mode (linear mode) with a 1° opening. A Ni filter for Kβ radiation was used in the diffracted beam, and 2.5° soller slits were used in the incident and diffracted beams. Three consecutive scans were performed on each reaction batch. Each XRPD pattern was measured in approximately 10 min, and a systematic increase in the amount of product during the second and third scans was not observed (as it could be expected due to the continuation of the reaction after grinding finished). To average and reduce preferred orientation effects, the powder was slightly scrambled with a spatula on the sample holder and pressed with a glass slide in between the first and second, and second and third XRPD scans.

2.3. Isothermal Kinetic Profiles for the Neat and LAG Mechanochemical Synthesis of TTF-CA
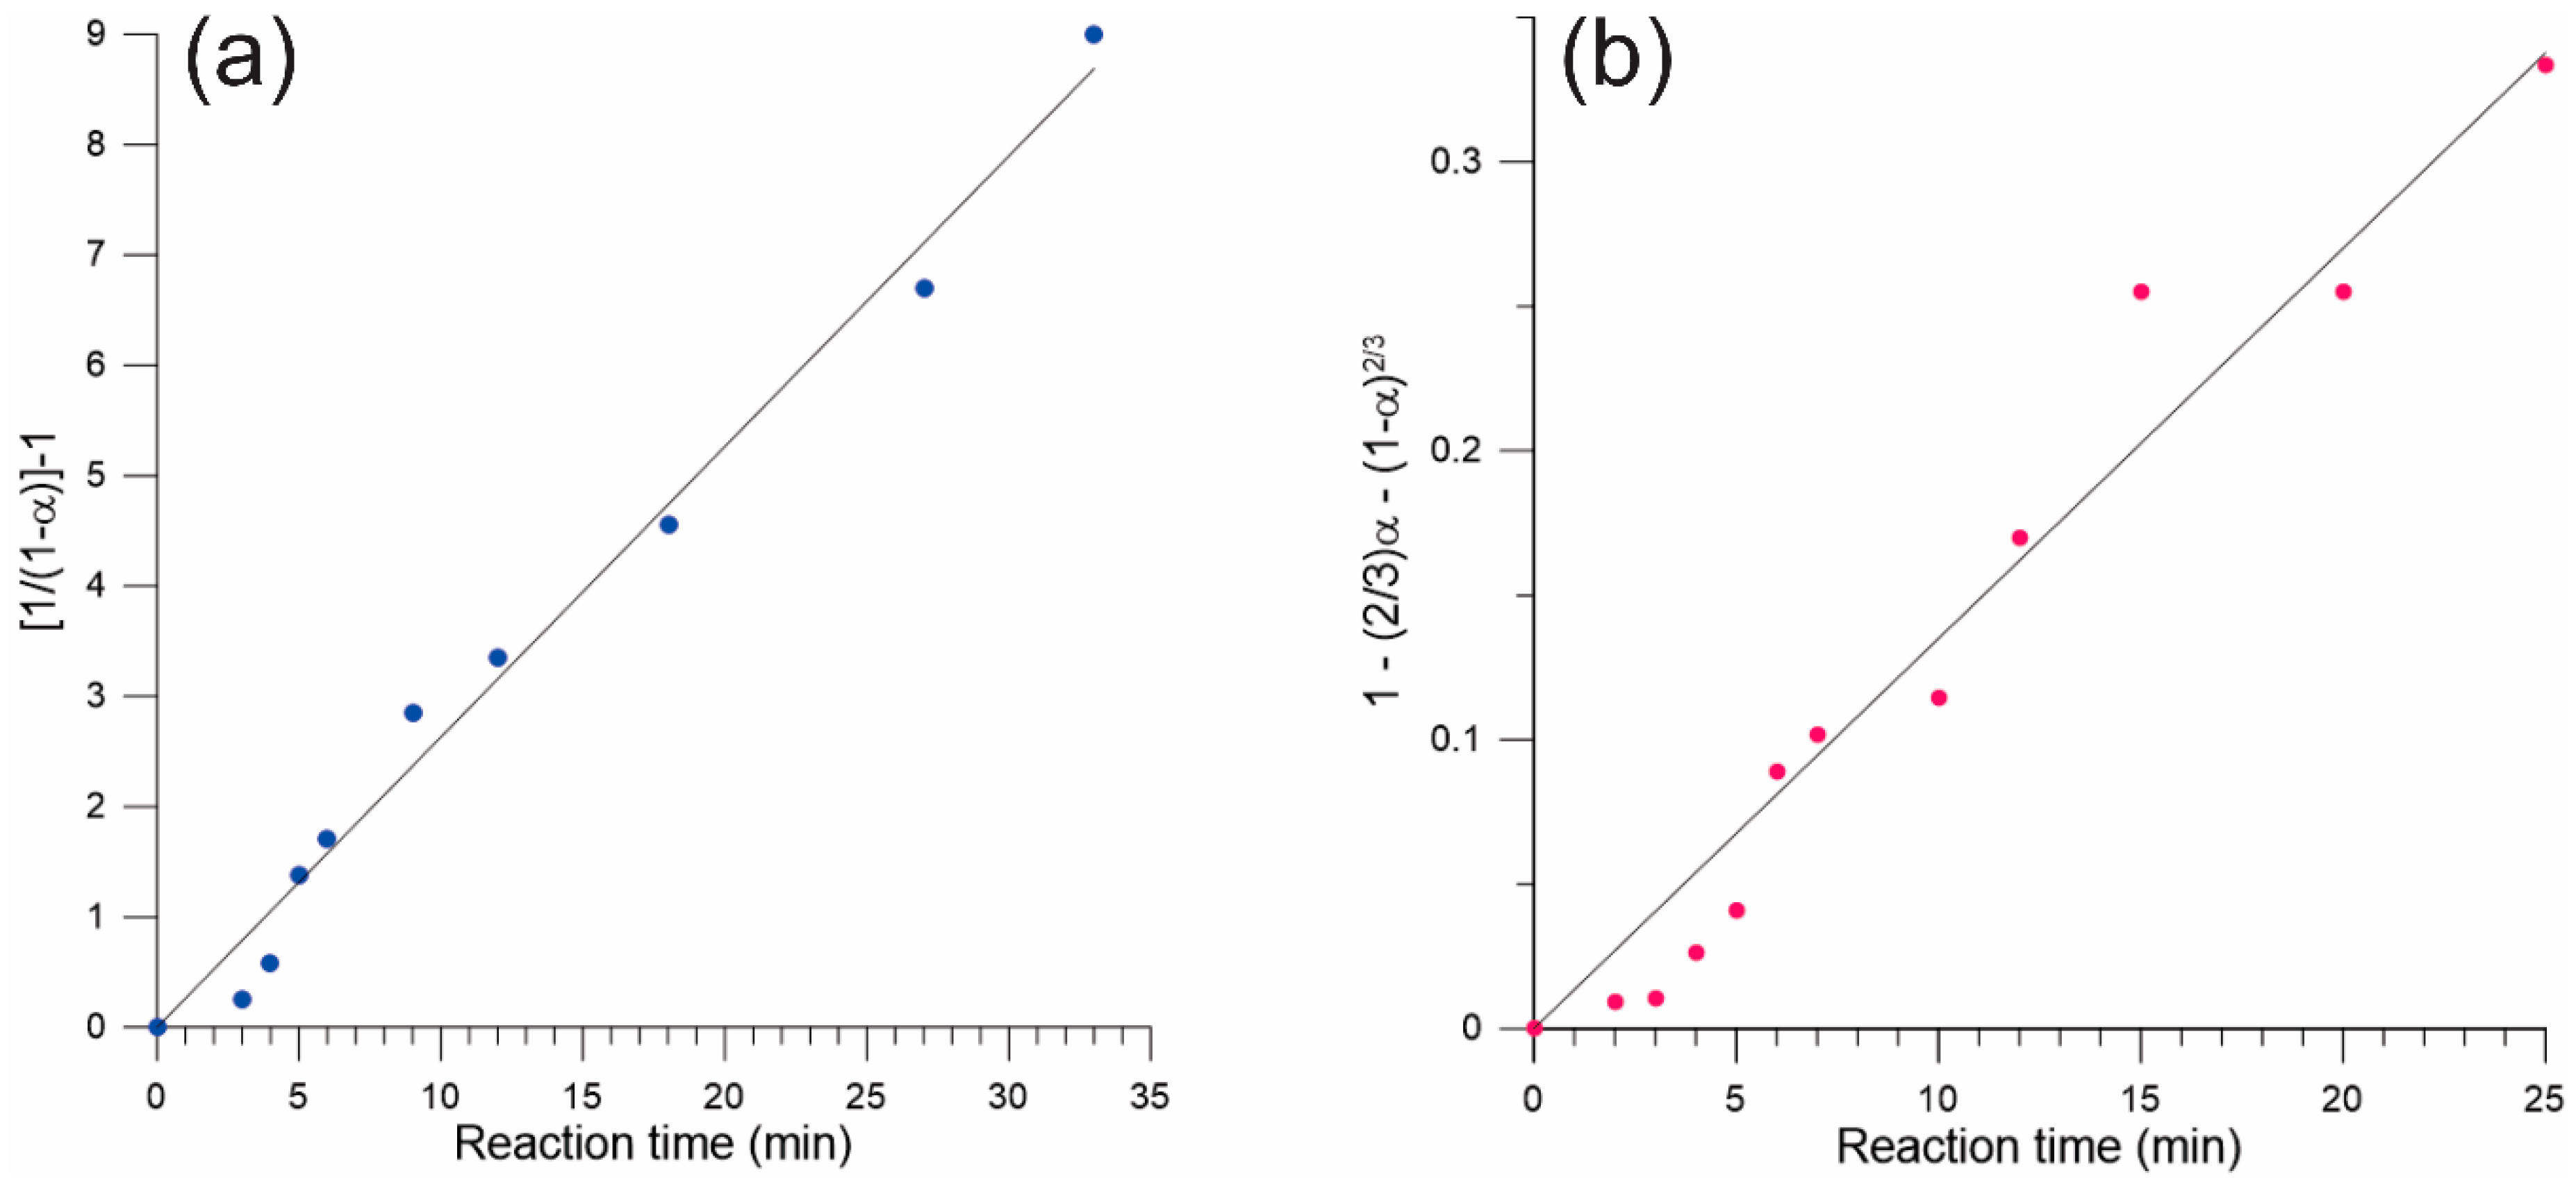
Fixed amounts of reactants in 1:1 molar ratio, 0.0102 g (5.0 × 10⁻⁵ moles) of TTF and 0.0123 g (5.0 × 10⁻⁵ moles) of CA were manually ground in an agate mortar with pestle for different time intervals ranging from 3 to 33 min. In all cases, 0.0725 g of ground glass beads and 0.0050 g of NIST standard were added to the reaction batches two minutes before the end of grinding, increasing the total mass to 0.1000 g. The mixture was ground for the remaining 2 min of reaction, simultaneously allowing the homogenization of the powders. At the end of the reaction, a uniform, light green color was observed in all cases. The glass was added to diminish the preferred orientation, to possibly slow down the reaction after grinding finished (due to the particles of the reactants being partially separated by the glass), and to completely fill-up the flat plate sample holder for the powder diffractometer, which is assumed to always be full for reproducible intensity measurements. The temperature of the reaction mixture was measured before and after grinding and it remained approximately constant at around 71 °F, thus the kinetic data is considered isothermal. The reaction times were monitored with digital timers. For the calculation of the conversion factor using Equation (1), the values,   m 0 = 0   g ;   m = 0.0225   g and m t = 0.1000   g × < w f T T F C A > were used, with < w f T T F C A > being the average TTF-CA weight fraction experimentally determined. For each α point, nine w f T T F C A values were calculated using three calibration curves based on the TTF-CA diffraction peaks at 12.3°, 13.1°and 16.9°, respectively, and the intensity ratios calculated from three consecutive XRPD scans of the reaction products. The calibration curves are shown in Figure S1 in the supplementary information file.
A similar procedure was carried out for the LAG synthesis of TTF-CA (green form), using diethyl ether (η = 1 μL/μg), only added to the mixture with a micropipette immediately before start grinding. New calibration curves (shown in Figure S2) were prepared using TTF-CA synthesized by LAG as indicated.

3. Results

Table 1 shows the experimental conditions used to calculate the kinetic profile for the neat mechanochemical reaction. The laboratory XRPD data is shown in Figure 3. Note that the calculation of α could have also been done (three times), using the data corresponding to each diffraction peak and calibration curve separately. However, in that case it is seen that the data quality is only sufficient to determine trends in α. There are two main sources of error in these experiments, one of them is preferred orientation in the powder, and the other is the use of a mortar and pestle for the reactions. Optimally, a mechanical grinder should be used to control the mechanical energy input to the system and its variation along the reaction time. Moreover, the temperature of the grinding jar must be kept constant as well. Such experiments are planned using in situ measurements by XRPD. Nevertheless, the authors consider that the analysis provided already leads to valuable insights into mechanistic aspects of these reactions.
An analogous procedure was used to determine the isothermal kinetic profile of the LAG reaction using diethyl ether (η = 1 μL/μg). Table 2 shows the experimental conditions used, and Figure 4 shows an overlay of the XRPD scans.
The isothermal kinetic profiles for the neat and LAG reaction are graphically represented in Figure 5. It is evident that the LAG reaction is completed faster than the neat process. However, these profiles must be optimally fitted with a known reaction model [49], leading to rate constants and the nature of the rate determining processes slowing down the reaction. This analysis is done by calculating the various known functions of α according to each model [49] and representing them graphically as a function of the reaction time. The model leading to a straight line with slope k (the rate constant), with the highest R2, is the one deemed correct. The reaction models, as previously mentioned, are [49]: (1) Nucleation models: Power law (P2, P3 and P4), Avrami–Erofeyev (A2, A3 and A4), Prout–Tompkins (B1); (2) Geometrical contraction models: Contracting area (R2) and contracting volume (R3); (3) Diffusion models: the 1-D diffusion (D1), 2-D diffusion (D2), 3-D diffusion-Jander (D3), and the Ginstling–Brounshtein model (D4); (4) Reaction order models: Zero-order (F0/R1), first-order (F1), second-order (F2), and third-order (F3).
This analysis led to the conclusion that a second-order rate law corresponds to the neat mechanochemical reaction, with a rate constant k = 0.263 min−1 and R2 = 0.994; while the kinetic profile of the LAG reaction is best fitted with a Ginstling–Brounshtein 3D diffusion-controlled model, with a rate constant k = 0.0135 min−1 and R2 = 0.979. The graphical representation of the data is shown in Figure 6. Figures S3 and S4 additionally show that the data for the neat mechanochemical reaction shown in Figure 6a is not satisfactorily fitted with the 3D diffusion-controlled model, and vice versa.

4. Discussion

The results were interpreted as follows. The reaction proceeded in both cases from an equimolar mixture of TTF and CA, with TTF-CA (green polymorph) as the only product, hence (1 − αTTF-CA) = αTTF = αCA. The second-order rate law for the neat process is consistent with a first order in TTF and in CA. This reaction order model is analogous to a second order reaction kinetics in a homogeneous phase (e.g., solution). Reaction order models have been found in mechanochemical processes and are sometimes called “pseudo-fluid” models [58]. The rates are considered to depend only on the frequency of reactive collisions between reactants, as the rates in a ball mill increase with the milling frequency [58]. While the temperature of the grinding jar also increases with the grinding frequency [59], this is deemed to have a smaller effect on the rates than the increase in the collision’s frequency and energy. Moreover, organic electron transfer reactions (e.g., involving a radical anion and the neutral molecule in solution) have generally large rate constants (107–1010 M−1 s−1 and low activation energies, so they are sometimes called “diffusion controlled” [41]. The activation energy of the reaction between a radical anion and the neutral molecule above can be considered related to the viscosity of the solution, with the reaction occurring at each reactant encounter.
As Ma et al. point out [58], the overall kinetics is expected to be a combination of the kinetics of the chemical step (presumably very fast in organic electron transfer reactions), and the frequency of reactive contacts depending on the milling frequency. Short-lived intermediates are not known or suspected in this system, since chemical bonds are not broken or formed. One could even tentatively propose an elementary reaction leading to a first order kinetics with respect to each reactant, and a second order overall. Since the composition of the activated complex might be deduced in that case from the second-order rate law [43], this would lead to an activated complex with 1:1 stoichiometry for TTF and CA, respectively. Moreover, for a diffusion-controlled reaction [43], the rate is controlled by the rate of formation of an encounter complex, which in turn depends on the temperature and the solution viscosity. Electron transfer reactions are a reaction type where diffusional control can be observed [43]. Electron transfer occurs by tunneling at a rate given mostly by the height of the HOMO-LUMO barrier, and its width, given by the distance of closest approach [43]. If the electron transfer is fast, then the reaction rates are controlled by diffusion, leading to reactant encounters.
For the LAG reaction, the same products are formed, for which the mechanism of the chemical step (redox reaction) is presumably the same. However, the diffusion process among solids and mass transport must occur differently. This is, the reactants are contained in separate crystallites with reaction interfaces around their surfaces (see Scheme 4), also presumably in contact with a diethyl ether saturated solution containing the product, and the product crystallites being generated. Since the redox reaction is most likely very fast in the wetted reaction interfaces around TTF and CA crystallites (once the reactants encounter each other), in the LAG case, the rate-controlling process seems to be the diffusion of the reactants through the reaction interfaces toward the formation of additional product. This is schematically shown in Scheme 4.

5. Conclusions

A second-order rate law has been determined for the neat mechanochemical reaction between TTF and CA yielding the green, pseudo-neutral polymorph. The rates are likely only controlled by reactant encounters (diffusional control). While the solvent effects leading to the formation of the black, ionic polymorph have not yet been experimentally investigated, the LAG reaction with diethyl ether (1 μL/mg) occurs by a Ginstling–Brounshtein 3D diffusion-controlled model, wherein the rate determining process involves the diffusion of the reactants through a saturated solution containing the products, wherein once they encounter each other, electron transfer occurs very rapidly giving rise to additional product. The liquid phase enhances overall diffusion, resulting in a faster reaction completion than for neat grinding.
Our work also shows that chemical kinetics from laboratory XRPD (although not affording the determination of rapidly formed and reacted intermediates), can be used to gather useful information to better understand the solid-state kinetics of mechanochemical reactions in the laboratory. The combination of this methodology with in situ measurements by spectroscopic methods, typically Raman spectroscopy, is a promising approach for the elucidation of mechanistic aspects of mechanochemical reactions, due to short-lived species or intermediates could be detected by spectroscopy, while diffraction methods can be used for quantitative crystal phase analysis, thus they are optimum for the identification of different polymorphs of the products and reactants and polymorphic transitions, which is not necessarily doable from spectroscopic methods. Undoubtedly, in situ monitoring using synchrotron XRPD is the most capable and versatile alternative regarding diffraction techniques, however access to large experimental facilities (often subjected to limited beam time) is required. Preferred orientation can be an important obstacle when the most common reflection geometry from flat plate holders in laboratory XRPD instruments is used. However, sieving the powders or adding amorphous phases can be used to diminish its effects. These studies may prove to be quite useful prior to accessing synchrotron facilities.

Supplementary Materials

The following are available online at https://www.mdpi.com/2073-4352/10/6/482/s1: Calibration curves for quantitative phase analysis and tables summarizing the compositions used. Figure S1: Calibration curves for QPA of the green form of TTF-CA in the neat mechanochemical reaction; Table S1: Composition of the mixtures used to measure the calibration curves shown in Figure S1; Table S2: Composition of the mixtures used to measure the calibration curves shown in Figure S2; Figure S2: Calibration curves for QPA of the green form of TTF-CA in the LAG reaction; Figure S3: Functional dependence given by the Ginstling-Brounshtein 3D diffusion-controlled reaction model applied to the neat meachanochemical reaction; Figure S4: Functional dependence given by the second order reaction model applied to the LAG reaction.

Author Contributions

Conceptualization, S.P.; methodology, R.C., M.K.G. and S.P.; formal analysis, R.C., M.K.G. and S.P.; resources, S.P.; writing-original draft preparation, S.P.; writing-review and editing, S.P.; visualization, S.P.; supervision, S.P.; project administration, S.P.; funding acquisition, S.P. All authors have read and agreed to the published version of the manuscript.

Funding

The authors gratefully acknowledge funding from the PURS (Program for Undergraduate Research and Scholarship) from the Perry Honors College of Old Dominion University.

Acknowledgments

The authors gratefully acknowledge administrative and other support from the Chemistry & Biochemistry department at Old Dominion University.

Conflicts of Interest

The authors declare no conflict of interest. The funders had no role in the design of the study; in the collection, analyses, or interpretation of data; in the writing of the manuscript, or in the decision to publish the results.

References

  1. Todres, Z.V. Organic Mechanochemistry and Its Practical Applications; CRC Press: Boca Raton, FL, USA, 2006. [Google Scholar]
  2. Margetic, D.; Strukil, V. Mechanochemical Organic Synthesis; Elsevier Inc.: Amsterdam, The Netherlands, 2016. [Google Scholar]
  3. Trask, A.V.; Jones, W. Crystal engineering of organic cocrystals by the solid-state grinding approach. Top. Curr. Chem. 2005, 254, 41–70. [Google Scholar] [CrossRef]
  4. Friščić, T. New opportunities for materials synthesis using mechanochemistry. J. Mater. Chem. 2010, 20, 7599–7605. [Google Scholar] [CrossRef]
  5. Friščić, T.; Jones, W. Recent advances in understanding the mechanism of cocrystal formation via grinding. Cryst. Growth Des. 2009, 9, 1621–1637. [Google Scholar] [CrossRef]
  6. James, S.L.; Adams, C.J.; Bolm, C.; Braga, D.; Collier, P.; Friščić, T.; Grepioni, F.; Harris, K.D.M.; Hyett, G.; Jones, W.; et al. Mechanochemistry: Opportunities for new and cleaner synthesis. Chem. Soc. Rev. 2012, 41, 413–447. [Google Scholar] [CrossRef] [Green Version]
  7. Fischer, F.; Wenzel, K.-J.; Rademann, K.; Emmerling, F. Quantitative determination of activation energies in mechanochemical reactions. Phys. Chem. Chem. Phys. 2016, 18, 23320–23325. [Google Scholar] [CrossRef] [Green Version]
  8. Braga, D.; Maini, L.; Grepioni, F. Mechanochemical Preparation of Co-Crystals. Chem. Soc. Rev. 2013, 42, 7638–7648. [Google Scholar] [CrossRef]
  9. Weyna, D.R.; Shattock, T.; Vishweshwar, P.; Zaworotko, M.J. Synthesis and structural characterization of cocrystals and pharmaceutical cocrystals: Mechanochemistry vs. slow evaporation from solution. Cryst. Growth Des. 2009, 9, 1106–1123. [Google Scholar] [CrossRef]
  10. Hasa, D.; Jones, W. Screening for new pharmaceutical solid forms using mechanochemistry: A practical guide. Adv. Drug Deliv. Rev. 2017, 117, 147–161. [Google Scholar] [CrossRef]
  11. Ling, A.R.; Baker, J.L. Derivatives of Quinhydrone. J. Am. Chem. Soc. 1893, 63, 1314–1327. [Google Scholar] [CrossRef]
  12. Kuroda, R.; Imai, Y.; Tajima, N. Generation of a co-crystal phase with novel coloristic properties via solid state grinding procedures. Chem. Commun. 2002, 2848–2849. [Google Scholar] [CrossRef]
  13. Imai, Y.; Tajima, N.; Sato, T.; Kuroda, R. Molecular recognition in solid-state crystallization: Colored chiral adduct formations of 1,1′-Bi-2-napthol derivatives and benzoquinone with a third component. Chirality 2002, 14, 604–609. [Google Scholar] [CrossRef]
  14. Chemerisov, S.D.; Grinberg, O.Y.; Tipikin, D.S.; Lebedev, Y.S.; Kurreck, H.; Möbius, K. Mechanically induced radical pair formation in porphyrin-quinone and related donor-acceptor mixtures. unusual stability and zero-field splittings. Chem. Phys. Lett. 1994, 218, 353–361. [Google Scholar] [CrossRef]
  15. Tipikin, D.S.; Lebedev, Y.S.; Rieker, A. Mechanochemical generation of stable radical species. Oxidation of pyrocatechols. Chem. Phys. Lett. 1997, 272, 399–404. [Google Scholar] [CrossRef]
  16. Braga, D.; Grepioni, F. Reactions between or within Molecular Crystals. Angew. Chem.-Int. Ed. 2004, 43, 4002–4011. [Google Scholar] [CrossRef]
  17. Bernstein, J. Polymorphism in Molecular Crystals; Clarendon Press: Oxford, UK, 2002. [Google Scholar]
  18. Lapidus, S.H.; Naik, A.; Wixtrom, A.; Massa, N.E.; Ta Phuoc, V.; Del Campo, L.; Lebègue, S.; Ángyán, J.G.; Abdel-Fattah, T.; Pagola, S. The black polymorph of TTF-CA: TTF polymorphism and solvent effects in mechanochemical and vapor digestion syntheses, FT-IR, crystal packing, and electronic structure. Cryst. Growth Des. 2014, 14, 91–100. [Google Scholar] [CrossRef]
  19. Mohamud, S.; Ta Phuoc, V.; Massa, N.E.; Pagola, S. TTF-DDQ: Two “Green” synthetic routes, crystal structure and band gap from FT-IR spectroscopy. Synth. Met. 2016, 214, 71–75. [Google Scholar] [CrossRef]
  20. Jones, J.; Ta Phuoc, V.; Del Campo, L.; Massa, N.E.; Brown, C.M.; Pagola, S. Accessing new charge transfer complexes by mechanochemistry: A tetrathiafulvalene chloranilic acid polymorph containing segregated tetrathiafulvalene stacks. Cryst. Growth Des. 2019, 19, 4970–4980. [Google Scholar] [CrossRef]
  21. Pagola, S.; Polymeros, A.; Kourkoumelis, N. WinPSSP: A revamp of the computer program PSSP and its performance solving the crystal structures of small organic compounds and solids of biological and pharmaceutical interest. J. Appl. Crystallogr. 2017, 50, 293–303. [Google Scholar] [CrossRef] [Green Version]
  22. Pagola, S.; Stephens, P.W. PSSP, a computer program for the crystal structure solution of molecular materials from X-ray powder diffraction data. J. Appl. Crystallogr. 2010, 43, 370–376. [Google Scholar] [CrossRef] [Green Version]
  23. Altheimer, B.D.; Pagola, S.; Zeller, M.; Mehta, M.A. Mechanochemical conversions between crystalline polymorphs of a complex organic solid. Cryst. Growth Des. 2013, 13, 3447–3453. [Google Scholar] [CrossRef]
  24. Bendikov, M.; Wudl, F.; Perepichka, D.F. Tetrathiafulvalenes, oligoacenenes, and their buckminsterfullerene derivatives: The brick and mortar of organic electronics. Chem. Rev. 2004, 104, 4891–4945. [Google Scholar] [CrossRef]
  25. Schultz, A.J.; Stucky, G.D.; Blessing, R.H.; Coppens, P. The temperature dependence of the crystal and molecular structure of. D 2, 2′-Bi-1,3-dithiole [TTF] 7,7,8,8-tetracyano-p-quinodimethane [TCNQ]. J. Am. Chem. Soc. 1976, 98, 3194–3201. [Google Scholar] [CrossRef]
  26. Zhang, L.; Fakhouri, S.M.; Liu, F.; Timmons, J.C.; Ran, N.A.; Briseno, A.L. Chalcogenoarene semiconductors: New ideas from old materials. J. Mater. Chem. 2011, 21, 1329–1337. [Google Scholar] [CrossRef]
  27. Ellern, A.; Bernstein, J.; Becker, J.Y.; Zamir, S.; Shahal, L.; Cohen, L. A new polymorphic modification of tetrathiafulvalene. Crystal structure, lattice energy and intermolecular interactions. Chem. Matter. 1994, 6, 1378–1385. [Google Scholar] [CrossRef]
  28. Batsanov, A.S. Tetrathiafulvalene revisited. Acta Crystallogr. Sect. C Cryst. Struct. Commun. 2006, C62, o501–o504. [Google Scholar] [CrossRef]
  29. Herranz, M.Á.; Sánchez, L.; Martín, N. Tetrathiafulvalene: A paradigmatic electron donor molecule. Phosphorus. Sulfur. Silicon Relat. Elem. 2005, 180, 1133–1148. [Google Scholar] [CrossRef]
  30. Kharisov, B.I.; Méndez-Rojas, M.A.; Garnovskii, A.D.; Ivakhnenko, E.P.; Ortiz-Méndez, U. Review: Coordination chemistry of o-quinone complexes. J. Coord. Chem. 2002, 55, 745–770. [Google Scholar] [CrossRef]
  31. Dressel, M. Ordering phenomena in quasi-one-dimensional organic conductors. Naturwissenschaften 2007, 94, 527–541. [Google Scholar] [CrossRef] [Green Version]
  32. Ouahab, L.; Yagubskii, E. (Eds.) Organic Conductors, Superconductors and Magnets: From Synthesis to Molecular Electronics; NATO Science Series; Kluwer Academic Publishers: Dordrecht, The Neatherlands, 2004. [Google Scholar]
  33. Masino, M.; Castagnetti, N.; Girlando, A.; Chimiche, S.; Ambientale, S.; Parma, I.; Area, P.; Parma, U.; Parma, I. Phenomenology of the neutral-ionic valence instability in mixed stack charge-transfer crystals. Crystals 2017, 7, 108. [Google Scholar] [CrossRef] [Green Version]
  34. Le Cointe, M.; Lemée-Cailleau, M.H.; Cailleau, H.; Toudic, B.; Toupet, L.; Heger, G.; Moussa, F.; Schweiss, P.; Kraft, K.H.; Karl, N. Symmetry breaking and structural changes at the neutral-to-ionic transition in tetrathiafulvalene-p-chloranil. Phys. Rev. B 1995, 51, 3374–3386. [Google Scholar] [CrossRef]
  35. Girlando, A.; Marzola, F.; Pecile, C. Vibrational spectroscopy of mixed stack organic semiconductors: Neutral and ionic phases of tetrathiafulvalene-chloranil (TTF-CA) charge transfer complex. J. Chem. Phys. 1983, 79, 1075–1085. [Google Scholar] [CrossRef]
  36. Li, H.; Wen, H.; Stowell, J.G.; Morris, K.R.; Byrn, S.R. Crystal quality and physical reactivity in the case of flufenamic acid (FFA). J. Pharm. Sci. 2010, 99, 3839–3848. [Google Scholar] [CrossRef]
  37. Kaupp, G. Solid-state molecular syntheses: Complete reactions without auxiliaries based on the new solid-state mechanism. CrystEngComm 2003, 5, 117–133. [Google Scholar] [CrossRef]
  38. Paul, I.C.; Curtin, D.Y. Thermally induced organic reactions in the solid state. Acc. Chem. Res. 1973, 6, 217–225. [Google Scholar] [CrossRef]
  39. Chen, X.; Li, T.; Morris, K.R.; Byrn, S.R. Crystal Packing and chemical reactivity of two polymorphs of flufenamic acid with ammonia. Mol. Cryst. Liq. Cryst. 2002, 381, 121–131. [Google Scholar] [CrossRef]
  40. Khawan, A.; Flanagan, D.R. Basics and applications of solid-state kinetics: A pharmaceutical perspective. J. Pharm. Sci. 2006, 95, 472–498. [Google Scholar] [CrossRef]
  41. Chang, R. ESR study of organic electron transfer reactions. J. Chem. Educ. 1970, 47, 563–568. [Google Scholar] [CrossRef]
  42. Anslyn, E.V.; Dougherty, D.A. Modern Physical Organic Chemistry; University Science Books: Sausalito, CA, USA, 2006. [Google Scholar]
  43. Buncel, E.; Stairs, R.A. Solvent Effects in Chemistry, 2nd ed.; John Wiley and Sons, Inc.: Hoboken, NJ, USA, 2016. [Google Scholar]
  44. Buncel, E.; Wilson, H. Solvent effects on rates and equilibria: A practical approach. J. Chem. Educ. 1980, 57, 629. [Google Scholar] [CrossRef]
  45. Bowmaker, G.A. Solvent-assisted mechanochemistry. Chem. Commun. 2013, 49, 334–348. [Google Scholar] [CrossRef]
  46. Chen, X.; Stowell, J.G.; Morris, K.R.; Byrn, S.R. Quantitative study of solid-state acid-base reactions between polymorphs of flufenamic acid and magnesium oxide using X-ray powder diffraction. J. Pharm. Biomed. Anal. 2010, 51, 866–874. [Google Scholar] [CrossRef]
  47. Varga, K.; Volarić, J.; Vančik, H. Crystal disordering and organic solid-state reactions. CrystEngComm 2015, 17, 1434–1438. [Google Scholar] [CrossRef]
  48. Bamford, C.H.; Tipper, C.F.H. (Eds.) Comprehensive Chemical Kinetics. Reactions in the Solid State; Elsevier Scientific Publishing Company: Amsterdam, The Netherlands, 1980. [Google Scholar]
  49. Khawam, A.; Flanagan, D.R. Solid-state kinetic models: Basics and mathematical fundamentals. J. Phys. Chem. B 2006, 110, 17315–17328. [Google Scholar] [CrossRef]
  50. Byrn, S.R.; Pfeiffer, R.R.; Stowell, J.G. Solid-State Chemistry of Drugs, 2nd ed.; SSCI, Inc.: West Lafayette, IN, USA, 1999. [Google Scholar]
  51. Friščić, T.; Halasz, I.; Beldon, P.J.; Belenguer, A.M.; Adams, F.; Kimber, S.A.; Honkimaki, V.; Dinnebier, R.E. Real-time and in situ monitoring of mechanochemical milling reactions. Nat. Chem. 2013, 5, 66–73. [Google Scholar] [CrossRef] [PubMed]
  52. Halasz, I.; Kimber, S.A.J.; Beldon, P.J.; Belenguer, A.M.; Adams, F.; Honkimäki, V.; Nightingale, R.C.; Dinnebier, R.E.; Friščić, T. In situ and real-time monitoring of mechanochemical milling reactions using synchrotron X-ray diffraction. Nat. Protoc. 2013, 8, 1718–1729. [Google Scholar] [CrossRef]
  53. Užarević, K.; Štrukil, V.; Mottillo, C.; Julien, P.A.; Puškarić, A.; Friščić, T.; Halasz, I. Exploring the effect of temperature on a mechanochemical reaction by in situ synchrotron powder X-ray diffraction. Cryst. Growth Des. 2016, 16, 2342–2347. [Google Scholar] [CrossRef]
  54. Halasz, I.; Puskaric, A.; Kimber, S.A.J.; Beldon, P.J.; Belenguer, A.M.; Adams, F.; Honkimaki, V.; Dinnebier, R.E.; Patel, B.; Jones, W.; et al. Real-time in situ powder X-ray diffraction monitoring of mechanochemical synthesis of pharmaceutical cocrystals. Angew. Chem. Int. Ed. 2013, 52, 11538–11541. [Google Scholar] [CrossRef]
  55. Užarević, K.; Halasz, I.; Friščić, T. Real-time and in situ monitoring of mechanochemical reactions: A new playground for all chemists. J. Phys. Chem. Lett. 2015, 6, 4129–4140. [Google Scholar] [CrossRef]
  56. Gracin, D.; Štrukil, V.; Friščić, T.; Halasz, I.; Užarević, K. Laboratory real-time and in situ monitoring of mechanochemical milling reactions by Raman spectroscopy. Angew. Chem.-Int. Ed. 2014, 53, 6193–6197. [Google Scholar] [CrossRef] [Green Version]
  57. Zevin, L.S.; Kimmel, G. Quantitative X-ray Diffractometry; Mureinik, I., Ed.; Springer: New York, NY, USA, 1995. [Google Scholar]
  58. Ma, X.; Yuan, W.; Bell, S.E.J.; James, S.L. Better understanding of mechanochemical reactions: Raman monitoring reveals surprisingly simple “pseudo-fluid” model for a ball milling reaction. Chem. Commun. 2014, 50, 1585–1587. [Google Scholar] [CrossRef] [Green Version]
  59. Julien, P.A.; Malvestiti, I.; Friščić, T. The effect of milling frequency on a mechanochemical organic reaction monitored by in situ Raman spectroscopy. Beilstein J. Org. Chem. 2017, 13, 2160–2168. [Google Scholar] [CrossRef] [Green Version]
Scheme 1. (a) The electron donor tetrathiafulvalene (TTF); and electron acceptors studied: (b) chloranil (CA) for Q=Cl; bromanil (BA) for Q=Br. (c) 2,3-dicyano-5,6-dichloro-p-benzoquinone (DDQ). (d) Chloranilic acid (CAH2) for Q=Cl; bromanilic acid (BAH2) for Q=Br. (e) 2,5-dichloro-p-benzoquinone for Q=Cl; 2,5-dihydroxy-p-benzoquinone for Q=OH. (f) Tetracyanoquinodimethane (TCNQ).
Crystals 10 00482 sch001
Figure 1. (a) Left side: Crystal structure of the orange, monoclinic TTF polymorph composed of π-stacked TTF columns running parallel to the b-axis. The interplanar distance between molecules is 3.624 Å. Center: Crystallites under the optical microscope. The dimensions of the largest crystallite are 0.99 mm × 0.25 mm. (b) Left: Crystal structure of the brown, triclinic TTF polymorph lacking π-stacked TTF, viewed along the b-axis direction. Center: Crystallites under the optical microscope. The largest dimensions are 0.68 mm × 0.58 mm. (c) The faces of an orange TTF crystallite indexed by single crystal diffraction. The marked (100) and (001) faces expose columns of π-stacked TTF at the crystallite surfaces [18].
Crystals 10 00482 g001
Figure 2. (a) Neat grinding and liquid-assisted grinding (LAG) (4 μL/mg) with low and medium-polarity solvents (toluene, ethyl acetate and acetone), yield the green TTF-CA polymorph. Its room temperature crystal structure (right side) consists of columnar stacks of alternating, equidistant donors and acceptors. The orange TTF (but not the brown) yields the ionic TTF-CA by LAG with MeCN (4 μL/mg). (b) The black (ionic) polymorph is obtained as a single phase by LAG with the highly polar liquids water and DMSO used above threshold η, which are smaller for the orange TTF (2 and 0.02 μL/mg respectively) than for the brown TTF (4 μL/mg for both liquids) [18]. The crystal structure of the ionic form containing columns of dicationic dimers (TTF+•)2 and selected intermolecular distances are shown at the center and right. C = gray, Cl = green, O = red, S = yellow and H = light gray.
Crystals 10 00482 g002
Scheme 2. Representation of the expected activation free energy change (ΔG) at ambient temperature for the formation of activated complexes from the reactants (left side) yielding the green pseudo-neutral TTF-CA, the black ionic TTF-CA stabilized by a solvation shell of a polar solvent (as in LAG, vapor digestion or a solution), and the black ionic TTF-CA without a solvation shell. At the right, bottom side the free energy changes (ΔG) for the formation of the green and black TTF-CA products are indicated. The black, ionic TTF-CA is the thermodynamically most stable form.
Crystals 10 00482 sch002
Scheme 3. Representation of a topotactic effect potentially enhancing the formation of the ionic TTF-CA from the orange TTF. The crystal structure of the orange TTF (left side) is made of columns of π-stacked TTF separated by 3.624 Å, while the crystallite morphology (right side) shows the (100) and (001) faces exposed in the crystallite surfaces. This combination of crystal structure and morphology could facilitate the formation of the ionic product, which also possesses columns of radical cation dimers, (TTF+•)2, (at the center of the figure) by vapor digestion and LAG.
Crystals 10 00482 sch003
Figure 3. Overlay of the XRPD data, from bottom to top: One of the three 10 min consecutive XRPD scans of the neat mechanochemical products collected immediately after grinding TTF and CA for: 3 min (black), 4 min (red), 5 min (blue), 6 min (violet), 9 min (magenta), 12 min (brown), 18 min (orange), 27 min (green) and 33 min (light blue). Note the peak of the standard at 22.0° common to all patterns. After the calculation of intensity ratios from each scan, the calibration curves in Figure S1 were used for the calculation of the weight fraction of TTF-CA (green polymorph) in each reaction mixture, m t   and the conversion fraction α using Equation (1).
Crystals 10 00482 g003
Figure 4. From bottom to top: One of the three XRPD scans of the mechanochemical products collected immediately after the LAG reaction of TTF and CA (using diethyl ether, 1 μL/mg), for 2 min (light brown), 3 min (green), 4 min (magenta), 5 min (orange), 6 min (teal), 7 min (burgundy), 10 min (blue), 12 min (violet), 15 min (red), 20 min (light blue) and 25 min (black). After the calculation of intensity ratios from the scans, the calibration curves in Figure S2 were used for the calculation of the weight fraction of TTF-CA (green polymorph) in each reaction mixture, and the conversion fraction α reported in Table 2.
Crystals 10 00482 g004
Figure 5. The isothermal reaction kinetic profiles for: (a) the neat mechanochemical synthesis of TTF-CA (blue circles), and (b) the LAG synthesis with diethyl ether, η = 1 μL/mg (red circles). The error bars in α graphically represent the Δα values of Table 1 and Table 2, respectively.
Crystals 10 00482 g005
Figure 6. The isothermal integral reaction models for: (a) the neat mechanochemical synthesis of TTF-CA (blue circles), k = 0.263 min−1 and R2 = 0.994; and (b) the LAG synthesis with diethyl ether, η = 1 μL/mg (magenta circles), k = 0.0135 min−1 and R2 = 0.979.
Crystals 10 00482 g006
Scheme 4. Tentative representation of CA, TTF and TTF-CA crystallites surrounded by a saturated solution of the LAG liquid, wherein the redox reaction is very fast upon reactant encounters. The arrows indicate that CA molecules must diffuse through the reaction interface to reach TTF molecules and vice versa.
Crystals 10 00482 sch004
Table 1. Reaction times; TTF-CA weight fractions ( w f T T F C A ) averaged from three consecutive XRPD scans using the calibration curves based in the diffraction peaks at 12.3°, 13.1° and 16.9°, respectively; the average of the nine w f T T F C A values (< w f T T F C A >); its standard deviation (σ); the calculated α, and an estimated uncertainty, Δ α = α × σ 3   < w f T T F C A > .
Time (min) w f T T F C A   ( 12.3 ° ) w f T T F C A   ( 13.1 ° ) w f T T F C A   ( 16.9 ° ) < w f T T F C A > σα ± Δα
0-----0 ± 0
30.0330.0600.0400.0440.010.20 ± 0.02
40.0660.1030.0800.0830.020.37 ± 0.04
50.1210.1370.1310.1300.020.58 ± 0.03
60.1090.1580.1600.1430.040.63 ± 0.05
90.1680.1680.1600.1660.010.74 ± 0.02
120.1540.1900.1790.1740.020.77 ± 0.03
180.1640.1790.2110.1850.030.82 ± 0.04
270.1920.2100.1880.1970.020.87 ± 0.03
330.1830.2030.2190.2020.020.90 ± 0.04
Table 2. Reaction times; TTF-CA weight fractions ( w f T T F C A ) averaged from three consecutive XRPD scans using the calibration curves based in the diffraction peaks at 12.3°, 13.1° and 16.9°, respectively; the average of the nine w f T T F C A values (< w f T T F C A >); its standard deviation (σ); the calculated α and an estimated uncertainty, Δ α = α × σ 3   < w f T T F C A > .
Time (min) w f T T F C A   ( 12.3 ° ) w f T T F C A   ( 13.1 ° ) w f T T F C A   ( 16.9 ° ) < w f T T F C A > σα ± Δα
0-----0 ± 0
20.0770.0560.0490.0610.020.27 ± 0.04
30.0870.0520.0520.0640.020.28 ± 0.03
40.1000.1010.0910.0970.020.43 ± 0.03
50.1260.1150.1120.1180.020.52 ± 0.02
60.1640.1630.1530.1600.020.71 ± 0.14
70.1570.1940.1510.1680.020.75 ± 0.04
100.1790.1880.1590.1750.020.78 ± 0.03
120.2090.1950.1890.1980.020.88 ± 0.03
150.2110.2270.2160.2180.020.97 ± 0.03
200.1980.2420.2150.2180.040.97 ± 0.05
250.1970.2530.2250.2250.031.00 ± 0.04

