1. Introduction
The formation of cenospheres occurs as a result of phase transformations and thermochemical reactions of the mineral coal undergoing the combustion process. The chemical, phase compositions and morphology of the cenospheres depend on the composition of the original coal, the cooling conditions and the type of furnace used [
1,
2]. There have been numerous studies on the morphology, physical and chemical properties of the CFA cenospheres [
1,
2,
3,
4] as well as a comprehensive review on it [
5]. Results from Zyrkowski et al. [
4] indicated that cenospheres were constituted by aluminosilicate glasses with several crystalline phases like quartz, mullite and calcite. The high alumina content in the cenospheres was responsible for their high mechanical strength, while the bulk density of most cenospheres was generally lower than 1 g/cm
3, which is more buoyant than water.
Due to their unique combination of spherical shape, lower value of thermal conductivity, higher particle strength, ultra-low density, impermeability and inertness to acids and alkalis characteristics, cenospheres have been reported to be able to enhance the physical properties of syntactic foam [
6], coating [
7], concrete [
8] and metal matrix composites [
9]. For example, Carcia et al. [
6] showed that the addition of cenospheres can increase the flexural strength of cenospheres-reinforced syntactic foams. Doddamani et al. [
7], who used cenospheres as one of the components in coating formulation, reported that the presence of cenospheres in the coatings had effectively reduced wear. Liu et al. [
8] showed that the autogenous shrinkage of mortar can be reduced drastically by perforated cenospheres which subsequently improved the strength of the concrete. Ravi et al. [
9] revealed that the addition of cenospheres in aluminum resulted in an increase in the composite material hardness, wear resistance and corrosion resistance as well as a reduction in density.
However, the addition of cenospheres could introduce structural failure to the bulk material when subjected to high heat. For example, a snap-through buckling failure in fly ash cenosphere/epoxy syntactic foam under a thermal environment was reported by Waddar et al. [
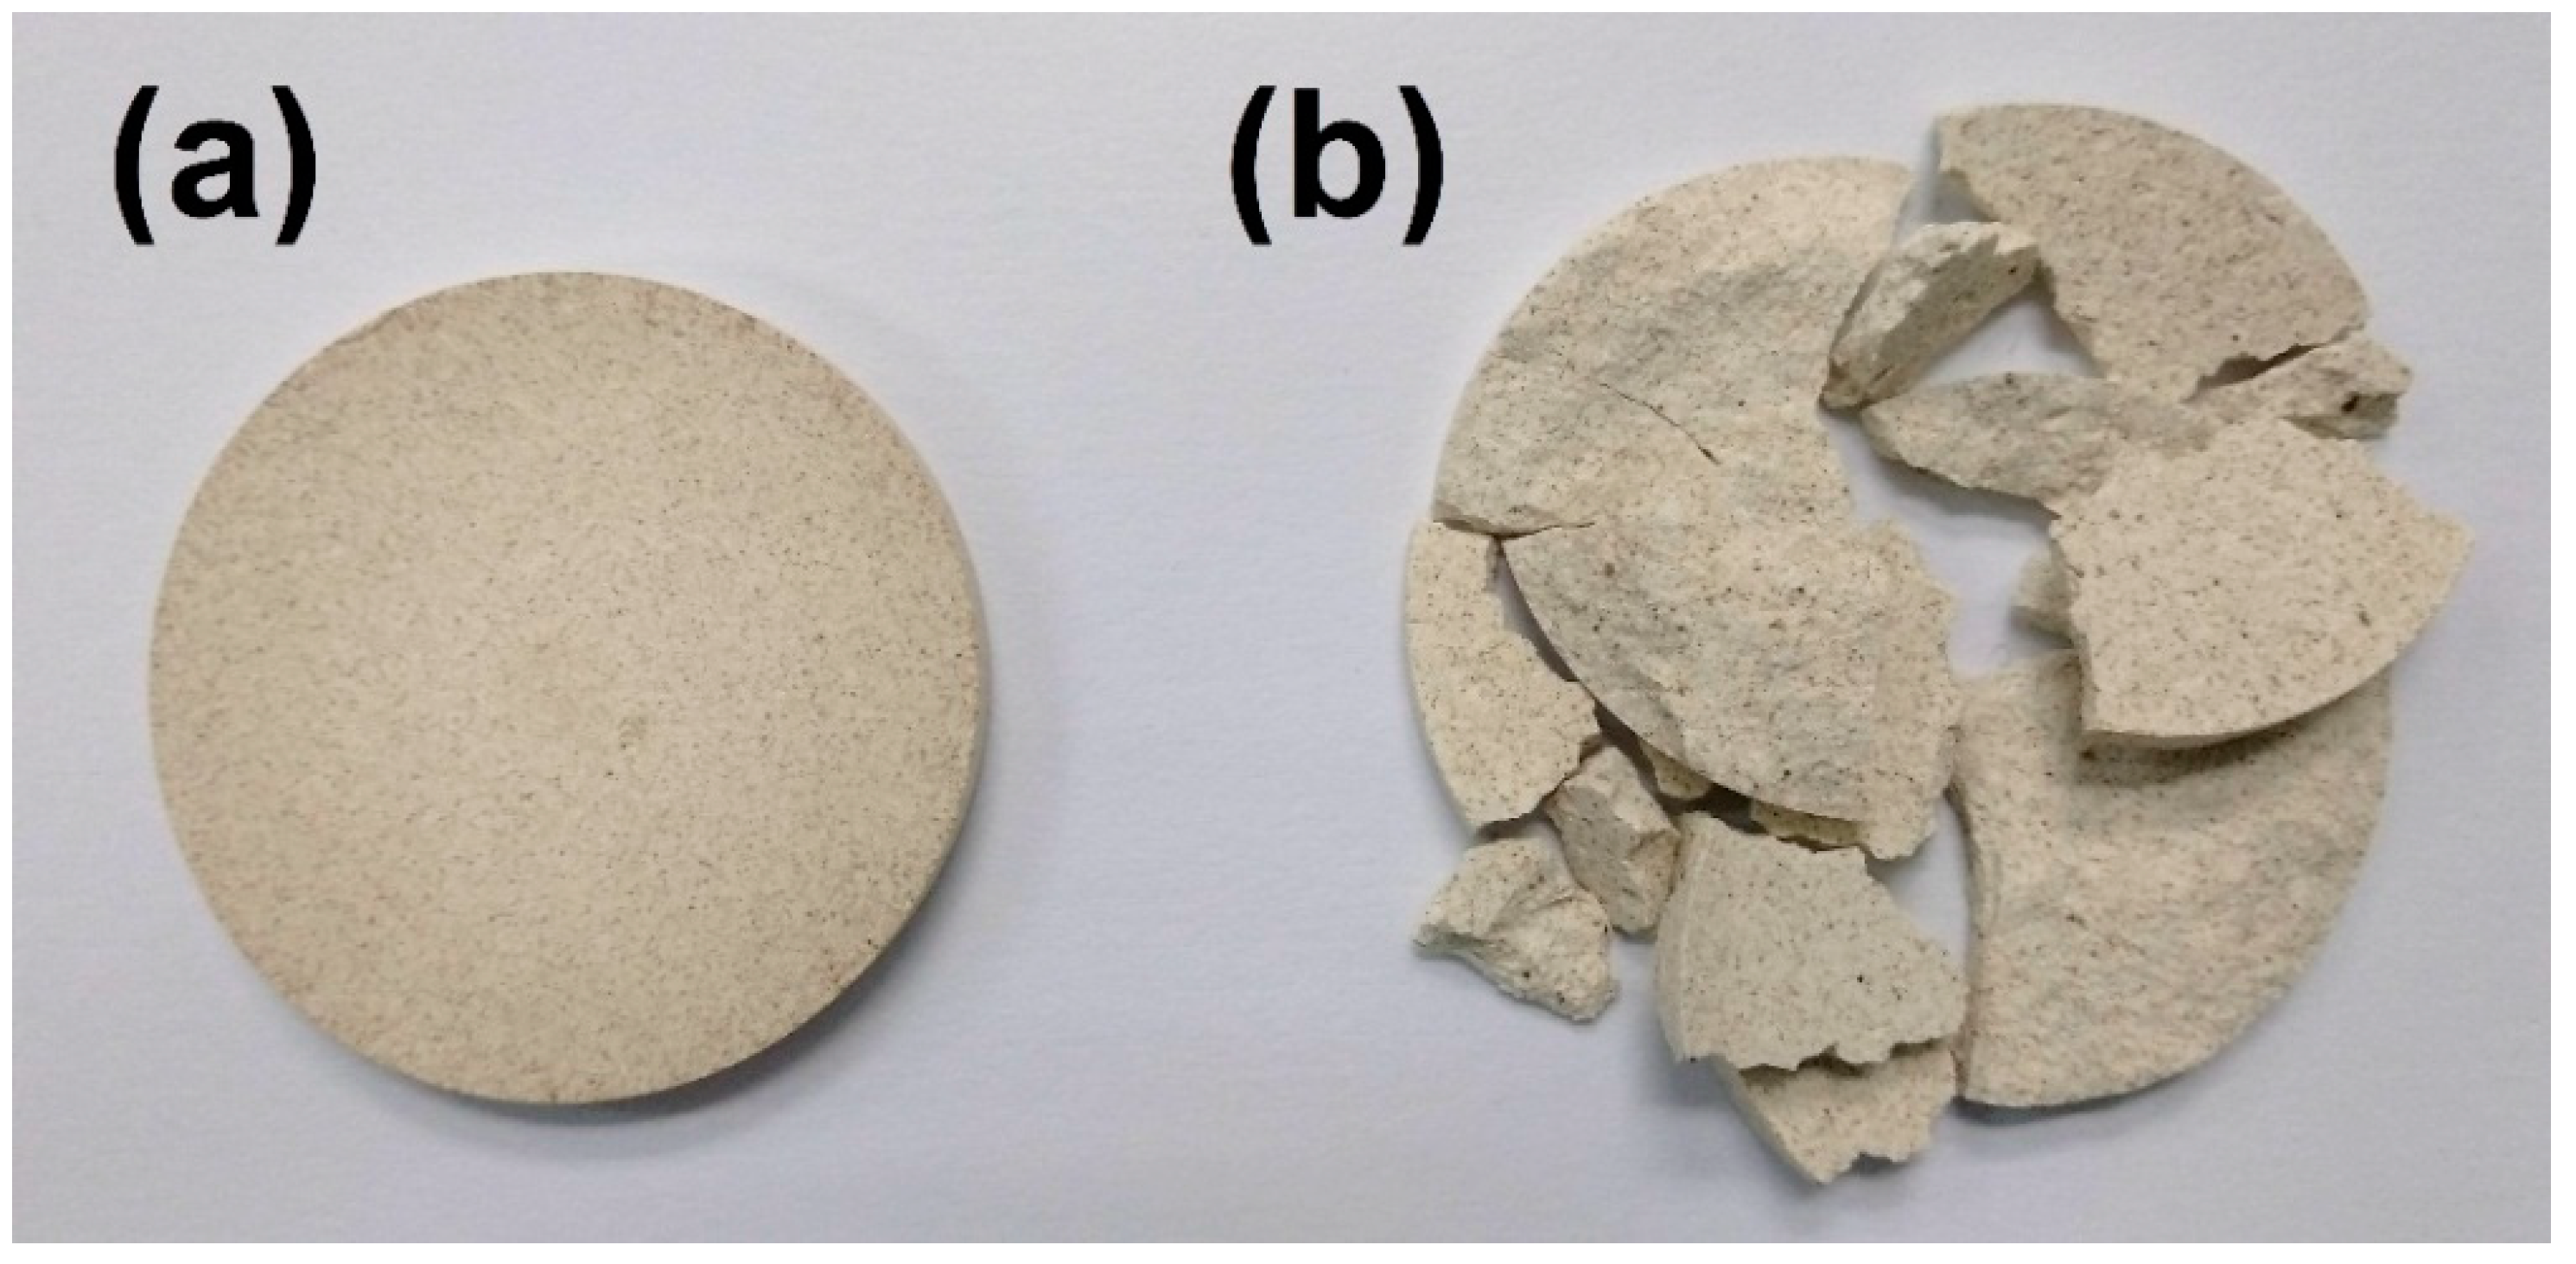
10], and the structural failure in clay/cenospheres ceramic composite under sintering conducted in the present study. So, it is necessary to study the various phase transformations, morphological changes and thermal expansions of these cenospheres at higher temperatures for improving the effectiveness of their usage in extreme environments. In the present study, a systematic investigation of the influence of temperatures on the microstructural, chemical and phase compositions of the cenosphere has been carried out.
2. Materials and Methods
CFA was obtained from a coal-fired power plant (Sultan Salahuddin Abdul Aziz Power Station) located in Kapar, Malaysia. The power plant consists of pulverized coal boilers manufactured by Ishikawajima-Harima Heavy (IHI), Japan. The majority feedstock coal used in this power plant was from Australia and Indonesia.
Table 1 shows the composition of various oxides present in the CFA samples, as identified by an EDX-7000 energy dispersive X-ray fluorescence spectrometer (Shimadzu, Kyoto, Japan).
Cenospheres separation from CFA was done by flotation method—CFA was mixed with water, stirred and left to sediment for 30 min. Then, floating particles (cenospheres) were skimmed, dried at 110 °C for 1 h. Lastly, cenospheres samples (5 g) were heat-treated at 800, 1000, 1200 and 1400 °C for 2 h in alumina crucible in order to investigate the resultant phase transformation. All the above heat treatment processes were carried out in air in an electrical box furnace at a heating rate of 10 °C/min. The cenospheres were tested in the whole fraction without any sieving.
The acquired CFA, cenospheres and heat-treated cenospheres (1000, 1200 and 1400 °C) named CFA, Ceno, Ceno 1000, Ceno 1200 and Ceno 1400 were characterized by X-ray diffraction and the crystalline phase compositions were analyzed. XRD diffractograms at room temperature were recorded by using PANalytical X’Pert PRO using monochromated CuKα radiation (λ = 1.54184 Å) and crystalline phase compositions were analyzed by the Rietveld refinement method (X’Pert HighScore Plus Version 2.2b, PANalytical, Almelo, Netherlands). The degree of crystallinity was estimated from the measured X-ray intensity, calculated as a ratio of crystal-derived scattering intensity to total scattering intensity.
where X is the crystal-derived scattering intensity and Y is the non-crystal-derived scattering intensity. The degree of crystallinity was used to estimate the amount of amorphous phase.
Cenospheres and fired cenospheres (800 °C for 2 h) with a sample mass of around 10 mg were characterized by an STA-449-F3 Jupiter simultaneous thermal analyzer (Netzsch, Selb, Germany) in an alumina crucible for their temperature-dependent phase transitions. Temperature ranging from room temperature to 1600 °C and a heating rate of 10 °C/min with a constant synthetic air flow rate of 20 mL/min was used in this analysis. The cenospheres that fired at 800 °C for 2 h in air were to burn off all the unburnt carbonaceous residual materials and used for comparison.
Cenospheres before and after heat-treated at 1000, 1200 and 1400 °C were characterized using a GeminiSEM 500 FESEM (Zeiss, Oberkochen, Germany) equipped with an X-Max EDS detector (Oxford Instruments, Abingdon, UK). The differences between particle morphology, shape and size were analyzed. Approximate measurement of the size of mullite crystallites was also taken using FESEM. The Al2O3/SiO2 ratio of mullite crystallites was computed based on the EDS results. For each sample, EDS analysis was performed five times at different areas to obtain the average values of the compositions. EDS measurements were performed at an accelerating voltage of 15 kV. A DIL 402C Dilatometer (Netzsch, Selb, Germany) was used to measure the linear thermal expansion of the powder samples in an alumina sample container from 100 to 1000 °C at a heating rate of 5 °C/min. The length change was recorded with a dense α-alumina as reference sample.
All the results were analyzed and compared. A conclusion was drawn based on the analysis and comparison. Finally, to validate the finding, a comparison of the thermal stability of heat-treated and non-heat-treated cenospheres as a pore-forming agent in ceramic was conducted.
3. Results and Discussion
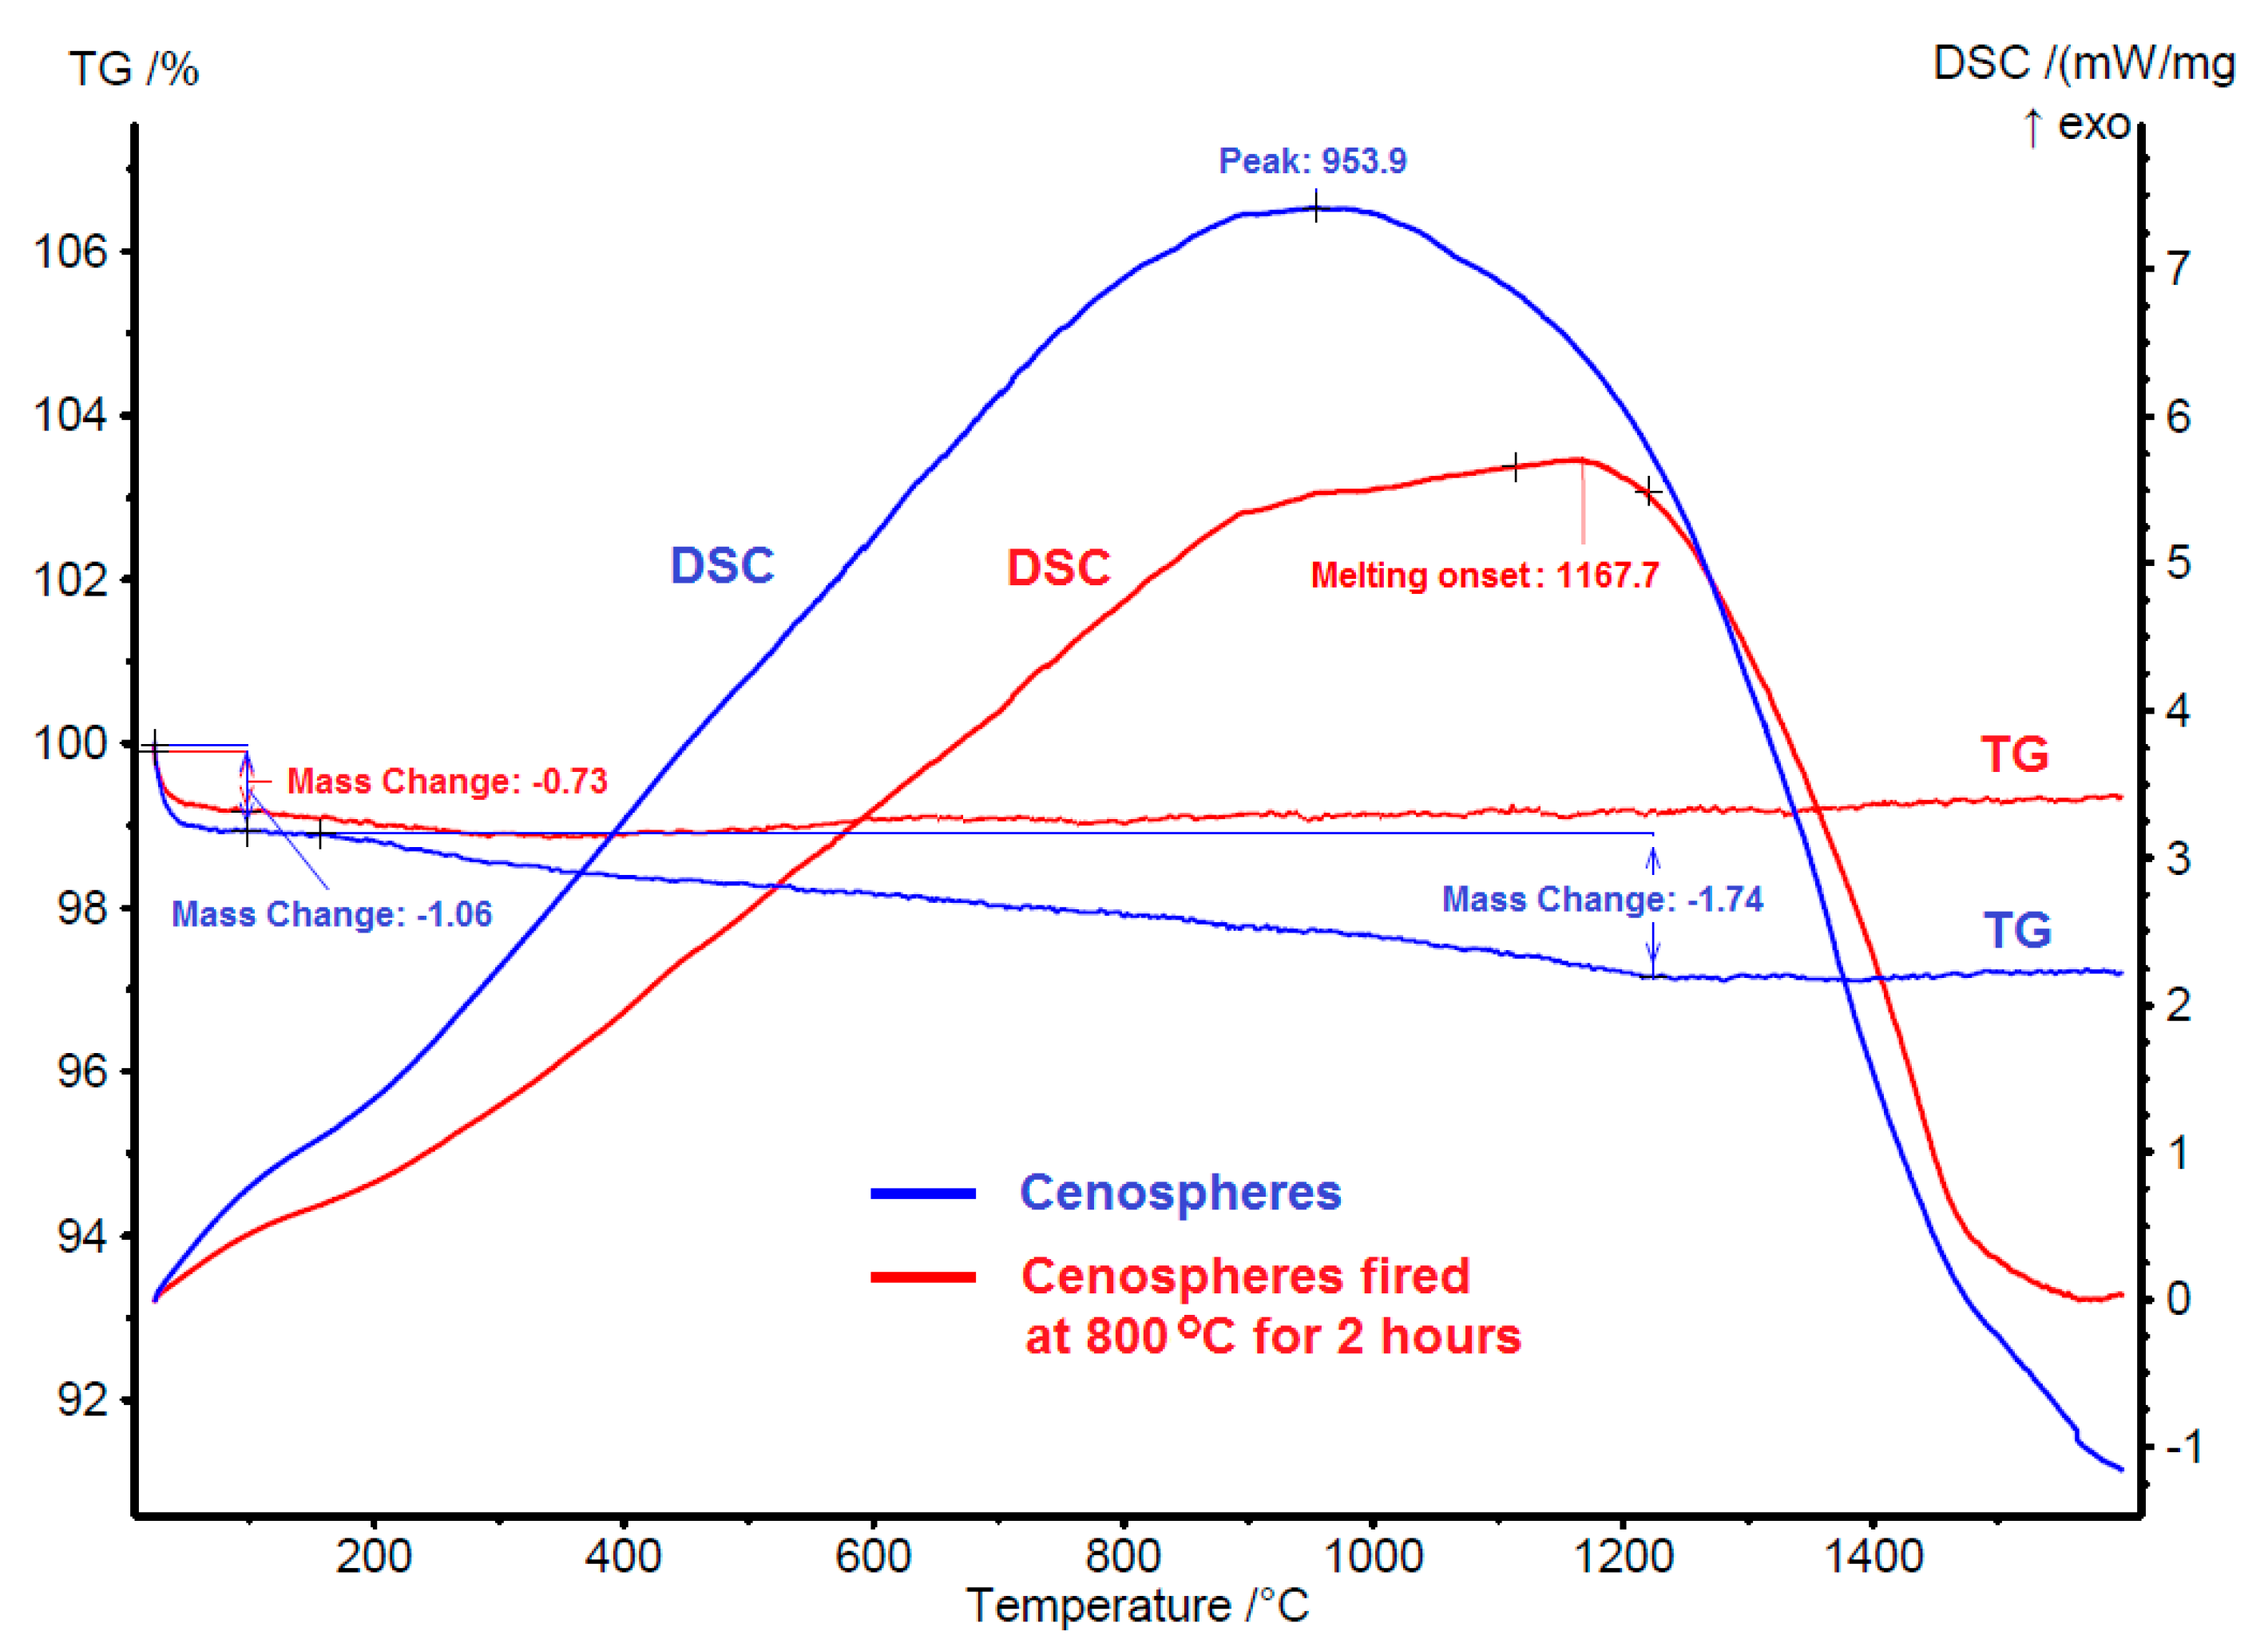
Thermogravimetry (TG) and DSC curves of cenospheres and fired cenospheres (800 °C for 2 h) with temperature ranges from room temperature to 1600 °C are shown in
Figure 1. There were slight weight losses (~1%) in both cenospheres up to about 100 °C, which could be related to the loss of adsorbed water. For the cenospheres sample, it has a broad exothermic peak at a temperature of 954 °C. This exothermic peak is associated with another slight weight loss (1.7%). On the other hand, the DSC curve of fired cenospheres (800 °C for 2 h) also showed a broad exothermic reaction but a lesser magnitude and without any apparent weight loss. Based on these observations, it can be concluded that the exothermic reaction peaked at 954 °C was partly related to the combustion reaction of the unburnt carbonaceous residual materials such as char particles.
The DSC curve of fired cenospheres (800 °C for 2 h) showed the true effect of temperature on cenospheres without any interference from the burning of unburnt carbonaceous materials. The DSC curve showed that the heat flow slowly increases with increasing temperature. This can be attributed to the phase ordering process and devitrification of the amorphous aluminosilicate glass phase in cenospheres. A similar exothermic peak was observed in the work of Huo et al. [
11], who studied the thermal properties of TiO
2 and AgCl coated cenospheres. In their work, a relatively flat baseline was observed at temperatures below 400 °C followed by a broad exothermic process. The exothermic peak reported in this work (
Figure 1) and by Huo et al. [
11] was not associated with any weight loss. The DSC curve also showed an onset of melting at the temperature of 1168 °C, which was the starting point of the melting of the silica phase in the cenospheres. There is no significant weight loss shown in the TG curve of fired cenospheres (800 °C for 2 h) besides the slight weight loss related to the loss of adsorbed water, this signifying the excellent weight stability of the cenospheres. However, it is thermally unstable especially beyond the temperature of 1168 °C as a result of the melting process.
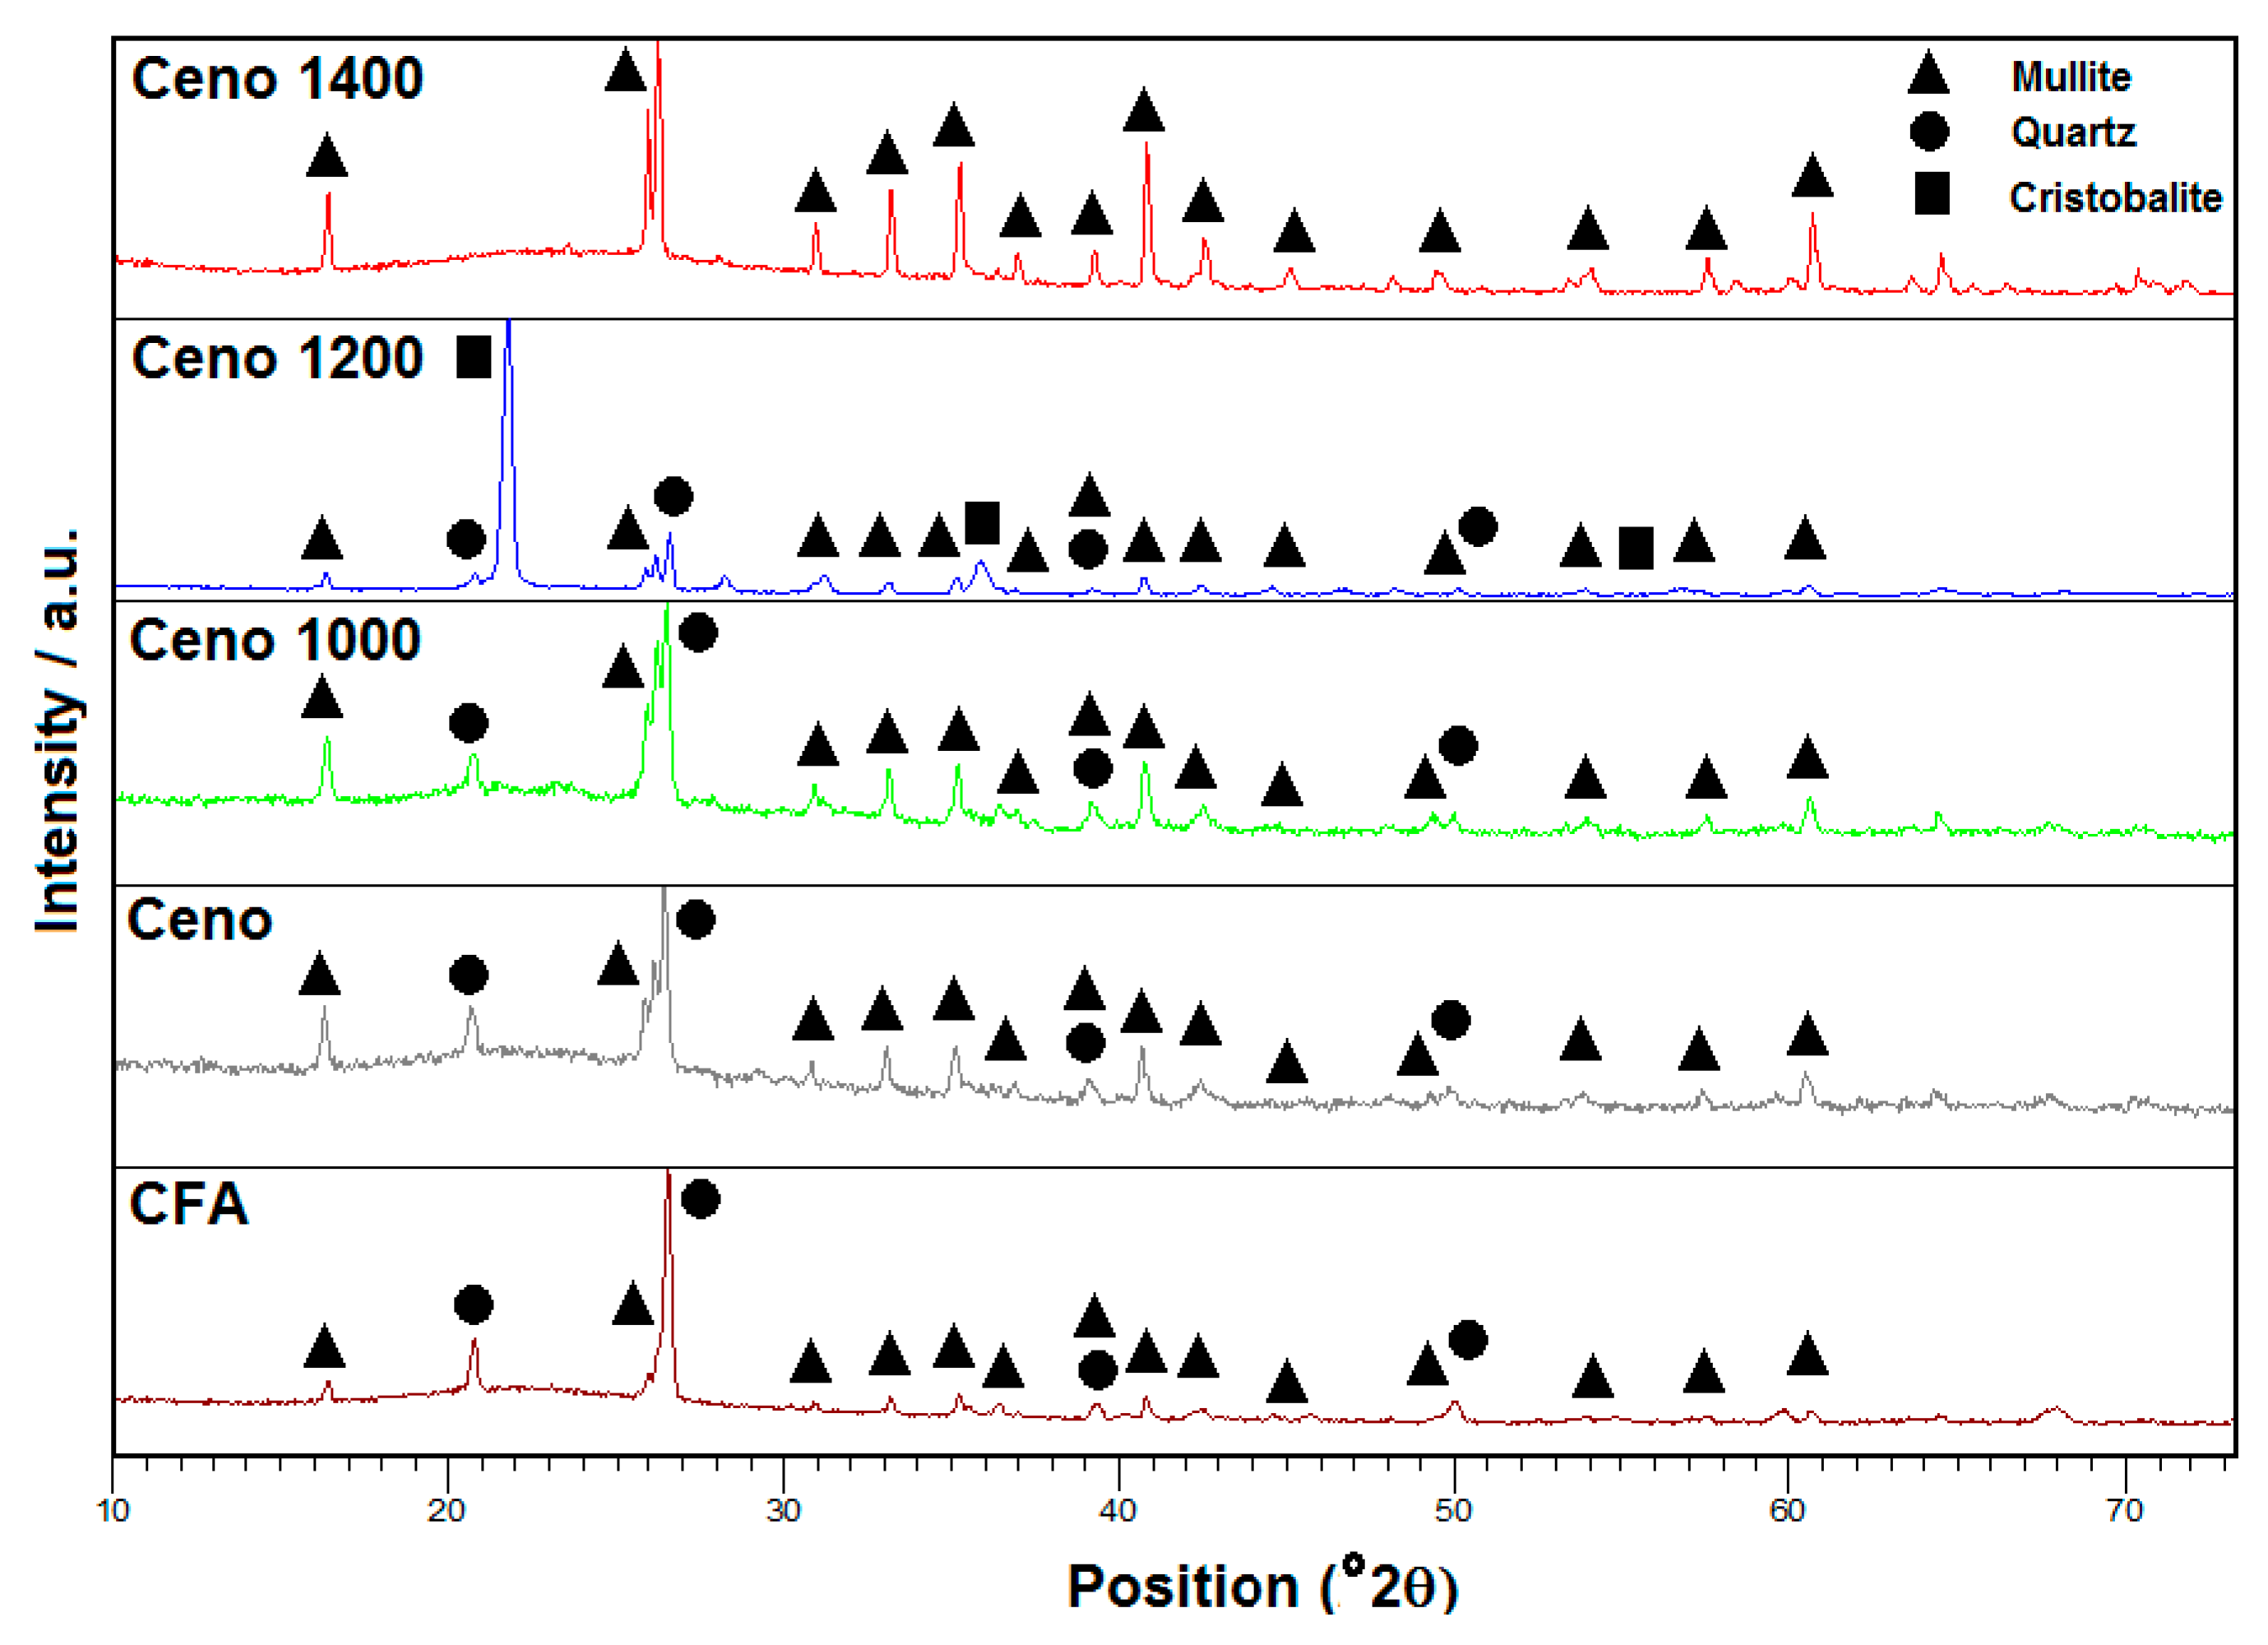
In order to validate the analysis results from the DSC curve, the cenospheres were heated at 1000, 1200 and 1400 °C for 2 h. A comparison of their X-ray diffractograms is shown in
Figure 2. XRD analysis disclosed that the majority of crystalline phases present in the examined CFA and cenospheres were mullite and quartz. In both X-ray diffractograms, the glassy phase of amorphous silica and alumina was also detected along with the crystalline phases, as indicated by the broad characteristic diffraction peak between 17° and 30°, centered at a 2θ angle of 22.5° [
12,
13]. This amorphous glassy phase was originated from the un-crystallized aluminosilicate substance in coal.
Table 2 shows the crystalline phase composition of CFA and cenosphere samples determined by Rietveld refinement of the diffractograms. According to the results, the cenospheres have a higher percentage of the mullite phase (7.1 wt.%) compared to CFA (4.0 wt.%), it can be concluded that the majority of the mullite crystallites were contained within the cenosphere structure. These results agree well with the FESEM micrographs of the cenosphere.
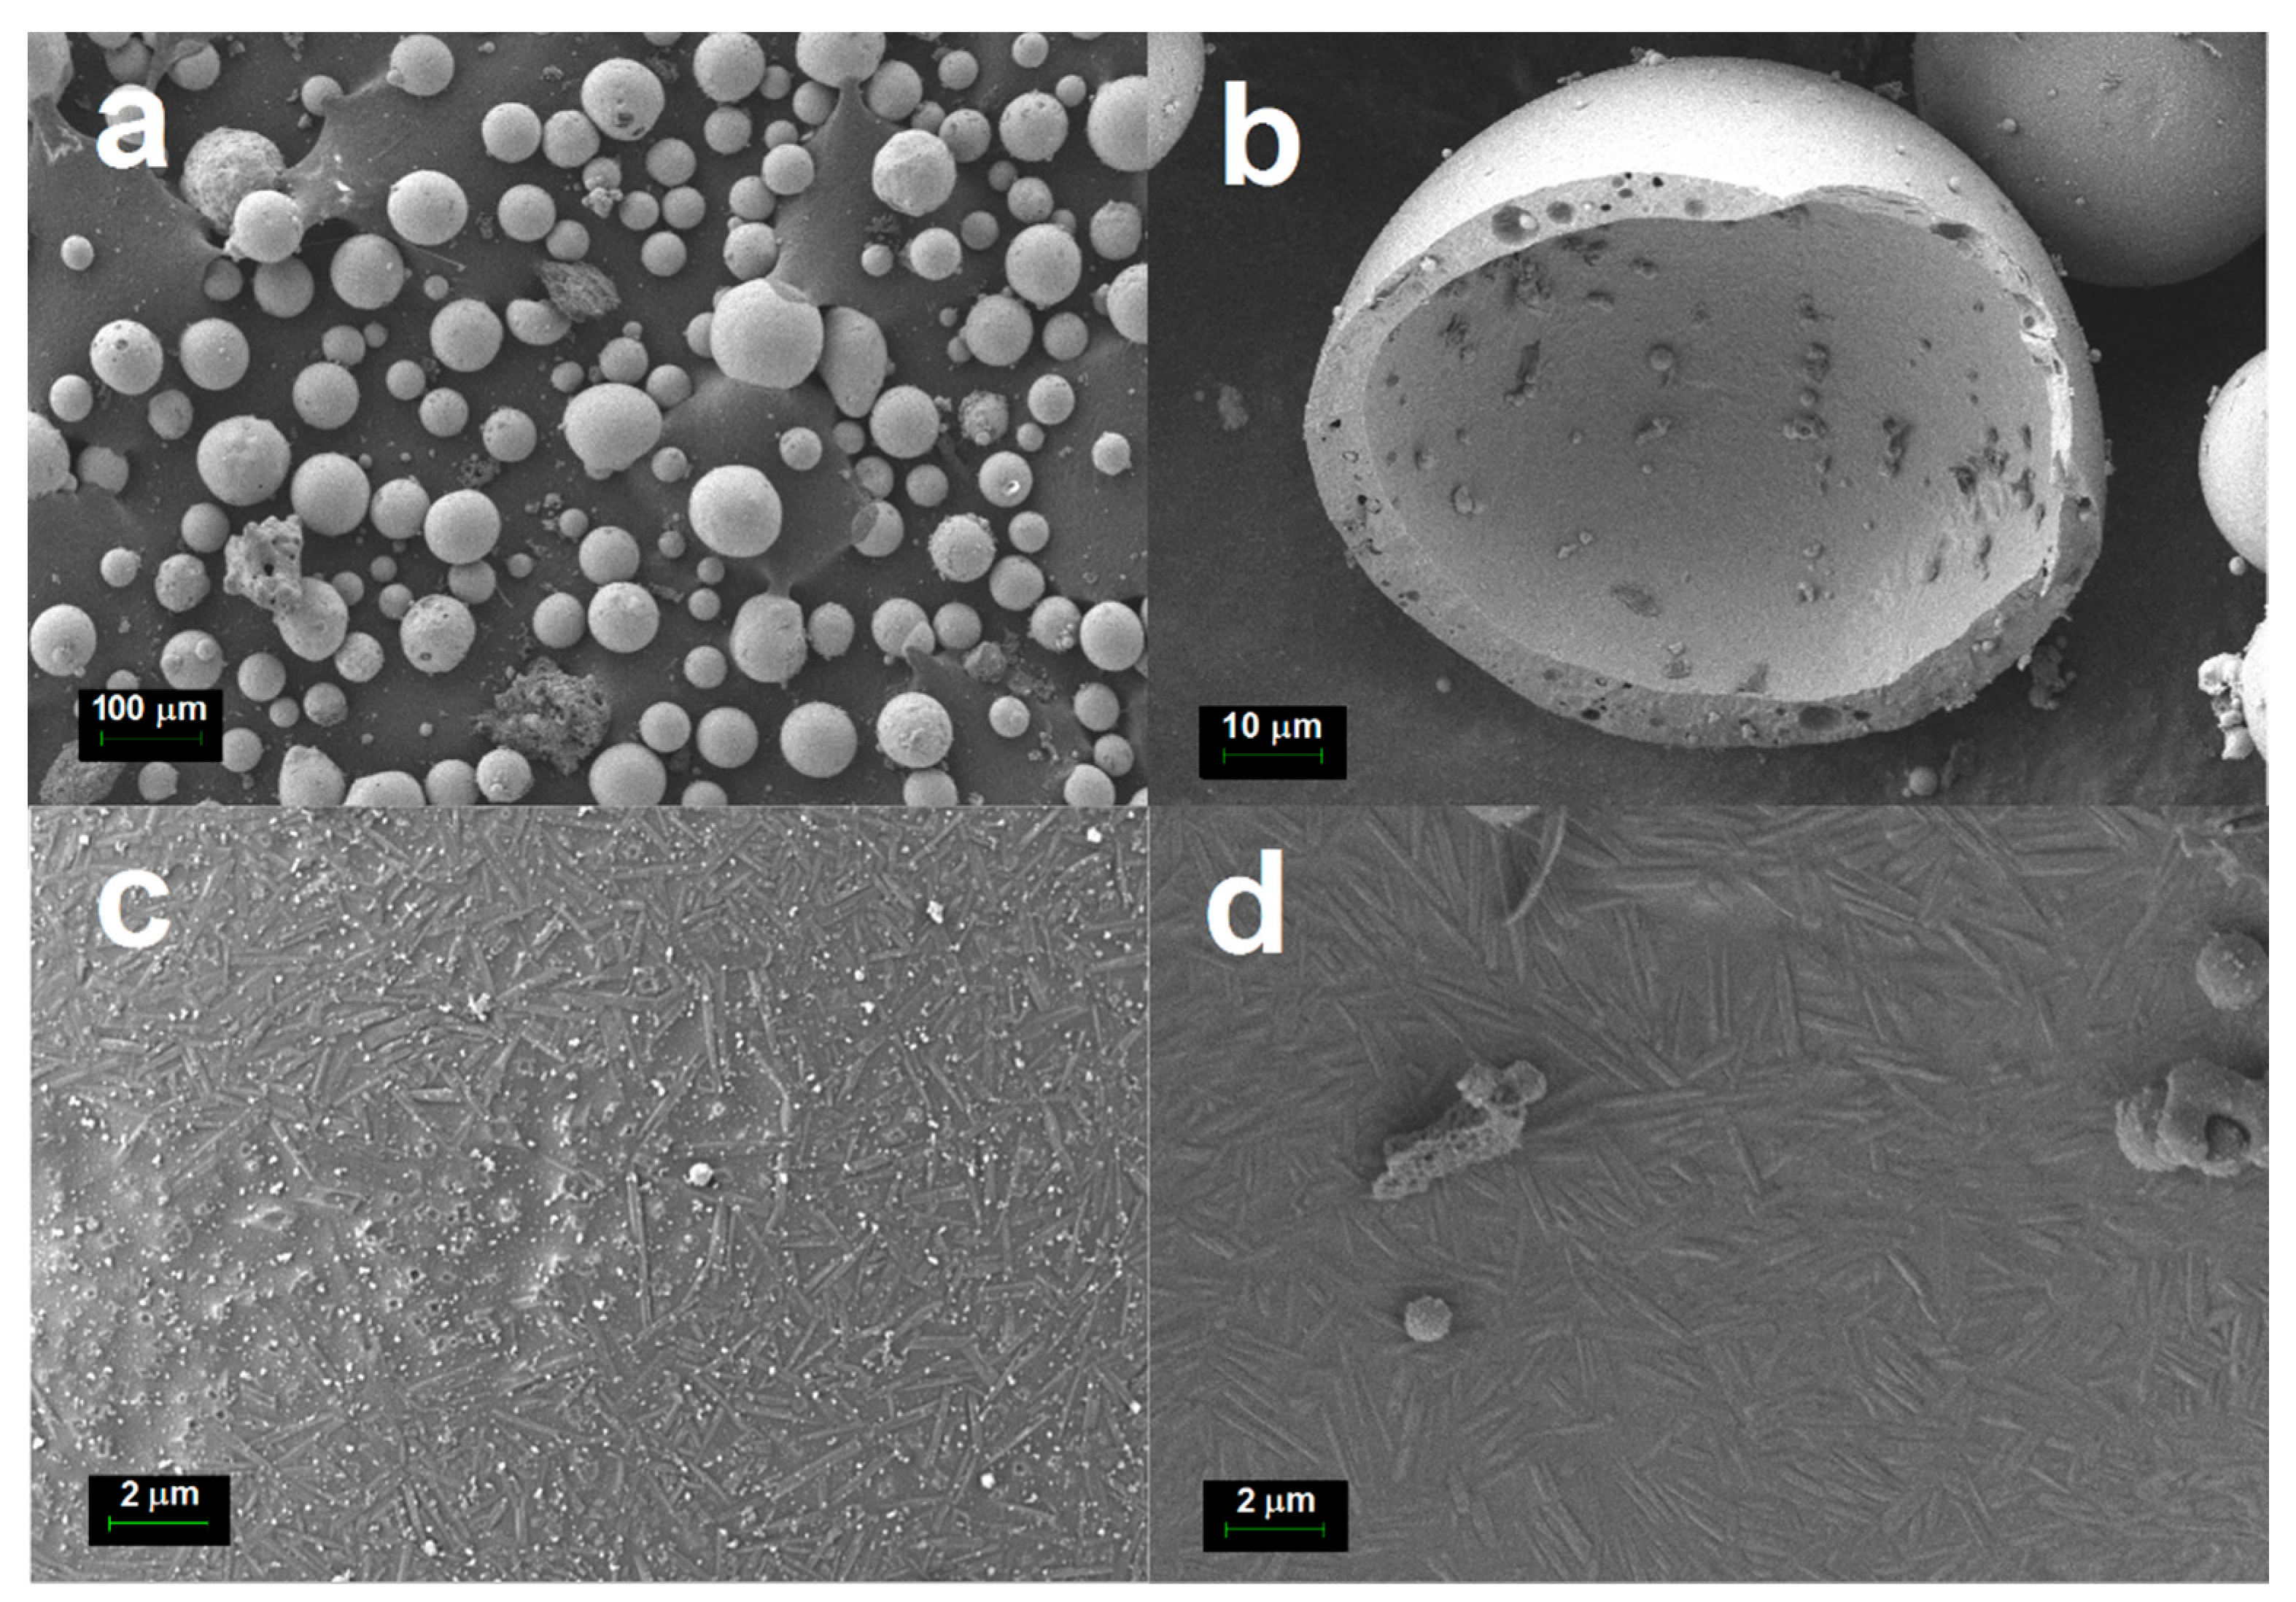
Figure 3c,d shows the outer and inner surfaces of the cenosphere shell. The needle-shaped acicular mullite crystallites embedded in a glassy matrix can be seen on both surfaces of the cenosphere shell.
The XRD results showed that cristobalite formation started at a temperature below 1200 °C. This crystallization process contributed to the broad exothermic peak observed in the DSC curve of fired cenospheres (800 °C for 2 h). A comparison between the composition of the crystalline phases of cenospheres and cenospheres heated at 1200 °C (
Table 1) also indicated that the main silica source for cristobalite formation was from the amorphous phase. This result agrees well with the X-ray diffractogram in
Figure 2, which showed little or no sign of broad characteristic diffraction peak between 17° and 30° in cenospheres sample heated at 1200 °C as most of the amorphous phase had been transformed to the crystalline phase. Similar formations of cristobalite from amorphous silica at temperatures below 1200 °C were also previously reported. For example, continuous phase transformations of various forms of silica when heating from room temperature to 1400 °C were observed by Wahl et al. [
14] using continuous X-ray diffraction. It was reported that when heating amorphous silica, β-cristobalite formed directly at 900 °C. A much lower temperature, at between 300 °C and 500 °C was also reported for amorphous silica to crystalline silica conversion [
15].
XRD results also showed an increase in the mullite crystalline content when the cenospheres sample was heated at 1200 °C. This showed that the broad exothermic peak observed in the DSC curve of fired cenospheres (800°C for 2 h) was also partly due to the crystallization of new mullite from the amorphous phase. Lastly, there were no quartz and cristobalite phases found in the cenospheres sample heated at 1400 °C. This dissolution of quartz and cristobalite phases is associated with the large increment of the amorphous phase, which agreed well with the DSC results (
Figure 1) that showed an onset of melting at the temperature of 1168 °C.
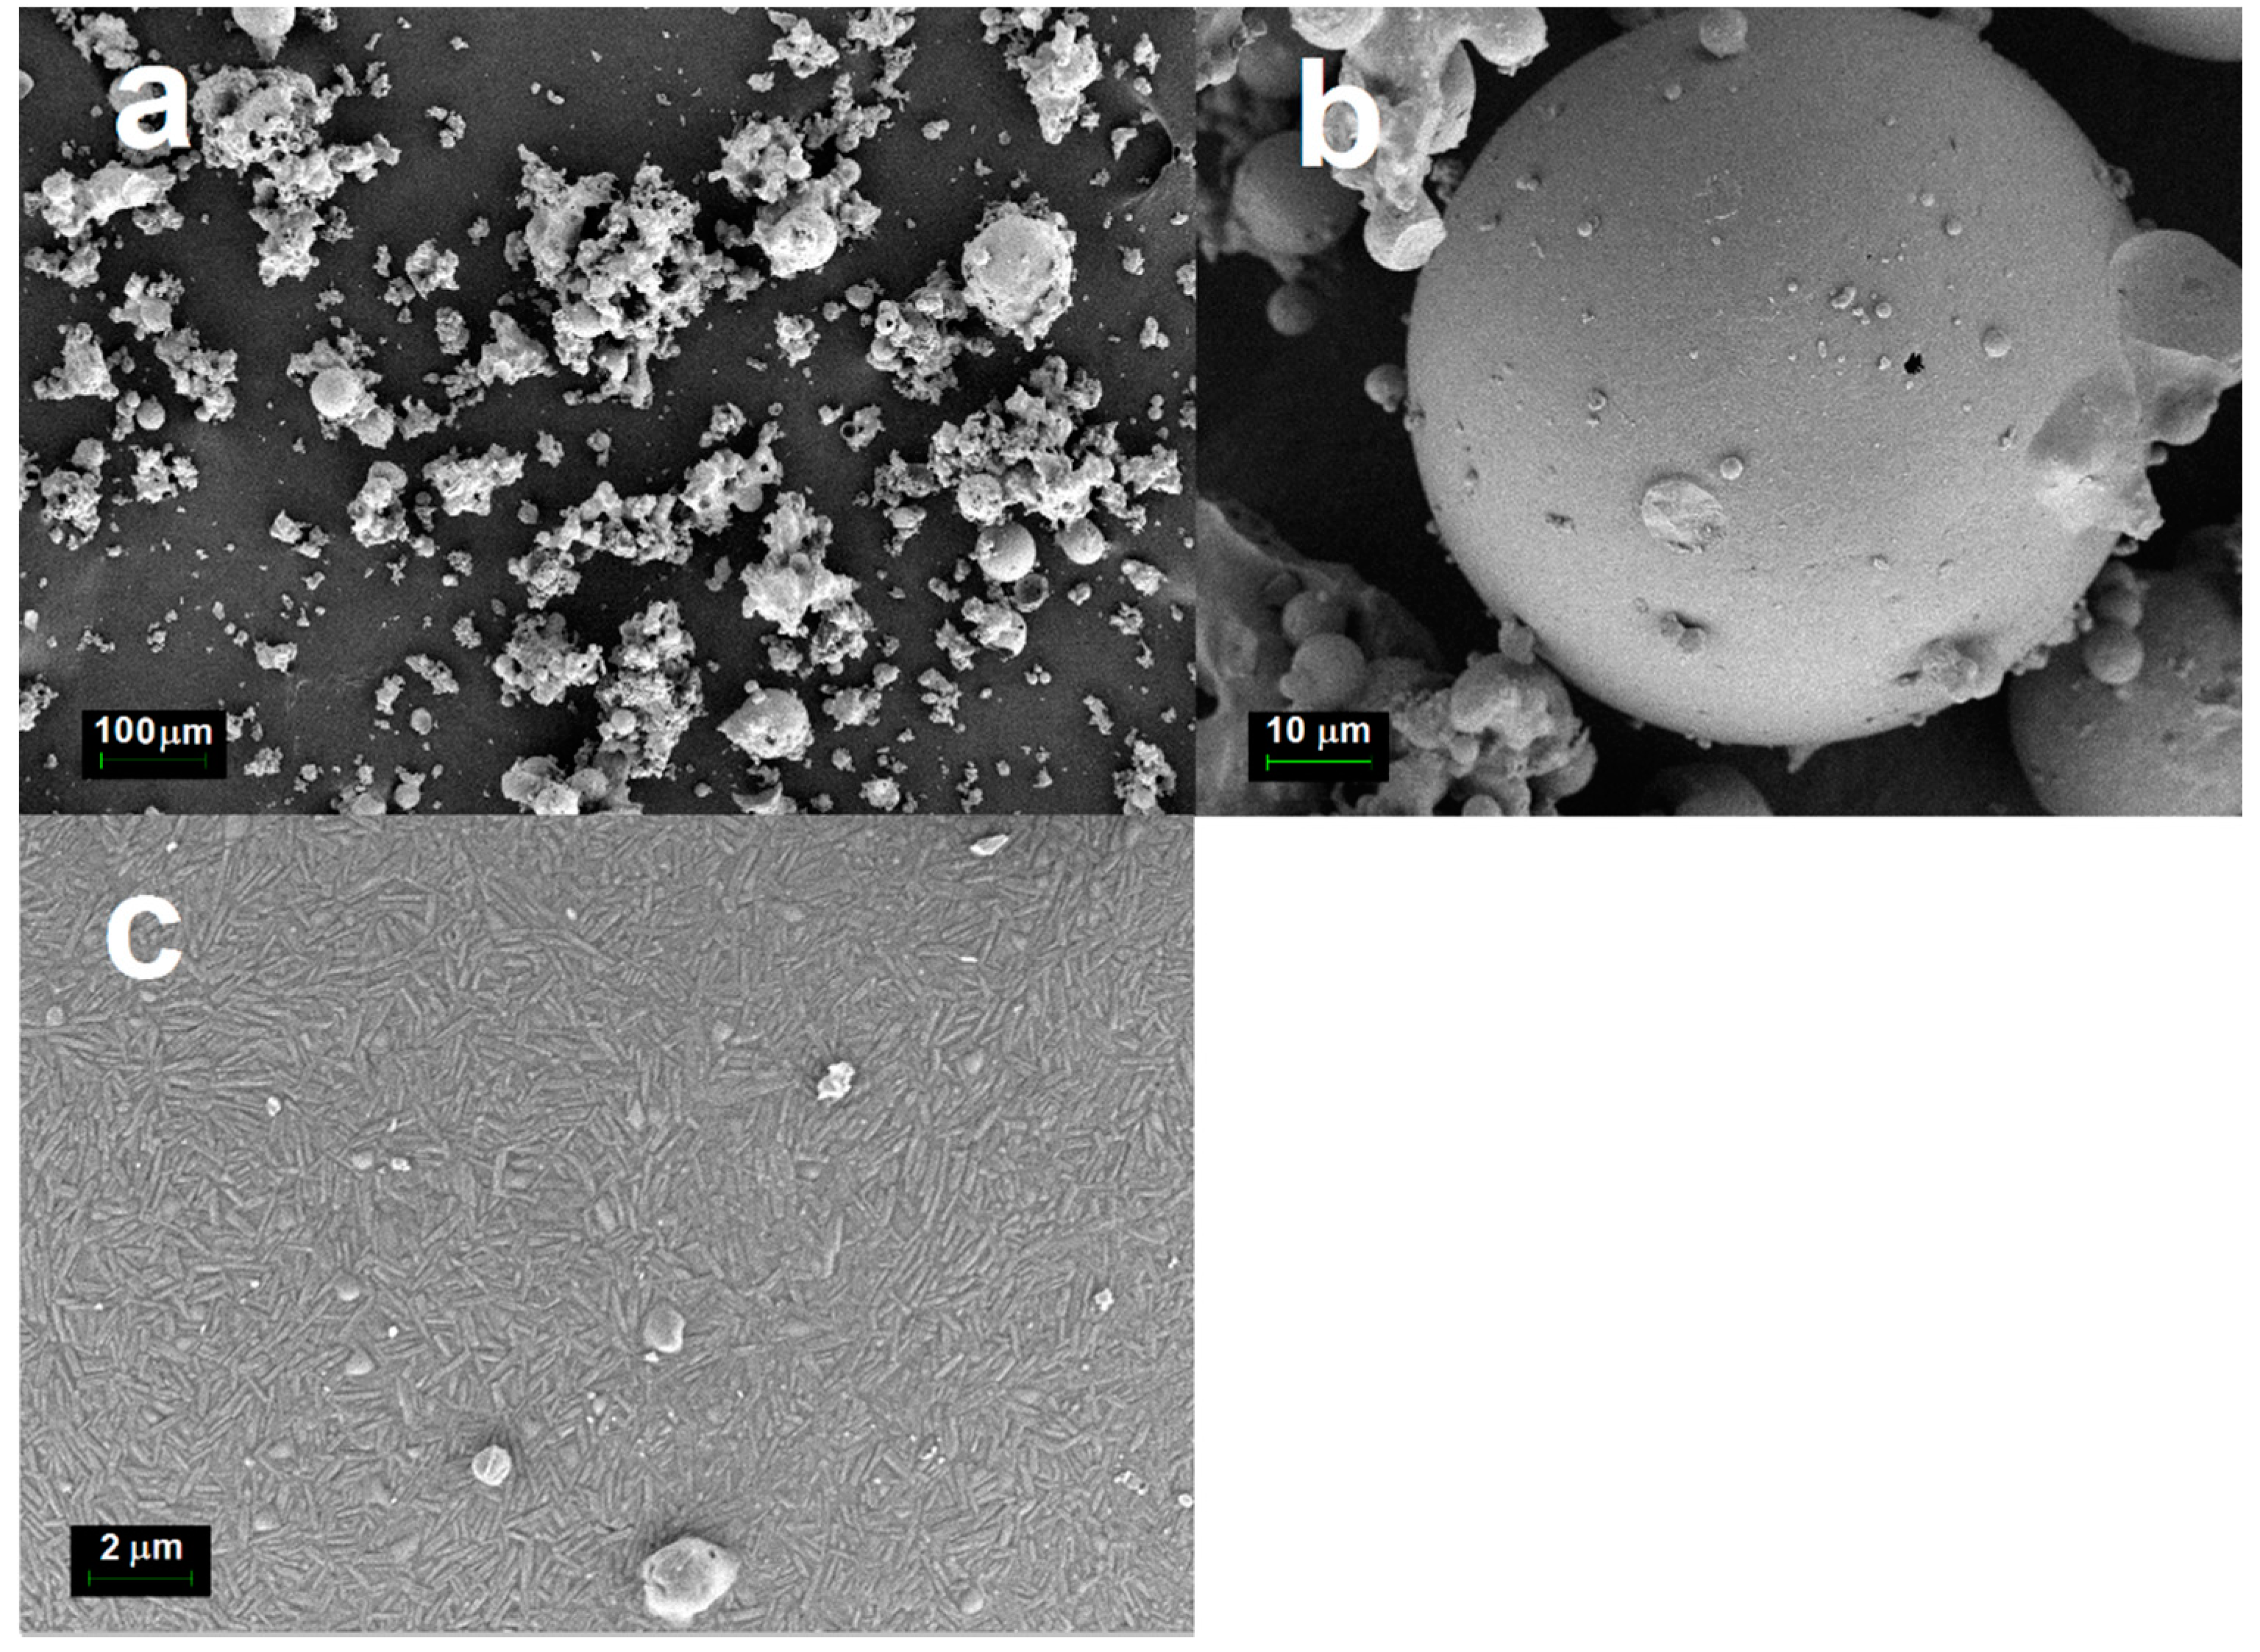
Figure 3 depicts the FESEM micrographs of the cenosphere sample. From these micrographs, it can be observed that the cenosphere sample consisted almost all of spherical hollow particles, ranging from a few microns to a few hundred microns with an average diameter of around 100 μm. FESEM micrographs show that cenospheres from coal combustion had shells made up of amorphous aluminosilicate glasses with embedded crystalline phases like quartz and mullite. This is in good agreement with the XRD results shown in
Table 2. There was a large void space found inside the cenosphere as depicted in the cross-section of cenospheres in
Figure 3b.
Figure 3c,d shows that the outer and inner surfaces of the cenospheres were covered by micron-sized and needle-shaped acicular mullite crystallites embedded in an aluminosilicate glass matrix. The mullite crystallites appeared to grow horizontally and randomly without protruding out of the cenosphere’s surface. The crystallites were about 2.0 and 0.2 µm in length and width, with an aspect ratio of around 10.
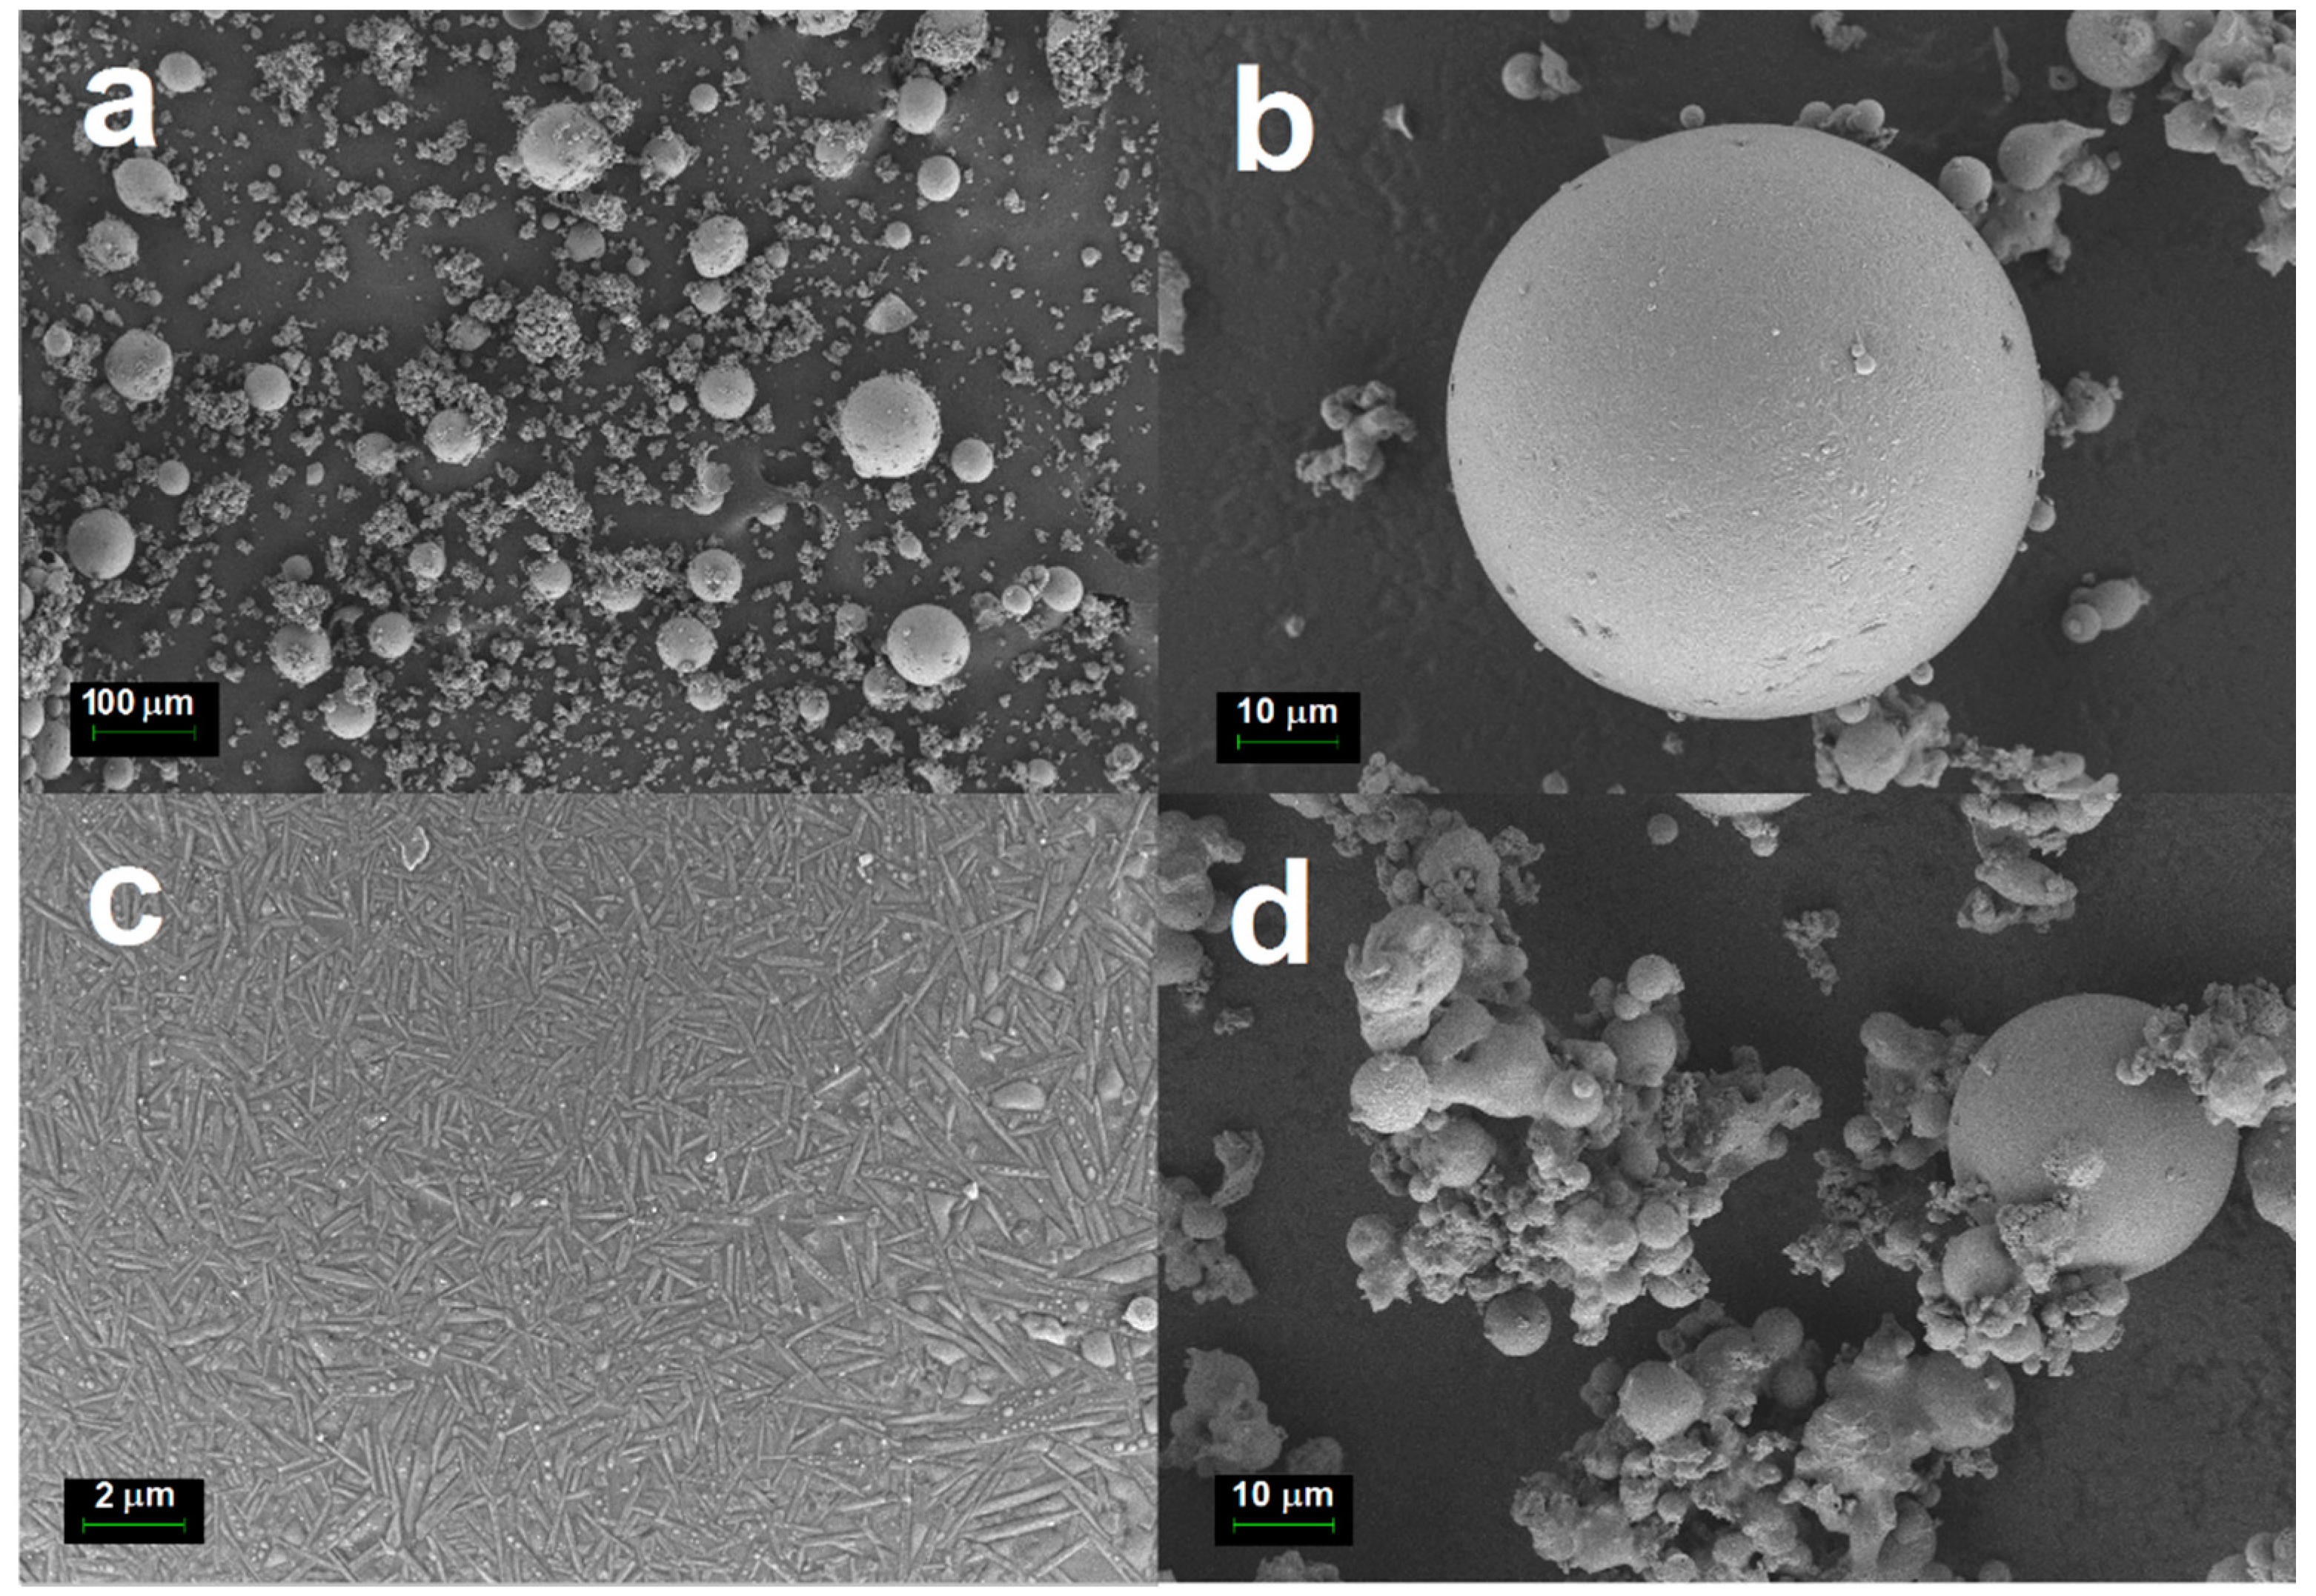
The micrographs in
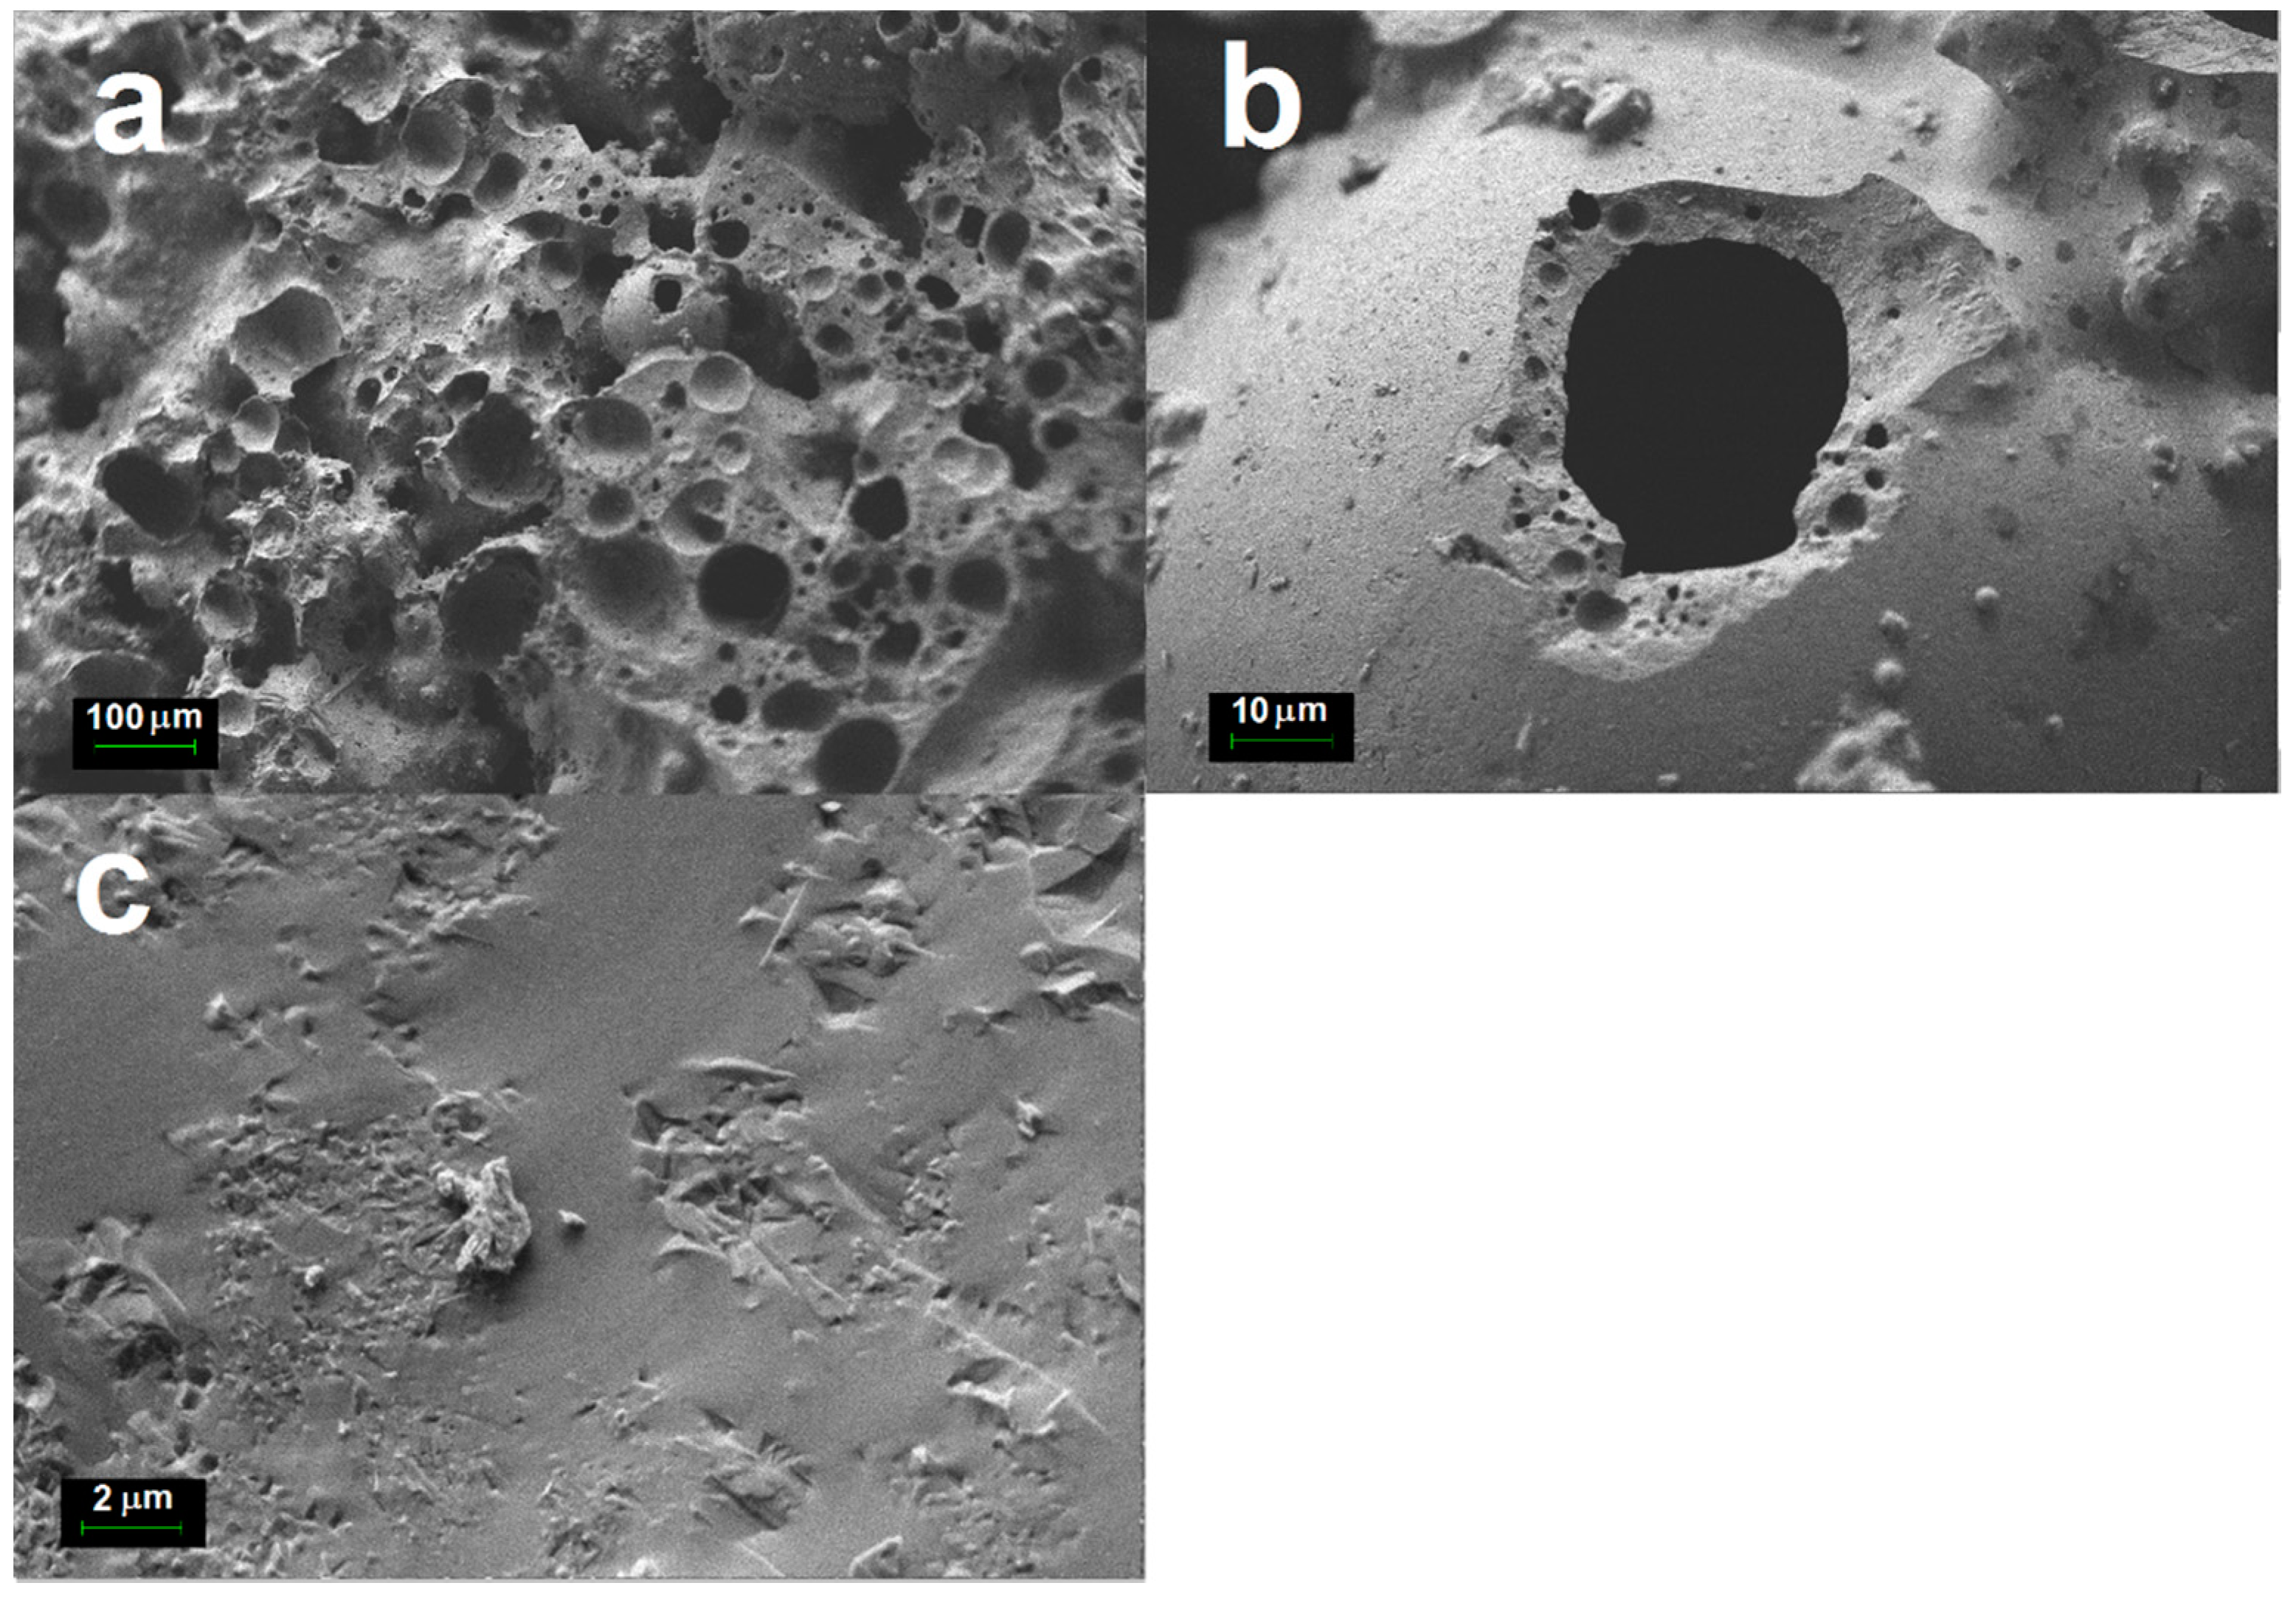
Figure 4 show that cenospheres heated at 1000 °C for 2 h still retained its perfect spherical appearance. However, it is noticed that a majority of the small cenospheres particles with diameters less than 10 µm were agglomerated after sintering (
Figure 4d). It has been found that the chemical and phase mineral compositions of the cenospheres are related to the size of the cenospheres. Ngu et al. [
16] reported that small cenospheres had a high SiO
2/Al
2O
3 ratio compared to their larger counterparts. High SiO
2/Al
2O
3 ratio and low mullite content are the main reason for smaller cenospheres having lower sintering temperature than the larger ones. It is also noticed that the mullite crystallites on the surface of the heated cenospheres (
Figure 4c) were more prominent than the unheated cenospheres.
The micrographs in
Figure 5 show that some of the cenospheres heated at 1200 °C for 2 h still retained its spherical appearance. However, the majority of the cenospheres were fused after sintering. Mullite crystallites were clearly observed on the surface of the heated cenospheres (
Figure 5c). These results agreed well with the DSC results (
Figure 1) which showed an onset of melting at the temperature of 1168 °C.
The morphologies of cenospheres heated at 1400 °C for 2 h are displayed in the FESEM micrographs of
Figure 6. The micrographs showed that almost all cenospheres were fused together after sintering (
Figure 6a). These structural changes were caused by the melting of crystalline silica in the cenosphere. Mullite crystallites on the surface of the heated cenospheres were also observed. However, the mullite crystallites were largely hidden by the melted glass phase as shown in
Figure 6c.
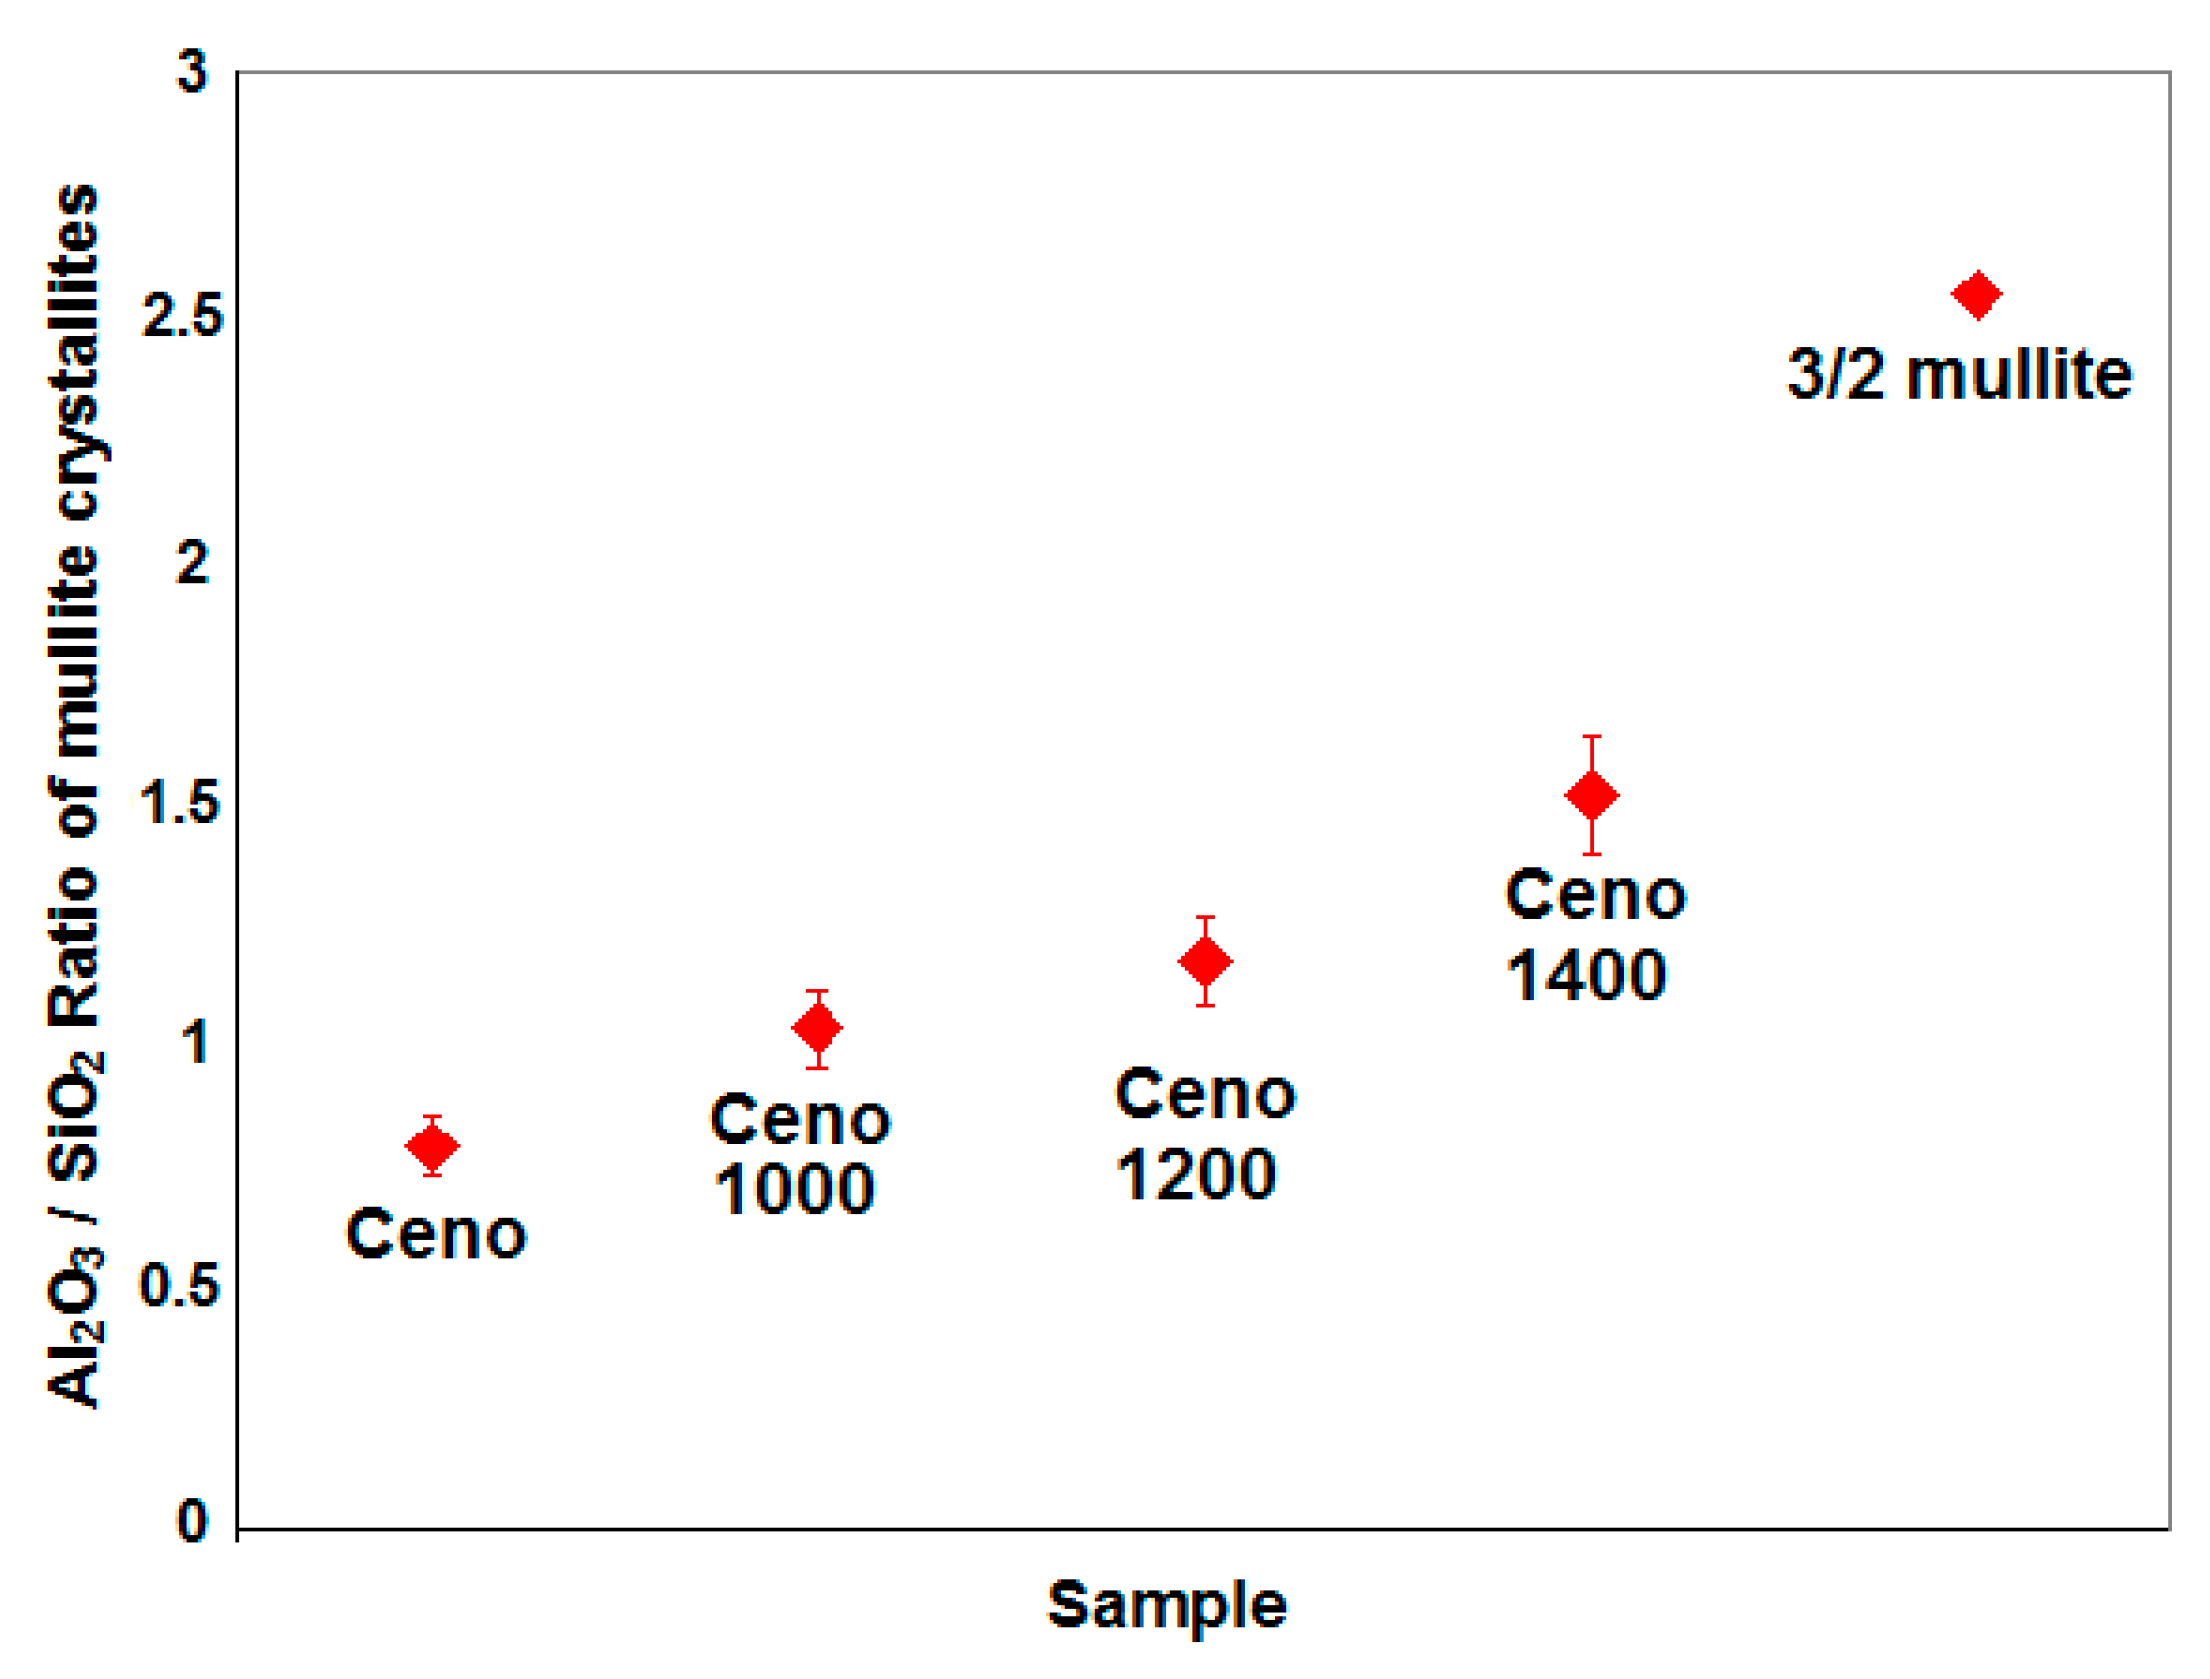
A study on the chemical evolution of the mullite crystallites was done by comparing the Al
2O
3/SiO
2 weight ratio of the mullite crystallites in the cenosphere heated at various temperatures. The Al
2O
3/SiO
2 weight ratio of mullite crystallites in cenosphere samples analyzed by the FESEM–EDS analysis is shown in
Figure 7.
It was found that the Al
2O
3/SiO
2 weight ratio in the mullite crystallites increased from 0.8 to 1.1 when the cenospheres were heated to 1000 °C. This is in good agreement with the literature by Gerardin [
17], where it was reported that mullitization, spinel formation and silica segregation could occur simultaneously leading to the exothermic transformation around 980 °C of an amorphous phase into a partially crystalline material. The Al
2O
3/SiO
2 weight ratio in the mullite crystallites further increased to 1.5 when the cenospheres were heated at 1400 °C, this ratio gradually approached the value of 2.5 of a stable stoichiometric 3/2-mullite (3Al
2O
3·2SiO
2, 71.8 wt.% Al
2O
3).
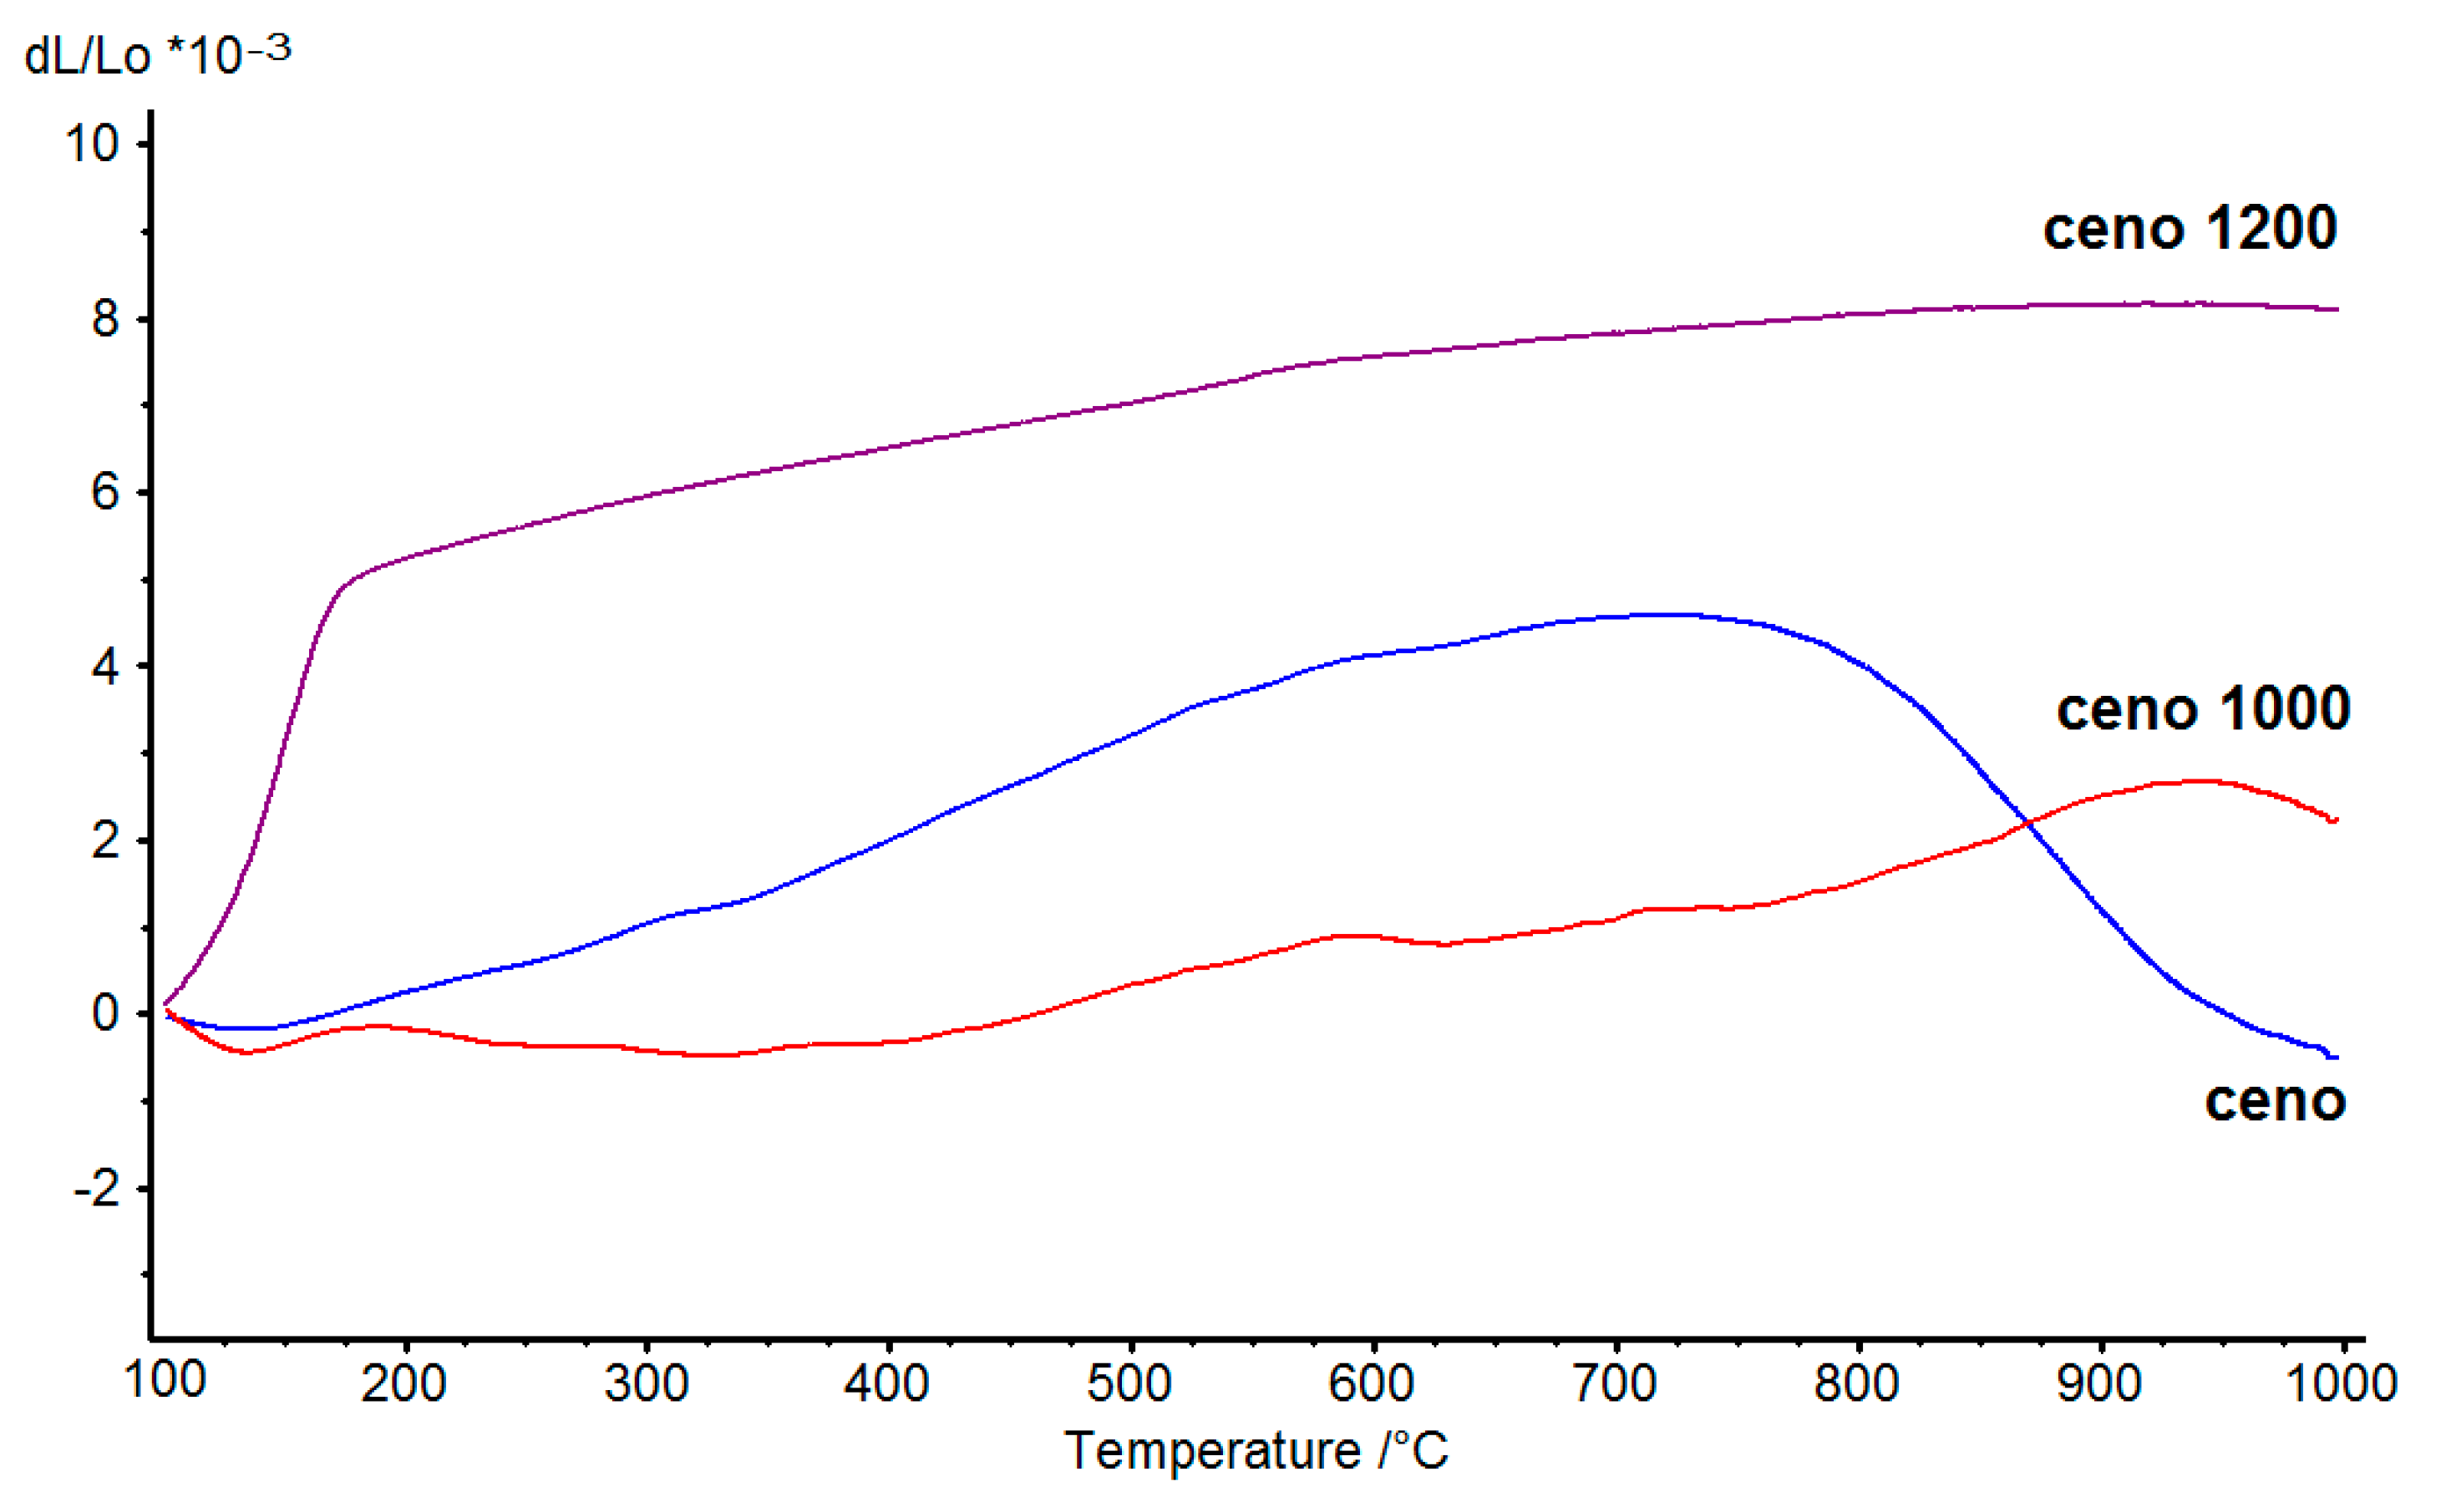
Thermal expansion is an important factor to consider when making composites. Compatibility in thermal expansion of the composite materials dictates the durability of the composites. We analyzed the thermal expansion property of the cenospheres and heat-treated cenospheres at temperatures from 100°C to 1000°C and the results are shown in
Figure 8. It was observed that only the cenospheres have a large reduction in thermal expansion started at around 750 °C, which was due to the softening of cenospheres under high temperature and pressing force of the dilatometer push-rod. On the other hand, 1000 °C-sintered cenospheres have low thermal expansion values and relatively smooth thermal expansion curves up until 950 °C. It was also observed that the 1200 °C-sintered cenospheres have very large thermal expansion changes at below 200 °C. This was due to cristobalite transformed from its α to β form during heating at about 200 °C [
18]. The result agreed well with the mineralogical composition result shown in
Table 2, as the amount of cristobalite phase in 1200 °C-sintered cenospheres was 56 wt.%. So, it can be concluded that a preheating treatment at a temperature between 1000 to 1200 °C could be used to increase the softening point and enhance the thermal expansion property of the cenospheres.
As mentioned earlier, cenospheres were thermally unstable as a result of the continuous phase evolution. Because of this thermal property, non-heat-treated cenospheres may not be suitable for being used as a pore-forming agent in ceramics unless a heat treatment is applied. A small study on the effect of using heat-treated and non-heat-treated cenospheres as a pore-forming agent in ceramic was conducted to validate the claim. In the study, 30 wt.% of non-heat-treated cenospheres and 1100 °C-sintered cenospheres were mixed together with 70 wt.% of kaolin powder (Al
2Si
2O
5(OH)
4, Sigma-Aldrich), respectively. The obtained powders were pressed into pellets of 4 cm in diameter under 1443 kg/cm
2 compression force. The pellets were then sintered at 1200 °C for 4 h at a heating rate of 10 °C/min, subsequently cooled to room temperature by natural convection inside the furnace.
Figure 9 shows the physical appearance of the two sintered pellets. The pellet obtained from 1100 °C-sintered cenospheres retains its pre-sintered form, whereas the pellet obtained from non-heat-treated cenospheres was shattered into pieces during the cooling stage. The shattered pieces were far away from each other, showing signs of high internal stress. When non-heat-treated cenospheres were used as a pore-forming agent in ceramics, during the sintering process, cenospheres would react with the ceramic precursor to form a new compound with a different thermal expansion coefficient. The mismatch in thermal expansion coefficient between different compounds in the ceramic, upon temperature variation, generates an internal stress state and this eventually leads to structural failure during cooling.
