Article

Tris(ethylenediamine) Cobalt(II) and Manganese(II) Nitrates

by
Miguel Cortijo
1,2,
Ángela Valentín-Pérez
1,2,
Mathieu Rouzières
1,
Rodolphe Clérac
1,
Patrick Rosa
2,* and
Elizabeth A. Hillard
1,*
1
CNRS, Université Bordeaux, Centre de Recherche Paul Pascal, UMR 5031, 33600 Pessac, France
2
CNRS, Université Bordeaux, Bordeaux INP, ICMCB, UMR 5026, 33600 Pessac, France
*
Authors to whom correspondence should be addressed.
Crystals 2020, 10(6), 472; https://doi.org/10.3390/cryst10060472
Submission received: 6 May 2020 / Revised: 27 May 2020 / Accepted: 28 May 2020 / Published: 3 June 2020

Abstract

:
Octahedral tris(ethylenediamine) coordination complexes demonstrate helicoidal chirality, due to the arrangement of the ligands around the metal core. The enantiomers of the nitrate salts [Ni(en)3](NO3)2 and [Zn(en)3](NO3)2 spontaneously resolve to form a mixture of conglomerate crystals, which present a reversible phase transition from space group P6322 to enantiomorphic P6522 or P6122, with the latter depending on the handedness of the enantiomer. We report here the synthesis and characterization of [Mn(en)3](NO3)2 and [Co(en)3](NO3)2, which are isostructural to the Zn(II) and Ni(II) derivatives. The Mn(II) analogue undergoes the same phase transition centered at 150(2) K, as determined by single-crystal X-ray diffraction, Raman spectroscopy, and differential scanning calorimetry. The Co(II) derivative does not demonstrate a phase transition down to 2 K, as evidenced by powder X-ray diffraction and heat capacity measurements. The phase transition does not impact the magnetic properties of the Ni(II) and Mn(II) analogues; these high spin compounds display Curie behavior that is consistent with S = 1 and 5/2, respectively, down to 20 K, while the temperature-dependent magnetic moment for the Co(II) compound reveals a significant orbital contribution.

Graphical Abstract

1. Introduction

The octahedral tris(bidentate) ligand geometry is a classic motif in coordination chemistry and it provides an archetypal model for chirality in metal complexes. The two enantiomers are defined by the direction of rotation of the ligand “paddles” when viewed down the threefold axis or pseudo-axis and they are referred to as delta (right turning) and lambda (left turning). The first demonstration of the spontaneous resolution of coordination complexes involved a molecule of this type, [CoIII(en)2(ox)]Br3, which was resolved by Werner from a super-saturated aqueous solution slightly enriched in one of the enantiomers [1]. Indeed many such complex cations are known to form conglomerates, a mechanical mixture of non-centrosymmetric crystals containing only one enantiomer. Although conglomerate crystallization is only predicted for about 5% of organic compounds [2], it might be more common in coordination compounds. A Cambridge Structural Database (CSD) [3] search at the time of this writing of six-coordinate transition metals crystallizing in groups allowing for enantiopure substances (Sohncke groups) yielded almost 19,000 hits, when compared to ca. 204,000 hits when the Sohncke group constraint was removed (thus encompassing both racemates and achiral complexes). Furthermore, it has been remarked that complexes involving bis- or tris-bidentate dissymmetry are particularly susceptible to undergo spontaneous resolution [4].
One of the simplest bidentate ligands is ethylenediamine. Of the 691 crystal structures containing homoleptic [M(en)3]n+, 158 of them crystalize in one of the 65 Sohncke space groups. Among these are the nitrate salts, for which [Ni(en)3](NO3)2 [5] and [Zn(en)3](NO3)2 [6] crystallize as conglomerates in the hexagonal space group P6322 at room temperature. At lower temperatures, 109 K for [Ni(en)3](NO3)2 [7] and 143 K for [Zn(en)3](NO3)2 [8], the compounds undergo a reversible phase transition to a pair of enantiomorphic space groups. For crystals containing the Δ enantiomer the low-temperature phase is P6522, and P6122 for those containing the Λ enantiomer. The same phase transition also occurs in [Ni(en)3](NO3)2 crystals under pressure, with a transition between 0.82 and 0.87 GPa at room temperature [9]. Surprisingly, no other [M(en)3](NO3)2 compounds with divalent transition metals can be found in the CSD, except for that of Cd(II), which, however, crystallizes as a racemate in the centrosymmetric space group I2/a.
The presence of a well-defined and reversible phase transition make [M(en)3](NO3)2 compounds interesting for several applications, such as liquid-nitrogen cryo-calibrants for area-detector diffractometers, since the phase transition is evident from a visual examination of axial photographs [7]. Moreover, the property of chirality in the case of the paramagnetic Ni(II) compound also potentially allows magneto-chiral optical properties, like magneto-chiral dichroism or magnetization-induced second harmonic generation [10,11]. For these reasons, we wished to extend the series of [M(en)3](NO3)2 complexes to other transition metals.
Here, we report the synthesis and structures for the cobalt(II) and manganese(II) analogues. Both of the new complexes are isostructural with the previously reported nickel(II) and zinc(II) analogues, and undergo spontaneous segregation of the enantiomers during crystallization. [Mn(en)3](NO3)2 undergoes a phase transition from P6322 to P6122 or P6522 at 150(2) K, while [Co(en)3](NO3)2 does not show any transition, as evidenced by Raman spectroscopy, X-ray diffraction, differential scanning calorimetry, and heat capacity data (the latter down to 2 K). Variable temperature and field magnetic data for these compounds, as well as the nickel(II) derivative, demonstrate paramagnetism down to 2 K, with a notable orbital contribution arising from the high spin Co(II) ion.

2. Materials and Methods

Syntheses of [Mn(en)3](NO3)2 and [Co(en)3](NO3)2 were carried out under argon while using standard Schlenk techniques. Extra dry methanol was purchased from Acros Organics (Thermo Fisher Scientific Geel, Belgium) and deoxygenated with bubbling argon prior to use. Nickel(II) nitrate hexahydrate and manganese(II) nitrate were purchased from Prolabo (Ariana, Tunisia), L-ascorbic acid from Fluka (Charlotte, North Carolina, USA), and ethylenediamine and cobalt(II) and zinc(II) nitrate hexahydrate from Sigma Aldrich (Darmstadt, Germany). All of the chemicals were used as received, except for cobalt(II) nitrate hexahydrate, which was dehydrated by heating for 12 h at 140 °C prior to use.
[Mn(en)3](NO3)2. A solution of Mn(NO3)2 (1.0 g, 5.6 mmol) in methanol (10 mL) was prepared in a Schlenk tube. A layer of methanol (10 mL) was added on top of the solution by slow addition with a syringe. A third layer was formed by the slow addition of a solution of ethylenediamine (1.1 mL, 16.5 mmol) in methanol (10 mL). Colorless irregularly shaped crystals were obtained by diffusion after seven days. Yield (crystalline, incomplete diffusion): 0.23 g (11%). Anal. Calcd. for C6H24N8O6Mn (359.25 g·mol−1) C, 20.06; H, 6.73; N, 31.19%. Found: C, 20.14; H, 6.66; N, 31.12%. FT-IR ( ν ¯ ,   cm−1): 3322(s), 3270(s), 3169(w), 2934(m), 2891(m), 1747(w), 1611(m), 1578(s), 1458(w), 1402(s), 1349(s), 1319 (s), 1279(s), 1129(m), 1111(m), 1070(w), 1013(s), 971(m), 864(w), 823(m), 707(m), and 617(s).
[Co(en)3](NO3)2. A solution of Co(NO3)2 (0.6 g, 3.3 mmol) and ascorbic acid (0.01 g, 0.06 mmol) in methanol (3 mL) was prepared in a Schlenk tube. A layer of methanol (13 mL) was added on top of the solution. A third layer was formed by the slow addition of a solution of ethylenediamine (0.7 mL, 10.5 mmol) in methanol (3 mL). Orange needles were obtained by diffusion after two days. Yield (crystalline, incomplete diffusion): 0.47 g (38%). Anal. Calcd. for C6H24N8O6Co (363.24 g·mol−1) C, 19.84; H, 6.66; N, 30.85%. Found: C, 19.74; H, 6.43; N, 30.50%. FT-IR ( ν ¯ ,   cm−1): 3322(s), 3273(s), 3172(w), 2937(m), 2894(m), 1748(w), 1625(m), 1580(s), 1457(w), 1402(s), 1352(s), 1319 (s), 1281(s), 1135(m), 1114(m), 1083(w), 1025(s), 972(m), 869(w), 824(m), 708(m), and 634(s).
[Ni(en)3](NO3)2. Single crystals of the compound were obtained following a literature procedure [12]. Anal. Calcd. for C6H24N8O6Ni (363.00 g·mol−1) C, 19.85; H, 6.66; N, 30.87%. Found: C, 19.79; H, 6.60; N, 30.63%. FT-IR ( ν ¯ ,   cm−1): 3324(s), 3275(s), 3176(w), 2938(m), 2895(m), 1748(w), 1594(s), 1583(s), 1458(w), 1402(s), 1347(s), 1326(s), 1281(s), 1135(m), 1115(m), 1028(s), 986(m), 873(w), 842(m), 708(m), and 646(s).
[Zn(en)3](NO3)2. Single crystals of the compound were obtained following a literature procedure [8]. Anal. Calcd. for C6H24N8O6Zn (369.70 g·mol−1) C, 19.49; H, 6.54; N, 30.31%. Found: C, 19.79; H, 6.60; N, 30.63%. FT-IR ( ν ¯ ,   cm−1): 3328(s), 3276(s), 3172(w), 2937(m), 2894(m), 1748(w), 1620(m), 1582(s), 1458(w), 1401(s), 1349(s), 1329(s), 1279(s), 1130(m), 1114(m), 1018(s), 973(m), 868(m), 824(s), 708(m), and 632(s).
CHN elemental analyses were performed by the Service d’Analyse Elémentaire in Nancy, France. The IR spectra on polycrystalline samples were measured on a Nicolet 6700 FTIR spectrometer (Thermo Fisher Scientific, Geel, Belgium) equipped with a SMART iTR™ accessory, giving spectra consistent with the literature [13]. Differential scanning calorimetry (DSC) was performed on a DSC Q2000 apparatus (Perkin Elmer, Wellesley, Massachusetts, USA) at 5 K/min. scanning rate under nitrogen atmosphere using an open aluminum pan. Transition enthalpy changes were obtained by integration of the DSC peaks using TA Universal Analysis 2000 software, Version 4.5A (New Castle, Delaware, USA).
Magnetic susceptibility measurements were performed while using a MPMS-XL SQUID magnetometer (Quantum Design, San Diego, California, USA) on crushed single crystals of [Mn(en)3](NO3)2 (30.33 mg), [Co(en)3](NO3)2 (10.48 mg) and [Ni(en)3](NO3)2 (12.31 mg) introduced in a polyethylene bag (3 × 0.5 × 0.02 cm3). Movement of the cobalt crystallites was prevented by adding a small amount (4.78 mg) of Paratone oil to the sample due to the expected high anisotropy of the cobalt complex. Prior to the measurements, field dependent magnetization was measured at 100 K in order to detect bulk ferromagnetic impurities. The data were corrected for the diamagnetic contribution of the sample and the sample holder (and the oil for the Co(II) measurements). EPR was performed on a polycrystalline sample in a quartz tube on an EMX X-band (9.54 Gz) spectrometer (Bruker, Billerica, Massachusetts, USA) at 5 K while using a continuous-flow cryostat.
Heat capacity measurements were done with a PPMS system (Quantum Design, San Diego, California, USA) that was equipped with the heat capacity module. The polycrystalline compound (20.56 mg) was compacted with a handpress. Apiezon N grease was used to ensure a good thermal contact between the pellet and the detection platform.
Raman measurements were performed with a Jobin-Yvon LabRAM HR800 high spectral resolution confocal spectrometer (Horiba, Kyoto, Japan) between 0 and 3500 cm−1, with a Peltier-cooled CCD detector at –67 °C. A 1200 groove cm−1 grating was used for the Raman spectral dispersion after excitation with a green Coherent Sapphire 532-50 SF CW solid state laser source (λ = 531.97 nm). A 50 × NA 0.6 objective (Mitutoyo, Kawasaki, Japan) was used for laser excitation and visible light epi-collection. The Continuous Rapid Extended Scanning Technique (CREST) scanning mode with a sub-pixel factor of 5 or 6 was used to reach maximum resolution. The laser power was limited to 20 mW, and it was further attenuated by a 10% filter (Mn, Co complexes) or a 50% filter (Ni, Zn complexes). For Raman energy shift calibration, 99% pure naphthalene was measured and an average corrective shift was calculated from least square fits of eight peaks as compared to a reference spectrum [14]. Temperature control was performed while using a LTS420 microscopy stage(Linkam, Tadworth, UK) that was cooled with the LNP96 liquid nitrogen pump.
Crystals that were suitable for single X-ray diffraction were selected under immersion oil in ambient conditions and attached to a microloop (MiTeGen, Ithaca, New York, USA). The crystals were mounted in a stream of nitrogen at the appropriate temperature and centered in the X-ray beam while using a video camera. Data collections were performed with Mo Kα (λ = 0.71073 Å) radiation on a Quazar SMART APEX II (Bruker, Billerica, Massachusetts, USA), operating at 50 kV and 30 mA using graphite monochromated radiation. The data were collected using a routine to survey reciprocal space, and data reduction was performed using the software included in Bruker Apex2 suite [15]. The structures were solved using direct methods [16], except for Λ-[Co(en)3](NO3)2, which was solved by intrinsic phasing at 120 K [17]. Non-hydrogen atoms were anisotropically refined using weighted full-matrix least-squares on F2, followed by difference Fourier synthesis in the Olex 2 program (Durham, UK) [18] or SHELXL [16]. All hydrogen atoms were included in the final structure factor calculation at idealized positions. CCDC 1992450–1992451 and 2000629–2000634 contain the crystallographic data for this paper. These data can be obtained free of charge from the Cambridge Crystallographic Data Centre via www.ccdc.cam.ac.uk/data_request/cif.
The study of the phase transition of [Mn(en)3](NO3)2 by single-crystal X-ray diffraction was done on a single crystal mounted on a MiTeGen microloop using Paratone oil. In two experiments, it was measured on a Bruker-Nonius κ-CCD and a Bruker KAPPA APEX II diffractometers (Bruker, Billerica, Massachusetts, USA), operating at 50 kV and 30 mA, while using graphite monochromated Mo Kα (λ = 0.71073 Å) radiation. On the APEX II, data collection and reduction proceeded following the same procedure as that described above. On the κ-CCD, the Denzo and Scalepack programs [19] were used. Cooling and heating were done at a rate of 1 K/min. and waiting five minutes at the desired temperature before collecting the data. Powder X-ray diffraction data were recorded while using a X’Pert PRO MPD diffractometer (PANalytical, Malvern, UK) with Bragg–Brentano geometry and Cu-Kα radiation (λ = 1.54184 Å), using standard Al sample holders.

3. Results and Discussion

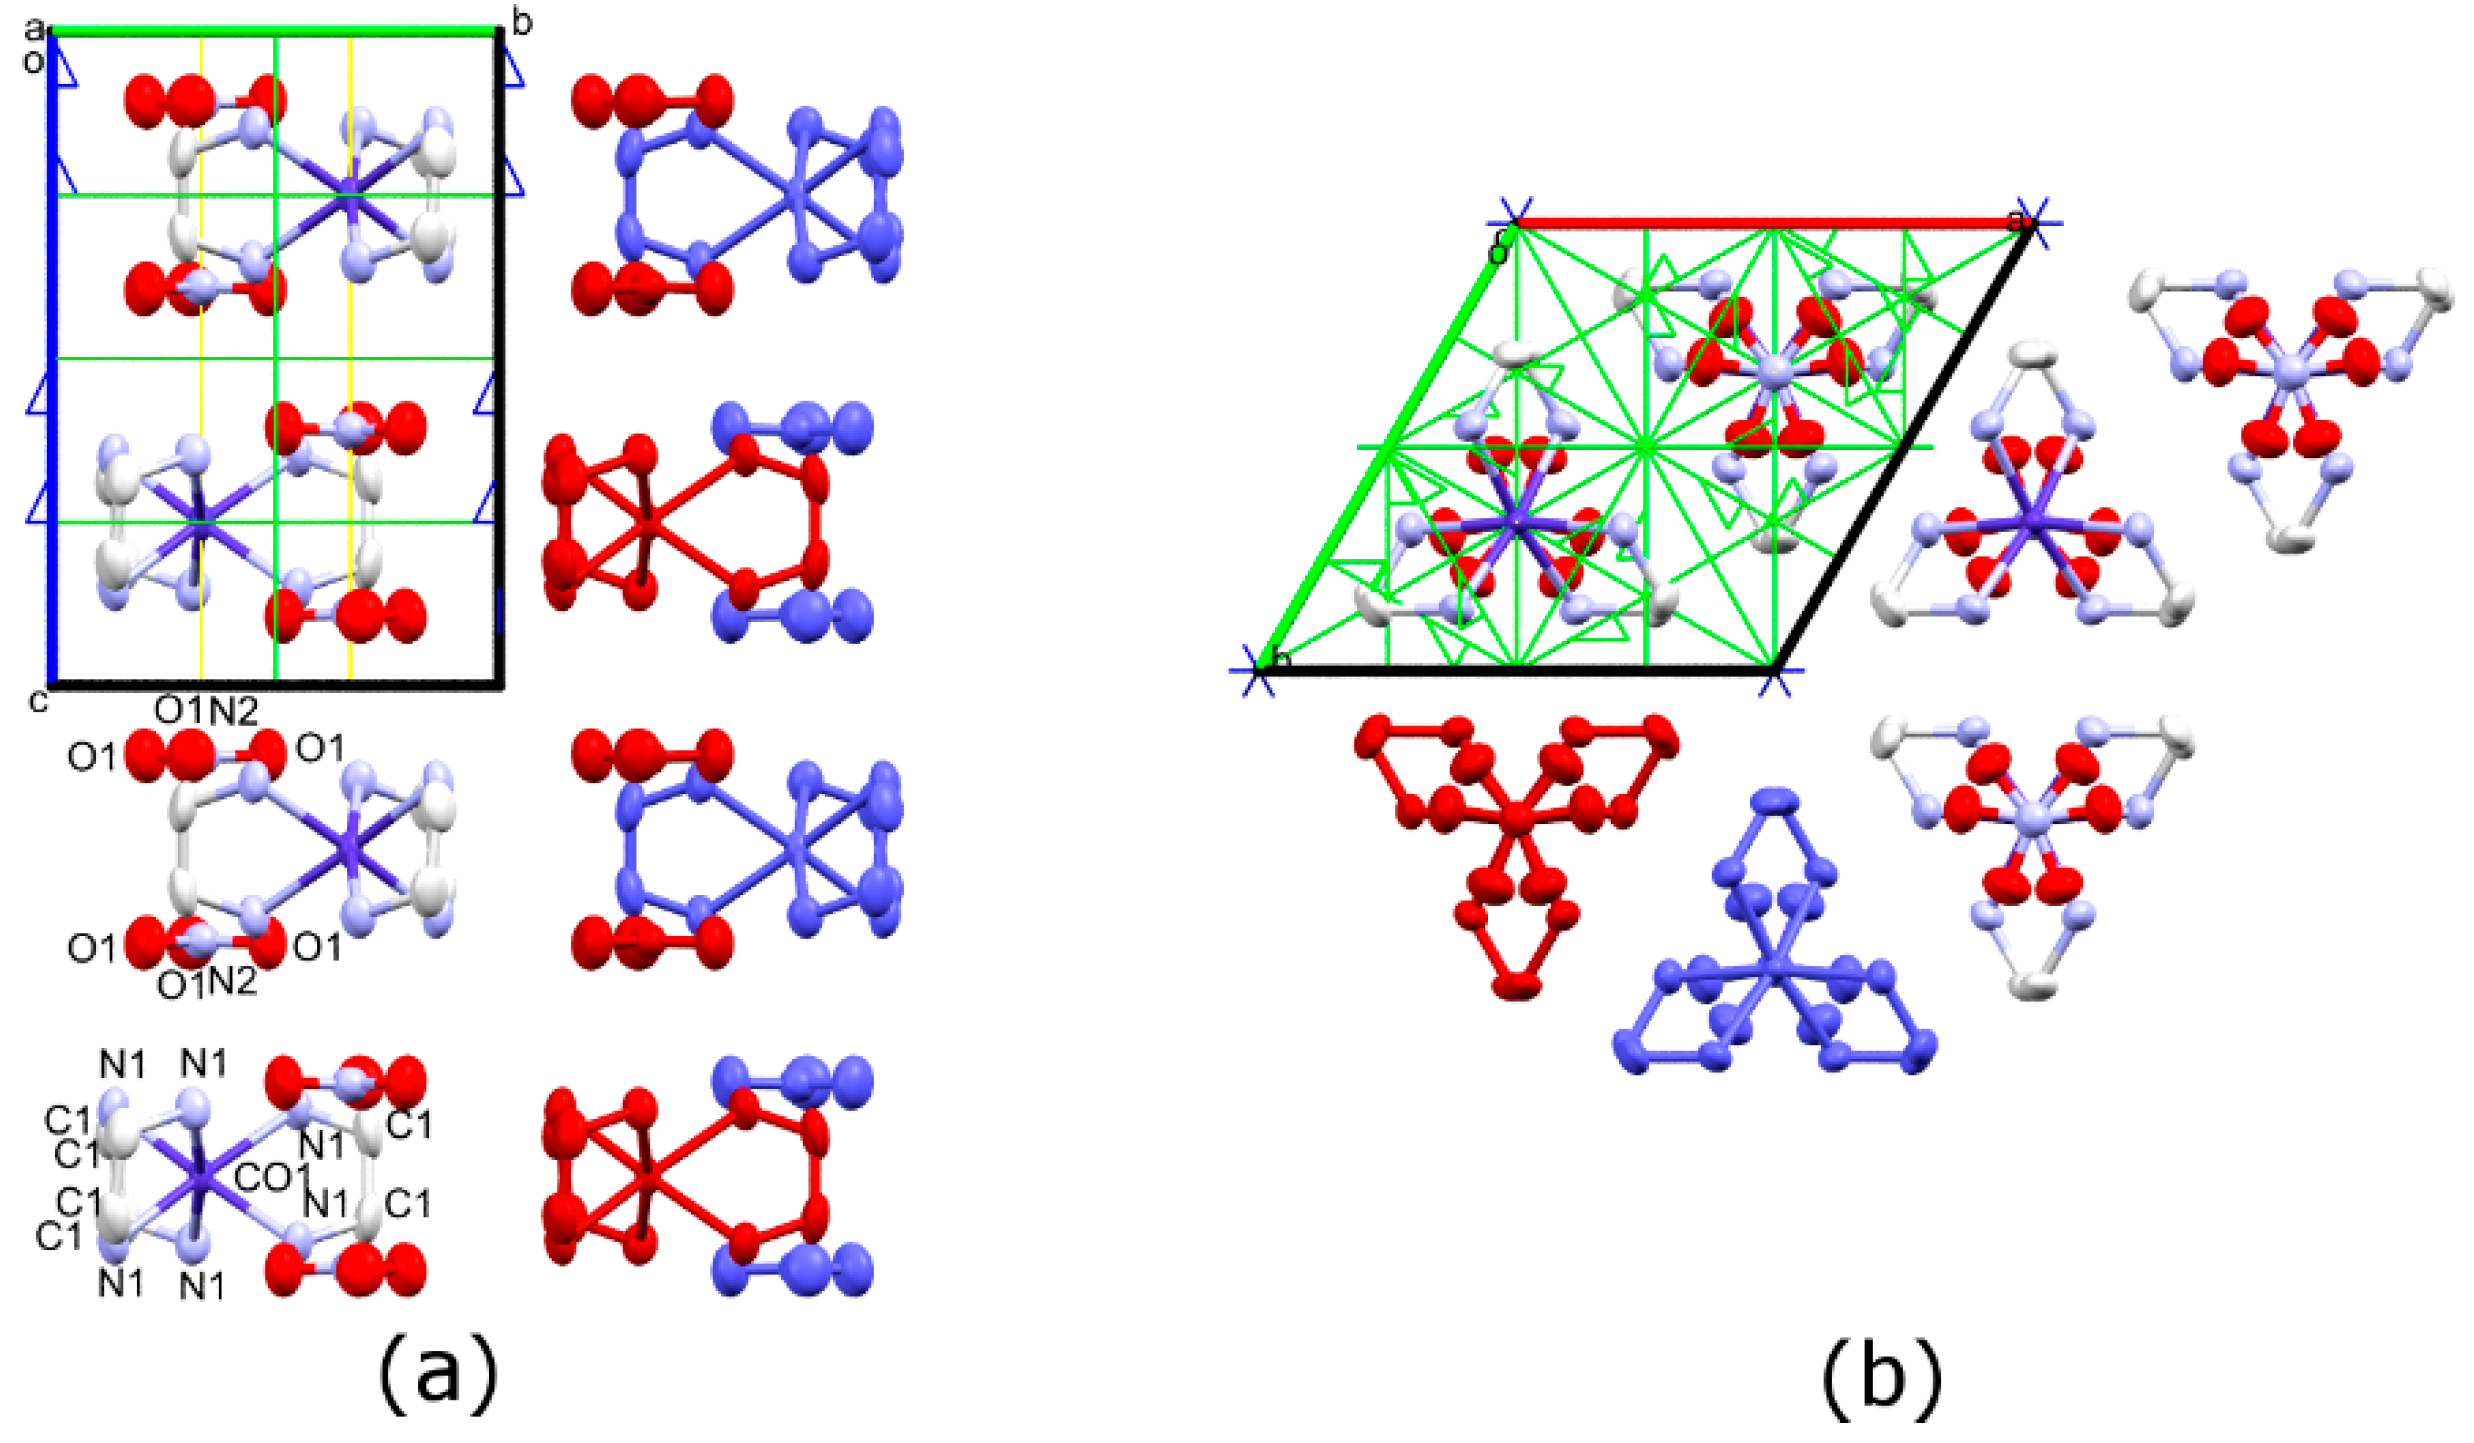
3.1. Synthesis and Crystal Structures

The crystallographically uncharacterized [M(en)3](NO3)2 salts of Mn(II) and Co(II), as well as the known Ni(II) and Zn(II) derivatives, were prepared by the combination of ethylenediamine and the appropriate metal(II) nitrate. For the Ni(II) and Zn(II) complexes, the reagents were solubilized in water, which was allowed to slowly evaporate in air at ambient conditions to give crystals. The more air-sensitive Mn(II) and Co(II) complexes were prepared by layering a methanol solution of ethylenediamine onto a methanol solution of M(NO3)2 in a Schlenk tube under argon. The slow diffusion of the solutions yielded crystals at the interface after a few days.
[Mn(en)3](NO3)2 and [Co(en)3](NO3)2 crystallize as conglomerates, and are isostructural to the Ni(II) [5] and Zn(II) [6] analogues at room temperature. Crystal structures collected at 298 K for both enantiomers of [Mn(en)3](NO3)2 and [Co(en)3](NO3)2 were solved in the hexagonal space group P6322 (Table 1). The asymmetric unit consists of one-third of the octahedral M(II) complex and one-third of each of the two nitrate counter-anions. Table 2 provides selected bond distances and angles; the only important difference between the two transition metal complexes is that the M-N bond distance is about 0.1 Å shorter in [Co(en)3](NO3)2. The three N-M-N angles in the structures deviate moderately from 90°, and this is especially pronounced for the Mn(II) derivative. A Continuous Shape Measure analysis [20] referenced to ideal octahedral and trigonal prismatic geometry, was performed based on the crystal structures, and only included the metal ion and six nitrogen atoms. It indicated that the arrangement of the nitrogen atoms around the metal of both complexes at room temperature is octahedral, with deviations from an ideal octahedron of 1.14 for Λ-[Mn(en)3](NO3)2 and 0.680 for Δ-[Co(en)3](NO3)2 and much larger deviations from trigonal prismatic of 12.3 and 13.3, respectively. The Ni(II) and Zn(II) complexes are also octahedral, with deviations of ~0.50 and 0.77, respectively.
The cations (C) and anions (A) are aligned in columns, which are stacked in an A C A pattern, as can be seen in Figure 1a. Hydrogen bonding interactions of about 2.3 Å are observed between the N-H of the ethylenediamine ligand and the oxygen atoms of the NO3 anion to form hydrogen bonded A C A groups within a single column (Figure S1). The columns, which run along the c crystallographic direction, are then packed in a hexagonal arrangement (Figure 1b). Additional inter-column hydrogen bonds between the cations and anions are observed.
It has been shown that both [Ni(en)3](NO3)2 [7] and [Zn(en)3](NO3)2 [8] undergo phase transitions to the hexagonal enantiomorphic space groups P6522 or P6122 below 150 K. At 120 K, the structures of both enantiomers of [Co(en)3](NO3)2 could be solved in the space group P6322, with no evidence of a phase transition that is above this temperature (Table 3). A racemic mixture of [Co(en)3](NO3)2 crystals were finely ground and powder diffractograms were obtained at 12 and 300 K to probe a phase transition lower than 120 K. A comparison of these diffractograms, along with those simulated from the single crystal X-ray structures of the high temperature and low temperature phases of Δ-[Mn(en)3](NO3)2 (Figure S2), shows that there is no similar phase transition for [Co(en)3](NO3)2 down to 12 K. Moreover, heat capacity measurements on polycrystalline [Co(en)3](NO3)2 yielded a featureless curve down to 2 K (Figure S3). Conversely, [Mn(en)3](NO3)2 exhibits the same kind of phase transition as previously observed in the Ni and Zn analogues. At 120 K, the structures of the Δ and Λ enantiomers were solved in the enantiomorphic space groups P6522 and P6122, respectively. In these structures, like their Ni and Zn congeners, the asymmetric unit consists of the metal complex and two nitrate anions with full occupancy. The c parameter is tripled with respect to the P6322 phase, going from an average of 11.306 [3] Å at 298 K to 33.065 [3] Å at 120 K (Table 3). Accordingly, the unit cell volume is approximately tripled and instead of two molecules per unit cell, as in the room temperature structure, at 120 K there are six.
In the low temperature phase, the columns are no longer perfectly aligned, as they are in the P6322 phase (Figure 2). The nitrate ions are slightly tilted with respect to one another, with an angle of 4.6° between the NO3 planes. Furthermore, the central nitrogen atoms of the NO3 and the Mn(II) ions, which were on a proper three-fold axis in the P6322 phase, are now on general positions. These atoms form a gently undulating helix around a three-fold screw axis. The helix backbone, which is comprised of nine atoms, makes one full turn on the order of the unit cell, with torsion angles of 15° and a radius of about 0.3 Å.
The bond distances for the respective compounds are similar at the two measured temperatures (compare Table 2 with Table 4), with the most important difference being an elongation of about 0.02 Å of the N-O distance in both the Co(II) and Mn(II) derivatives at high temperature. Continuous Shape Measure analyses show that the [Mn(en)3]2+ complex does not significantly change its geometry upon the phase transition, only adopting a slightly more regular octahedral geometry at 120 K, with a residual value of 1.10 (versus. 1.14 at 298 K).

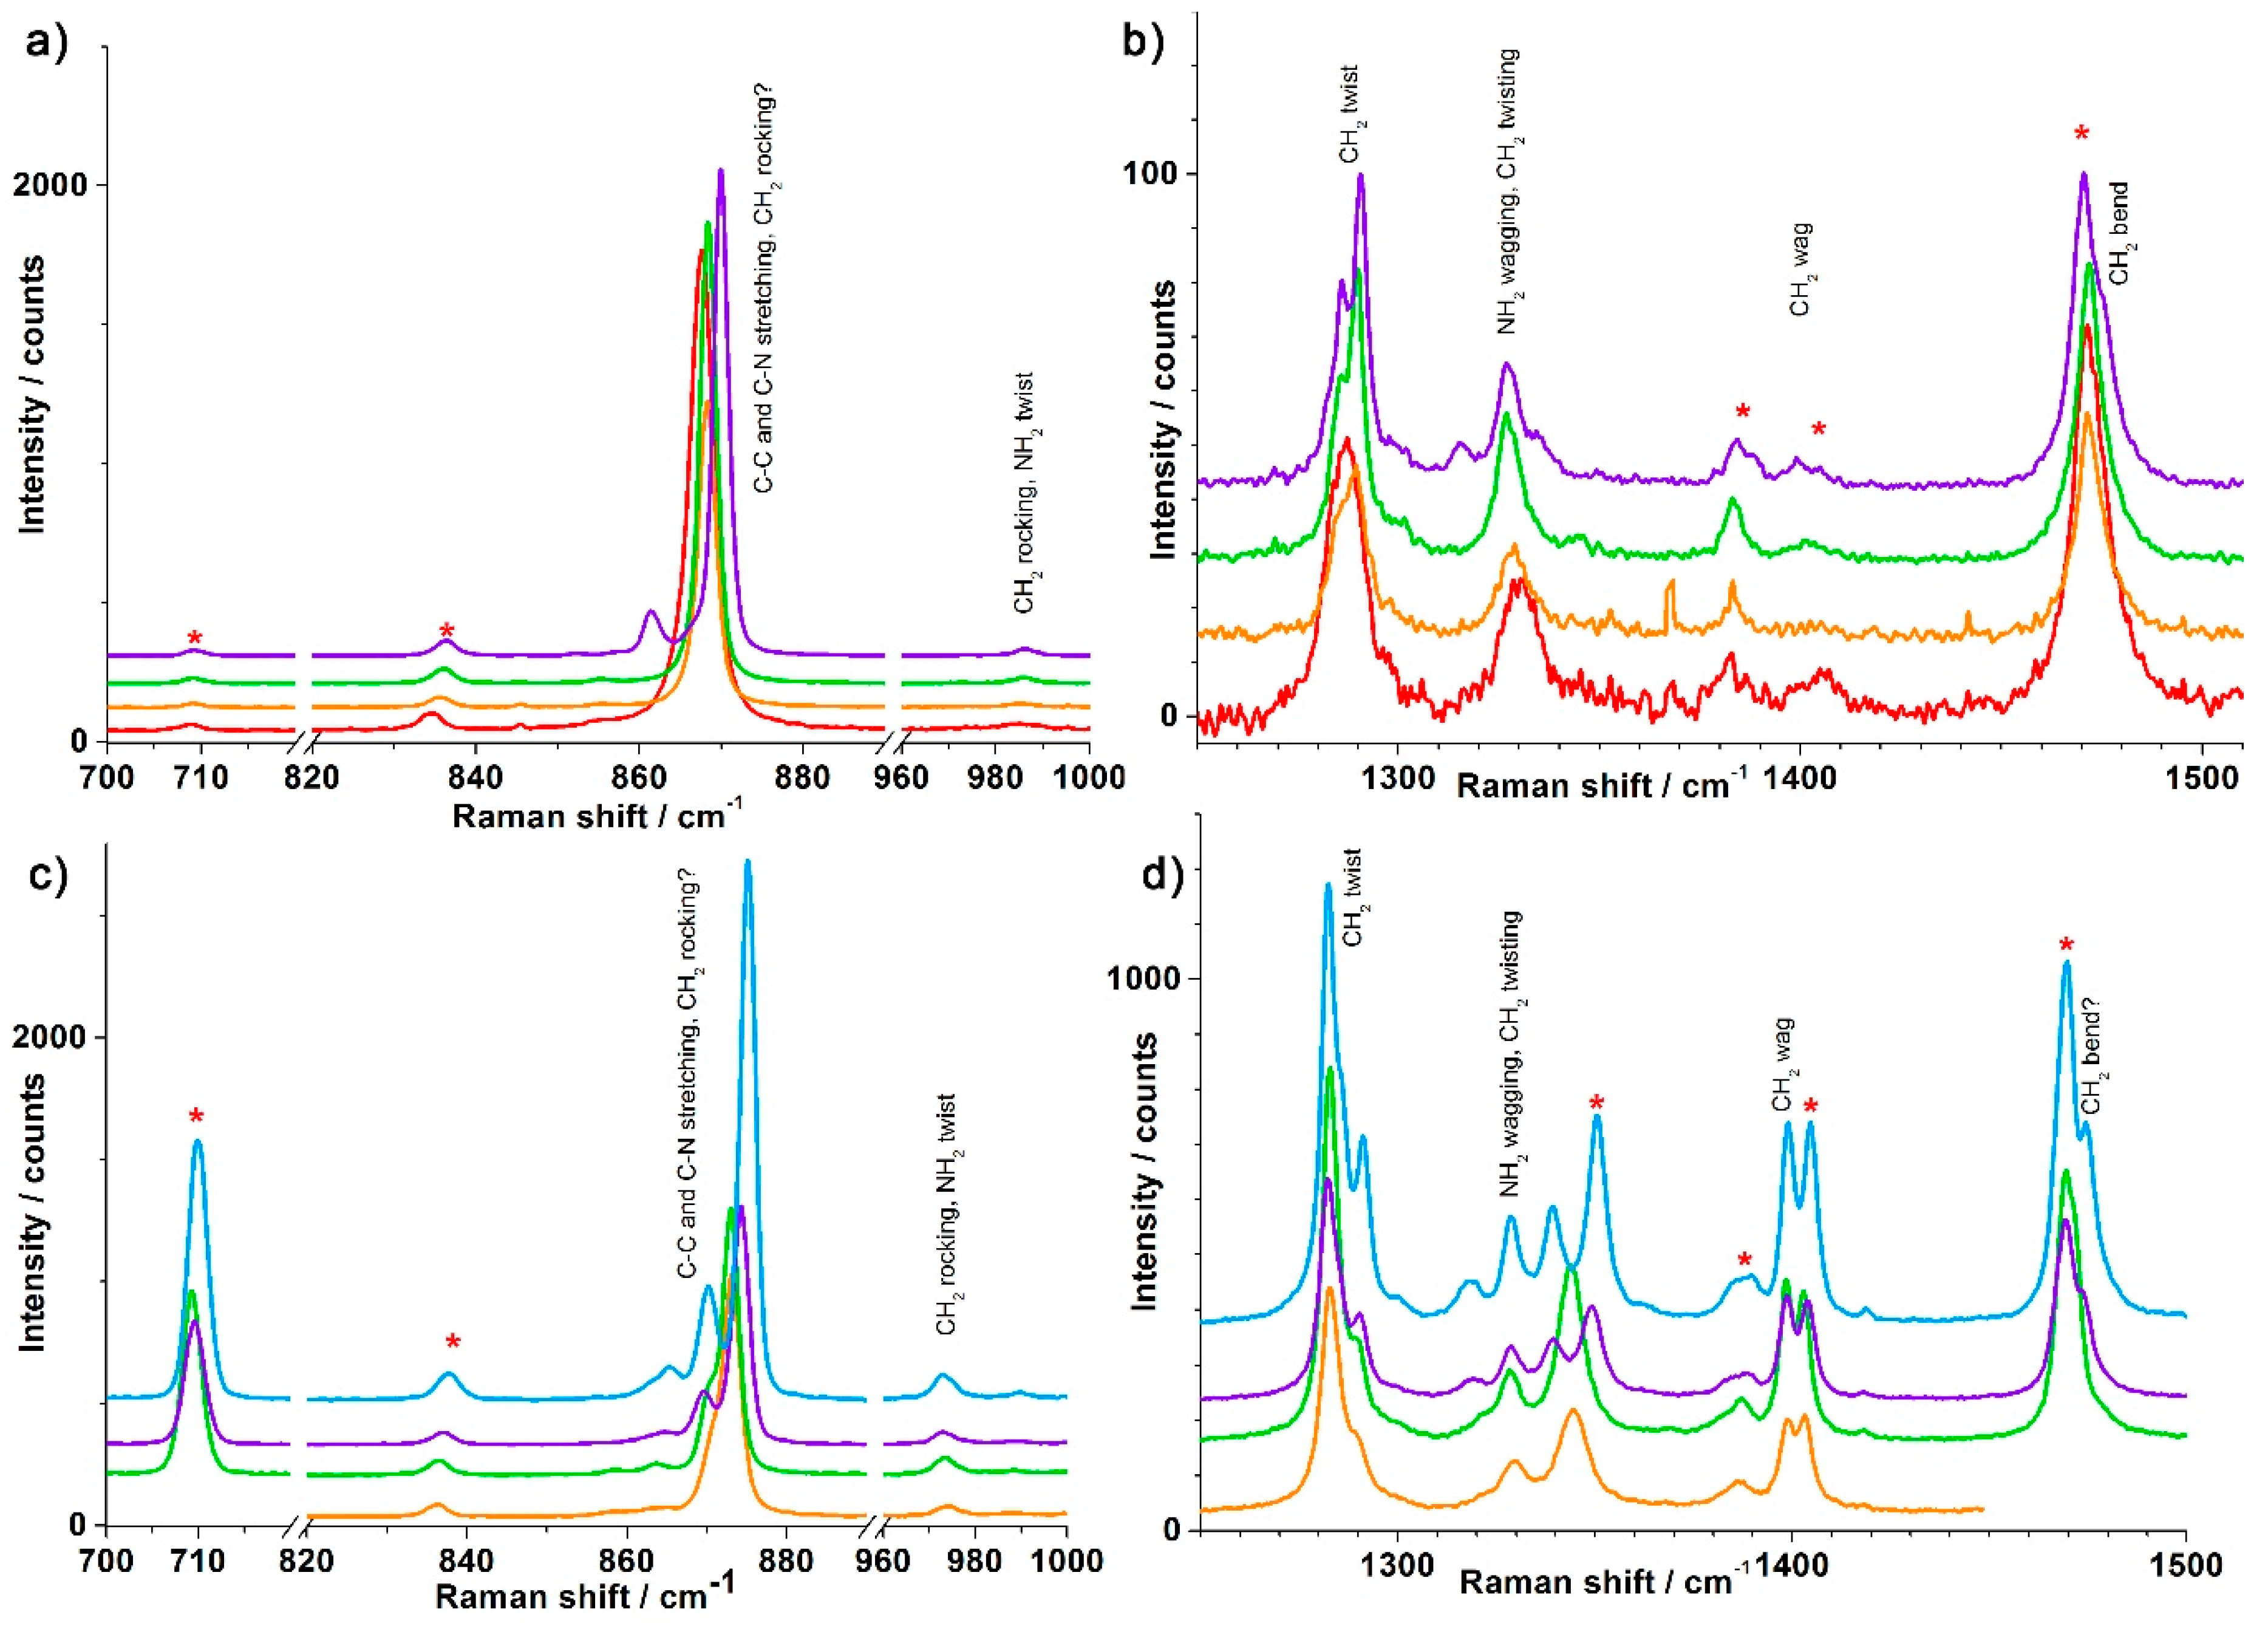
3.2. Magnetic Properties

The magnetic moments of [Mn(en)3](NO3)2, [Co(en)3](NO3)2 and [Ni(en)3](NO3)2 were obtained between 1.85 and 300 K (Figure 3), and the isothermal field dependent magnetizations were measured between 1.85 and 8 K (Figures S4–S6). The Ni(II) and Mn(II) complexes show Curie behavior above 20 K, with effective moments of 3.10 and 5.93 μB, respectively. These values agree well with the respective 3A2g and 6A1g ground states that are expected for these octahedral ions, being slightly larger than the calculated spin-only value for the Ni(II) S = 1 spin (2.82 μB, g = 2) and identical to the theoretical value for the high spin Mn(II) S = 5/2 spin (5.92 μB). For both complexes, μeff decreases below 20 K. While for Mn(II), magnetic anisotropy is known to be vanishingly small and, thus, this decrease is most likely due to antiferromagnetic intermolecular interactions, Ni(II) is expected to show appreciable anisotropy, both in the g factor and zero-field splitting (ZFS) of the ground state. Since the crystal structures are isomorphous, intermolecular interactions should have a similar strength in all compounds, and they were classically modeled in the mean-field approximation. Thus, we fitted the temperature dependence of μeff for both complexes using equations (1) and (2) with the PHI software [21] using the following spin Hamiltonian (1) and mean-field approximation (2):
H ^ N i , M n = D ( S ^ z 2 1 3 S ( S + 1 ) ) + μ B ( g x S ^ x B x + g y S ^ y B y + g z S ^ z B z )
χ = χ c a l c 1 χ c a l c ( z J N g 2 μ B 2 )
where D is the zero-field splitting parameter, Bx, By, and Bz are the three components of the magnetic field, gx, gy, and gz are the three components of the g-tensor (with g = ( g x 2 + g y 2 + g z 2 ) / 3 ), S ^ x , S ^ y , and S ^ z are the three components of the S ^ -vectorial operator, χcalc is the calculated magnetic susceptibility from the Hamiltonian (1), and J is the exchange coupling between molecules in the mean field approximation. For the Mn(II) complex, a simultaneous fit of magnetic susceptibility and magnetization data yielded an isotropic g = 2.012(1) and zJ/hc = −0.0377(9) cm−1. The plot of the isothermal reduced magnetization with field shows well superimposed curves (Figure S4) and, accordingly, including ZFS in the fit did not have a significant influence. The magnetization at 1.85 K saturates at high field, with a limit of 5.24 NμB. For the Ni(II) complex, a similar fit was performed with an axial tensor for g, including both ZFS and intermolecular interactions. The fit yielded gx = gy = 1.475(7), gz = 3.09(1), D/hc = 0.749(9) cm−1, and zJ/hc = −0.136(4) cm−1. While the non-zero value of D accounts for the non-superimposition of the curves in the reduced magnetization plot (Figure S5), the intermolecular interactions in [Ni(en)3](NO3)2 appear to be curiously stronger than for the Mn(II) complex.
For the Co(II) complex, the situation is more complicated. The effective moment at room temperature of 4.72 μB is much larger than the calculated spin-only value for an S = 3/2 spin with g = 2 (3.87 μB), which is in agreement with a high spin Co(II) complex with significant first-order orbital momentum contribution, arising from the ground orbital triplet 4T1g of Co(II) in an octahedral crystal field [22]. The field dependent magnetization data show that quasi-saturation at 1.85 K is reached at high fields with a limit of 2.29 NμB (Figure S6).
We followed an approach recently described for two pseudo-octahedral HS Co(II) complexes [22,23,24], which follows from that originally developed by Griffith, and adapted for axial symmetry by Sakiyama [25], and then for rhombic symmetry in the PHI software [21] while using the Hamiltonian:
H ^ C o = α λ S O L ^ · S ^ + α 2 B 2 0 ( 3 L ^ z 2 L ^ 2 ) + 1 2 α 2 ( L ^ + 2 + L ^ 2 ) + μ B ( α L ^ · I + g e S ^ · I ) · B
where S ^ and L ^ are the spin and orbital operators, α the orbital reduction factor, λSO the spin-orbit coupling constant (set here to −170 cm−1), B 2 0 the crystal field parameter (corresponding to D in a spin Hamiltonian perspective), I the identity operator, and ge the free electron Landé factor.
Using Equation (3) and introducing intermolecular interactions through Equation (2), we again performed a simultaneous fit of magnetic susceptibility and magnetization data for [Co(en)3](NO3)2. Thus, we found α/hc = −1.413(7), B 2 0 / h c = +154(1), and zJ/hc = −0.109(3) cm−1. The calculated effective g values are g// = 2.169 and g = 4.947. The strength of the intermolecular interactions is comparable though slightly lower than for the isomorphous Ni(II) complex. The orbital reduction parameter is slightly larger than previously reported values for other Co(II) complexes [23,24], indicating either a stronger ligand field or higher degree of covalency. This is clearly consistent with the CoN6 coordination sphere studied here, as compared to the CoN4O2 and CoN2O4 coordination spheres of the literature complexes. The broadness of the EPR signal (Figure S7) for the microcrystalline powder prevented us constraining the eigenvalues for the g tensor and, thus, we cannot provide a reliable estimation of the crystal field rhombicity ( B 2 2 parameter) and no precise comment on the magnitude of the crystal field distortion can be made.
For all complexes, alternating current magnetic susceptibility measured under a 3 Oe field oscillating at 100 Hz, without any superimposed dc field, showed no significant out-of-phase signal. Because of reports of single-ion magnetic behavior in an octahedral Co(II) compound [23], dc magnetic fields up to 0.8 T were applied while measuring at 100 Hz. While some out of phase signal appears, the field dependence increased monotonically with no maximum, suggesting the absence of single-molecule magnet behavior.

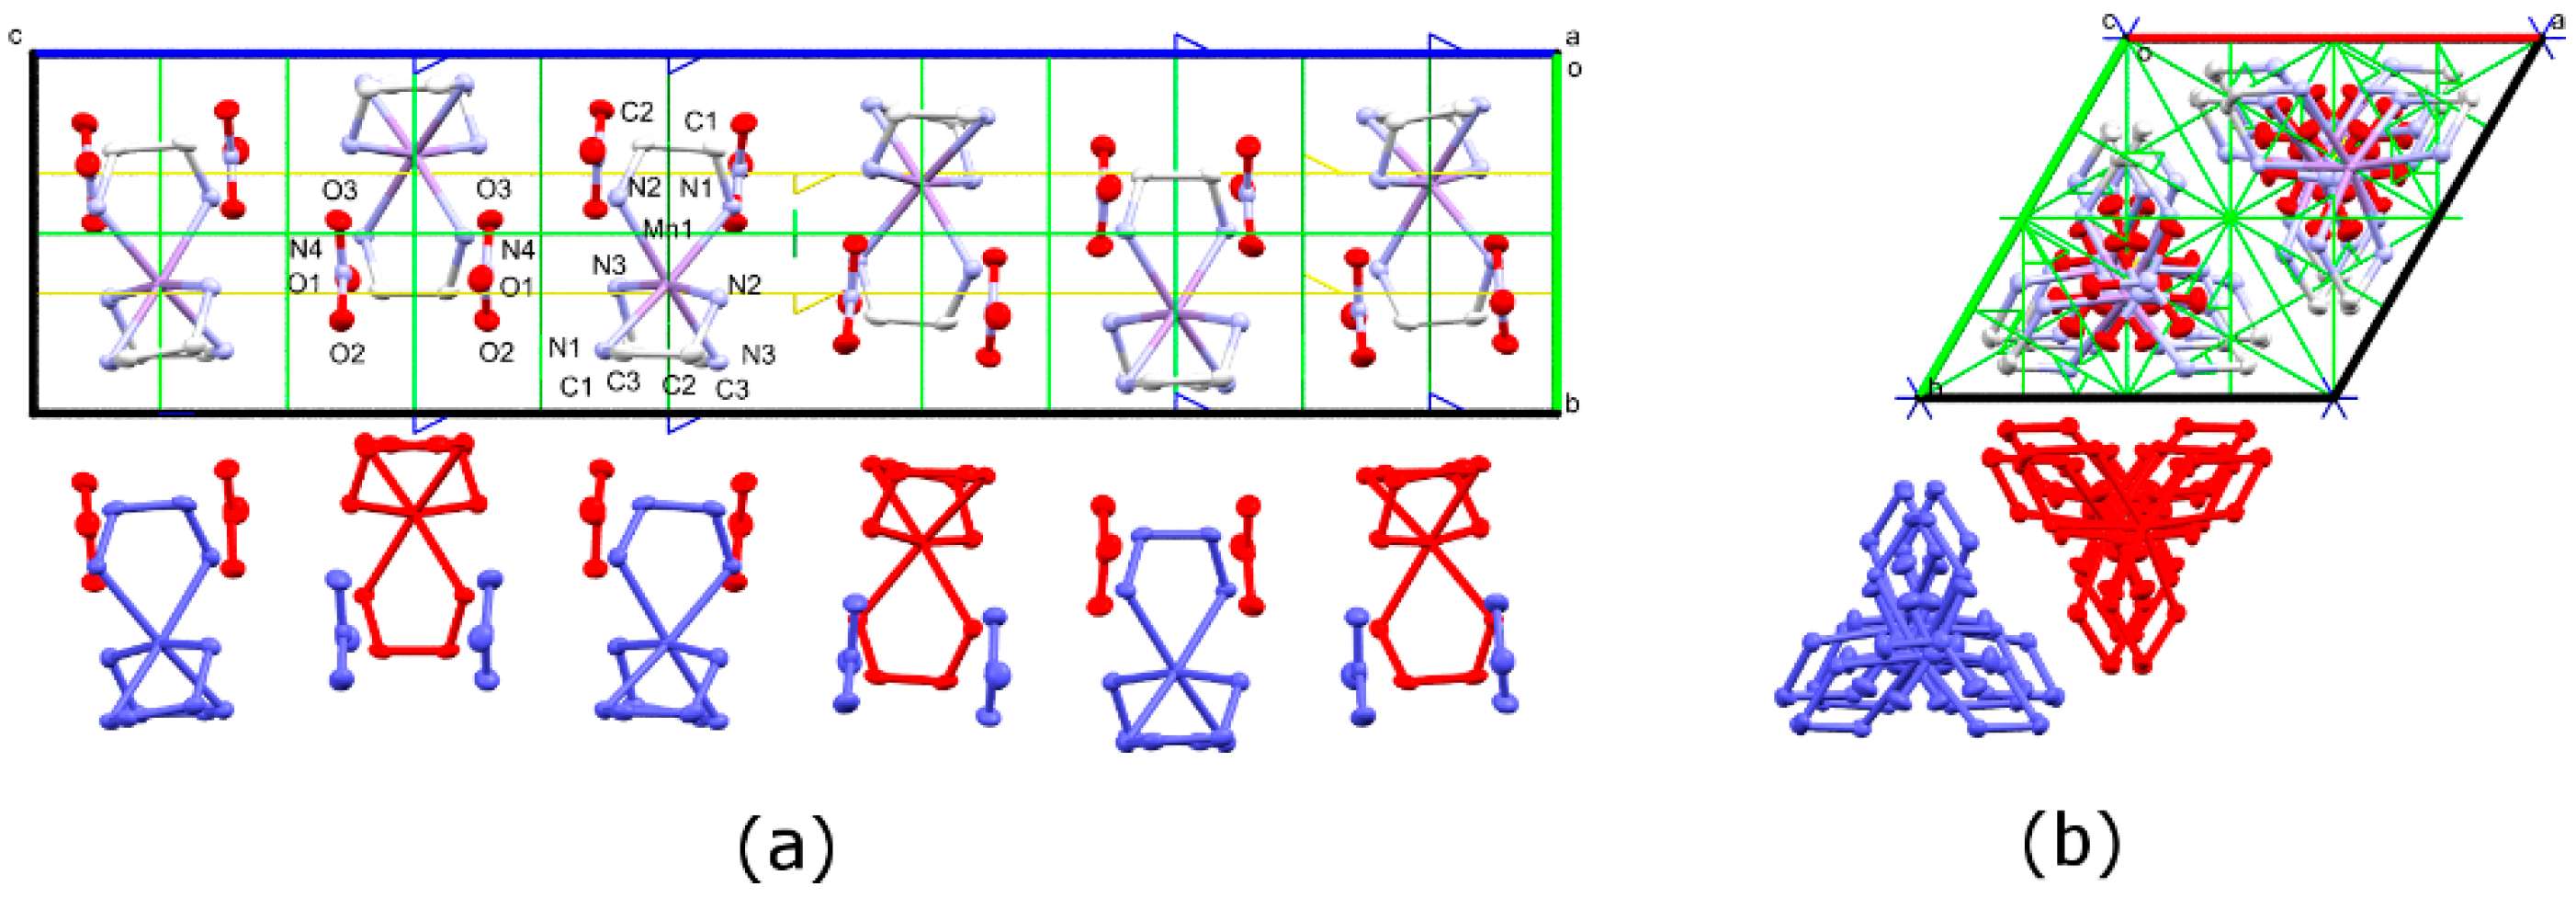
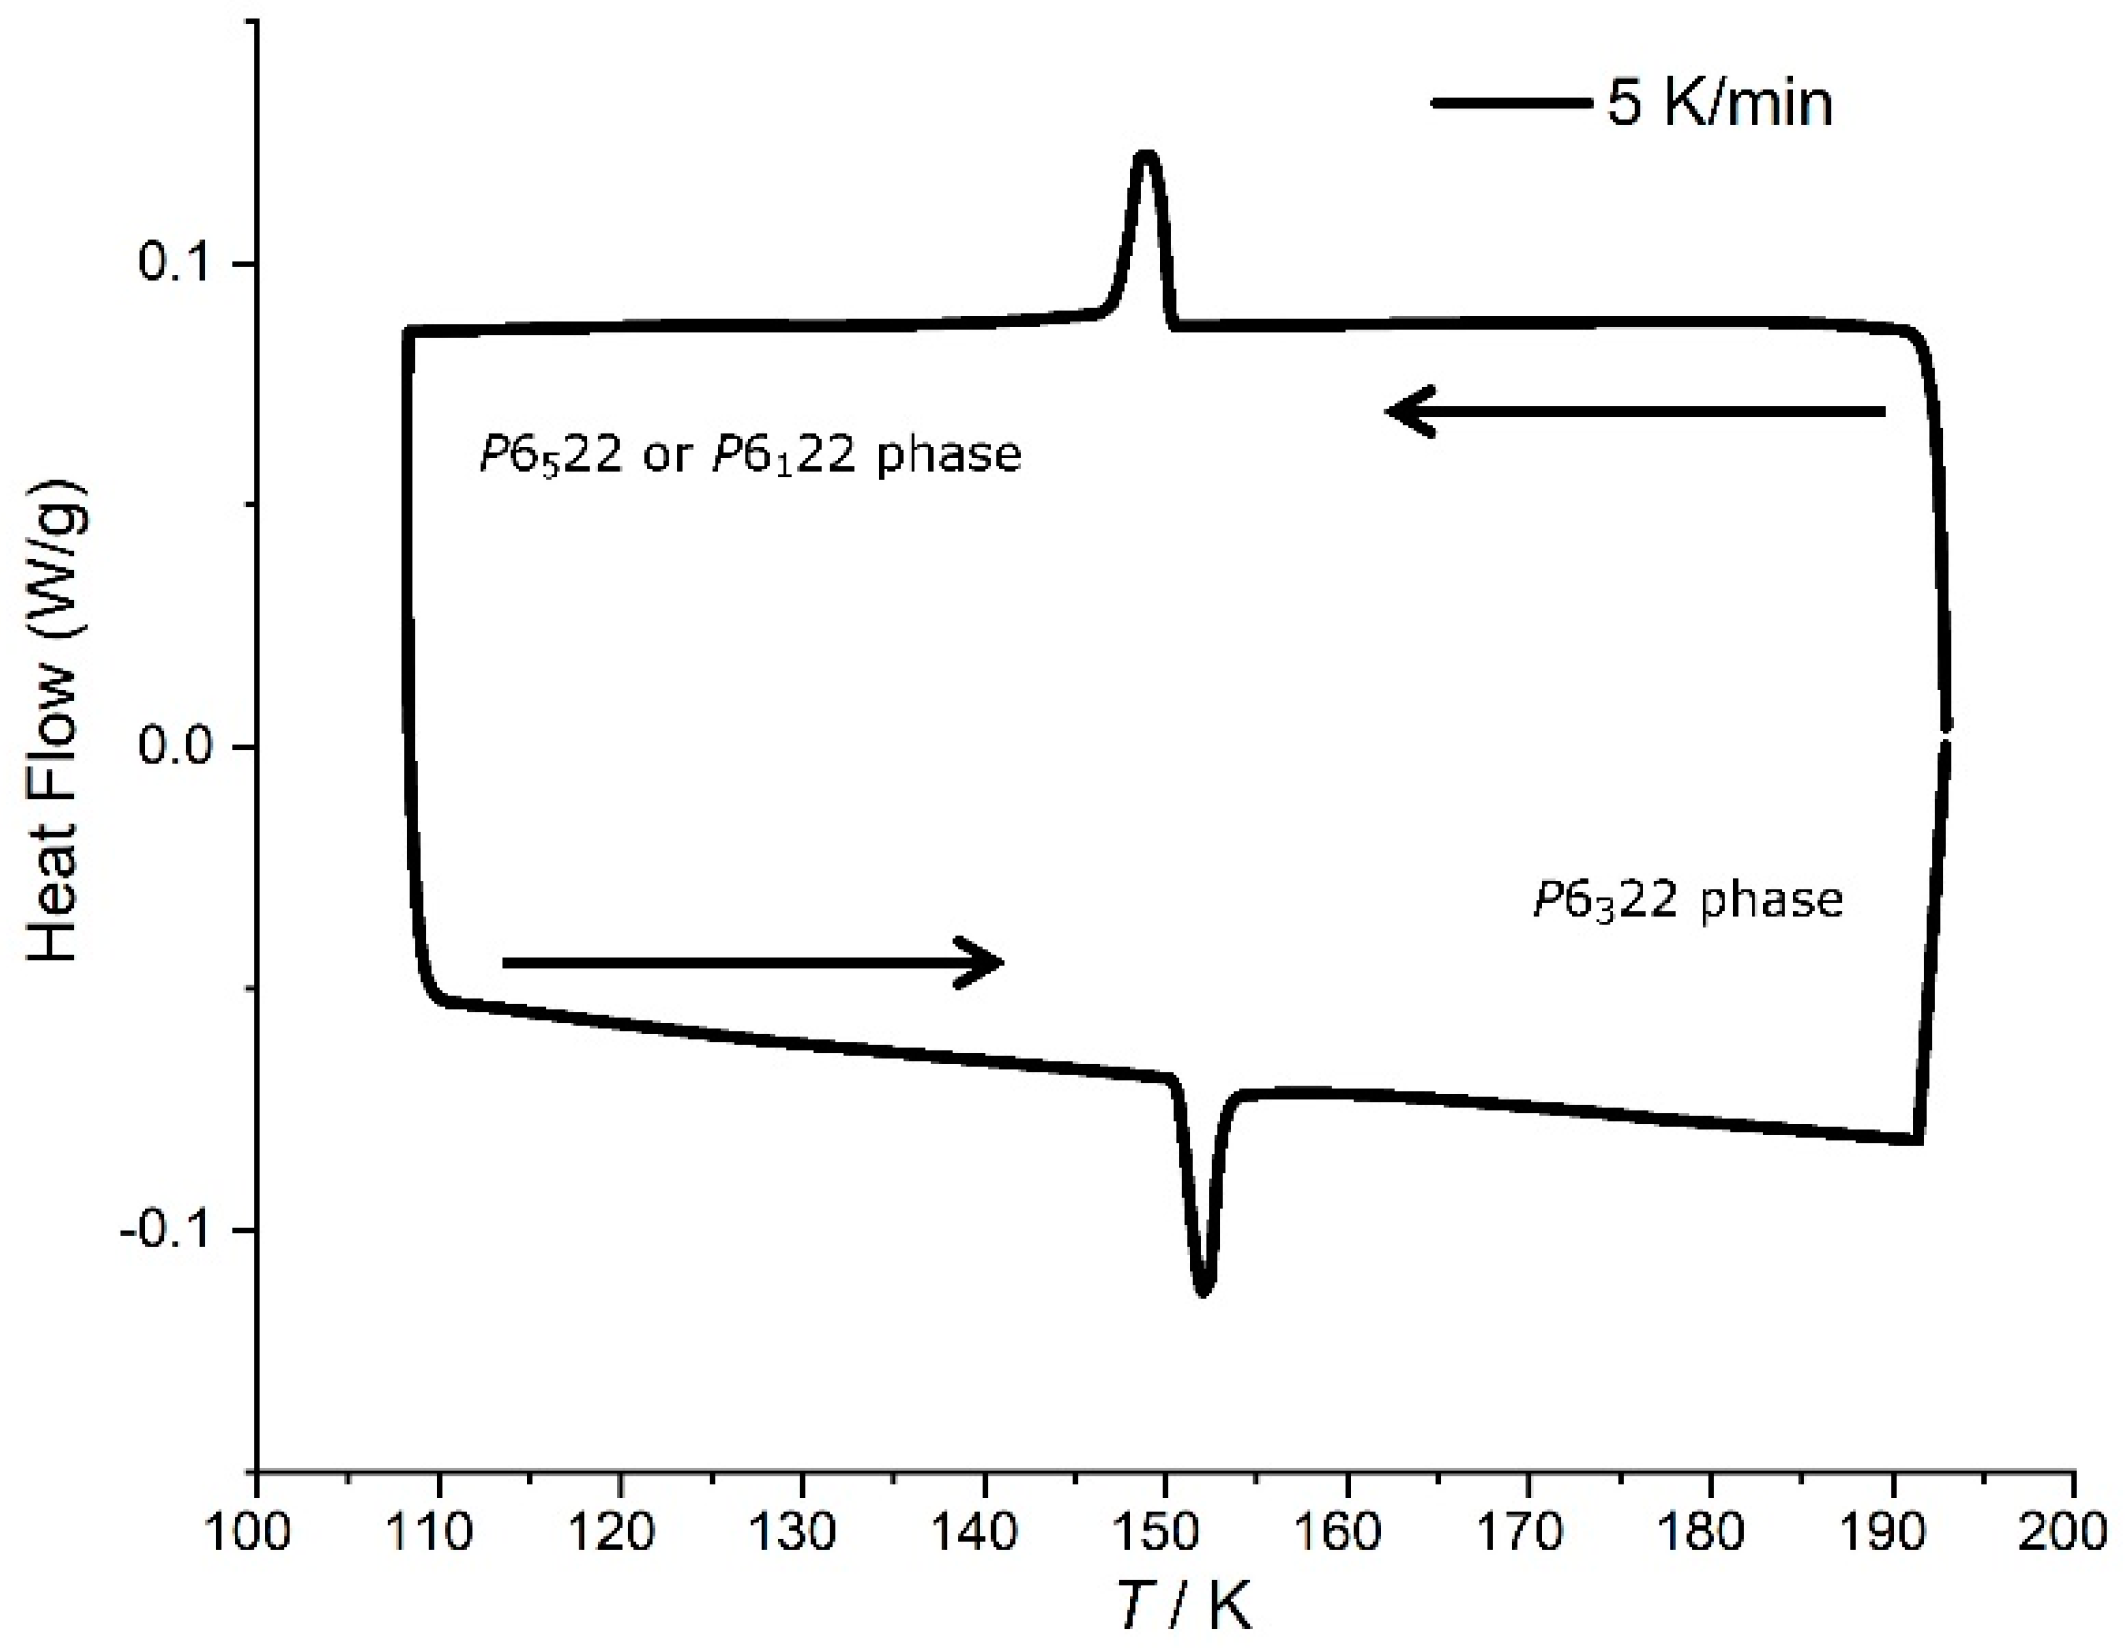
3.3. Phase Transition in [Mn(en)3](NO3)2

The unit cell parameters of a randomly-chosen single crystal of [Mn(en)3](NO3)2 were measured in 2 K increments between 158 K and 140 K by performing extended scans with unit cell indexation. Upon cooling from 158 K, a tripling of the crystallographic c axis was observed between 150 and 148 K, which indicated the transition from the P6322 phase to the P6522 or P6122 phase (Figure 4). When heating from 141 to 155 K, the low temperature phase persisted until 149 K, and the transition to the high temperature phase appeared complete at 151 K, where it was maintained until 155 K. Therefore, the temperature of the reversible phase transition can be estimated at 149(2) K.
An examination of the appearance of Bragg peaks corresponding to the tripled cell close to the transition using 0.2 K temperature increments and a long exposition time suggests that the transition is not as abrupt as could be inferred from Figure 4. Indeed, Bragg peaks pertaining to the low temperature phase begin to appear as high as 152 K in cooling mode, and their intensity continues to increase at least down to 148 K. At 140 K, the peaks are still more intense, which means that the transition is not complete at 148 K. The Supplementary Materials provides further details and the plotted data (Figure S8).
Differential scanning calorimetry (DSC) of [Mn(en)3](NO3)2 crystals was measured in order to confirm the transition temperature 149(2) K obtained by single-crystal X-ray measurements. The system was first equilibrated at 193 K, then cooled to 108 K, and then heated again to 193 K, at a rate of 5 K/min. The obtained DSC curve (Figure 5) displays an exothermic peak upon cooling centered at 149.0 K and an endothermic peak upon heating centered at 152.0 K. Thus, these results give an average phase transition temperature of [Mn(en)3](NO3)2 of 151(2) K, consistent with the crystallographic results. The integration of the exothermic and endothermic peaks gave identical results with ΔH = 277 J/mol, significantly higher than that reported for [Ni(en)3](NO3)2 (142 J/mol), as measured by DSC [7].
Vibrational spectroscopy is a useful technique to follow phase transitions providing that adequate markers may be identified. Thus, we measured variable temperature Raman spectra for Co(II), Mn(II) complexes, and, as a reference, for the Zn(II) complex. Figure 6 shows the most relevant information and the full spectra for the three complexes are reported in the supporting information, for the low energy (0–600 cm−1), the fingerprint (600–1600 cm−1), and the C-H/N-H stretching (2700–3400 cm−1) ranges. Consistent with what was observed by X-ray diffraction, no significant change was observed for the Co(II) complex at different temperatures down to 100 K (Figure S9). For the Mn(II) complex, the phase transition does not dramatically alter the Raman spectrum (Figure 6 and Figure S10). A close inspection shows only very slight and localized changes between spectra above and below the transition temperature. From 700 to 1000 cm−1 (Figure 6a), markers of the phase transition can be observed with an extra band at 861 cm−1 and a shift of the band at 870 cm−1 between 155 and 140 K. From 1250 to 1500 cm−1 (Figure 6b), several differences with temperature are observed: the bands around 1329 cm−1 and 1472 cm−1 clearly double between 155 and 140 K, while an extra band appears at 1315 cm−1 in the spectrum at 140 K.
We observed the same markers for the Zn(II) complex (Figure 6c,d and Figure S11): extra bands at 865 and 870 cm−1, shift of the band at 873 cm−1, doubling of the bands around 1343 cm−1 and 1469 cm−1, and an extra band at 1318 cm−1 between 155 and 135 K. With a better S/N ratio, we were also able to observe various other markers for this complex, which were not observed for the Mn(II) complex: the appearance of peaks at 1019, 1598, 2948 cm−1, and more importantly the doubling of the peak at 3291 cm−1 that is linked to N-H stretching (Figure S11). Concerning the latter, the corresponding peak at 3284 cm−1 of the Mn(II) complex is seen to shift with decreasing temperature in roughly the same way, but without doubling. Indeed, one should anticipate an effect on the N-H stretching bands of the phase transition, given the strong hydrogen bonds between the nitrate anions and those N-H pointing along the trigonal axis of the complex.
Detailed descriptions of vibrational spectra of halide salts of tris(ethylenediamine)metal(II) complexes [13,26] and simple nitrate salts [27] have been reported in the literature, and tentative assignments could be made based on those references. Nevertheless, no spectra have been reported for these [M(en)3](NO3)2 salts, where strong interactions, in particular hydrogen bonding, are present between the cationic complex and all of the surrounding nitrate anions. Thus, we undertook Density Functional Theory calculations of diamagnetic [Zn(en)3]2+ and [Zn(en)3](NO3)2 fragments to support our interpretation of the measured spectra. First, we optimized the [Zn(en)3]2+ fragment in D3 and C2 symmetries derived from the reported crystal structures CSD refcode RAVJAZ (high temperature phase) and RAVJAZ01 (low temperature phase), to see whether the changes in the coordination sphere of the complex were substantial enough to induce different spectra. No differences are observed between spectra calculated for the two different symmetries, as can be seen in Figure S12. We subsequently checked the influence of the nitrate anion. Indeed, this anion possesses various degrees of freedom that are not present in simpler anions, such as halides, and one should expect the coupling of vibrational modes between the metal complex and the nitrate. That is indeed what is observed, as seen in Figure S13 where the experimental spectrum measured at 100 K is compared to spectra calculated from the structure optimization of the [Zn(en)3]2+ and [Zn(en)3](NO3)2 fragments. The calculated spectrum for [Zn(en)3]2+ only shows poor agreement with the experimental one over all the spectral range, while the addition of two nitrate anions markedly improve this agreement in the fingerprint range, as can be seen in various regions of the spectrum. Not surprisingly, two of the latter are where markers are situated.
While the poor agreement prevents a more in-depth discussion of vibration modes, simple visual inspection of the modes present in those regions allows for an immediate separation in two categories: modes where there is appreciable linear combination of vibrational modes of the complex and the nitrates, and modes limited to the complex. For example, about 840-850 cm−1 there are six Raman active modes calculated. The lowest one mostly corresponds with the ν2 vibration mode described for D3h NO3 [27], corresponding to the out-of-plane motion of the nitrogen atom. The highest one is mostly a mode of the metal complex based on the in-phase combination of C-C and C−N stretching motions of the ethylenediamine ligands. Those two modes are in fact combined together, while the other four modes only have contributions from the complex. One can note that the relevance of the N-H···O interaction is reflected in the optimized geometry of the nitrate anions, in which the nitrogen atom is seen to be located 2.6 pm out of the O3 mean plane, away from the cationic complex. This value compares very well with the 2.7(3) pm that was observed in the RAVJAZ crystal structure. The same pattern occurs in the 1270−1360 cm−1 region, where the interaction here is with the ν3 vibration mode of the nitrate. Markers of the transition appear to be located close to those modes that result from the interaction between complex and nitrate vibrational modes. A contrario, no marker is seen in the 1100−1150 cm−1 region, and modes seen there appear to be exclusively centered on the metal complex ligands. At higher energies, the N-H stretching modes obviously reflect the difficulty of properly modelling the interaction between complex and nitrate anions: while the calculation on [Zn(en)3]2+ yields energies for those modes that are too high, the calculations on [Zn(en)3](NO3)2 yield energies that are too low, reflecting ion pairing that is too strong respective to the crystal: this is directly reflected in the NO3⋅⋅⋅⋅Zn distance that is lower in the calculated structure (3.844 Å) than in the crystal structure (4.076 Å at room temperature to 3.998 Å in the low-temperature phase). This demonstrates the relevance of the hydrogen bonding with the lateral nitrate anions, as represented in Figure S1, which is readily also seen in the crystal structure, where C-H and N-H bonds are inequivalent and significantly longer when entering in hydrogen bonds with the nitrates. The effect of these lateral hydrogen bonds is to mix the vibration modes between complex and anions all over the spectrum, even in those regions where our simple model did not show such mixing. Some preliminary geometry optimization trials adding the six lateral NO3 anions to the [Zn(en)3](NO3)2 unit, with either free coordinates or symmetry constraints imposed through a Z-matrix definition, did not converge at all. This illustrates the feedback between hydrogen bonding and crystal packing, and a true simulation of the solid state would be necessary through the use of Periodic Boundary Conditions. Such computing-intensive calculations are out of the scope of this account.

4. Conclusions

We have reported the synthesis and characterization of two new members of the M(II)tris(ethylenediamine) nitrate family. Although the cobalt and manganese derivatives have been previously studied in terms of their chiroptical effects [28], this is the first report of their complete crystallographic characterization. The manganese compound undergoes a crystallographic phase transition to an enantiomorphic space group, like the nickel and zinc analogues, while the cobalt compound does not demonstrate any significant change down to 2 K. Their magnetic properties are consistent with high spin M(II) octahedral compounds. Studies on their chiroptical and magneto-chiroptical properties are underway and will be reported in due course.

Supplementary Materials

The following are available online at https://www.mdpi.com/2073-4352/10/6/472/s1, Figure S1. Cation-anion close contacts shown in Λ-[Co(en)3](NO3)2 at 298 K. Figure S2. Powder X-ray diffractograms for [Co(en)3](NO3)2 at 12 and 300 K; Powder diffractograms simulated from Δ-[Mn(en)3](NO3)2 single crystal data at 120 and 300 K. Figure S3. Heat capacity trace for [Co(en)3](NO3)2. Figure S4. Magnetic behavior of [Mn(en)3](NO3)2. Figure S5. Magnetic behavior of [Ni(en)3](NO3)2. Figure S6. Magnetic behavior of [Co(en)3](NO3)2. Figure S7. X-band (9.54 GHz) EPR of [Co(en)3](NO3)2 at 5 K. Protocol for Bragg peak examination and Figure S8. Variation of selected Bragg peaks with temperature. Figure S9. Variable temperature Raman spectra measured on a single crystal of [Co(en)3](NO3)2 between 200 and 100 K. Figure S10. Variable temperature Raman spectra measured on a single crystal of [Mn(en)3](NO3)2 between 298 and 140 K. Figure S11. Variable temperature Raman spectra measured on a single crystal of [Zn(en)3](NO3)2 between 200 and 100 K. Figure S12. Comparison of Raman spectra calculated for [Zn(en)3]2+ from the optimized structures in D3 and C2 symmetries. Figure S13. Comparison of Raman spectra measured at 100 K and calculated for [Zn(en)3]2+ and [Zn(en)3](NO3)2.

Author Contributions

Formal analysis, P.R. and E.A.H.; Funding acquisition, R.C. and E.A.H.; Investigation, M.C., Á.V.-P., M.R., R.C. and P.R.; Methodology, P.R. and E.A.H.; Project administration, E.A.H.; Supervision, R.C., P.R. and E.A.H.; Writing—original draft, P.R. and E.A.H.; Writing—review & editing, M.C., R.C., P.R. and E.A.H. All authors, except Á.V.-P. (deceased), have read and agreed to the published version of the manuscript.

Funding

This research was funded by the CNRS, the University of Bordeaux (PhD fellowship for A.V.P.), the Conseil Régional de Nouvelle Aquitaine, the European Union’s Horizon 2020 research and innovation program under the Marie Sklodowska-Curie grant agreement No 706556 CHIMMM (Postdoctoral fellowship for MC) and the GDR MCM2.

Acknowledgments

We thank S. Exiga and A. Fargue for technical assistance.

Conflicts of Interest

The authors declare no conflict of interest.

References

  1. Werner, A. Zur Kenntnis des asymmetrischen Kobaltatoms X. Eur. J. Inorg. Chem. 1914, 47, 1961–1979. [Google Scholar] [CrossRef] [Green Version]
  2. Jacques, J.; Collet, A.; Wilen, S.H. Enantiomers, Racemates and Resolution; John Wiley and Sons, Inc.: New York, NY, USA, 1981. [Google Scholar]
  3. Groom, C.; Bruno, I.J.; Lightfoot, M.; Ward, S.C. The Cambridge Structural Database. Acta Crystallogr. Sect. B Struct. Sci. Cryst. Eng. Mater. 2016, 72, 171–179. [Google Scholar] [CrossRef]
  4. Bernal, I.; Kauffman, G.B. The spontaneous resolution of cis-bis(ethylenediamine)dinitrocobalt(III) salts: Alfred Werner’s overlooked opportunity. J. Chem. Educ. 1987, 64, 604. [Google Scholar] [CrossRef]
  5. Swink, L.N.; Atoji, M. The Crystal Structure of Triethylenediaminenickel(II) Nitrate, Ni(NH2CH2CH2NH2)3(NO3)2. Acta. Cryst. 1960, 13, 639–643. [Google Scholar] [CrossRef]
  6. Neill, D.; Riley, M.J.; Kennard, C.H.L. Tris(ethylenediamine-N,N’)zinc(II) Dinitrate. Acta Crystallogr. Sect. C Cryst. Struct. Commun. 1997, 53, 701–703. [Google Scholar] [CrossRef] [Green Version]
  7. Farrugia, L.J.; Macchi, P.; Sironi, A. Reversible displacive phase transition in [Ni(en)3]2+(NO3)2: A potential temperature calibrant for area-detector diffractometers. J. Appl. Cryst. 2003, 36, 141–145. [Google Scholar] [CrossRef]
  8. Bernhardt, P.V.; Riley, M.J. Structural Definition of the Low-Temperature Phase Transition of Tris(ethane-1,2-diamine)zinc(II) Dinitrate. Aust. J. Chem. 2003, 56, 287. [Google Scholar] [CrossRef]
  9. Cameron, C.A.; Allan, D.R.; Kamenev, K.V.; Moggach, S.A.; Murrie, M.; Parsons, S. A pressure-induced displacive phase transition in Tris(ethylenediamine) Nickel(II) nitrate. Z. Krist. Cryst. Mater. 2014, 229, 200–209. [Google Scholar] [CrossRef] [Green Version]
  10. Train, C.; Nuida, T.; Gheorghe, R.; Gruselle, M.; Ohkoshi, S.-I. Large Magnetization-Induced Second Harmonic Generation in an Enantiopure Chiral Magnet. J. Am. Chem. Soc. 2009, 131, 16838–16843. [Google Scholar] [CrossRef]
  11. Ohkoshi, S.-I.; Takano, S.; Imoto, K.; Yoshikiyo, M.; Namai, A.; Tokoro, H. 90-degree optical switching of output second-harmonic light in chiral photomagnet. Nat. Photonics 2013, 8, 65–71. [Google Scholar] [CrossRef]
  12. Reisinger, S.A.; De Sousa, A.S.; Fernandes, M.A.; Perry, C.B.; Varadwaj, P.R.; Marques, H.M. Crystallographic and computational investigation of nitrate salts of nickel(II) ethylenediamine complexes. Inorg. Chem. Commun. 2010, 13, 584–588. [Google Scholar] [CrossRef]
  13. Bennett, A.M.; Foulds, G.A.; Thornton, D.A. The i.r. spectra of ethylenediamine complexes—I. The tris(ethylenediamine) complexes of first transition series metal(II) sulphates. Spectrochim. Acta Part A Mol. Spectrosc. 1989, 45, 219–223. [Google Scholar] [CrossRef]
  14. ASTM E1840-96(2014) Standard Guide for Raman Shift Standards for Spectrometer Calibration ASTM International; ASTM: West Conshohocken, PA, USA, 2014.
  15. Bruker-AXS APEX2, SADABS, and SAINT; Software Reference Manuals: Madison, WI, USA, 2009.
  16. Sheldrick, G.M. SHELXS-97 and SHELXL-97, Program for Crystal Structure Solution and Refinement; University of Gottingen: Gottingen, Germany, 1997. [Google Scholar]
  17. Sheldrick, G.M. SHELXT-integrated space-group and crystal-structure determination. Acta Crystallogr. Sect. A Found. Adv. 2015, 71, 3–8. [Google Scholar] [CrossRef] [Green Version]
  18. Dolomanov, O.; Bourhis, L.J.; Gildea, R.; Howard, J.A.; Puschmann, H. OLEX2: A complete structure solution, refinement and analysis program. J. Appl. Crystallogr. 2009, 42, 339–341. [Google Scholar] [CrossRef]
  19. Otwinowski, Z.; Minor, W. Methods in Enzymology, Volume 276: Macromolecular Crystallography, Part A; Carter, C.W., Sweet, R.M., Jr., Eds.; Academic Press: Cambridge, MA, USA, 1997; pp. 307–326. [Google Scholar]
  20. SHAPE. Program for the Stereochemical Analysis of Molecular Fragments by Means of Continuous Shape Measures and Associated Tools, User’s Manual, Version 2.1; SHAPE: Barcelona, Spain, 2013. [Google Scholar]
  21. Chilton, N.F.; Anderson, R.P.; Turner, L.D.; Soncini, A.; Murray, K.S. PHI: A powerful new program for the analysis of anisotropic monomeric and exchange-coupled polynuclear d- and f-block complexes. J. Comput. Chem. 2013, 34, 1164–1175. [Google Scholar] [CrossRef]
  22. Lloret, F.; Julve, M.; Cano, J.; Ruiz-García, R.; Pardo, E. Magnetic properties of six-coordinated high-spin cobalt(II) complexes: Theoretical background and its application. Inorg. Chim. Acta 2008, 361, 3432–3445. [Google Scholar] [CrossRef]
  23. Walsh, J.P.S.; Bowling, G.; Ariciu, A.-M.; Jailani, N.F.M.; Chilton, N.F.; Waddell, P.; Collison, D.; Tuna, F.; Higham, L.J. Evidence of Slow Magnetic Relaxation in Co(AcO)2(py)2(H2O)2. Magnetochemistry 2016, 2, 23. [Google Scholar] [CrossRef] [Green Version]
  24. Gransbury, G.K.; Boulon, M.-E.; Mole, R.A.; Gable, R.W.; Moubaraki, B.; Murray, K.S.; Sorace, L.; Soncini, A.; Boskovic, C. Single-ion anisotropy and exchange coupling in cobalt(ii)-radical complexes: Insights from magnetic and ab initio studies. Chem. Sci. 2019, 10, 8855–8871. [Google Scholar] [CrossRef] [Green Version]
  25. Sakiyama, H.; Ito, R.; Kumagai, H.; Inoue, K.; Sakamoto, M.; Nishida, Y.; Yamasaki, M. Dinuclear Cobalt(II) Complexes of an Acyclic Phenol-Based Dinucleating Ligand with Four Methoxyethyl Chelating Arms − First Magnetic Analyses in an Axially Distorted Octahedral Field. Eur. J. Inorg. Chem. 2001, 2027–2032, 2705. [Google Scholar] [CrossRef]
  26. Krishnan, K.; Plane, R.A. Raman and Infrared Spectra of Complexes of Ethylenediamine with Zinc(II), Cadmium(II), and Mercury(II). Inorg. Chem. 1966, 5, 852–857. [Google Scholar] [CrossRef]
  27. Brooker, M.H. Ionic Interactions in Crystals: Infrared and Raman Spectra of Powdered Ca(NO3)2, Sr(NO3)2, Ba(NO3)2, and Pb(NO3)2. J. Chem. Phys. 1970, 53, 1083–1087. [Google Scholar] [CrossRef]
  28. Palmer, R.A.; Yang, M.C.-L. Single crystal circular and linear dichroism spectra and absolute configuration of M(en)3(NO3)2 (M = Zn(II), Cu(II), Ni(II), Co(II), Mn(II) and Ru(II). Chem. Phys. Lett. 1975, 31, 492–497. [Google Scholar] [CrossRef]
Figure 1. Anisotropic displacement ellipsoid diagram (Mercury, 50% probability) of Δ-[Co(en)3](NO3)2 at 298 K as viewed down the (a) a crystal axis and (b) c crystal axis. Unit cell and symmetry axes are shown, with blue = six-fold screw, yellow = three-fold and green = two-fold axes. Two different columns are indicated by red and blue molecules. Hydrogen atoms have been omitted for clarity.
Crystals 10 00472 g001
Figure 2. Representation with anisotropic displacement ellipsoids at 50% probability of Λ-[Mn(en)3](NO3)2 at 120 K as viewed down the (a) a crystal axis and (b) c crystal axis. Unit cell and symmetry axes are shown, with blue = six-fold screw, yellow = three-fold, and green = two-fold. Hydrogen atoms have been omitted for clarity.
Crystals 10 00472 g002
Figure 3. Temperature dependence of μeff (squares) and the corresponding fit (solid line) at 0.1 T of [Mn(en)3](NO3)2 (blue), [Co(en)3](NO3)2 (red), and [Ni(en)3](NO3)2 (black).
Crystals 10 00472 g003
Figure 4. (top) Cell axes and volume as a function of temperature measured by X-ray diffraction between 158 and 140 K on a single crystal of [Mn(en)3](NO3)2; (bottom) Diffraction images of [Λ-Mn(en)3](NO3)2 at 160 and 140 K (see supplementary information).
Crystals 10 00472 g004
Figure 5. Differential scanning calorimetry trace for a powder sample of [Mn(en)3](NO3)2, scan rate 5 K/minute. Top curve: cooling cycle; bottom curve: heating cycle.
Crystals 10 00472 g005
Figure 6. Raman spectra for (top) [Mn(en)3](NO3)2 at 298 (red), 200 (orange), 155 (green), and 140 K (light blue) in the (a) 700-720, 820-1000 cm−1 and (b) 1250–1510 cm−1 ranges and (bottom) [Zn(en)3](NO3)2 at 200 (orange), 155 (green), 135 (violet), and 100 K (blue) in the (c) 700–720, 820–1000 cm−1 and (d) 1250–1500 cm−1 ranges. The bands indicated with a red star are resonances supposed to be mainly due to NO3 in comparison to literature spectra.
Crystals 10 00472 g006
Table 1. Crystal data and structure refinement for [M(en)3](NO3)2 at 298 K.
Para-
Meters
Δ-Mn Λ-MnΔ-Co Λ-Co
FormulaC6H24MnN8O6C6H24MnN8O6C6H24CoN8O6C6H24CoN8O6
Formula weight 359.25359.25363.26363.26
Crystal system hexagonal
Space group P6322 (no. 182)
a, b9.057(3) Å9.0572(7) Å8.9285(8) Å8.9158(8) Å
c11.301(3) Å11.3115(10) Å11.3126(11) Å11.2970(10) Å
α, β90°
γ120°
Volume802.8(4) Å3803.60(11) Å3781.00(16) Å3777.70(16) Å3
Z2
ρcalc1.4861 g/cm31.4846 g/cm31.545 g/cm31.551 g/cm3
μ (Mo Kα)0.861 mm-10.860 mm−11.138 mm−11.143 mm−1
Reflections collected 21940
(5.2° ≤ 2θ ≤ 56.6°)
9221
(5.2° ≤ 2θ ≤ 52.8°)
6378
(5.3° ≤ 2θ ≤ 52.7°)
20782
(6.4° ≤ 2θ ≤ 52.9°)
Unique 675 [Rint = 0.0356]560 [Rint = 0.0301]545 [Rint = 0.0216]542 [Rint = 0.0213]
Final R indexes [all data] R1 = 0.0279
wR2 = 0.0742
R1 = 0.0343
wR2 = 0.0894
R1 = 0.0232
wR2 = 0.0766
R1 = 0.0176
wR2 = 0.0462
Flack para.0.07(5)0.04(7)−0.007(8)0.02(5)
a R1 = Σ||Fo| – |Fc||/ Σ|Fo|; wR2 = [Σ[w(Fo2Fc2)2]/ Σ[w(Fo2)2]]1/2, w = 1/σ2(Fo2) + (aP)2 + bP, where P = [max(0 or Fo2) + 2(Fc2)]/3.
Table 2. Selected bond distances (Å) and angles (°) for [Mn(en)3](NO3)2 and [Co(en)3](NO3)2 at 298 K.
AtomsΔ-MnΛ-MnΔ-CoΛ-Co
M1-N12.2832(17)2.280(2)2.180(3)2.1773(12)
C1-N11.476(3)1.473(4)1.474(4)1.472(2)
N2-O11.234(2)1.228(3)1.232(3)1.2322(14)
N1-M1-N1chelate78.23(7)78.05(11)80.61(15)80.68(7)
N1-M1-N193.08(8)93.22(11)91.56(16)91.44(7)
N1-M1-N1 94.75(5)94.79(7)94.14(10)94.16(5)
Table 3. Data and structure refinement for [M(en)3](NO3)2 at 120 K.
Para-
meters
Δ-Mn Λ-MnΔ-Co Λ-Co
Formula C6H24MnN8O6C6H24MnN8O6C6H24CoN8O6C6H24CoN8O6
Formula weight 359.25359.25363.24363.26
Crystal system hexagonal
Space group P6522 (no. 179)P6122 (no. 178)P6322 (no. 182)P6322 (no. 182)
a, b8.9999(3) Å8.9970(3) Å8.901(2) Å8.8970(4) Å
c33.0883(14) Å33.0623(11) Å11.065(3) Å11.0675(4) Å
α, β90°
γ120°
Volume2321.03(15) Å32317.71(13) Å3759.2(3) Å3758.70(7) Å3
Z6 6 2 2
ρcalc1.542 g/cm31.5442 g/cm31.5889 g/cm31.590 g/cm3
μ (Mo Kα)0.893 mm−10.894 mm−11.171 mm−11.172 mm−1
Reflections collected 19332
(5.2° ≤ 2θ ≤ 56.6°)
33347
(5.2° ≤ 2θ ≤ 50.7°)
5187
(5.3° ≤ 2θ ≤ 50.6°)
2055
(5.3° ≤ 2θ ≤ 52.7°)
Unique1920 [Rint = 0.0300]1419 [Rint = 0.0350] 475 [Rint = 0.0285] 522 [Rint = 0.0199]
Final R indexes
[all data]
R1 = 0.0255
wR2 = 0.0656
R1 = 0.0203
wR2 = 0.0474
R1 = 0.0163
wR2 = 0.0444
R1 = 0.0186
wR2 = 0.0488
Flack para.0.04(3)0.01(3)0.01(5)0.006(8)
a R1 = Σ||Fo| – |Fc||/ Σ|Fo|; wR2 = [Σ[w(Fo2Fc2)2]/ Σ[w(Fo2)2]]1/2, w = 1/σ2(Fo2) + (aP)2 + bP, where P = [max(0 or Fo2) + 2(Fc2)]/3.
Table 4. Selected bond distances (Å) for [Mn(en)3](NO3)2 and [Co(en)3](NO3)2 at 120 K.
AtomsΔ-MnΛ-Mn2Δ-CoΛ-Co
M1-N12.2787(14)2.2803(18)2.1820(15)2.1802(14)
M1-N22.2802(15)2.2828(19)--
M1-N32.2825(14)2.2837(18)--
C1-N11.475(2)1.473(3)1.480(2)1.479(2)
C2-N21.477(2)1.481(3)--
C3-N31.476(2)1.478(3)--
N4-O11.257(2)1.260(2)1.2535(14)1.2508(15)
N4-O21.248(2)1.249(2)--
N4-O31.251(2)1.251(2)--

