Atomic Force Microscopy Study of Discrete Dislocation Pile-ups at Grain Boundaries in Bi-Crystalline Micro-Pillars


Abstract
1. Introduction
2. Experiments
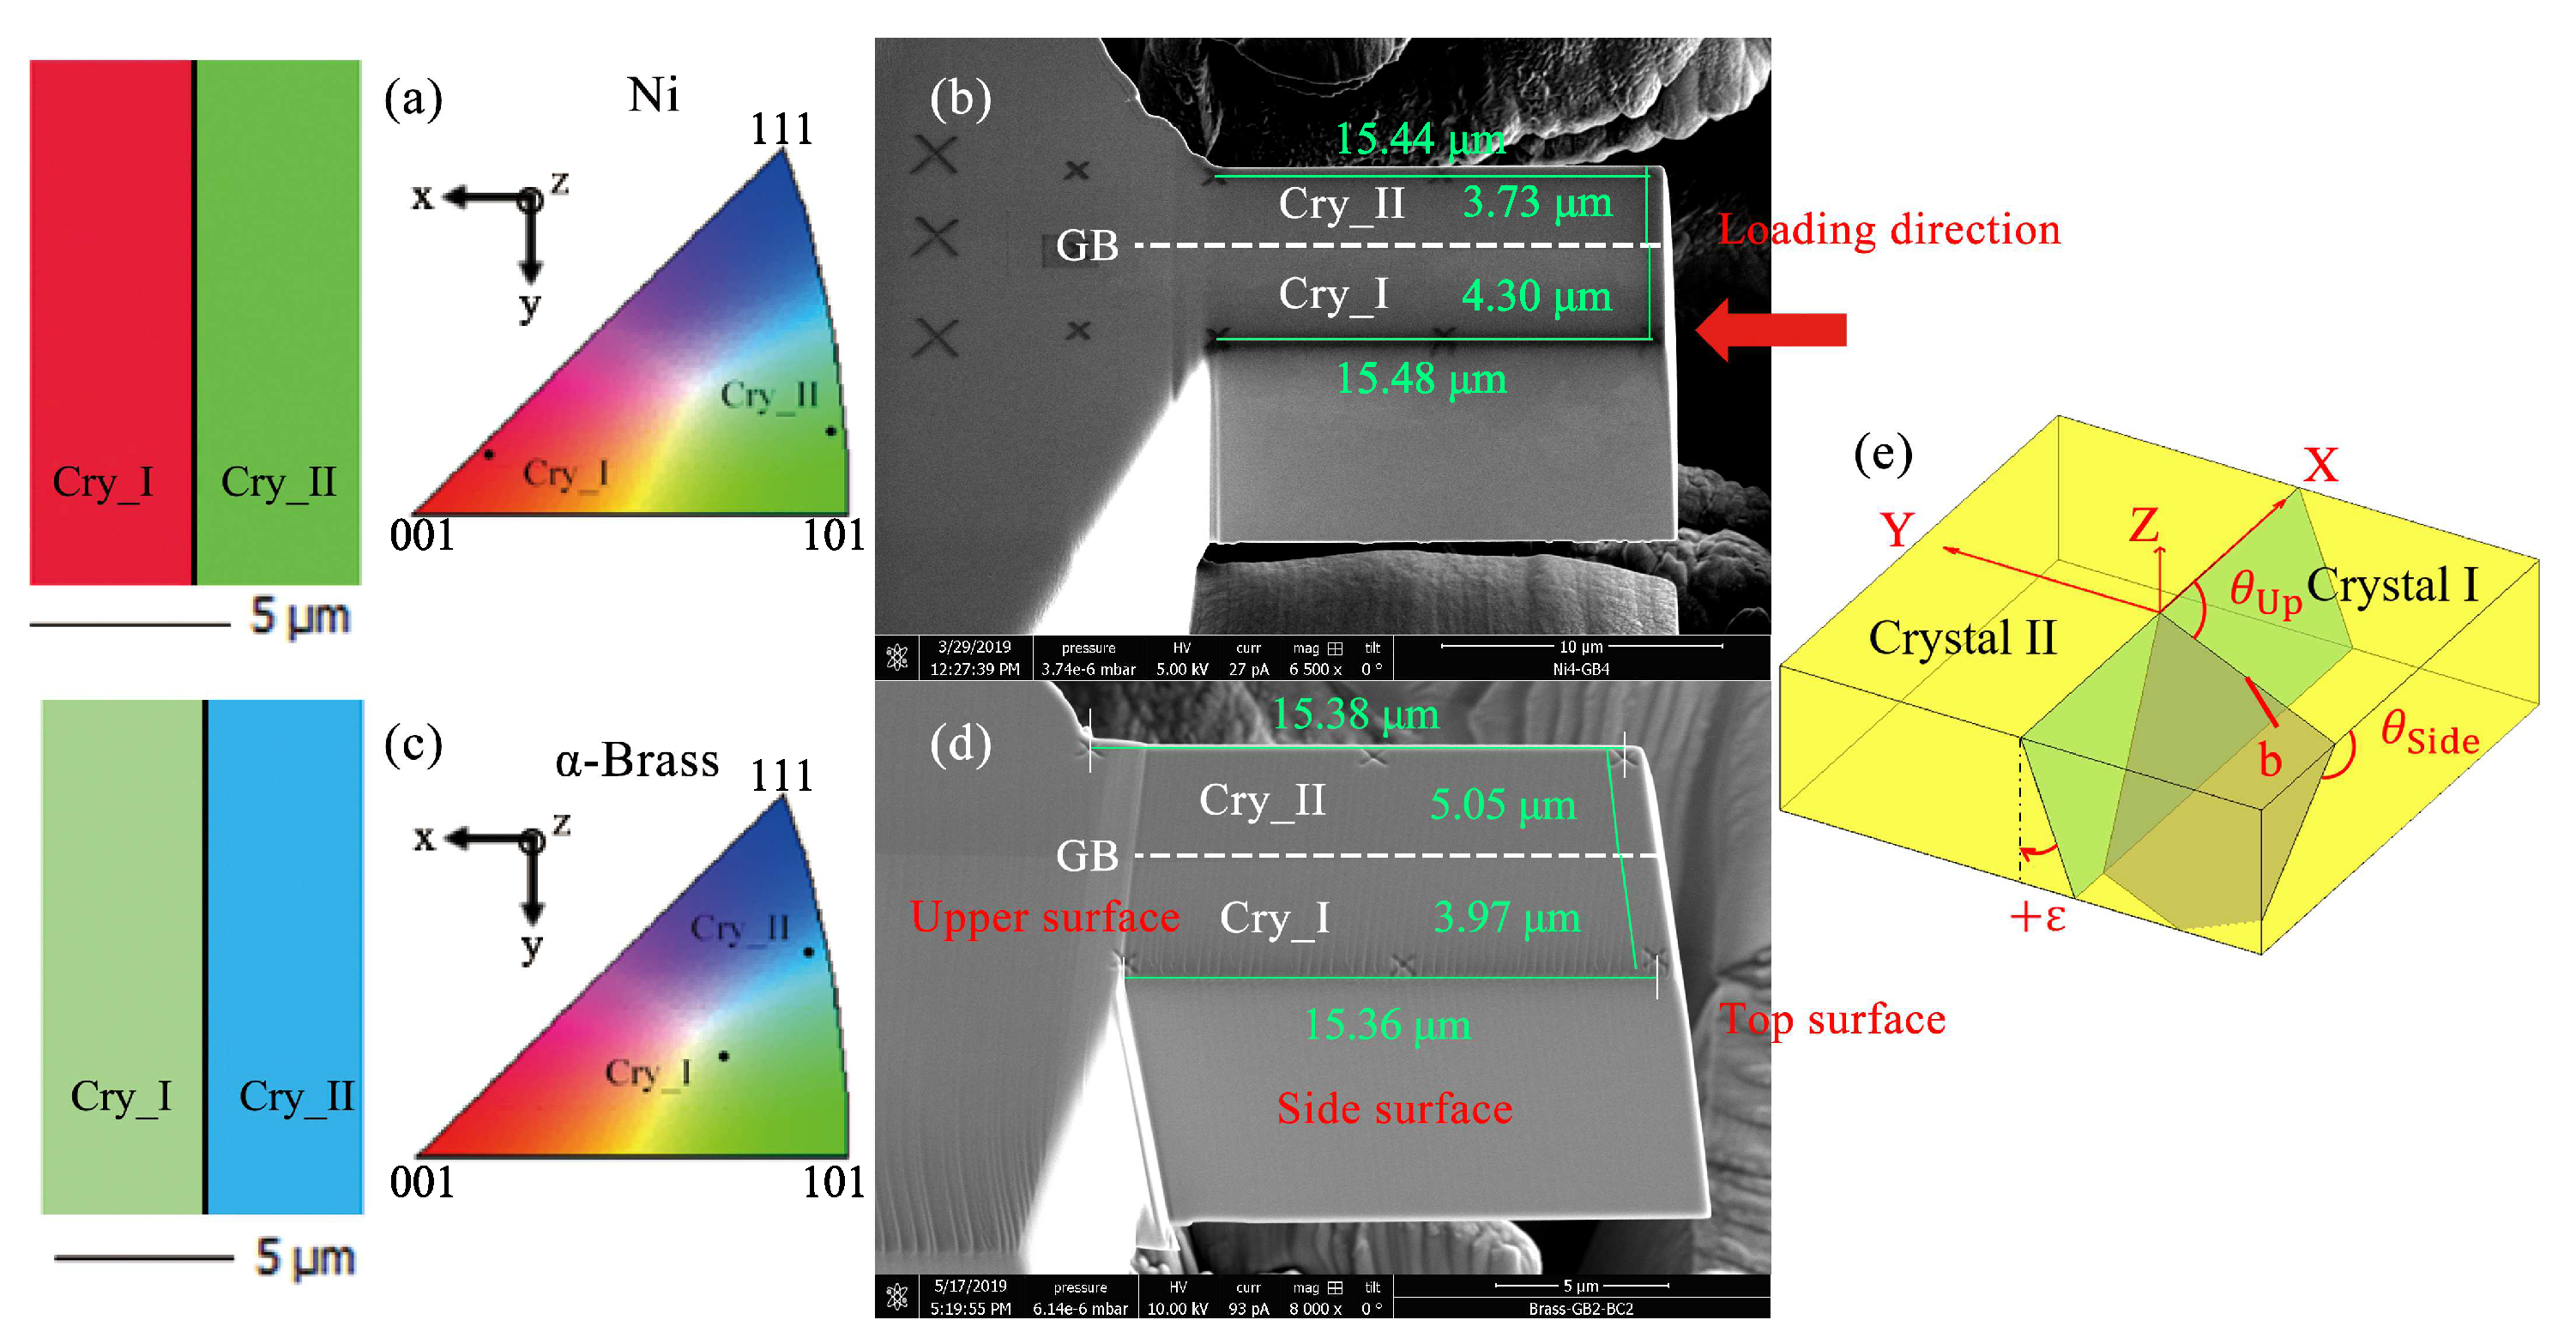
2.1. Materials
2.2. Sample Preparation and Characterization
2.3. Micro-Pillar Production
2.4. Micro-Compression Test in SEM
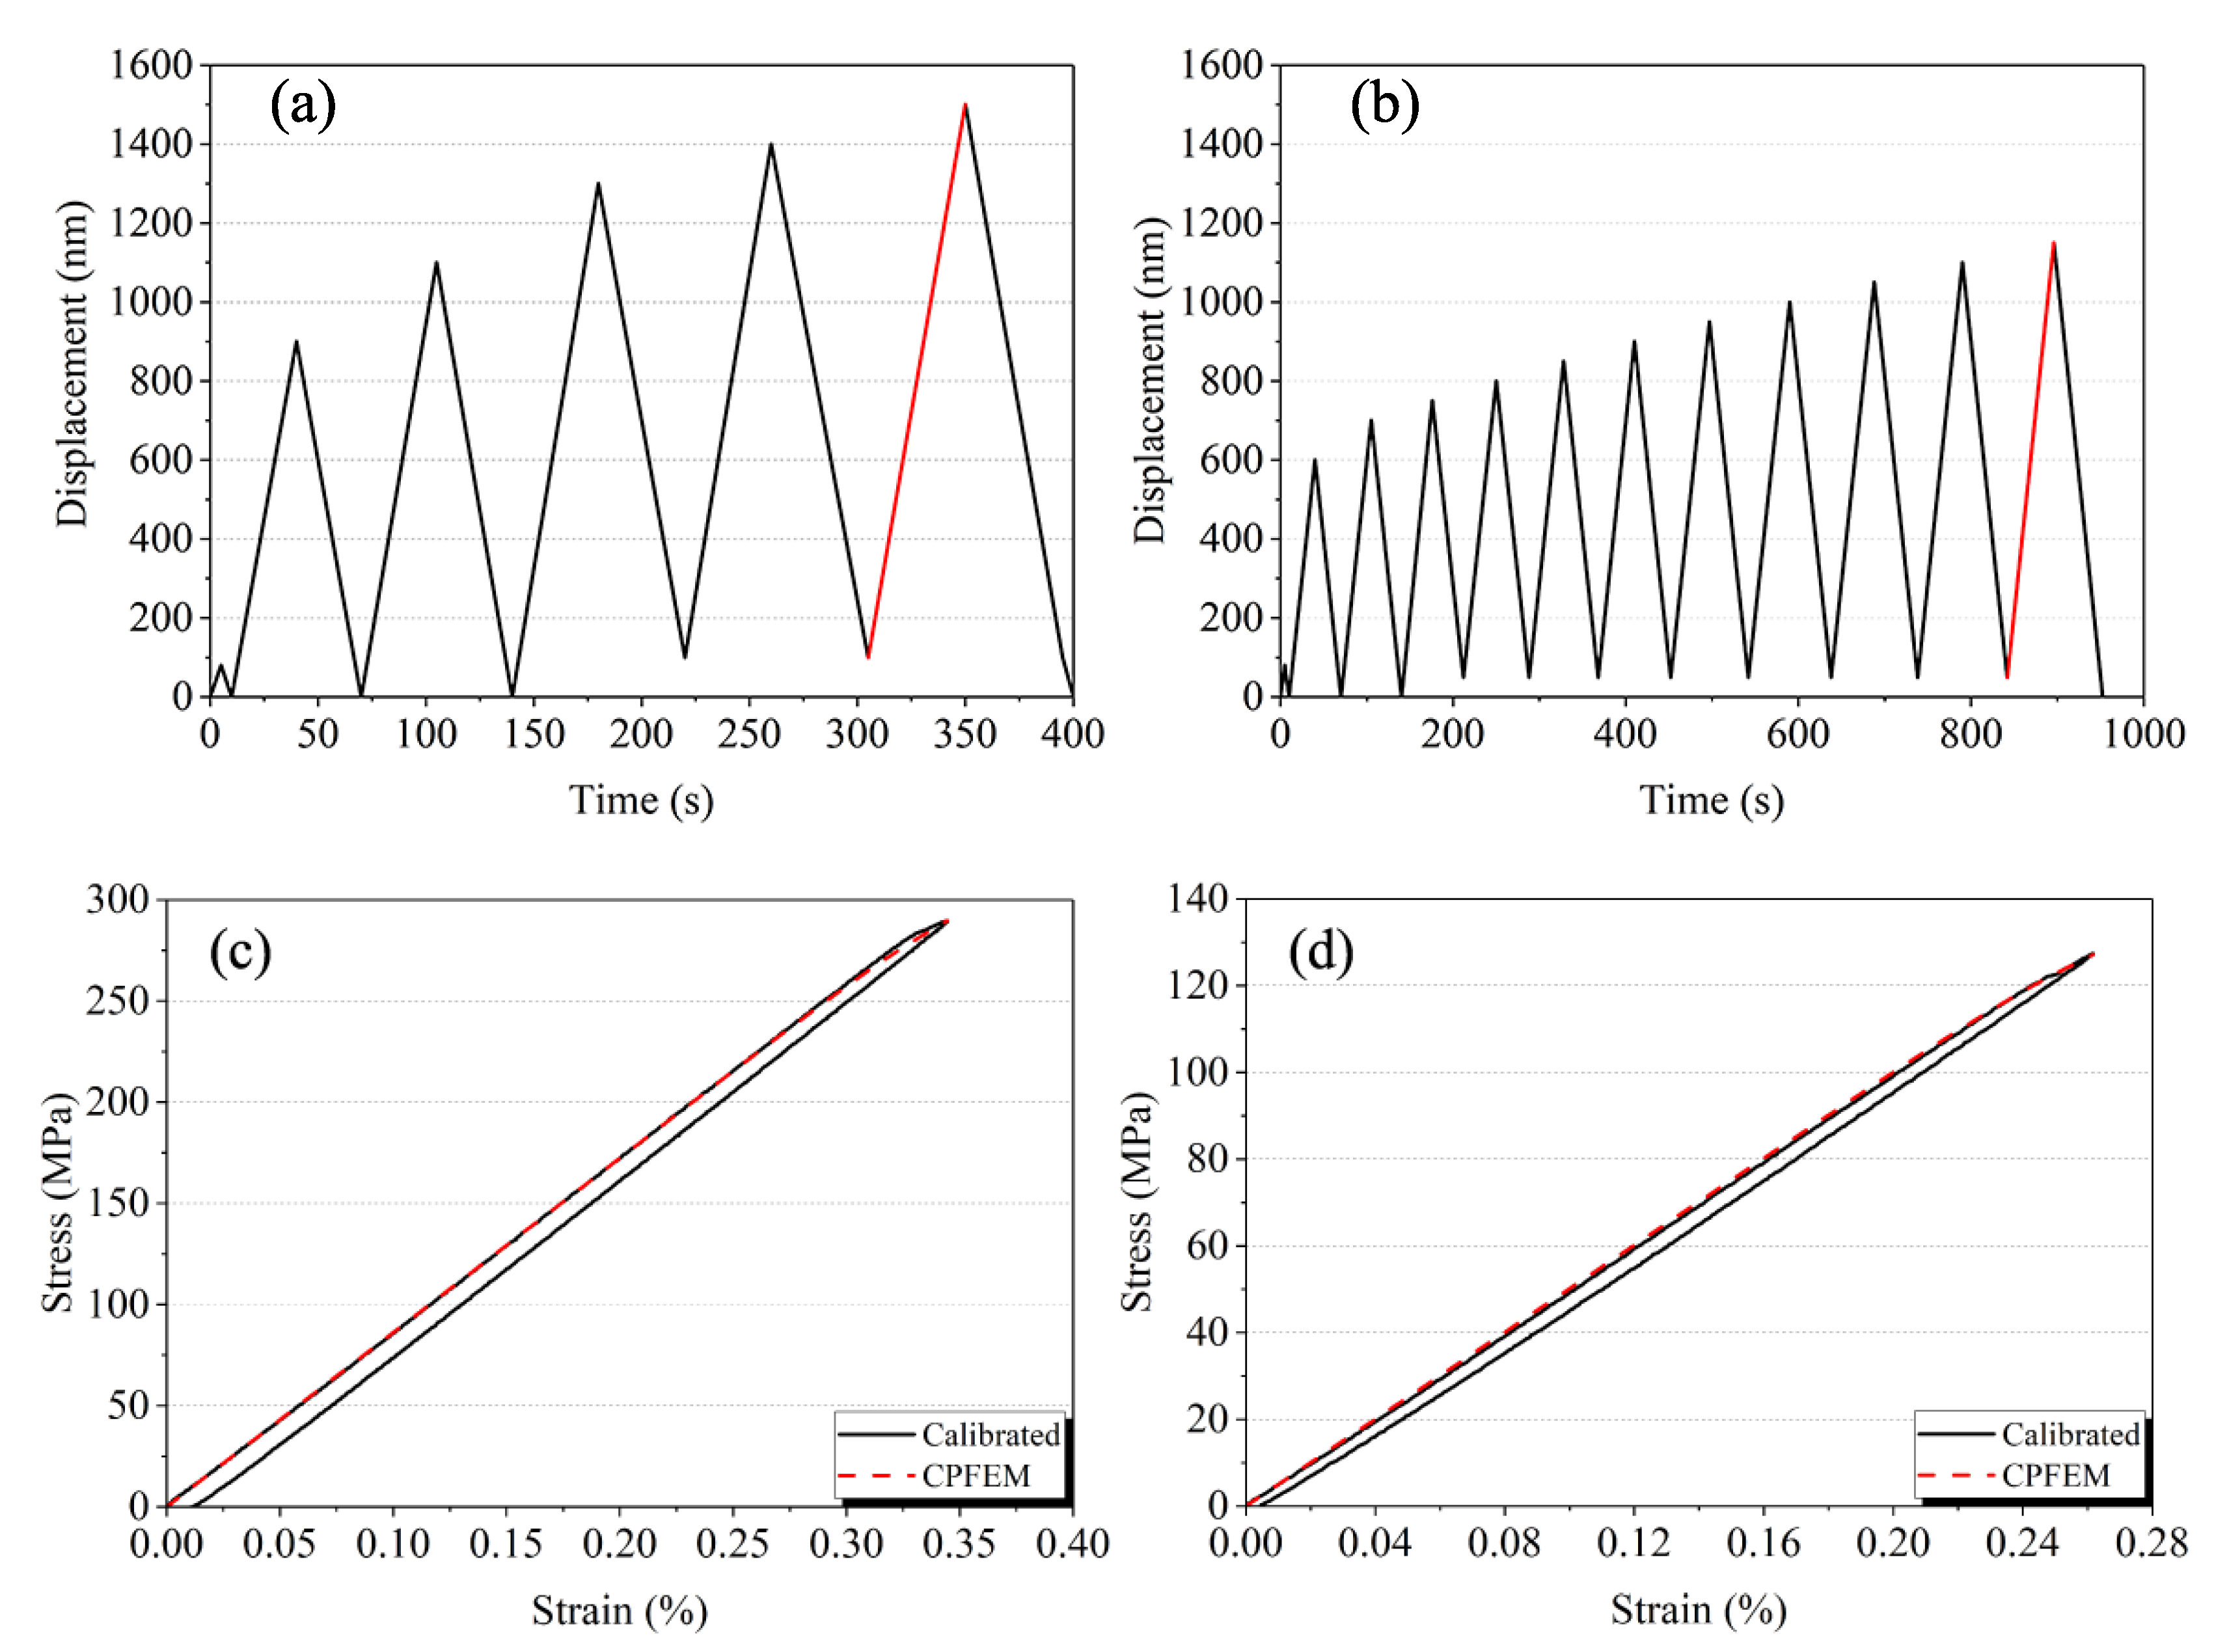
2.5. Stress-Strain Responses and Overall Stresses at Plastic Yielding
3. Experimental Results
3.1. Preliminary Slip Analysis Using Schmid Factors and Incompatibility Stresses
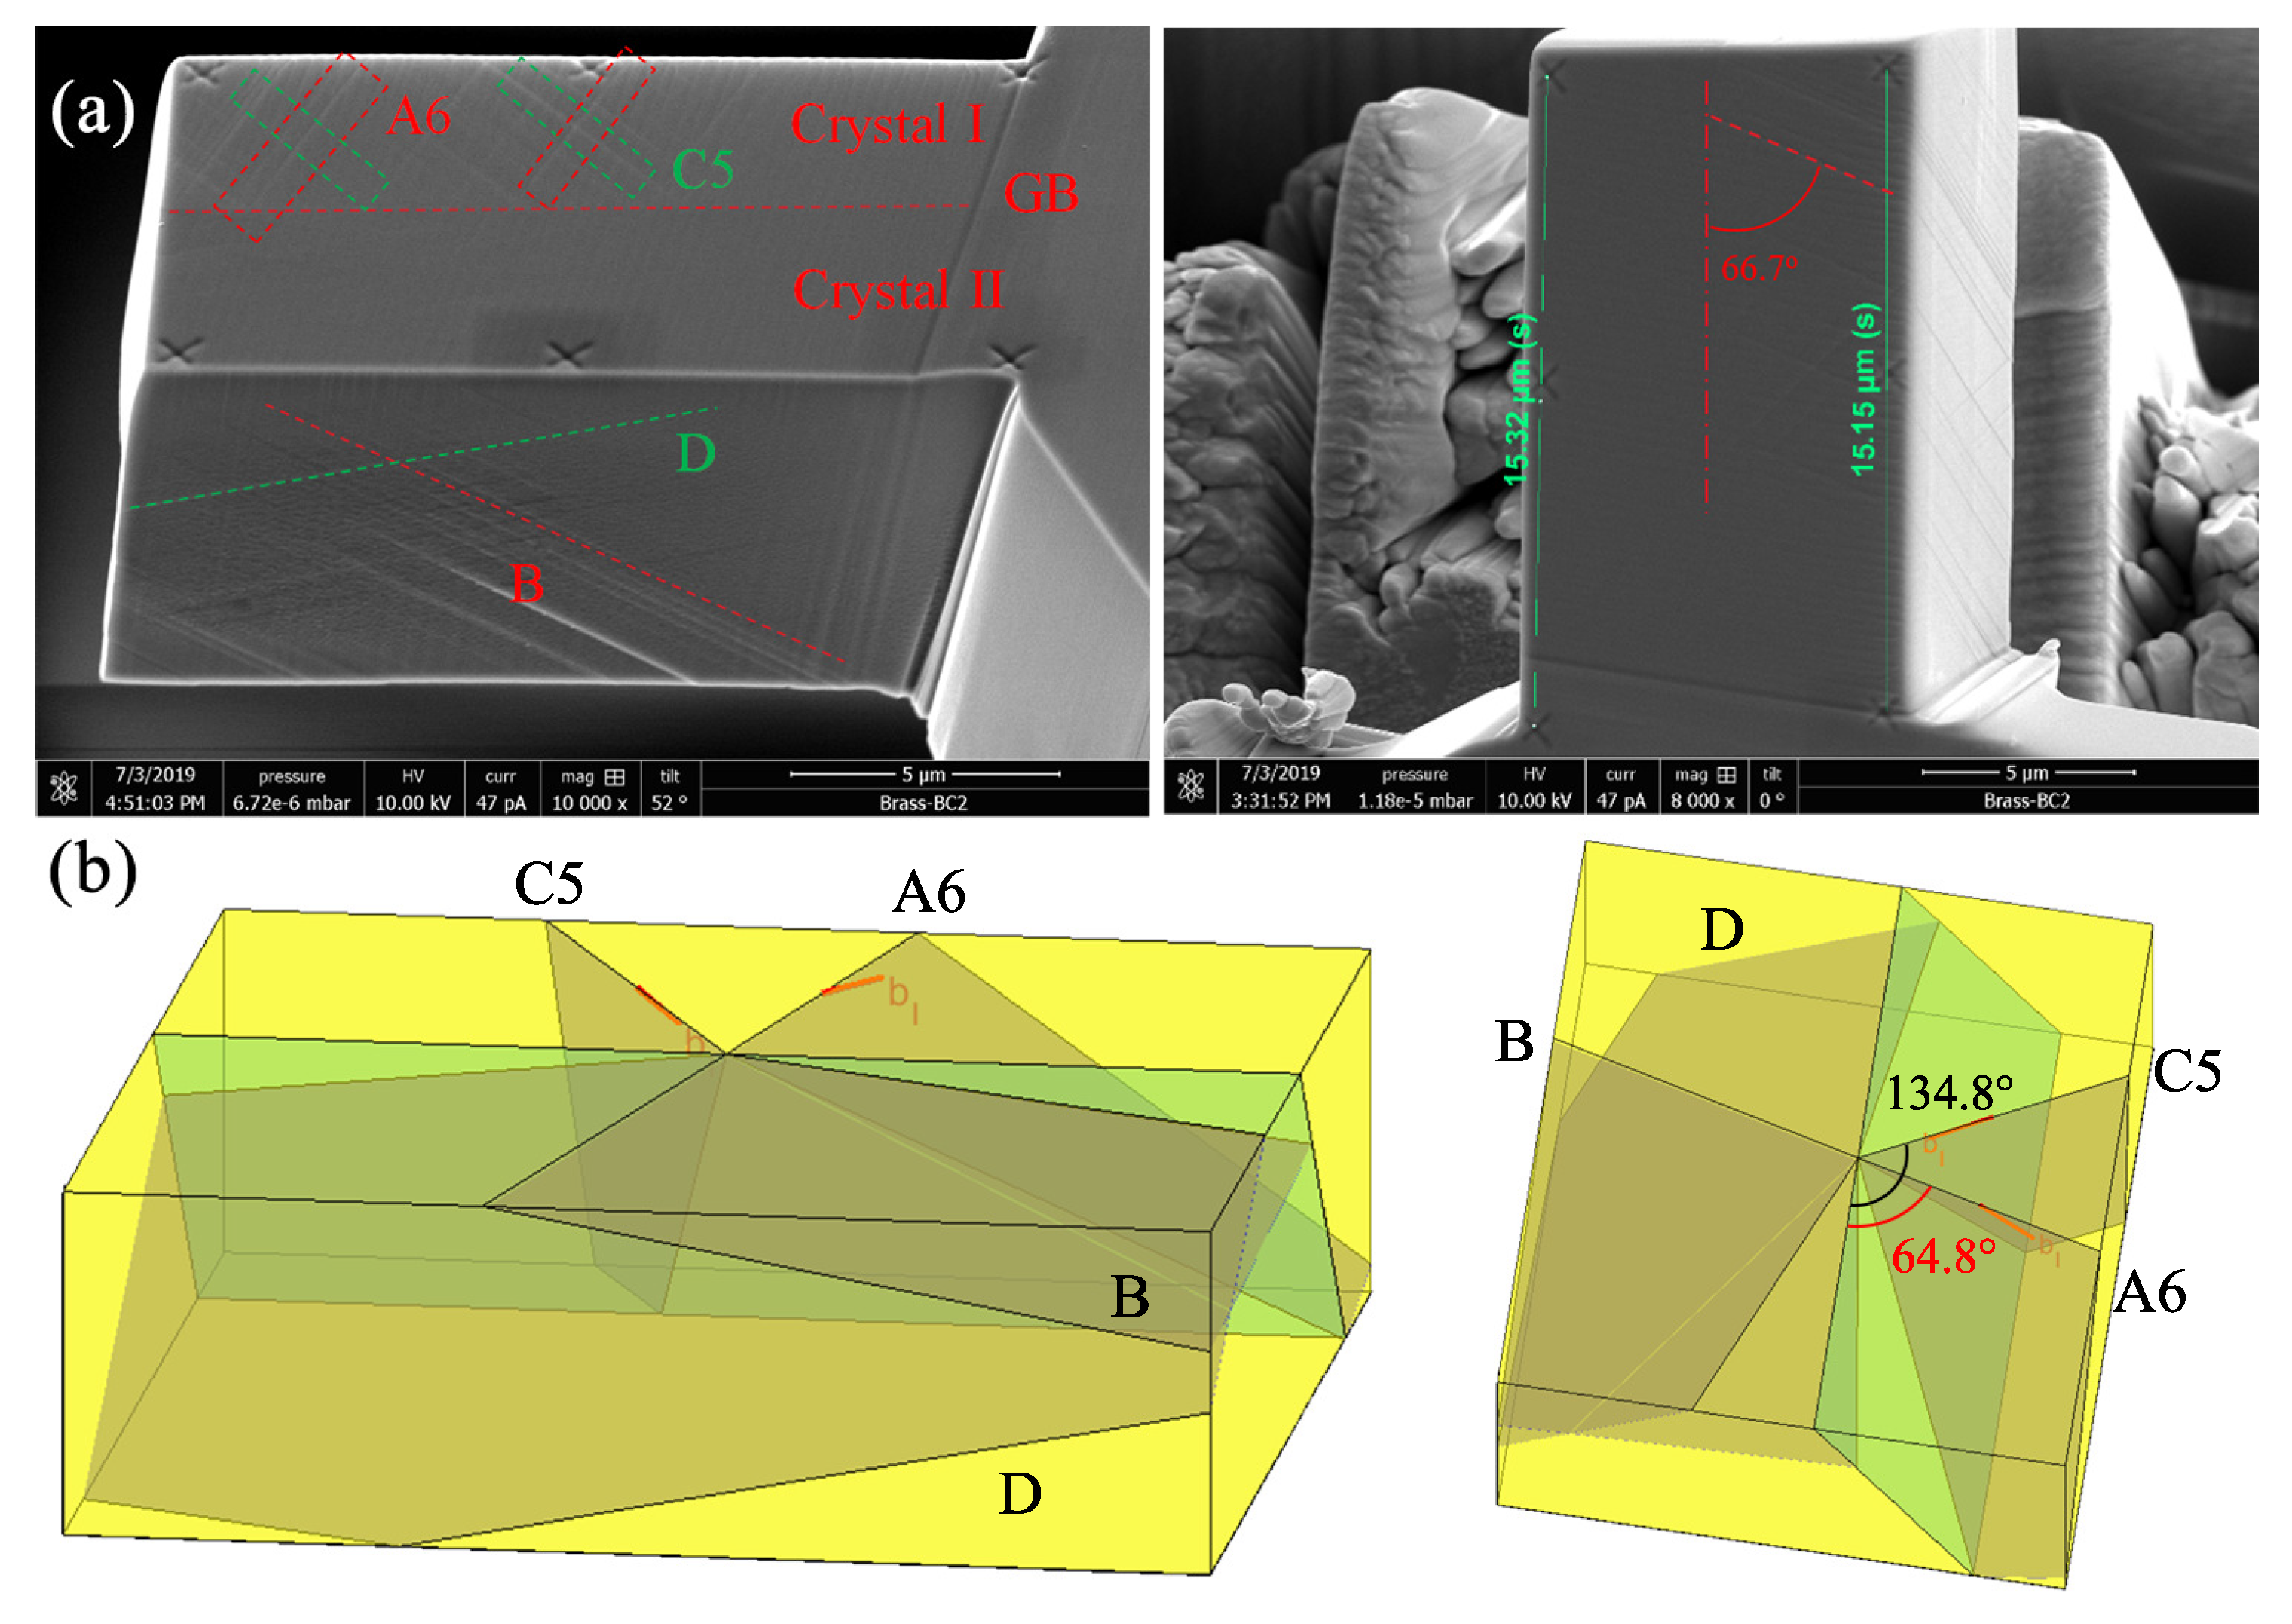
3.2. Slip Analysis by SEM
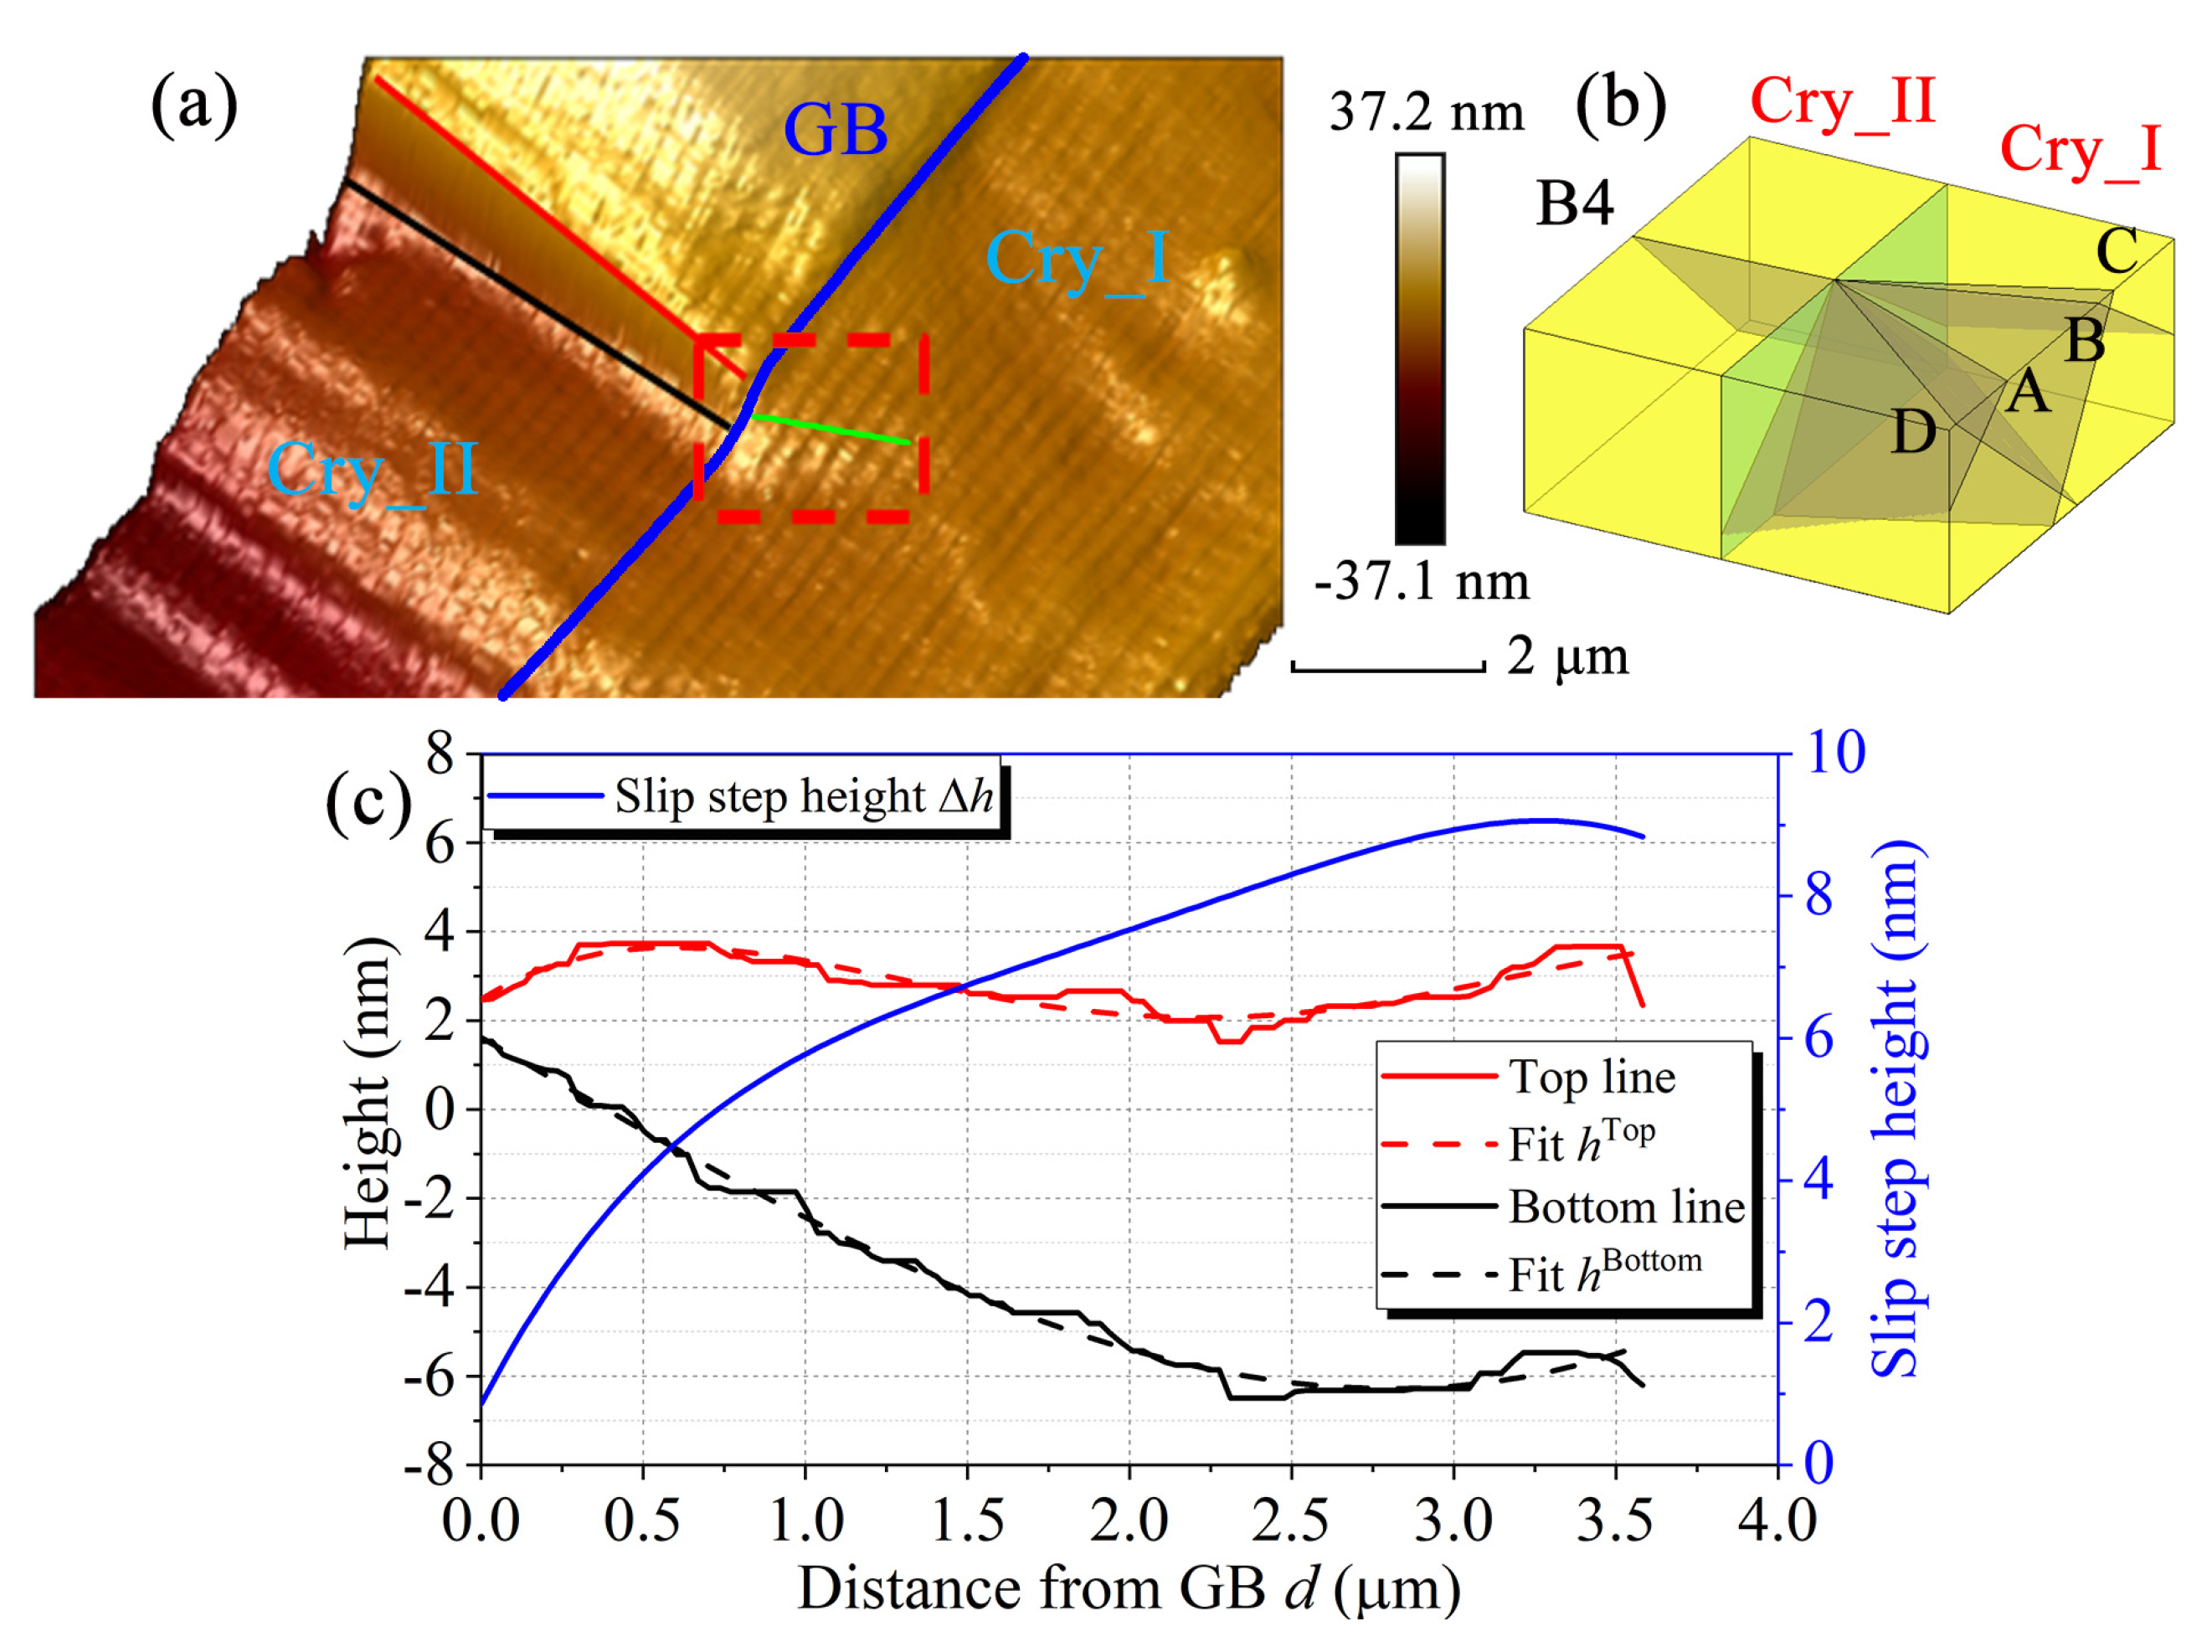
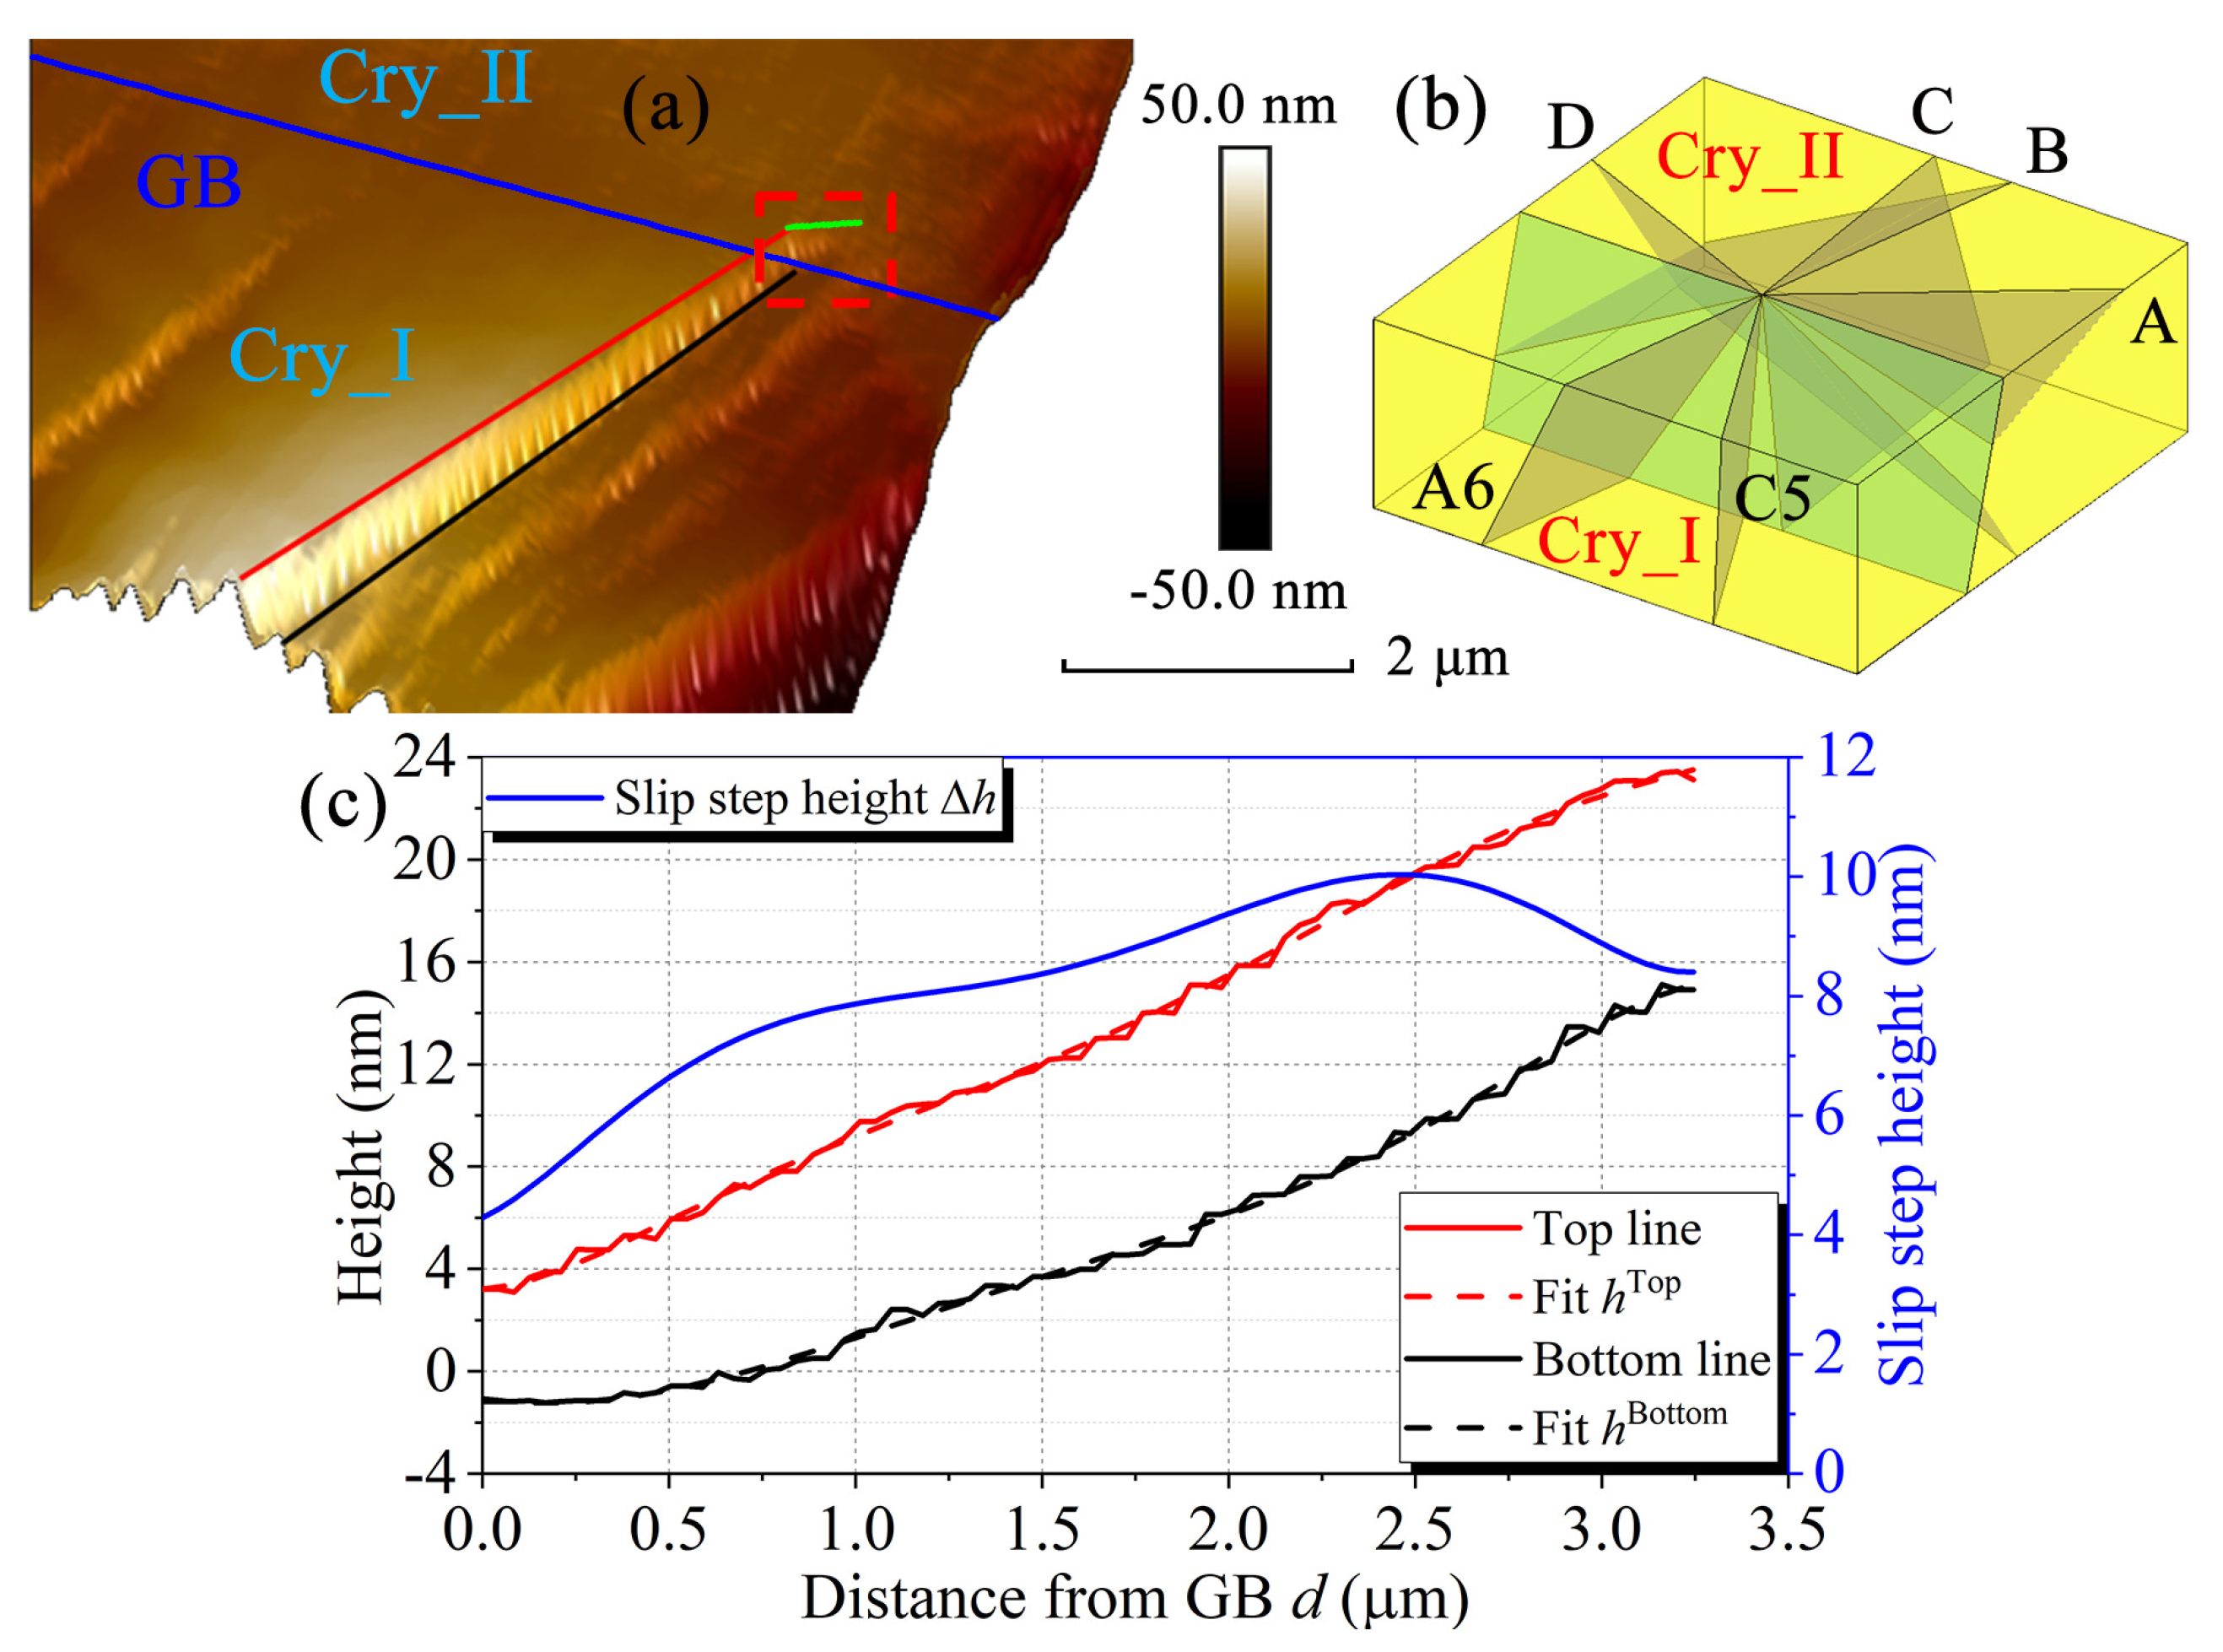
3.3. Slip Analysis by Ex-Situ AFM
4. Discrete Dislocation Pile-Up Simulations and Discussion
4.1. Discrete Dislocation Pile-Up Configuration in Heterogeneous and Anisotropic Elasticity
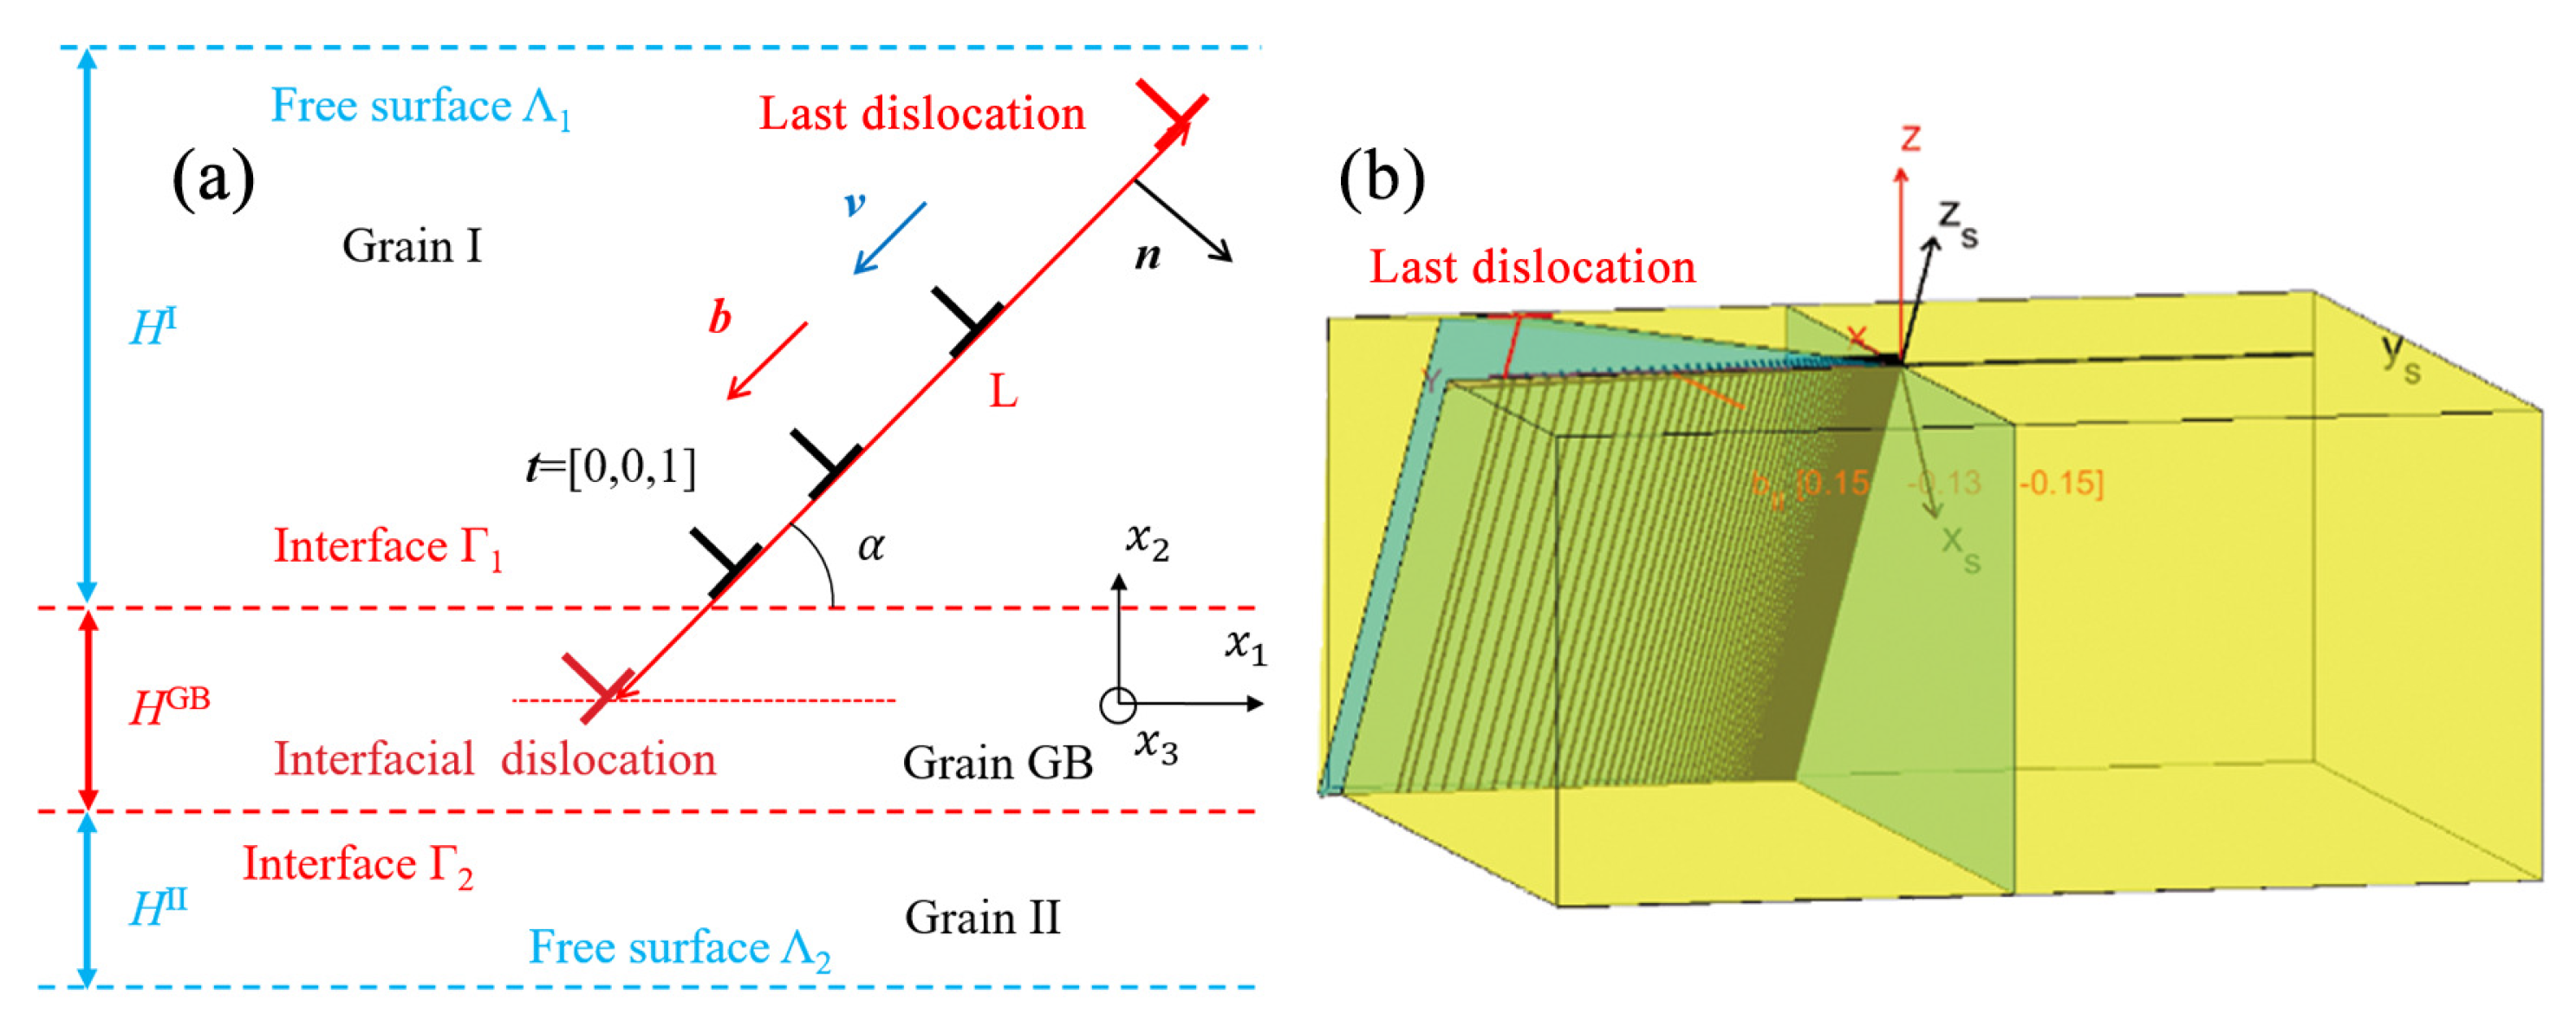
4.2. Simulation Configuration of Experiments
- 1.
- The dislocation lines are supposed to be infinite straight lines. They are parallel to each other and also parallel to the GB plane.
- 2.
- For the simulation coordinates system, the direction is set to be the direction of dislocation line , and the direction is set to be the direction of GB normal as presented in Figure 7b. Then, is determined by the vector product which is presented as in Figure 7b. Furthermore, all the used vectors and tensors, such as the Burgers vector of active slip system, the slip direction vector, and the elastic stiffness tensor, etc. are transformed into the simulation coordinates system.
- 3.
- The position of the maximum slip step height measured in the experiment is considered to be the end of the discrete dislocation pile-up. However, in the model, the last dislocation is fixed at the position of the observed maximum slip step height. Hence, the length of the dislocation pile-up as shown in Figure 7 is the same in all the simulations. The P–K force on this last dislocation is not zero. It is assumed that this dislocation is locked on some material defect not considered in the simulation. Furthermore, it is supposed that there is no more dislocation between the maximum slip step height and the side free surface as if the dislocations in this area have escaped through the side free surface.
- 4.
- All the presented simulations are performed by the image decomposition method for anisotropic multilayers problem which only considers linear anisotropic elasticity [42,44]. In the present study, a three layers configuration is used. GB is always regarded as an elastic interphase with a thickness nm (the second layer in the model, marked as Grain GB in Figure 7a). This value has been obtained from Molecular Statics (MS) simulations on the Ni sample. The stiffness tensor of this interphase is here simply modeled as a first approximation by , which is the average of the two grains’ elastic stiffness tensors.
- 5.
- As the theory is two-dimensional (invariance along the dislocation line), dislocations with different line directions cannot be considered at the same time. Thus, the transmitted and/or absorbed dislocations are modeled as an interfacial super-dislocation fixed in the middle of the GB interphase. Therefore, , where is the Burgers vector of the super-dislocation, the number of transmitted and/or absorbed dislocations, and is the Burgers vector of dislocations stored at GB. can be equal to the Burgers vector of the incoming dislocations, or equal to the residual Burgers vector between incoming slip system () and one of the 12 outgoing slip systems () in the adjacent grain defined as .
- 6.
- For the present results, the applied stress tensor is always considered as homogeneous in both grains without considering incompatibility stresses [37,38,40,41]. Thus, has only one non-zero component in the global sample coordinate system (see Figure 7b), which is considered as a uniaxial compression test along the GB direction. The value of for each sample is the maximum applied stress in the compression test, which can be obtained from experimental stress–strain curves, thus MPa for the Ni sample and MPa for the -Brass sample (see Figure 2c,d).
- 7.
- If not specifically stated in the text, the default value of the critical force is equal to zero, as N/m. This default value will only correspond to Simulations 1 and 2 in Section 4.3.
- 8.
- The equilibrium positions of the dislocations in the pile-up are determined by Equation (1), then the slip step height at a given position along the slip direction can be calculated by:where d is the distance from GB along slip direction, N the number of dislocations in the dislocation pile-up from GB to the position d, and is the out-of-surface component of the Burgers vector (along Z direction, which is perpendicular to the upper surface as shown in Figure 7b).
- 9.
- In the following parts, the measured slip step height is calibrated to be zero at GB, which means . Similarly, the simulated slip step height profile is considered to be zero at GB as .
4.3. Simulation Results and Discussions
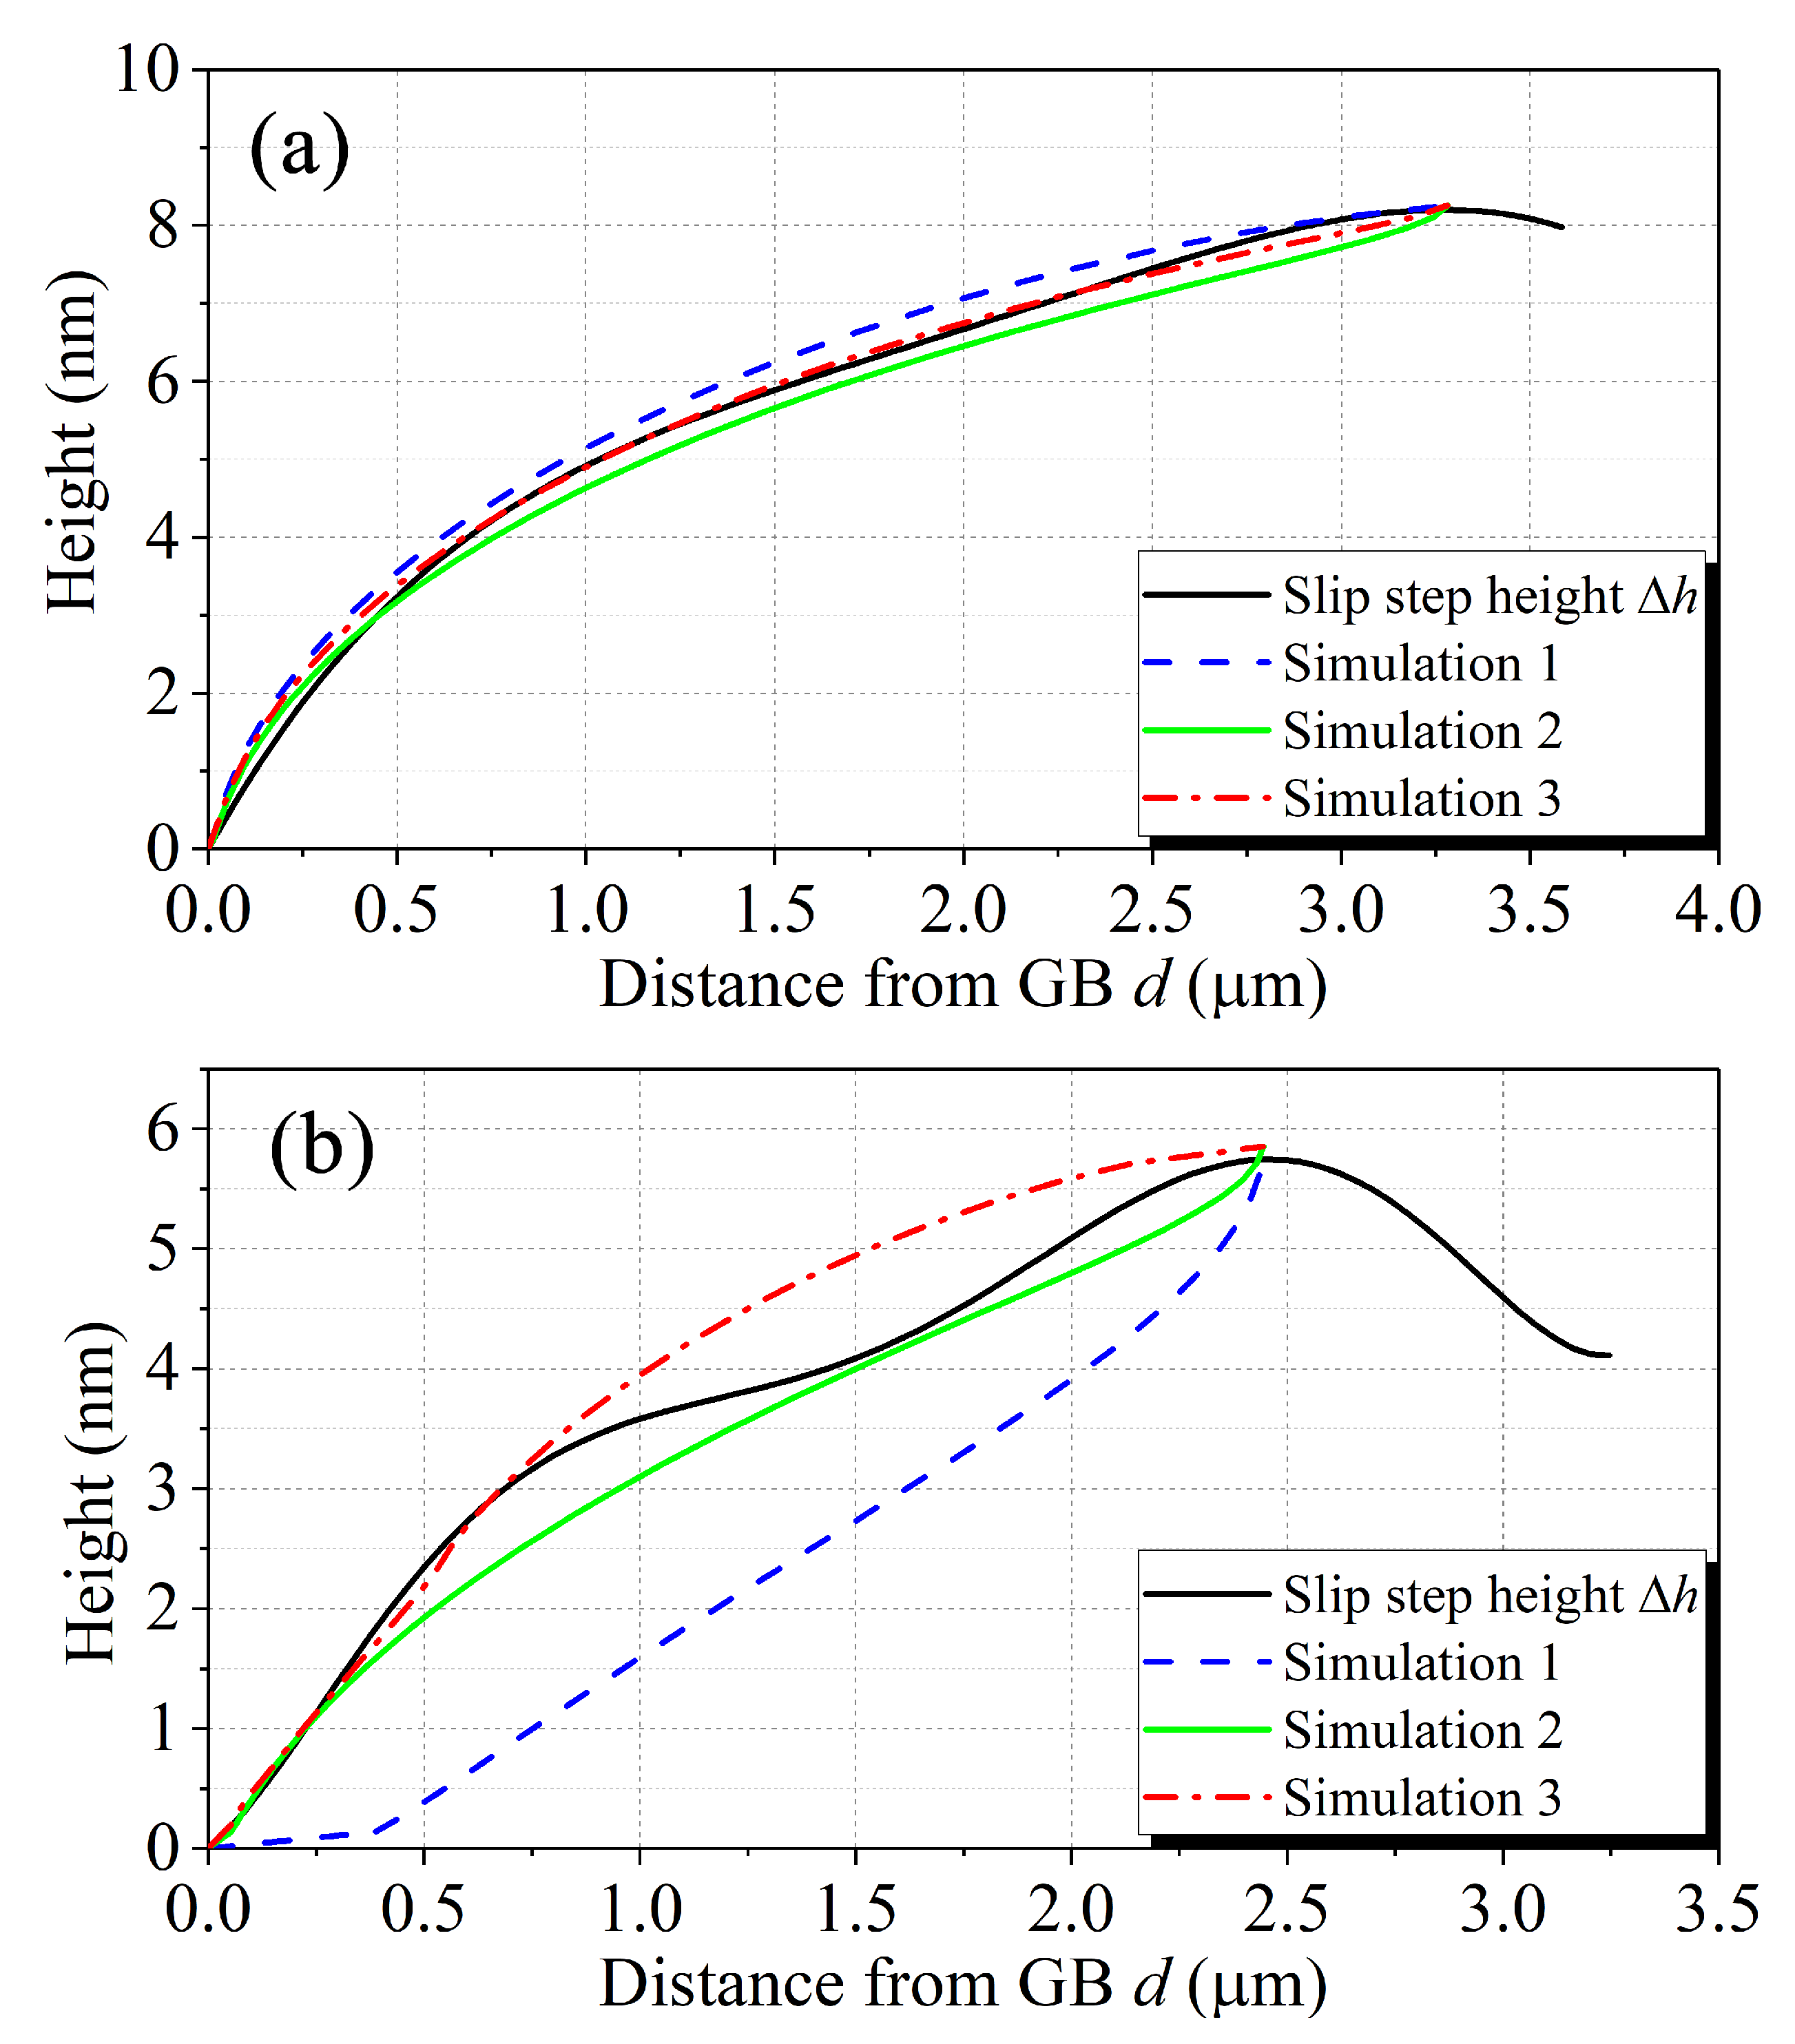
4.3.1. Results for Ni Sample
4.3.2. Results for the -Brass Sample
4.3.3. Discussion
5. Conclusions
Author Contributions
Funding
Acknowledgments
Conflicts of Interest
Abbreviations
| GB(s) | Grain Boundary(ies) |
| FCC | Face-Centered Cubic |
| Ni | Nickel |
| AFM | Atomic Force Microscopy |
| TEM | Transmission Electron Microscope |
| EBSD | Electron Back Scattered Diffraction |
| SEM | Scanning Electron Microscope |
| ECCI | Electron Channelling Contrast Imaging |
| CPFEM | Crystal Plasticity Finite Element Method |
| DDD | Discrete Dislocation Dynamics |
| MD | Molecular Dynamics |
| MS | Molecular Statics |
| RSS | Resolved Shear Stress |
| IS | Incompatibility Stresses |
| CSS | Corresponding Slip System |
| P–K | Peach–Koehler |
| L-E-S | Leknitskii–Eshelby–Stroh |
References
- Hall, E.O. The deformation and ageing of mild steel: III discussion of results. Proc. Phys. Soc. Sect. B 1951, 64, 747–753. [Google Scholar] [CrossRef]
- Petch, N.J. The cleavage strength of polycrystals. J. Iron Steel Inst. 1953, 174, 25–30. [Google Scholar]
- Armstrong, R.W. The influence of polycrystal grain size on several mechanical properties of materials. Metall. Mater. Trans. B 1970, 1, 1169–1174. [Google Scholar] [CrossRef]
- Shen, Z.; Wagoner, R.H.; Clark, W.A.T. Dislocation and grain boundary interactions in metals. Acta Metall. 1988, 36, 3231–3242. [Google Scholar] [CrossRef]
- Kamaya, M.; Wilkinson, A.J.; Titchmarsh, J.M. Measurement of plastic strain of polycrystalline material by electron backscatter diffraction. Nucl. Eng. Des. 2005, 235, 713–725. [Google Scholar] [CrossRef]
- Pantleon, W. Resolving the geometrically necessary dislocation content by conventional electron backscattering diffraction. Scr. Mater. 2008, 58, 994–997. [Google Scholar] [CrossRef]
- Gutierrez-Urrutia, I.; Zaefferer, S.; Raabe, D. Coupling of Electron Channeling with EBSD: Toward the Quantitative Characterization of Deformation Structures in the SEM. JOM 2013, 65, 1229–1236. [Google Scholar] [CrossRef]
- Perrin, C.; Berbenni, S.; Vehoff, H.; Berveiller, M. Role of discrete intra-granular slip on lattice rotations in polycrystalline Ni: Experimental and micromechanical studies. Acta Mater. 2010, 58, 4639–4649. [Google Scholar] [CrossRef]
- Kahloun, C.; Badji, R.; Bacroix, B.; Bouabdallah, M. Contribution to crystallographic slip assessment by means of topographic measurements achieved with Atomic Force Microscopy. Mater. Charact. 2010, 61, 835–844. [Google Scholar] [CrossRef]
- Kahloun, C.; Monnet, G.; Queyreau, S.; Le, L.T.; Franciosi, P. A comparison of collective dislocation motion from single slip quantitative topographic analysis during in-situ AFM room temperature tensile tests on Cu and Feα crystals. Int. J. Plast. 2016, 84, 277–298. [Google Scholar] [CrossRef]
- Dehm, G.; Jaya, B.N.; Raghavan, R.; Kirchlechner, C. Overview on micro-and nanomechanical testing: New insights in interface plasticity and fracture at small length scales. Acta Mater. 2018, 142, 248–282. [Google Scholar] [CrossRef]
- Clark, W.A.T.; Wise, C.E.; Shen, Z.; Wagoner, R.H. The use of the transmission electron-microscope in analyzing slip propagation across interfaces. Ultramicroscopy 1989, 30, 76–89. [Google Scholar] [CrossRef]
- Gleiter, H.; Hornbogen, E.; Ro, G. The mechanism of grain boundary glide. Acta Metall. 1968, 16, 1053–1067. [Google Scholar] [CrossRef]
- Pumphrey, P.H.; Gleiter, H. Annealing of dislocations in high-angle grain boundaries. Philos. Mag. J. Theor. Exp. Appl. Phys. 1974, 30, 593–602. [Google Scholar] [CrossRef]
- Bayerschen, E.; McBride, A.T.; Reddy, B.D.; Böhlke, T. Review on slip transmission criteria in experiments and crystal plasticity models. J. Mater. Sci. 2016, 51, 2243–2258. [Google Scholar] [CrossRef]
- Hunter, A.; Leu, B.; Beyerlein, I.J. A review of slip transfer: applications of mesoscale techniques. J. Mater. Sci. 2018, 53, 5584–5603. [Google Scholar] [CrossRef]
- Livingston, J.D.; Chalmers, B. Difference fatigue cracking behaviors of Cu bicrystals with the same component grains but different twin boundaries. Acta Metall. 1957, 5, 322–327. [Google Scholar] [CrossRef]
- Beyerlein, I.; Mara, N.; Wang, J.; Carpenter, J.; Zheng, S.; Han, W.; Zhang, R.; Kang, K.; Nizolek, T.; Pollock, T. Structure-property-functionality of bimetal interfaces. JOM 2012, 64, 1192–1207. [Google Scholar] [CrossRef]
- Werner, E.; Prantl, W. Slip transfer across grain and phase boundaries. Acta Metall. Mater. 1990, 38, 533–537. [Google Scholar] [CrossRef]
- Head, A.K.X. The Interaction of Dislocations and Boundaries. Lond. Edinb. Dublin Philos. Mag. J. Sci. 1953, 44, 92–94. [Google Scholar] [CrossRef]
- Pacheco, E.S.; Mura, T. Interaction between a screw dislocation and a bimetallic interface. J. Mech. Phys. Solids 1969, 17, 163–170. [Google Scholar] [CrossRef]
- Koehler, J.S. Attempt to Design a Strong Solid. Phys. Rev. B 1970, 2, 547–551. [Google Scholar] [CrossRef]
- Krzanowski, J.E. The effect of composition profile shape on the strength of metallic multilayer structures. Scr. Metall. Mater. 1991, 25, 1465–1470. [Google Scholar] [CrossRef]
- Anderson, P.M.; Xin, X.J. The critical shear stress to transmit a peierls screw dislocation across a non-slipping interface. In Multiscale Deformation and Fracture in Materials and Structures. Solid Mechanics and Its Applications; Chuang, T.J., Rudnicki, J.W., Eds.; Springer Science & Business Media: Berlin, Germany, 2000; Volume 84, pp. 87–105. [Google Scholar]
- Imrich, P.J.; Kirchlechner, C.; Motz, C.; Dehm, G. Differences in deformation behavior of bicrystalline Cu micropillars containing a twin boundary or a large-angle grain boundary. Acta Mater. 2014, 73, 240–250. [Google Scholar] [CrossRef]
- Imrich, P.J.; Kirchlechner, C.; Dehm, G. Influence of inclined twin boundaries on the deformation behavior of Cu micropillars. Mater. Sci. Eng. A 2015, 642, 65–70. [Google Scholar] [CrossRef]
- Knorr, A.F.; Marx, M.; Schaefer, F. Crack initiation at twin boundaries due to slip system mismatch. Scr. Mater. 2015, 94, 48–51. [Google Scholar] [CrossRef]
- Malyar, N.V.; Micha, J.-S.; Dehm, G.; Kirchlechner, C. Dislocation-twin boundary interaction in small scale Cu bi-crystals loaded in different crystallographic directions. Acta Mater. 2017, 129, 91–97. [Google Scholar] [CrossRef]
- Kheradmand, N.; Vehoff, H.; Barnoush, A. An insight into the role of the grain boundary in plastic deformation by means of a bicrystalline pillar compression test and atomistic simulation. Acta Mater. 2013, 61, 7454–7465. [Google Scholar] [CrossRef]
- Anderson, P.M.; Hirth, J.P.; Lothe, J. Theory of Dislocations, 3rd ed.; Cambridge University Press: Cambridge, UK, 2017. [Google Scholar]
- Rayne, J.A. Elastic Constants of α-Brasses: Room-Temperature Variation with Solute Concentration. Phys. Rev. 1958, 112, 1125–1130. [Google Scholar] [CrossRef]
- Rayne, J.A. Elastic Constants of α-Brasses: Variation with Solute Concentration from 4.2–300°K. Phys. Rev. 1959, 115, 63–66. [Google Scholar] [CrossRef]
- Zhao, Y.H.; Liao, X.Z.; Zhu, Y.T.; Horita, Z.; Langdon, T.G. Influence of stacking fault energy on nanostructure formation under high pressure torsion. Mater. Sci. Eng. A 2005, 410–411, 188–193. [Google Scholar] [CrossRef]
- Rémy, L. Maclage et Transformation Martensitique CFC → HC Induite par Déformation Plastique Dans Les Alliages Austénitiques à Basse énergie de Défaut D’empilement des Sytèmes CO-NI-CR-MO et FE-MN-CR-C. Ph.D. Thesis, Université de Paris-Sud, Orsay, France, 1975. [Google Scholar]
- Tiba, I. Effets des Interfaces Cristallines sur les Champs méCaniques en Plasticité Cristalline et conséQuences sur le Glissement Dans des Micro-Pilliers Bi-Cristallins. Ph.D. Thesis, Université de Lorraine et Université de Saarbrücken, Metz, France, 2015. [Google Scholar]
- Itoh, I.; Hikage, T. Dezincification Mechanism of Brass in Vacuum at High Temperature. Trans. Jpn. Inst. Met. 1976, 17, 165–169. [Google Scholar] [CrossRef]
- Richeton, T.; Berbenni, S. Effects of heterogeneous elasticity coupled to plasticity on stresses and lattice rotations in bicrystals: A Field Dislocation Mechanics viewpoint. Eur. J. Mech. A/Solids 2013, 37, 231–247. [Google Scholar] [CrossRef]
- Tiba, I.; Richeton, T.; Motz, C.; Vehoff, H.; Berbenni, S. Incompatibility stresses at grain boundaries in Ni bicrystalline micropillars analyzed by an anisotropic model and slip activity. Acta Mater. 2015, 83, 227–238. [Google Scholar] [CrossRef]
- Schmid, E.; Boas, W. Kristallplastizita¨t mit Besonderer Beru¨cksichtigung der Metalle; Springer: New York, NY, USA, 1935. [Google Scholar]
- Richeton, T.; Tiba, I.; Berbenni, S.; Bouaziz, O. Analytical expressions of incompatibility stresses at Σ3 (111) twin boundaries and consequences on single-slip promotion parallel to twin plane. Philos. Mag. 2015, 95, 12–31. [Google Scholar] [CrossRef]
- Chen, X.; Richeton, T.; Motz, C.; Berbenni, S. Elastic fields due to dislocations in anisotropic bi- and tri-materials: Applications to discrete dislocation pile-ups at grain boundaries. Int. J. Solids Struct. 2019, 164, 141–156. [Google Scholar] [CrossRef]
- Wang, H.Y.; Wu, M.S.; Fan, H. Image decomposition method for the analysis of a mixed dislocation in a general multilayer. Int. J. Solids Struct. 2007, 44, 1563–1581. [Google Scholar] [CrossRef][Green Version]
- Rafael Velayarce, J.; Motz, C. Effect of Sample Size and Crystal Orientation on the Fatigue Behaviour of Single Crystalline Microbeams. Materials 2020, 13, 741. [Google Scholar] [CrossRef]
- Chen, X. Experimental and Theoretical Studies of Incompatibility and Dislocation Pile-up Stresses at Grain Boundaries Accounting for Elastic and Plastic Anisotropies. Ph.D. Thesis, Université de Lorraine et Université de Saarbrücken, Metz, France, 2020. [Google Scholar]
- Suzuki, T.; Takeuchi, S. Correlation of Peierls-Nabarro Stress with Crystal Structure. Rev. Phys. Appl. 1988, 23, 685. [Google Scholar] [CrossRef]
- Kheradmand, N. Grain Boundary-Dislocation Interaction: A local Investigation via Micron-Sized Bicrystals. Ph.D. Thesis, Universität des Saarlandes, Saarbrücken, Germany, 2012. [Google Scholar]
- Wagoner, R.H. Calculating dislocation spacings in pile-ups at grain boundaries. Metall. Trans. A 1981, 12, 2015–2023. [Google Scholar] [CrossRef]


| Slip Systesm | Ni Crystal I | Ni Crystal II | ||||||||
|---|---|---|---|---|---|---|---|---|---|---|
| Schmid Factor | RSS/IS | (°) | (°) | MTF/CSS | Schmid Factor | RSS/IS | (°) | (°) | MTF/CSS | |
| A2 | 0.0910 | 0.0246 | 132.16 | 40.98 | 0.8129/C5 | 0.0536 | 0.1087 | 6.11 | 10.27 | 0.7108/A2 |
| A3 | 0.3500 | 0.2960 | 0.8919/C3 | 0.0373 | 0.0051 | 0.8250/A3 | ||||
| A6 | 0.4410 | 0.3205 | 0.7393/C1 | 0.0909 | 0.1138 | 0.7049/A6 | ||||
| B2 | 0.0929 | 0.1054 | 58.87 | 142.12 | 0.8635/B5 | 0.4263 | 0.5068 | 95.09 | 133.01 | 0.8984/D4 |
| B4 | 0.4461 | 0.3624 | 0.8892/B2 | 0.4377 | 0.5270 | 0.8435/B5 | ||||
| B5 | 0.3532 | 0.2570 | 0.8435/B4 | 0.0113 | 0.0202 | 0.8635/B2 | ||||
| C1 | 0.0051 | 0.0419 | 49.30 | 61.63 | 0.9179/C1 | 0.3468 | 0.4131 | 88.56 | 62.62 | 0.9179/C1 |
| C3 | 0.4355 | 0.3354 | 0.9594/C3 | 0.3606 | 0.4269 | 0.9594/C3 | ||||
| C5 | 0.4304 | 0.2935 | 0.7803/C5 | 0.0138 | 0.0137 | 0.8129/A2 | ||||
| D1 | 0.0032 | 0.0390 | 150.26 | 137.01 | 0.7801/B4 | 0.0259 | 0.0151 | 175.07 | 5.97 | 0.6515/A6 |
| D4 | 0.3394 | 0.2689 | 0.8984/B2 | 0.0398 | 0.0950 | 0.6161/B5 | ||||
| D6 | 0.3394 | 0.2689 | 0.8984/B2 | 0.0658 | 0.0799 | 0.6715/A6 | ||||
| Slip System | -Brass Crystal I | -Brass Crystal II | ||||||||
|---|---|---|---|---|---|---|---|---|---|---|
| Schmid Factor | RSS/IS | (°) | (°) | MTF/CSS | Schmid Factor | RSS/IS | (°) | (°) | MTF/CSS | |
| A2 | 0.2339 | 0.2075 | 115.22 | 109.00 | 0.7850/B5 | 0.1578 | 0.3233 | 20.11 | 15.87 | 0.9326/D6 |
| A3 | 0.2010 | 0.1073 | 0.7433/C1 | 0.0460 | 0.0431 | 0.9214/D1 | ||||
| A6 | 0.4349 | 0.3148 | 0.7750/B2 | 0.2038 | 0.2802 | 0.9351/D4 | ||||
| B2 | 0.0305 | 0.0522 | 16.08 | 7.04 | 0.7253/B5 | 0.3944 | 0.3717 | 64.19 | 145.40 | 0.7750/A6 |
| B4 | 0.1086 | 0.0218 | 0.9287/A6 | 0.3992 | 0.3585 | 0.6673/A3 | ||||
| B5 | 0.0781 | 0.0740 | 0.7785/D4 | 0.0048 | 0.0132 | 0.7850/A2 | ||||
| C1 | 0.3262 | 0.3366 | 45.20 | 91.97 | 0.9197/C3 | 0.1954 | 0.0783 | 94.97 | 77.13 | 0.8949/C3 |
| C3 | 0.1650 | 0.0084 | 0.8949/C1 | 0.2040 | 0.1278 | 0.9197/C1 | ||||
| C5 | 0.4913 | 0.3450 | 0.7182/C5 | 0.0085 | 0.0495 | 0.7833/A2 | ||||
| D1 | 0.1228 | 0.1813 | 159.65 | 22.64 | 0.9214/A3 | 0.0412 | 0.0299 | 167.81 | 39.88 | 0.7006/D1 |
| D4 | 0.2573 | 0.1376 | 0.9417/D6 | 0.1492 | 0.2738 | 0.7785/B5 | ||||
| D6 | 0.1345 | 0.0437 | 0.9326/A2 | 0.1904 | 0.2439 | 0.9417/D4 | ||||
© 2020 by the authors. Licensee MDPI, Basel, Switzerland. This article is an open access article distributed under the terms and conditions of the Creative Commons Attribution (CC BY) license (http://creativecommons.org/licenses/by/4.0/).
Share and Cite
Chen, X.; Richeton, T.; Motz, C.; Berbenni, S. Atomic Force Microscopy Study of Discrete Dislocation Pile-ups at Grain Boundaries in Bi-Crystalline Micro-Pillars. Crystals 2020, 10, 411. https://doi.org/10.3390/cryst10050411
Chen X, Richeton T, Motz C, Berbenni S. Atomic Force Microscopy Study of Discrete Dislocation Pile-ups at Grain Boundaries in Bi-Crystalline Micro-Pillars. Crystals. 2020; 10(5):411. https://doi.org/10.3390/cryst10050411
Chicago/Turabian StyleChen, Xiaolei, Thiebaud Richeton, Christian Motz, and Stéphane Berbenni. 2020. "Atomic Force Microscopy Study of Discrete Dislocation Pile-ups at Grain Boundaries in Bi-Crystalline Micro-Pillars" Crystals 10, no. 5: 411. https://doi.org/10.3390/cryst10050411
APA StyleChen, X., Richeton, T., Motz, C., & Berbenni, S. (2020). Atomic Force Microscopy Study of Discrete Dislocation Pile-ups at Grain Boundaries in Bi-Crystalline Micro-Pillars. Crystals, 10(5), 411. https://doi.org/10.3390/cryst10050411