Article

Analytical Modeling of Residual Stress in Laser Powder Bed Fusion Considering Part’s Boundary Condition

1
Woodruff School of Mechanical Engineering, Georgia Institute of Technology, Atlanta, GA 30332, USA
2
Department of Mechanical Engineering, National Cheng Kung University, Tainan City 701, Taiwan
*
Author to whom correspondence should be addressed.
Crystals 2020, 10(4), 337; https://doi.org/10.3390/cryst10040337
Submission received: 31 March 2020 / Revised: 21 April 2020 / Accepted: 21 April 2020 / Published: 24 April 2020
(This article belongs to the Special Issue Additive Manufacturing (AM) of Metallic Alloys)

Abstract

:
Rapid and accurate prediction of residual stress in metal additive manufacturing processes is of great importance to guarantee the quality of the fabricated part to be used in a mission-critical application in the aerospace, automotive, and medical industries. Experimentations and numerical modeling of residual stress however are valuable but expensive and time-consuming. Thus, a fully coupled thermomechanical analytical model is proposed to predict residual stress of the additively manufactured parts rapidly and accurately. A moving point heat source approach is used to predict the temperature field by considering the effects of scan strategies, heat loss at part’s boundaries, and energy needed for solid-state phase transformation. Due to the high-temperature gradient in this process, the part experiences a high amount of thermal stress which may exceed the yield strength of the material. The thermal stress is obtained using Green’s function of stresses due to the point body load. The Johnson–Cook flow stress model is used to predict the yield surface of the part under repeated heating and cooling. As a result of the cyclic heating and cooling and the fact that the material is yielded, the residual stress build-up is precited using incremental plasticity and kinematic hardening behavior of the metal according to the property of volume invariance in plastic deformation in coupling with the equilibrium and compatibility conditions. Experimental measurement of residual stress was conducted using X-ray diffraction on the fabricated IN718 built via laser powder bed fusion to validate the proposed model.

1. Introduction

Laser powder bed fusion (L-PBF) is a type of metal additive manufacturing (AM) process that produces metallic parts layer by layer via selectively melting the powders. In the past few years, L-PBF is utilized to manufacture a wide variety of parts and assemblies using a vast range of material systems [1]. Laser powder bed fusion process has several superiorities over conventional manufacturing processes including reduction in density, fabrication of more intricate parts than has been previously possible, a reduction in design and manufacturing time due to the single-step manufacturing, fabrication of functionality graded material, and many more [2]. Nevertheless, parts built via L-BPF usually contain a high level of residual stress due to the large temperature gradient and cooling rates [3]. This may cause the part to fail during or after fabrication due to crack initiation and growth as caused by large stress [4,5]. Components produced via L-PBF are used in aerospace, automotive, medical, and marine industries; thus, high-quality components should be fabricated to be used in these critical applications [1,6]. An essential part of this qualification is the ability to accurately and rapidly predict the stress state within the part [7,8].
There is significant work in the literature on understanding of the residual stress formation during metal AM process under different process conditions [9]. This line of research can be categorized into three main parts: experimental measurements, numerical modeling, and analytical modeling.
Residual stress measurements can be classified into destructive and non-destructive methods [10]. The popular non-destructive methods are X-ray diffraction and Neutron diffraction techniques, which are capable of surface and volumetric residual stress measurements, respectively [11,12]. Destructive methods such as hole drilling, sectioning, and crack compliance mainly involved creating free surfaces and relating the deformation to the resultant residual stresses. Wu et al. [13] measured the residual stress using digital image correlation in conjunction with build plate removal and sectioning. The results are compared to the nondestructive volumetric neutron diffraction technique. They concluded that the residual stress is reduced by decreasing the island size, increasing the applied energy per length, and increasing island to wall rotation to 45°. Staub et al. [14] measured the residual stress using the X-ray technique in the L-PBF of SS316L. They concluded that the higher aspect ratio (width/depth) of the melt pool geometry could result in higher residual stress. Wang et al. [15] used X-ray method to measure the residual stress from electron beam additive manufacturing (EBAM) process as well as selective laser melting (SLM) for Ti-6Al-4V and IN718 parts. They summarized that the residual stress of Ti-6Al-4V parts that are made using EBAM is more compressive compared to IN-718. In addition, Ti-6Al-4V parts have a lower absolute value of residual stress compared to IN718 parts that are built using EBAM.
As explained above, there is significant research on the understanding of the residual stress formation under different process conditions using experimentations and numerical modeling. Experimental techniques to measure the residual stress within the part built via L-PBF certainly play an important role in the understanding of the residual stress formation. However, experimental measurement of the stress state in an entire part is time-consuming and expensive. Finite element models could predict the residual stress build-up in the AM components. However, performing FE simulations is challenged by the fact that it is computationally expensive. Consequently, many simplifications in modeling are conducted by applying different methods to predict the residual stress. While these simplifications are applied to this line of modeling, it still needs high-processor computers for the modeling of the entire process.
Numerical modeling is another approach for the prediction of residual stress in metal AM. Hajializade et al. [16] performed a finite element (FE) simulation using an adaptive mesh coarsening algorithm to increase the computational efficiency of the FE model for the direct metal deposition (DMD) of the AISI 304L. They used the double elliptical heat source model to predict the temperature distribution and used the result of thermal modeling to predict the residual stress. The heat loss due to the radiation is ignored in this modeling. Cheng et al. [17] performed FE modeling to predict the residual stress to design the support structure to mitigate residual stress formation. In this modeling, they used the inherent strain method to decrease the computational time. Siewert et al. [18] predicted the residual stress by using the Mechanical Layer Equivalent (MLE) method to decrease the computational time. They validated this model by measuring the residual stress using X-ray.
Herein, a novel physics-based analytical model is proposed to predict the residual stress in the IN718 parts built via L-PBF. The thermal signature of this process is predicted using a moving heat source approach by considering the scan strategy of the hatching space, layer thickness, and scan path, energy needed for solid-state phase change, and heat loss due to the convection and radiation. The high-temperature gradient and non-uniform heating in this process impose thermal stress on the component. The thermal stress is obtained by combining three sources of stresses known as stress due to the body forces, normal tension, and hydrostatic stress. Thermal stress may exceed the yield strength of the part. Hence, the Johnson–Cook (J-C) fellow stress model is used to predict the yield surface. As a result of repeated heating and cooling and the fact that the material is yielded, the through-thickness residual stress along the scan direction and build direction is predicted using the incremental plasticity and kinematic hardening behavior of the metal according to the property of volume invariance in plastic deformation in coupling with equilibrium and compatibility conditions. The X-ray diffraction technique was used to measure the residual stress of the IN718 components built via L-PBF to validate the proposed model. Good agreement was obtained between predicted and measured residual stress, which indicates that the proposed model is a valuable tool for the rapid and accurate prediction of the residual stress build-up in the parts built via L-PBF. Due to the high computational efficiency of the proposed model, it can also be used for the real-time monitoring and control of the build process, as well as for optimization of the process parameters in achieving a high-quality part.

2. Process Modeling

A physics-based closed-form analytical thermo-mechanical model is proposed to predict the residual stress of the IN718 parts built via L-PBF. The model significantly reduces the computational time, which makes it a great tool for the prediction, control, and optimization of the L-PBF process to achieve a high-quality part by cutting the trial-and-error approach.

2.1. Thermal Modeling

A moving point heat source approach is used to predict the temperature field within the parts built via L-PBF. The initial solution of temperature in a semi-infinite medium was derived by Carslaw and Jaeger [19]. Heat losses at part’s boundaries including conduction on lateral faces and convection and radiation on the top surface are solved by modifying the heat source solution. Figure 1 illustrates the heat transfer mechanisms in L-PBF. The closed-form solution of temperature considering part’s boundary condition can be obtained as
T = 1 4 π K R ( T T 0 ) × { P exp ( V ( R + x ) 2 D ) A [ h ( T T 0 ) + ε σ ( T 4 T 0 4 ) + K ( T T 0 ) R ]   } + T 0
where P is the laser power, α represents absorption coefficient, K is the thermal conductivity, R = x 2 + y 2 + z 2 is the radial distance from heat source, V is the laser speed, D = K ρ C is the thermal diffusivity, ρ is the density, C is the specific heat, A is the area of the heat sink, h is convection coefficient, ε is the emissivity, σ is the Stefan–Boltzmann constant, n is the number of heat sinks, i is the index of each heat sink, and T 0 is the initial temperature. More explanation about the heat source solution can be obtained from the previous work of the authors [20,21,22,23].

2.2. Thermal Stress Prediction

Thermal stress induced by non-uniform heating is obtained using Green’s function of stresses due to the point body load [23,24]. The obtained thermal stress is the combination of stresses due to the body forces, normal tension, and hydrostatic stress, as described by Saif et al. [25]:
σ x x ( x , z ) = α ( T ) E ( T ) 1 2 ν ( T ) 0 ( G x h T x ( x , z ) + G x v T z ( x , z ) ) d x d z + 2 z π p ( s ) ( s x ) 2 ( ( s x ) 2 + z 2 ) 2 d s α ( T ) E ( T ) T ( x , z ) 1 2 ν ( T )
σ z z ( x , z ) = α ( T ) E ( T ) 1 2 ν ( T ) 0 ( G z h T x ( x , z ) + G z v T z ( x , z ) ) d x d z + 2 z 3 π p ( s ) ( ( s x ) 2 + z 2 ) 2 d s α ( T ) E ( T ) T ( x , z ) 1 2 ν ( T )
σ x z ( x , z ) = α ( T ) E ( T ) 1 2 ν ( T ) 0 ( G x z h T x ( x , z ) + G x z v T z ( x , z ) ) d x d z + 2 z 2 π p ( s ) ( s x ) ( ( s x ) 2 + z 2 ) 2 d s
σ y y ( x , z ) = ν ( T ) ( σ x x + σ z z ) α ( T ) E ( T ) T ( x , z )
where α represents the coefficient of the thermal expansion, E is the elastic modulus,   T x is the temperature gradient and p ( s ) is expressed by:
p ( s ) = α ( T ) E ( T ) T ( x , z = 0 ) 1 2 ν ( T )
G x h ,   G x V , G z h , G z v , G x z h , G x z v are the plane strain Green’s functions, which are explained in [26].
The closed-form solution of thermal stress can be derived as
σ x x ( i , j ) = α E ( T ) 1 2 ν   ( G x h T x + G x v T z ) ( | x i x i 1 | | z j z j 1 | ) + 2 z π ( p ( s ) ( s x ) 2 ( ( s x ) 2 + z 2 ) 2 | x i x i 1 | α E T 1 2 ν
where T x = T ( i , j ) T ( i 1 , j ) | x i x i 1 | , T z = T ( i , j ) T ( i , j 1 ) | z j z j 1 | and i and j represent a location in the 2D medium at which the stress is calculated. The closed-form solutions of σ z z and σ x z can be derived using the same method.

2.3. Residual Stress Prediction

The Johnson–Cook (J-C) flow stress model is employed to determine the yield surface of the material as
σ = ( A + B ε e f f p n ) ( 1 + C l n ( ε ˙ e f f p ε ˙ 0 ) ) ( 1 [ T T 0 T m T 0 ] m )
where ε e f f   p is the effective plastic strain, ε ˙ e f f p is the effective plastic strain rate,   T is the temperature of material, T m is the melting point of material, and T 0 is the initial temperature. The terms A , B ,   C , n , m ,   and   ε ˙ 0 are the material constant for IN718, which are listed in Table 1.
The yielding criterion is obtained for an isotropic material. Kinematic hardening is considered by employing backstress tensor ( α i j )
F y e i l d = 3 2 ( S i j α i j ) ( S i j α i j ) k 2 = 0
where S i j = σ i j ( σ k k 3 ) δ i j is the deviatoric stress.
If F y e i l d < 0 , the material is in elastic region and the stresses can be obtained from the Hook’s Law. If F y e i l d > 0 ,   incremental plastic strains are calculated and accumulated during the stress history to determine the total plastic strains.
In the elastic–plastic case where the F y e i l d 0 , the strain rate along the scan direction and transverse direction can be calculated using modified McDowell algorithm.
{ 1 E [ σ ˙ x x υ ( σ ˙ y y σ ˙ z z ) ] + α Δ T + 1 h ( σ ˙ x x n x x + σ ˙ y y n y y + σ ˙ z z n z z + 2 σ ˙ x z * n x z ) n x x = ψ ( 1 E [ σ ˙ x x * υ ( σ ˙ y y σ ˙ z z * ) ] + α Δ T + 1 h ( σ ˙ x x * n x x + σ ˙ y y n y y + σ ˙ z z * n z z + 2 σ ˙ x z * n x z ) n x x ) 1 E [ σ ˙ y y υ ( σ ˙ x x σ ˙ z z ) ] + α Δ T + 1 h ( σ ˙ x x n x x + σ ˙ y y n y y + σ ˙ z z n z z + 2 σ ˙ x z * n x z ) n y y = 0 σ ˙ y y = 1 2 ( σ ˙ x x + σ ˙ z z )
where σ ˙ x x * ,   σ ˙ z z * , σ ˙ x z * are the elastic thermal stresses calculated from Equations (2) and (6). In the McDowell model, a hybrid function ( ψ ) is proposed, which depends on the instantaneous value of the modulus ratio h / G as
ψ = 1 exp ( ξ 3 h 2 G )
where ξ = 0.15 is the algorithm constant, h is the plastic modulus, and G = E / ( 2 ( 1 + υ ) ) is the elastic shear modulus. Three systems of equations are solved simultaneously for σ ˙ x x , σ ˙ y y , and σ ˙ z z for each elastic–plastic increment of strain [27].
After one layer is laser scanned, elastic stresses are relaxed to satisfy the boundary condition prescribed by Merwin and Johnson [29] as
ε x x r = 0 ,         σ x x r = f 1 ( z ) ,         ε y y r = 0 ,           σ y y r = f 2 ( z ) ,           ε z z r = f 3 ( z ) ,       σ z z r = 0 ,   γ x z r = f 4 ( z ) ,     σ x z r = 0
Finally, only stresses and strains parallel to the surface ( σ x x r ,     σ y y r ,   γ x z r ) remain non-zero [30].
The proposed analytical model does not consider the effect of geometry. Moreover, the bulk temperature dependent material properties are considered for the simulation of residual stress. It should be noted that the proposed model can be used for both powder bed and powder feed systems by just changing the boundary conditions in the temperature modeling. In powder feed systems, since the part is subjected to air, the heat loss from lateral faces would be due to convection.

3. Experimental Procedure
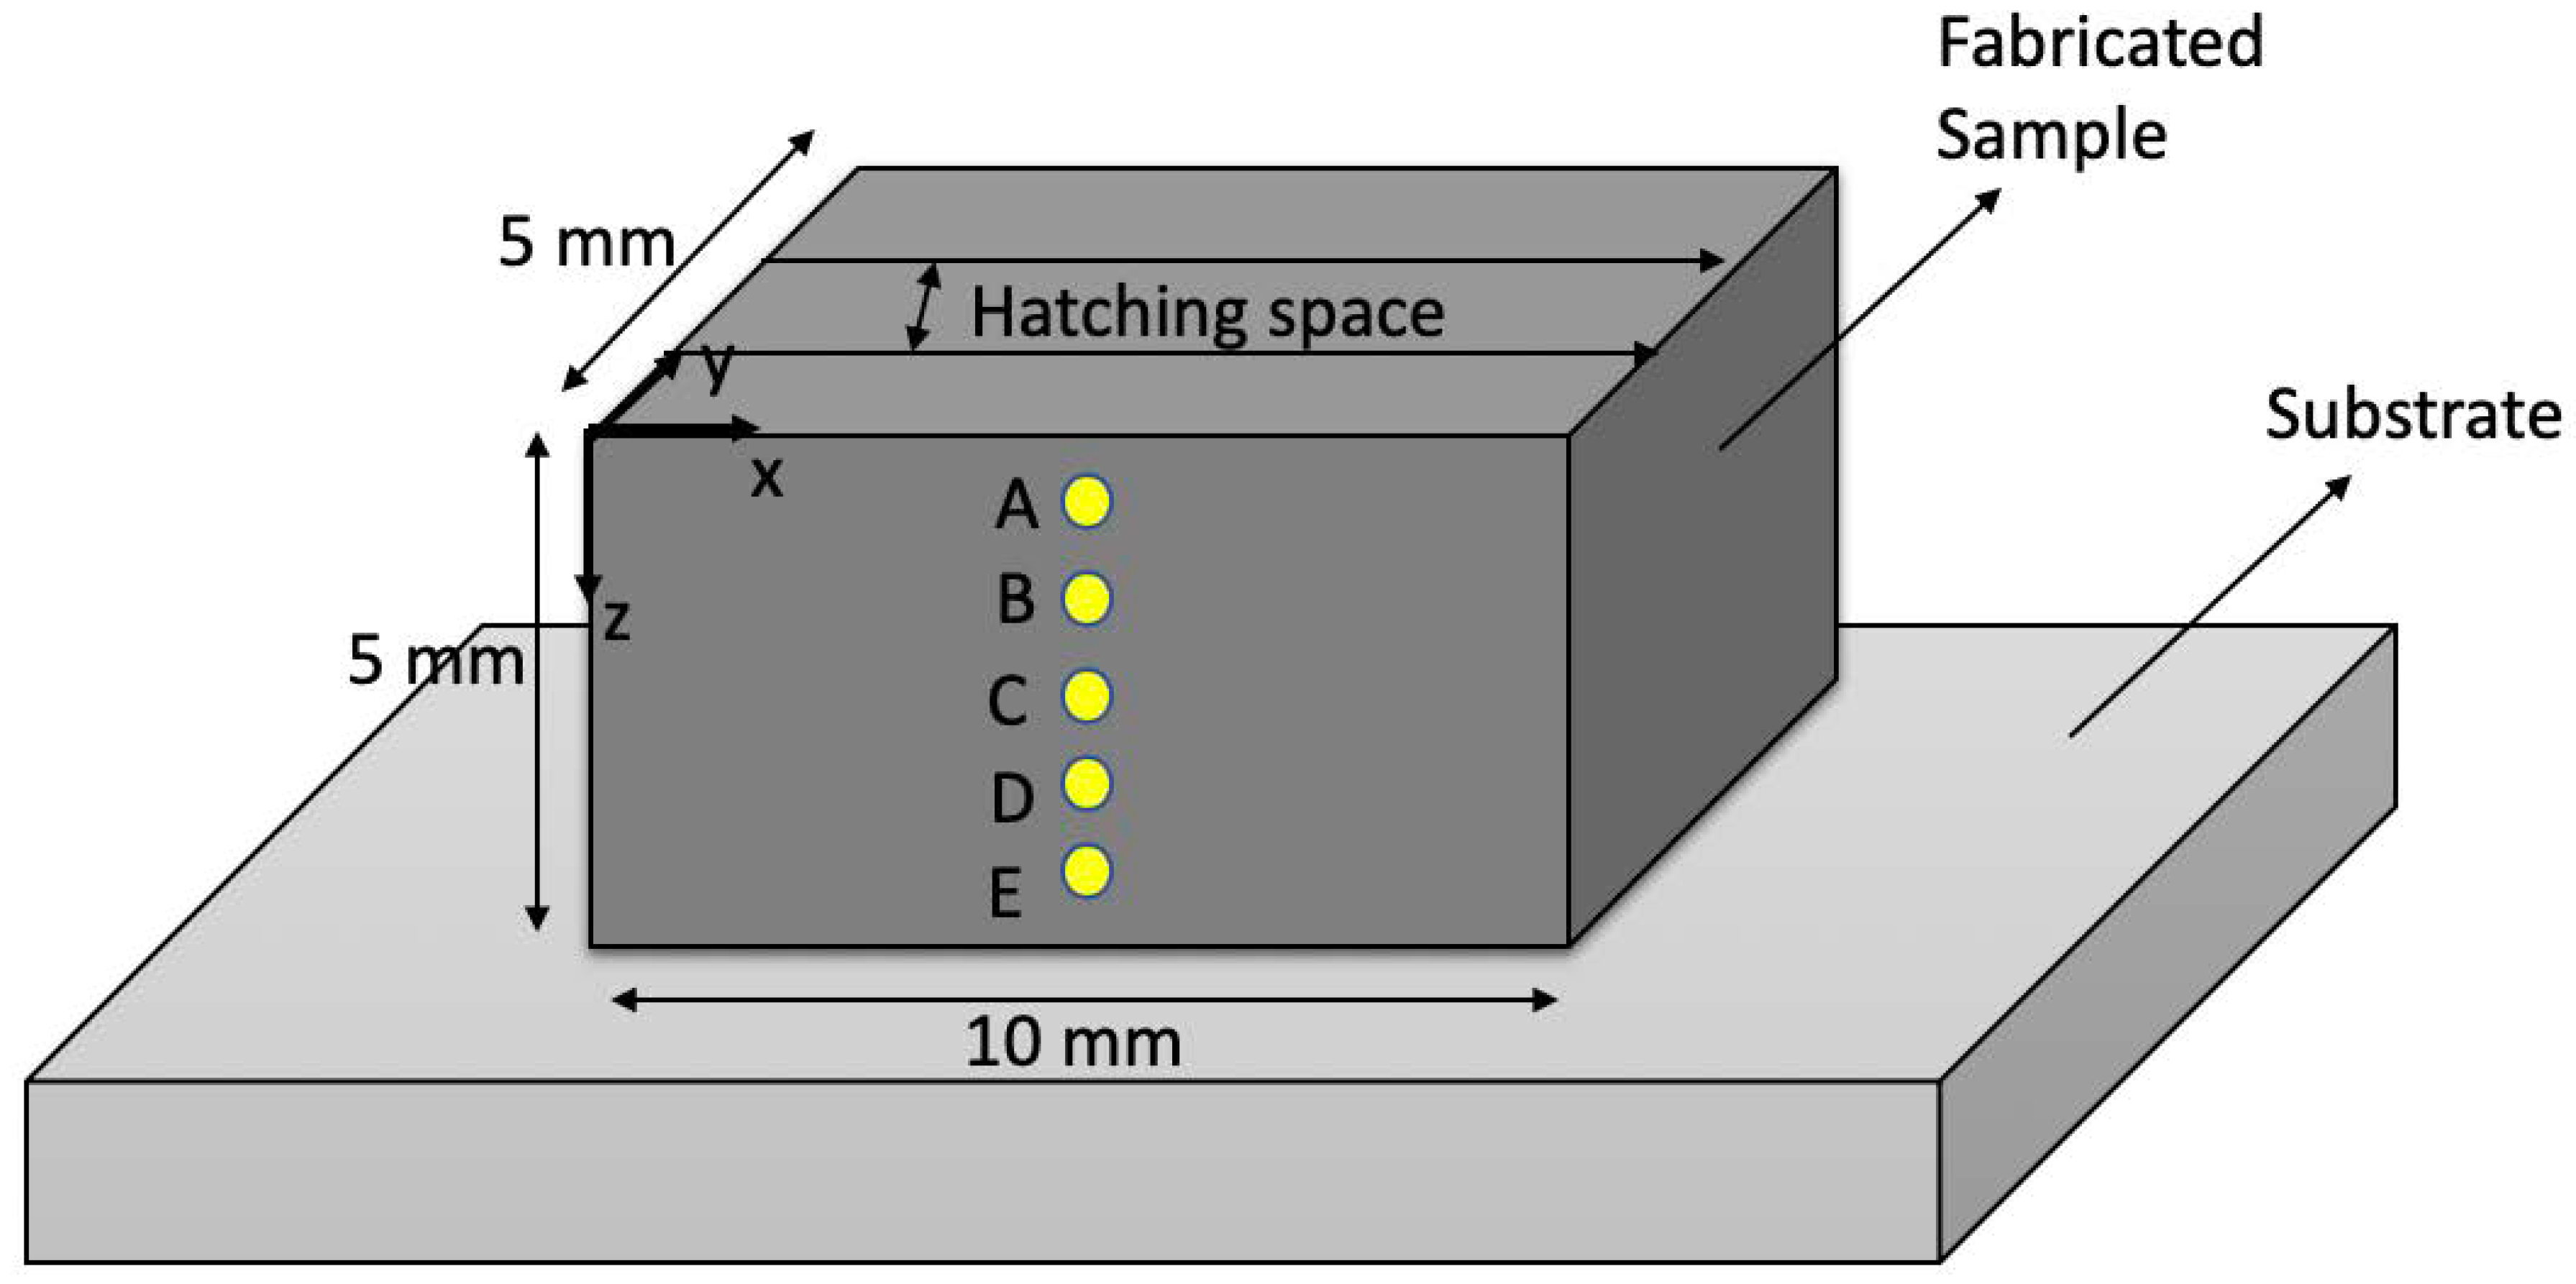
3.1. Build Process

Density of the additively manufactured part built via L-PBF has a crucial impact on mechanical properties of the fabricated component. An approach to identify processing parameters for producing high-density parts was employed to select the processing conditions, as described in the previous studies [31,32,33,34]. Tong Tai AM250 selective laser melting (SLM) machine (Kaohsiung, Taiwan), equipped with a 50–400 W YAG laser with the laser spot size of D4sigma = 54 µm, was used to fabricate rectangular bar shape samples with dimensions of 10 × 5 × 5   mm 3 . The processing conditions used to fabricate high-density samples for measuring the residual stress are listed in Table 2. The spherical IN718 powders used in this study are distributed in the range of d10 = 17.51 µm, d50 = 31.44 µm, and d90 = 52.21 µm.
The process parameters were selected in a way to capture the effects of scan speed and laser power on residual stress; thus, the other parameters of layer thickness, hatching space, and hatch style were kept the same for all samples. Figure 2 illustrates the as-built samples and were then removed from the base plate using the electrical discharge machining (EDM).

3.2. Experimental Measurement of Residual Stress

The residual stress on the side walls of the samples, as illustrated in Figure 3, was measured by a commercial X-ray Diffractions machine (D8 Discover Bruker, Billerica, MA, USA) using the s i n 2 Ψ method [35,36]. The coordinate and location of measured points are shown in Table 3. For each point shown in Figure 3, the through-thickness residual stresses along the build direction (z-direction) and along the scan direction (x-direction) were measured. The parameters for XRD measurement are specified in Table 4. It should be noted that, for each set of parameters and each point shown in Figure 3, the XRD measurements were performed on three fabricated samples and the results were averaged.

4. Results and Discussion

The proposed thermomechanical analytical model enables the prediction of the residual stress of the fabricated L-PBF samples under different process conditions along the scan direction ( σ x x ) and build direction ( σ z z ) . The thermomechanical material properties of the IN718 are listed in Table 5. The thermal response of the build part was predicted using moving point heat source approach by considering the effects of heat loss due to the convection and radiation, scan strategies, and energy needed for solid-state phase transformation. Figure 4, Figure 5 and Figure 6 illustrate the predicted temperature field for three IN718 samples listed in Table 5. The analytical modeling of the temperature field is validated in the previous work of authors [20].
Figure 4 demonstrates the predicted temperature field for the first sample with the laser power of 150 W, scan speed of 600 mm/s, layer thickness of 30 μ m , and hatching space of 100 μ m . It should be noted that the simulated dimension is 5 mm × 0.5 mm × 0.5 mm. The laser was located at the middle of the samples to simulate the temperature field just at the irradiation of the laser. This location of the laser was selected since the experimental measurements were gathered from the middle of the samples to be consistent.
Figure 5 illustrates the predicted temperature field for the second sample with the laser power of 250 W, scan speed of 600 mm/s, layer thickness of 30 μ m , and hatching space of 100 μ m . Figure 6 depicts the predicted temperature field for the third sample with the laser power of 150 W, scan speed of 1000 mm/s, layer thickness of 30 μ m , and hatching space of 100 μ m .
Comparison of Figure 4 and Figure 5 shows that the increase in laser power would increase the melt pool area, and the comparison of Figure 4 and Figure 6 illustrates that, for the same laser power, the increase in scan speed would decrease the melt pool geometry, which is very well-known knowledge and confirms that the proposed model properly follows the trend. The proposed analytical model of the temperature field is validated in the previous work of these authors.
High-temperature gradient and fast cooling rate induce thermal stress in the fabricated part. The thermal stress is calculated using Green’s function of stresses due to the point body load. The thermal stress is a combination of three main sources of stress known as stresses due to body forces, normal tension, and hydrostatic stress. The thermal stress may exceed the yield strength of the material. The yield surface is predicted using the J-C flow stress model. Due to the repeated heating and cooling and the fact that the material is yielded, the part experiences a high level of residual stress. Residual stress is calculated using incremental plasticity and kinematic hardening behavior of the material in coupling with equilibrium and compatibility conditions.
As shown in Figure 3, the residual stress was measured at five different locations through the thickness along the scan direction and build direction. The residual stress was predicted for two different heat transfer boundary conditions: (1) the residual stress considering the heat transfer boundary conditions; and (2) the residual stress considering heat transfer boundary condition. Then, both conditions were compared to experimental measurements.
Figure 7a,b illustrates the predict residual stress for the IN718 sample, which is built with the laser power of 150 W, scan speed of 600 mm/s, layer thickness of 30 μ m , and hatching space of 100 μ m . The predicted and measured residual stresses are highly tensile along both scan direction and build direction since, during the cooling cycle, the heat-affected zone begins to cool down and the shrinkage of material in this zone tends to occur; thus, the tensile stress state builds up in the heated zone. Moreover, the predicted and measured residual stress along the build direction showed higher values compared to that along the scan direction, which is due to the fact that the heat transfer mechanism varies in different directions and would result in different temperature gradient and cooling rates [38]. The variation in temperature gradient and cooling rate resulting from different heat transfer mechanisms would impact the microstructural evolution and material properties, which then impact the residual stress. Furthermore, the comparison of the predicted residual stress with and without considering the effect of heat loss reveals that, although in most of the points through thickness the predicted residual stress in both conditions are within the range of experimental measurements, the predicted residual stress considering the effect of heat loss demonstrates lower bound predictions. This is because, due to the heat loss, the temperature gradient would be lower compared to that without the effect of heat loss. It should also be noted that the predicted residual stress near the surface for these two conditions show more divergence compared to that at higher depth into the workpiece. This is because, the heat loss has higher impact on the heat affected zone and lower impact on the solidified material. Thus, the predictions are more sensitive to the heat loss near the surface where the heat affected zone exists.
Figure 8a,b demonstrates the predicted and measured residual stress of IN718 sample with the laser power of 250 W, scan speed of 600 mm/s, layer thickness of 30 μ m , and hatching space of 100 μ m . The predicted residual stress along the scan direction and build direction are highly tensile in accordance with the data in the literature. Furthermore, the predicted residual stress along the scan direction has lower value compared to that along the build direction. As explained above, different heat transfer mechanisms contribute to this variation. Moreover, the predicted residual stress without considering the effect of heat loss demonstrates upper bound predictions. This is because the temperature gradient is higher compared to that when the effect of heat loss is considered, thus resulting in higher prediction of residual stress values.
Figure 9a,b shows the predicted and measured residual stress along the scan direction and build direction for the laser power of 150 W, scan speed of 1000 mm/s, layer thickness of 30 μ m , and hatching space of 100 μ m . As shown in these figures, the predicted residual stress is highly tensile along the scan direction and build direction. Moreover, the predicted residual stress without considering the effect of heat loss demonstrate higher values compared to that when the effect of heat loss is considered, as explained above. The predicted residual stress showed good agreement with measured residual stress of IN718.
To sum up, the comparison of the predicted and measured residual stress for three IN718 samples showed that the proposed thermo-mechanical analytical is a valuable, reliable, and rapid tool for the prediction of stress state within the part which then can be used for the optimization of process parameters and control of the build process through inverse analysis [39,40,41]. It should be noted that the proposed model works for all material systems as long as the thermo-mechanical material properties are known.

5. Conclusions

A physics-based analytical model is proposed to predict the residual stress in laser powder bed fusion process. The proposed model was validated by measuring the residual stress of the fabricated IN718 samples via X-ray diffraction. The proposed thermo-mechanical analytical model predicts the temperature field of the additively manufactured part using moving point heat source approach by considering the effects of scan strategies, heat loss due to convection and radiation, and energy needed for solid-state phase change. The build part may experience high thermal stress due to the high-temperature gradient. The thermal stress is obtained using Green’s function of stresses due to the point body load. The thermal stress may exceed the yield strength of the material. Thus, the Johnson–Cook flow stress model is used to determine the yield surface. Due to the cyclic heating and cooling, the material experiences high residual stress. The residual stress is predicted using incremental plasticity and kinematic hardening behavior of the metal according to the property of volume invariance in plastic deformation in coupling with the equilibrium and compatibility conditions.
The residual stress is predicted along the scan direction and build direction under three different process conditions. The results show that the residual stress is highly tensile in both directions since, during the cooling cycle, the heat-affected zone begins to cool down and the shrinkage of material in this zone tends to occur; thus, the tensile stress state builds up.
Moreover, a comparison of the residual stress along the scan direction and build direction showed that the predicted residual stress along the build direction is higher than that along the scan direction. Different heat transfer mechanisms along the scan direction and build direction could contribute to this difference.
Furthermore, the residual stress is predicted under two different boundary conditions: (1) the effect of heat loss due to the convection and radiation is considered; and (2) the effect of heat loss from boundaries is ignored. The results show that, when the heat loss is ignored, the predicted residual stress has higher value compared to the results where the effect of heat loss is considered. Although in most of the points through thickness, the results for both conditions are within the range of experimental measurements, the predicted residual stress without the effect of heat loss boundary conditions is an upper bound, and the predicted residual stress with the effect of heat loss boundary conditions is a lower bound.
Results from the proposed analytical residual stress model showed good agreement with X-ray diffraction measurements used to determine the residual stresses in the IN718 specimens built via L-PBF. Thus, the proposed model is a valuable tool for the rapid and accurate prediction of the residual stress build-up in the parts built via L-PBF. Due to the high computational efficiency of the proposed model, this model can also be used for the real-time monitoring and control of the build process, as well as optimization of the process parameters in achieving a high-quality part.

Author Contributions

Conceptualization, E.M.; methodology, E.M.; software, E.M.; validation, E.M., H.-C.T., Y.-L.L., Y.-C.C., H.-Y.L.; formal analysis, E.M.; investigation, E.M.; writing—original draft preparation, E.M.; writing—review and editing, S.Y.L.; visualization, E.M.; supervision, S.Y.L.; All authors have read and agreed to the published version of the manuscript.

Funding

This research received no external funding.

Acknowledgments

The experimental data were financially supported by the “Intelligent Manufacturing Research Center” (iMRC) from The Featured Areas Research Center Program within the framework of the Higher Education Sprout Project by the Ministry of Education (MOE) in Taiwan.

Conflicts of Interest

The authors declare no conflict of interest.

References

  1. Bartlett, J.L.; Li, X. An overview of residual stresses in metal powder bed fusion. Addit. Manuf. 2019, 27, 131–149. [Google Scholar] [CrossRef]
  2. King, W.E. Observation of keyhole-mode laser melting in laser powder-bed fusion additive manufacturing. J. Mater. Process. Technol. 2014, 214, 2915–2925. [Google Scholar] [CrossRef]
  3. Khairallah, S.A. Laser powder-bed fusion additive manufacturing: Physics of complex melt flow and formation mechanisms of pores, spatter, and denudation zones. Acta Mater. 2016, 108, 36–45. [Google Scholar] [CrossRef] [Green Version]
  4. Caiazzo, F. Laser powder-bed fusion of Inconel 718 to manufacture turbine blades. Int. J. Adv. Manuf. Technol. 2017, 93, 4023–4031. [Google Scholar] [CrossRef] [Green Version]
  5. Masoomi, M.; Thompson, S.M.; Shamsaei, N. Laser powder bed fusion of Ti-6Al-4V parts: Thermal modeling and mechanical implications. Int. J. Mach. Tools Manuf. 2017, 118, 73–90. [Google Scholar] [CrossRef] [Green Version]
  6. Levkulich, N. The effect of process parameters on residual stress evolution and distortion in the laser powder bed fusion of Ti-6Al-4V. Addit. Manuf. 2019, 28, 475–484. [Google Scholar] [CrossRef]
  7. Barros, R. Laser Powder Bed Fusion of Inconel 718: Residual Stress Analysis Before and After Heat Treatment. Metals 2019, 9, 1290. [Google Scholar] [CrossRef] [Green Version]
  8. Tabei, A.; Mirkoohi, E.; Garmestani, H.; Liang, S. Modeling of texture development in additive manufacturing of Ni-based superalloys. Int. J. Adv. Manuf. Technol. 2019, 103, 1057–1066. [Google Scholar] [CrossRef]
  9. Bandyopadhyay, A.; Traxel, K.D. Invited review article: Metal-additive manufacturing—Modeling strategies for application-optimized designs. Addit. Manuf. 2018, 22, 758–774. [Google Scholar] [CrossRef]
  10. An, K. Neutron residual stress measurement and numerical modeling in a curved thin-walled structure by laser powder bed fusion additive manufacturing. Mater. Des. 2017, 135, 122–132. [Google Scholar] [CrossRef]
  11. Yadroitsev, I.; Yadroitsava, I. Evaluation of residual stress in stainless steel 316L and Ti6Al4V samples produced by selective laser melting. Virtual Phys. Prototyp. 2015, 10, 67–76. [Google Scholar] [CrossRef]
  12. Liu, Y.; Yang, Y.; Wang, D. A study on the residual stress during selective laser melting (SLM) of metallic powder. Int. J. Adv. Manuf. Technol. 2016, 87, 647–656. [Google Scholar] [CrossRef]
  13. Wu, A.S. An experimental investigation into additive manufacturing-induced residual stresses in 316L stainless steel. Metall. Mater. Trans. A 2014, 45, 6260–6270. [Google Scholar] [CrossRef]
  14. Staub, A.; Spierings, A.B.; Wegener, K. Correlation of meltpool characteristics and residual stresses at high laser intensity for metal lpbf process. Adv. Mater. Process. Technol. 2019, 5, 153–161. [Google Scholar] [CrossRef]
  15. Wang, Z. Residual stress mapping in Inconel 625 fabricated through additive manufacturing: Method for neutron diffraction measurements to validate thermomechanical model predictions. Mater. Des. 2017, 113, 169–177. [Google Scholar] [CrossRef] [Green Version]
  16. Hajializadeh, F.; Ince, A. Finite element–based numerical modeling framework for additive manufacturing process. Mater. Des. Process. Commun. 2019, 1, e28. [Google Scholar] [CrossRef] [Green Version]
  17. Cheng, B.; Chou, K. Geometric consideration of support structures in part overhang fabrications by electron beam additive manufacturing. Comput. Aided Des. 2015, 69, 102–111. [Google Scholar] [CrossRef] [Green Version]
  18. Siewert, M. Validation of Mechanical Layer Equivalent Method for simulation of residual stresses in additive manufactured components. Comput. Math. Appl. 2019, 78, 2407–2416. [Google Scholar] [CrossRef]
  19. Jaeger, J.C.; Carslaw, H.S. Conduction of Heat in Solids; Clarendon Press: Oxford, UK, 1959. [Google Scholar]
  20. Ning, J. Analytical modeling of 3D temperature distribution in selective laser melting of Ti-6Al-4V considering part boundary conditions. J. Manuf. Process. 2019, 44, 319–326. [Google Scholar] [CrossRef]
  21. Mirkoohi, E. Heat Source Modeling in Selective Laser Melting. Materials 2019, 12, 2052. [Google Scholar] [CrossRef] [Green Version]
  22. Mirkoohi, E. Three-dimensional semi-elliptical modeling of melt pool geometry considering hatch spacing and time spacing in metal additive manufacturing. J. Manuf. Process. 2019, 45, 532–543. [Google Scholar] [CrossRef]
  23. Mirkoohi, E. Thermal modeling of temperature distribution in metal additive manufacturing considering effects of build layers, latent heat, and temperature-sensitivity of material properties. J. Manuf. Mater. Process. 2018, 2, 63. [Google Scholar] [CrossRef] [Green Version]
  24. Woo, W. Effect of interlayers and scanning strategies on through-thickness residual stress distributions in additive manufactured ferritic-austenitic steel structure. Mater. Sci. Eng. A 2019, 744, 618–629. [Google Scholar] [CrossRef]
  25. Saif, M.; Hui, C.; Zehnder, A. Interface shear stresses induced by non-uniform heating of a film on a substrate. Thin Solid Films 1993, 224, 159–167. [Google Scholar] [CrossRef]
  26. Mirkoohi, E. Thermo-mechanical modeling of thermal stress in metal additive manufacturing considering elastoplastic hardening. CIRP J. Manuf. Sci. Technol. 2020, 28, 52–67. [Google Scholar] [CrossRef]
  27. McDowell, D. An approximate algorithm for elastic-plastic two-dimensional rolling/sliding contact. Wear 1997, 211, 237–246. [Google Scholar] [CrossRef]
  28. Kobayashi, T. Plastic flow behavior of Inconel 718 under dynamic shear loads. Int. J. Impact Eng. 2008, 35, 389–396. [Google Scholar] [CrossRef]
  29. Group, A.M.; Merwin, J.; Johnson, K. An analysis of plastic deformation in rolling contact. Proc. Inst. Mech. Eng. 1963, 177, 676–690. [Google Scholar] [CrossRef]
  30. Mirkoohi, E.; Dobbs, J.R.; Liang, S.Y. Analytical modeling of residual stress in direct metal deposition considering scan strategy. Int. J. Adv. Manuf. Technol. 2020, 106, 4105–4121. [Google Scholar] [CrossRef]
  31. Lo, Y.-L.; Tran, H.-C. Optimized Hatch Space Selection in Double-Scanning Track Selective Laser Melting Process. Int. J. Adv. Manuf. Technol. 2019, 105, 2989–3006. [Google Scholar] [CrossRef]
  32. Tran, H.-C. Systematic Approach for Determining Optimal Processing Paramters to Produce Parts with High Density in Selective Laser Melting Process. Int. J. Adv. Manuf. Technol. 2019, 105, 4443–4460. [Google Scholar] [CrossRef]
  33. Tran, H.-C.; Lo, Y.-L. Heat transfer simulations of selective laser melting process based on volumetric heat source with powder size consideration. J. Mater. Process. Technol. 2018, 255, 411–425. [Google Scholar] [CrossRef]
  34. Tran, H.-C.; Lo, Y.-L.; Huang, M.-H. Analysis of Scattering and Absorption Characteristics of Metal Powder Layer for Selective Laser Sintering. IEEE/ASME Trans. Mechatron. 2017, 22, 1807–1817. [Google Scholar] [CrossRef]
  35. Nadammal, N. Influence of support configurations on the characteristics of selective laser-melted inconel 718. JOM 2018, 70, 343–348. [Google Scholar] [CrossRef]
  36. Prevey, P.S. X-ray diffraction residual stress techniques. ASM Int. 1986, 10, 380–392. [Google Scholar]
  37. Yang, Y. Prediction of microstructure, residual stress, and deformation in laser powder bed fusion process. Comput. Mech. 2018, 61, 1–17. [Google Scholar] [CrossRef]
  38. Ganeriwala, R. Evaluation of a thermomechanical model for prediction of residual stress during laser powder bed fusion of Ti-6Al-4V. Addit. Manuf. 2019, 27, 489–502. [Google Scholar] [CrossRef]
  39. Mirkoohi, E.; Bocchini, P.; Liang, S.Y. An analytical modeling for process parameter planning in the machining of Ti-6Al-4V for force specifications using an inverse analysis. Int. J. Adv. Manuf. Tech. 2018, 98, 2347–2355. [Google Scholar] [CrossRef]
  40. Mirkoohi, E.; Bocchini, P.; Liang, S.Y. Inverse analysis of residual stress in orthogonal cutting. J. Manuf. Process 2019, 38, 462–471. [Google Scholar] [CrossRef]
  41. Mirkoohi, E.; Bocchini, P.; Liang, S.Y. Analytical temperature predictive modeling and non-linear optimization in machining. Int. J. Adv. Manuf. Tech. 2019, 102, 1557–1566. [Google Scholar] [CrossRef]
Figure 1. Heat transfer mechanisms in laser powder bed fusion.
Crystals 10 00337 g001
Figure 2. Illustration of the as-built IN718 parts manufactured via L-PBF.
Crystals 10 00337 g002
Figure 3. Schematic diagram illustrating the definition of processing parameters.
Crystals 10 00337 g003
Figure 4. Predicted temperature field for the fabricated IN718 sample built via L-PBF with the laser power of 150 W, scan speed of 600 mm/s, layer thickness of 30 μ m , and hatching space of 100 μ m .
Crystals 10 00337 g004
Figure 5. Predicted temperature field for the fabricated IN718 sample built via L-PBF with the laser power of 250 W, scan speed of 600 mm/s, layer thickness of 30 μ m , and hatching space of 100 μ m .
Crystals 10 00337 g005
Figure 6. Predicted temperature field for the fabricated IN718 sample built via L-PBF with the laser power of 150 W, scan speed of 1000 mm/s, layer thickness of 30 μ m , and hatching space of 100 μ m .
Crystals 10 00337 g006
Figure 7. Predicted and measured residual stress of IN718 sample built via L-PBF with the laser power of 150 W and scan speed of 600 mm/s, layer thickness of 30 μ m , and hatching space of 100 μ m : (a) along the scan direction; and (b) along the build direction.
Crystals 10 00337 g007
Figure 8. Predicted and measured residual stress of IN718 sample built via L-PBF with the laser power of 250 W and scan speed of 600 mm/s, layer thickness of 30 μ m , and hatching space of 100 μ m : (a) along the scan direction; and (b) along the build direction.
Crystals 10 00337 g008
Figure 9. Predicted and measured residual stress of IN718 sample built via L-PBF with the laser power of 150 W and scan speed of 1000 mm/s, layer thickness of 30 μ m , and hatching space of 100 μ m : (a) along the scan direction; and (b) along the build direction.
Crystals 10 00337 g009
Table 1. Johnson–Cook parameters for IN718 [28].
A (MPa)B (MPa)Cnm ε ˙ 0
98013700.020.1641.031
Table 2. Process parameters designed for the fabrication of IN718 specimens using L-PBF.
SampleLaser Power (W)Scan Speed (mm/s)Layer Thickness (µm)Hatching Space (µm)Number of ScansPre-HeatingRotation Angle of Scan Vector between Layers (°)
11506003010050No67
22506003010050No67
315010003010050No67
Table 3. Coordinates of the measured points using XRD.
Ax = 5 mm; y = 0; z = 0.5 mm
Bx = 5 mm; y = 0; z = 1.5 mm
Cx = 5 mm; y = 0; z = 2.5 mm
Dx = 5 mm; y = 0; z = 3.5 mm
Ex = 5 mm; y = 0; z = 4.5 mm
Table 4. Parameters for XRD measurements.
Focus1.0 mm
RadiationCu Kα
Lattice Plane (hkl) [36]{420}
2Ɵ [36]145°
Ψ-Tilting0° to 45° in 6 steps each
Young Modulus [37]199,955 MPa
Poisson Ration [37]0.29
Table 5. Temperature dependent material properties of IN718 (temperature is in °C) [37,38,39,40,41].
Density g/cm3
ρ = 8.19 39.2 × 10 2 T 25 < T 1170
ρ = 7.40 88.0 × 10 2 ( T 1200 ) T > 1170
Thermal Conductivity W/m°C
k = 39.73 24.0 × 10 3 T + 2 × 10 3 T 2 25 < T < 1170
k = 29.6 T > 1170
Specific Heat J/kg°C
C p = 420.24 + 0.026 T 4 × 10 6 T 2 25 < T 1170
C p = 650 T > 1170
Thermal Expansion 1/°C
α = 9 × 10 13 T 2 7.7 × 10 9 T + 1.1 × 10 5 25 < T 1100
α = 1.8 × 10 5 T > 1100
Elastic Modulus GPa
E = 5.2 × 10 5 T 2 0.088 T + 1.6 × 10 2 25 < T 798
E = 3.1 × 10 5 T 2 0.23 T + 2.9 × 10 2 798 < T < 2500
Yield Strength MPa
σ Y = 9 × 10 10 T 4 1.2 × 10 6 T 3 + 0.00026 T 2 0.23 T + 3.2 × 10 2 25 < T < 2500
Poisson’s Ratio
ν = 4.8 × 10 10 T 3 8.8 × 10 7 T 2 0.00031 T + 0.31 25 < T < 2500

