Article

Cyclic Automated Model Building (CAB) Applied to Nucleic Acids

by
Maria Cristina Burla
,
Benedetta Carrozzini
,
Giovanni Luca Cascarano
,
Carmelo Giacovazzo
* and
Giampiero Polidori
Istituto di Cristallografia, CNR, Via G. Amendola 122/o, I-70126 Bari, Italy
*
Author to whom correspondence should be addressed.
Crystals 2020, 10(4), 280; https://doi.org/10.3390/cryst10040280
Submission received: 14 March 2020 / Revised: 2 April 2020 / Accepted: 3 April 2020 / Published: 7 April 2020
(This article belongs to the Special Issue Nucleic Acid Crystallography)

Abstract

:
Obtaining high-quality models for nucleic acid structures by automated model building programs (AMB) is still a challenge. The main reasons are the rather low resolution of the diffraction data and the large number of rotatable bonds in the main chains. The application of the most popular and documented AMB programs (e.g., PHENIX.AUTOBUILD, NAUTILUS and ARP/wARP) may provide a good assessment of the state of the art. Quite recently, a cyclic automated model building (CAB) package was described; it is a new AMB approach that makes the use of BUCCANEER for protein model building cyclic without modifying its basic algorithms. The applications showed that CAB improves the efficiency of BUCCANEER. The success suggested an extension of CAB to nucleic acids—in particular, to check if cyclically including NAUTILUS in CAB may improve its effectiveness. To accomplish this task, CAB algorithms designed for protein model building were modified to adapt them to the nucleic acid crystallochemistry. CAB was tested using 29 nucleic acids (DNA and RNA fragments). The phase estimates obtained via molecular replacement (MR) techniques were automatically submitted to phase refinement and then used as input for CAB. The experimental results from CAB were compared with those obtained by NAUTILUS, ARP/wARP and PHENIX.AUTOBUILD.

1. Introduction

Automated model building (AMB) programs try to replace the visual interpretation of the three-dimensional electron density map, which is usually time consuming and subjective, with automatic procedures to speed up the structure determination process and to minimize the modelling errors.
Several successful and well-documented AMB programs are available for proteins (among others, we cite BUCCANEER [1], ARP/wARP [2], PHENIX.AUTOBUILD [3]). Equivalent tools for nucleic acids exist, but most of them are still in progress. Indeed, quite often, such AMB programs aid in detecting errors in crystallographic models [4], or extend and rebuild existing nucleotides chains [5] or perform semi-automatic building [6].
Because the number of solved nucleic acid structures is rapidly increasing, more efforts were spent recently on the specific difficulties in the electron density interpretation due to lower resolution data [7] and the large number of rotatable bonds in the main chain (two in the protein main chain, six in nucleic acids). As a consequence, the conformation at low resolution is often ambiguous, particularly for large nucleic acid structures, and is typically determined at resolutions worse than 2.5Å. It is not uncommon that phosphate and base planes are reliably located, but sugars and part of the backbone are not seen at all [8]. Rebuilding and refining current models is often a time-consuming manual practice, so AMB promise to save time.
In spite of the above limitations, complete or almost complete AMB packages for nucleic acids exist: PHENIX.AUTOBUILD [3], ARP/wARP [9] and NAUTILUS [10]. These programs build nucleotide chains in a rather automatic manner. All such AMB procedures are based on an intensive use of prior crystallochemical knowledge. Indeed, nucleotides contain three rigid groups: the pentose sugar, the phosphate group and the base. Different programs use different tools for the AMB: some programs use the planarity of the base (e.g., in ARP/wARP), others exploit the sugar and the phosphate groups as the first tool for identifying the main chain (e.g., in NAUTILUS). All try to extend possible nucleotide chains and match the built chains to the nucleotide sequence. Models so found may be refined via REFMAC [11] or PHENIX.REFINE [12]; usually, calculations are iterated to obtain more complete models. It is typical that a good percentage of nucleotides are correctly built in the final model.
Recently, the cyclic automated model building (CAB) package for protein-automated model building was described [13]. CAB uses BUCCANEER in a cyclic procedure aimed at increasing its rate of success and the quality of the provided molecular models. In other words, CAB wraps around BUCCANEER. This program is itself cyclic; a standard BUCCANEER run performs five cycles of model building and 10 cycles of model refinement via REFMAC. CAB is highly automated and not very time consuming because BUCCANEER is fast, efficient, simple to use, and rather insensitive to the resolution limit of the data. CAB was tested over 81 protein structures solved via molecular replacement, anomalous dispersion and ab initio methods. The results showed that CAB gave more complete and accurate structures compared to the conventional use of BUCCANEER.
The success of CAB for proteins suggests that similar improvements may be made for nucleic acids. Here, we test whether or not the cyclic application of NAUTILUS by CAB improves the completeness and accuracy of the resulting nucleic acid structures. As was done for proteins, CAB does not modify the basic NAUTILUS algorithms at all; it has to be considered as a tool that allows the synergistic combination of NAUTILUS with some supplementary algorithms, offering more chances for the correct interpretation of the electron density maps. Indeed, in our experience, a starting set with the smallest average phase error is not always the most successful when an AMB program is applied; often, it is the variety of starting sets which allows CAB to improve NAUTILUS results.
The criteria we will use for making cyclic NAUTILUS applications cannot coincide with the criteria used for making cyclic BUCCANEER because of the strong differences between protein and nucleic acids crystallochemistry. We describe, in Section 2, the algorithms introduced into CAB for the location of the heavy atoms contained into ligands; in Section 3, we describe the recursive CAB algorithms for nucleic acids and, in Section 4, the experimental tests where we compare the results obtained by CAB with those obtained by NAUTILUS, ARP/wARP and PHENIX.AUTOBUILD.

2. CAB Algorithm for Locating Ligand Heavy Atoms

We suppose that a set of observed structure factor amplitudes with refined ϕr phases and wr weights are available as the starting point for any AMB application. They were first obtained by applying REMO09 [14] to the test structures, and then refined via the SYNERGY approach [15]. The name of the latter procedure arises from the fact that it combines mainstream phase refinement procedures (DM by Cowtan [16]) and out-of-mainstream phase refinement techniques. SYNERGY includes free lunch [17,18], low density Fourier transform [19], vive la difference [20,21], phantom derivative [22,23] and phase-driven model refinement [24]. SYNERGY, as well as REMO09, was included in a modified version of SIR2014 [25].
In nucleic acid structures, sometimes the ligands’ scattering power is a not negligible part of the total scattering power, and often ligands contain (or are constituted by) heavy atoms. If no ligand is taken into account, the final R value may be large even if the nucleic acid model is good. This is mainly due to the fact that any AMB program is more focused on building nucleic acid models than defining the ligand substructure. Because the latter contribution does not enter into the model structure factor calculation, an additional systematic discrepancy occurs between the observed structure factor amplitudes and the calculated nucleic acid amplitudes, thereby causing larger values of R (and of Rf) and, therefore, a larger distrust of the user.
We then decided to modify the standard CAB approach by searching for ligands, including heavy atoms, in the first step. In this step, another task may also be accomplished: the identification of the P atoms belonging to the nucleic acid backbone. This decision is supported by the observation that often the average phase error corresponding to ϕr phases (say <|Δϕr |>) is low, even if the average phase error at the molecular replacement level is large. This is mainly due to the effectiveness of the SYNERGY step. Indeed, after SYNERGY it may be easier to locate heavy atoms and also to recognize a good percentage of the P atomic positions.
A useful premise for the location of heavy atoms is the following: the number and positions of the heavy atoms are unknown, while their atomic species are assumed to be known due to the known chemical composition of the ligands. Only atoms with an atomic number equal or larger than 20 are considered “heavy”. The above condition is suggested by the following criterion: heavy atoms are not subjected to constraints or restraints during the least-squares refinement, so the optimization of their positions is feasible only if the atomic species is sufficiently heavy. If ligands contain two or more heavy atom species, we associate them with the heaviest atomic species. The following automatic algorithm is used:
(i) An observed electron density map is calculated by using ϕr phases and wr weights. The first candidates for being P atoms in the target structure are the P atoms of the model structure, as refined by SYNERGY. If no heavy atoms are present in ligands, steps (ii) and (iii) are skipped;
(ii) The highest N peaks (where N = 30 × number of nucleotides in the target sequence) are selected and sorted with respect to the intensity (I). All peaks closer than DIST from model atoms are rejected, where DIST corresponds to the covalent radius of the heaviest species in the target. Non-crystallographic occupancy I(i)/I(1) and the heaviest atomic species in the target are associated to the ith peak;
(iii) The structure parameters of 10 peaks with the largest I(i)/I(1) values are refined, one atom at a time, together with the nucleic acid model previously determined, by five REFMAC cycles. Then, a new R value is obtained. If it is smaller than the previous one, the heavy atom is accepted as a reliable candidate of the heavy atom substructure and the next peak is processed; otherwise, the procedure for locating heavy atoms stops.
At the end of the steps (ii) and (iii), a list of heavy atom candidates are available. The final R (and Rf) values and the new phase estimates (denoted by ϕrh) are expected to be better than the corresponding values obtained at the end of SYNERGY. Correspondently, the new average phase error (say <|Δ ϕrh|>) is expected to be smaller.
Heavy atom candidates added to the SYNERGY model are used to calculate new structure factors by which a new electron density map is calculated. Steps ii) and iii) are repeated and a new model is obtained, which now includes the final estimates of P and heavy atoms’ positions. A new phase set (ϕrh) and a new average phase error (<|Δ ϕrh|>) correspond to such models.
There is a special reason why P atoms’ positions are examined. In an experimental version of NAUTILUS (Cowtan, personal communication 2020), it is possible to use two new tools to improve the NAUTILUS default model building: a more extended library of nucleic acid model structures and the previous knowledge of the positions of the triples (O3’, P, O5’). A good percentage of such triples may be correctly identified when SYNERGY and the above described algorithm for heavy atom location end with a small R value. Then, a list of triples (O3’, P, O5’) is automatically passed to NAUTILUS, which may build the final model of the target nucleic acid more efficiently.

3. The Recursive Algorithm
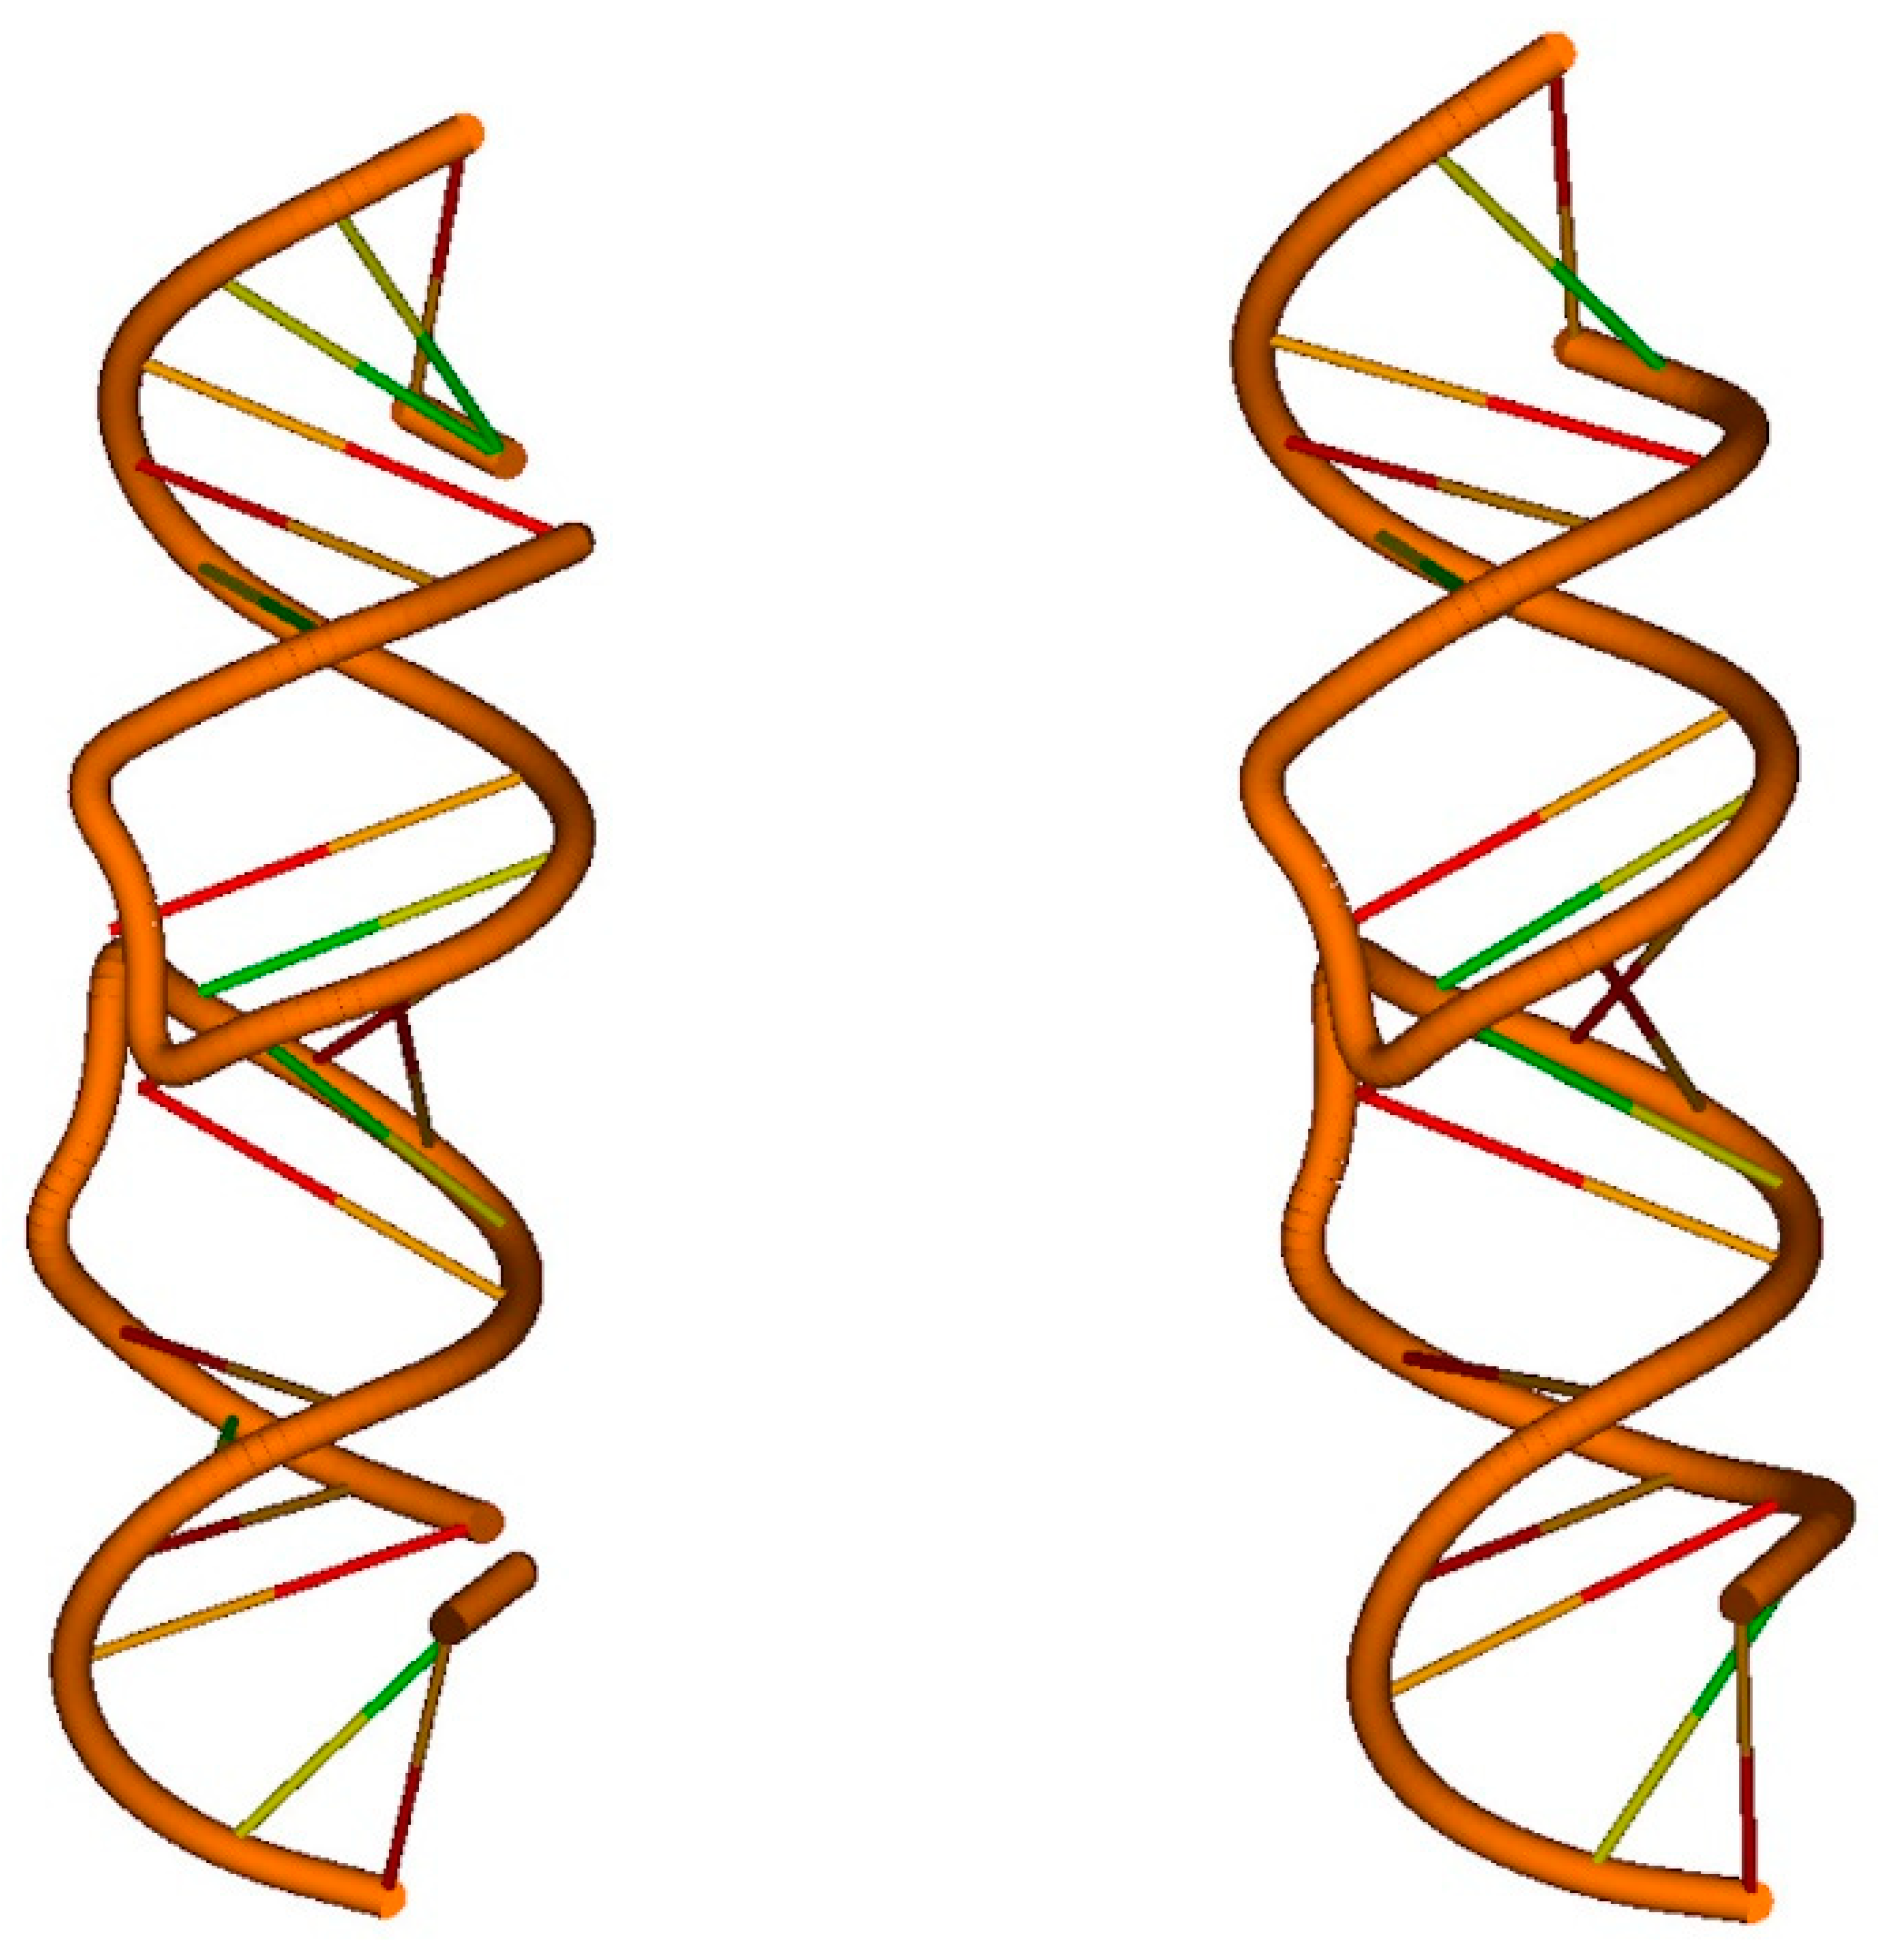
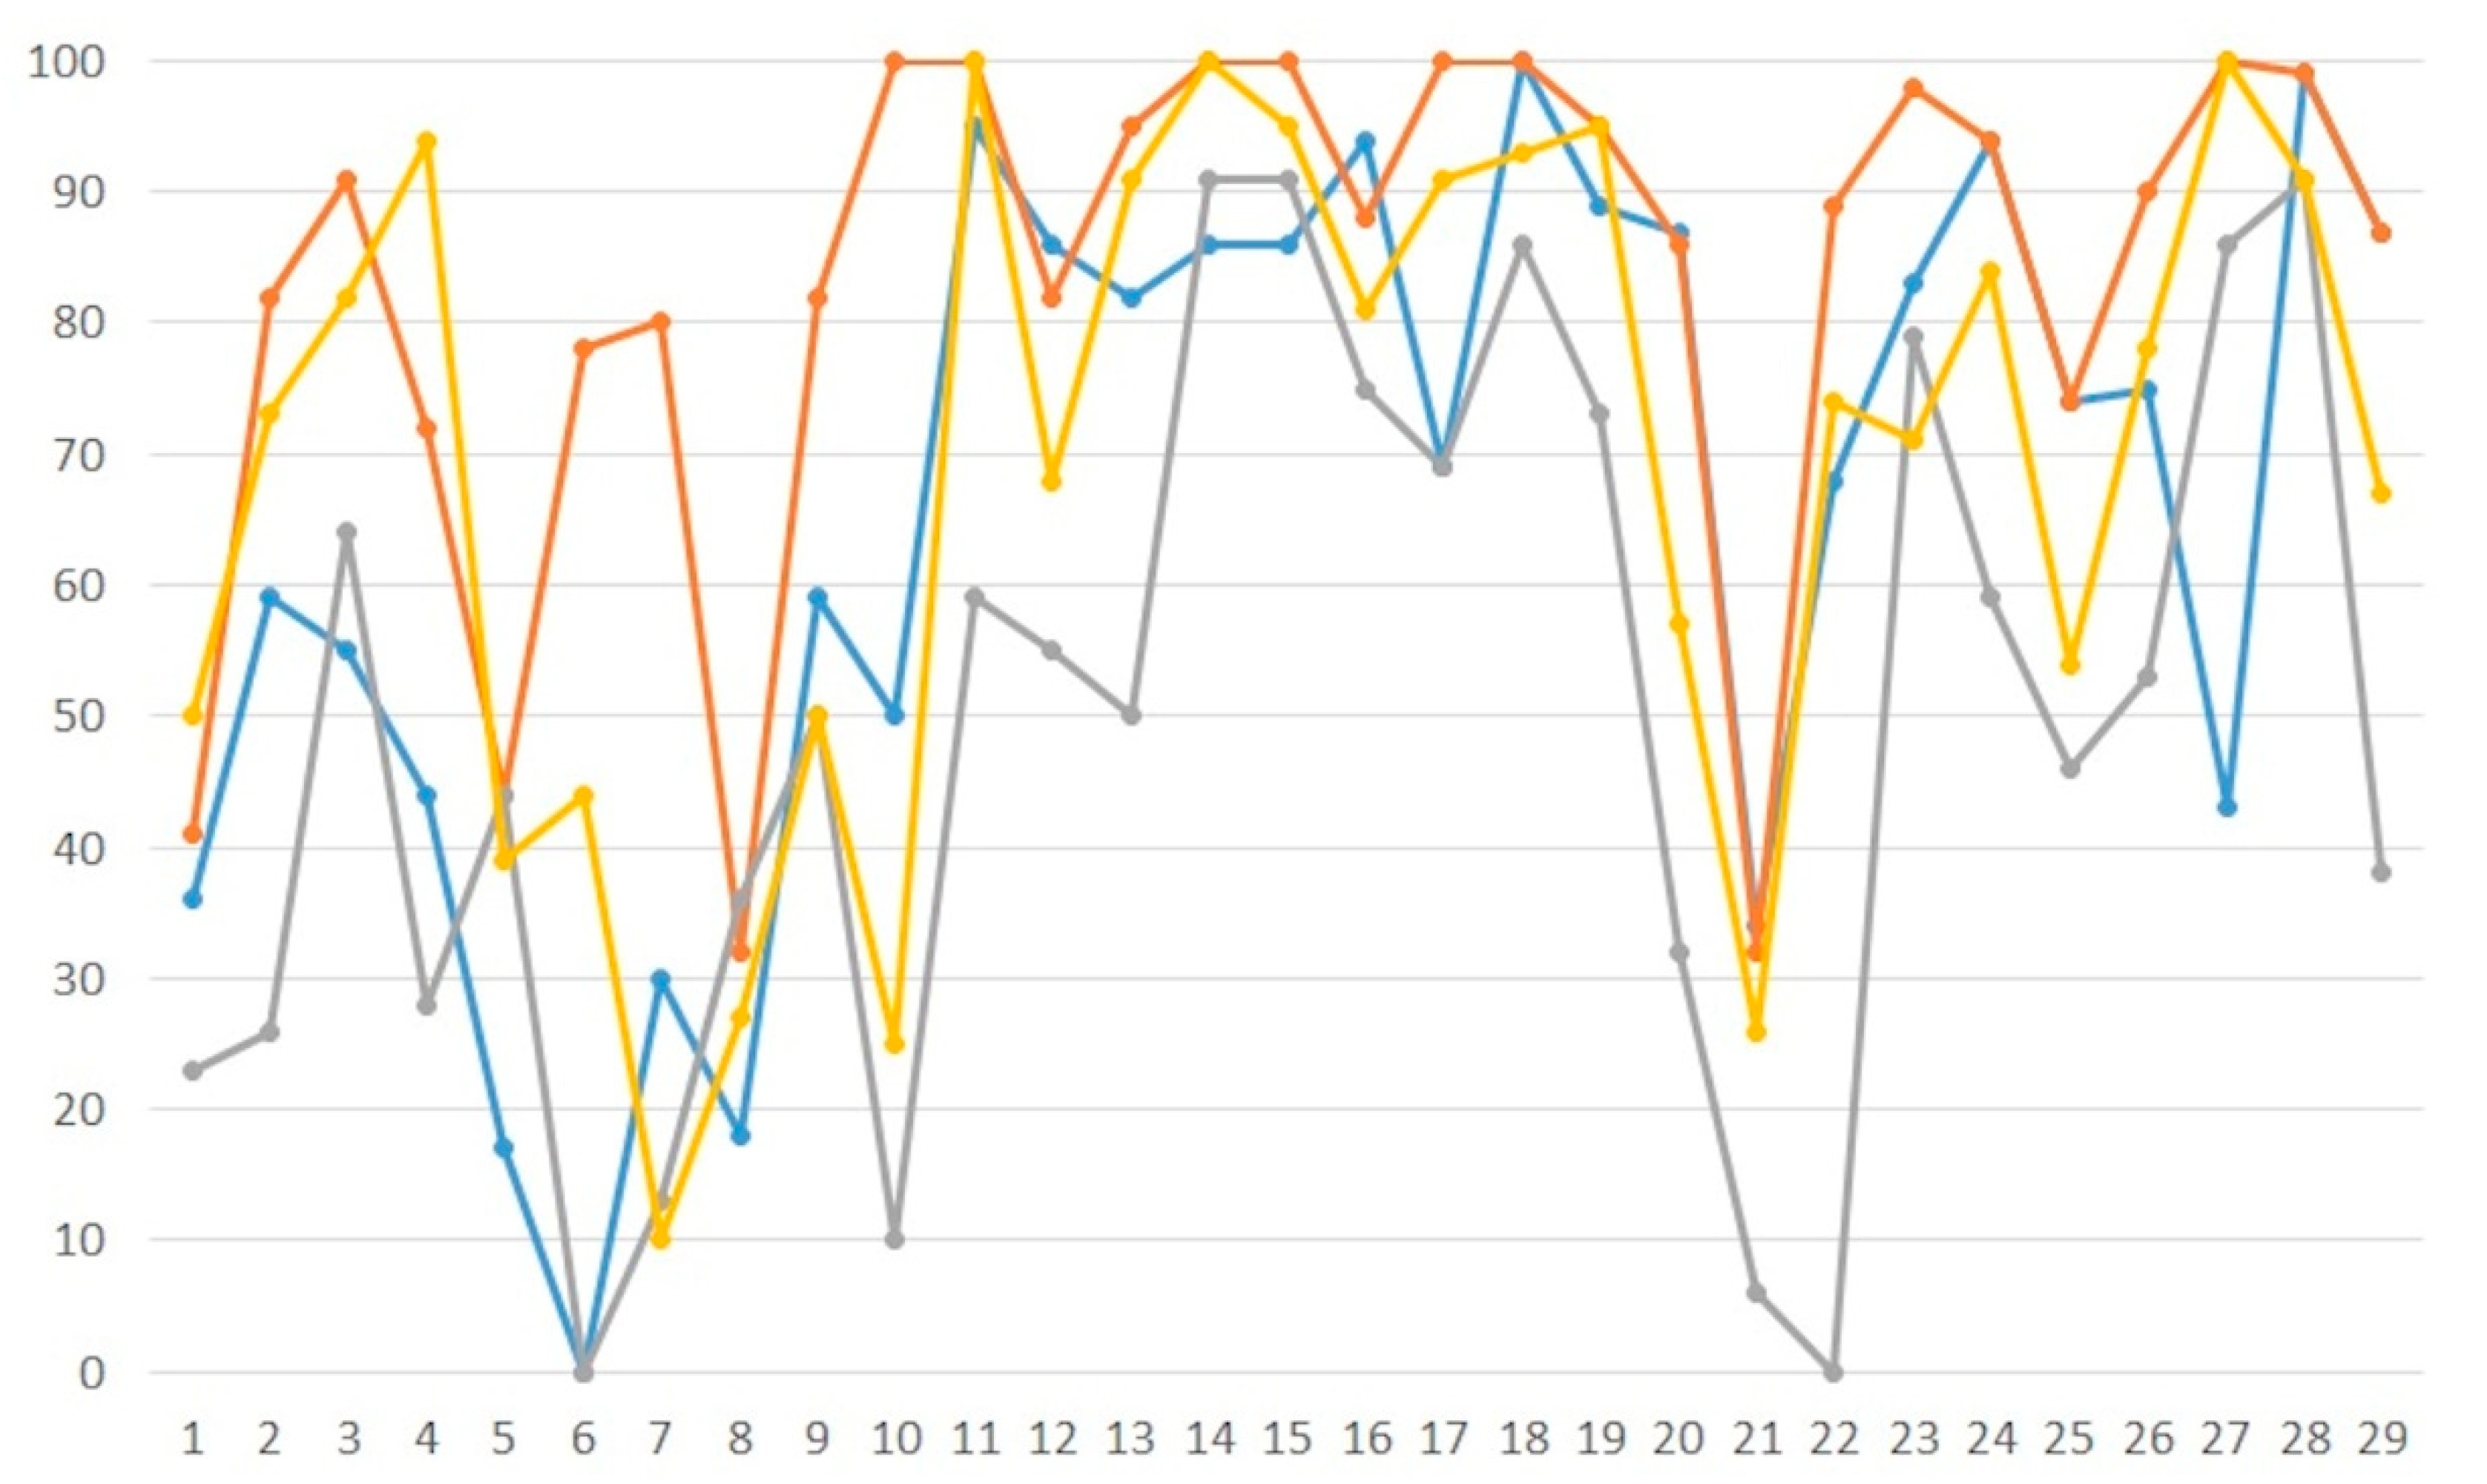
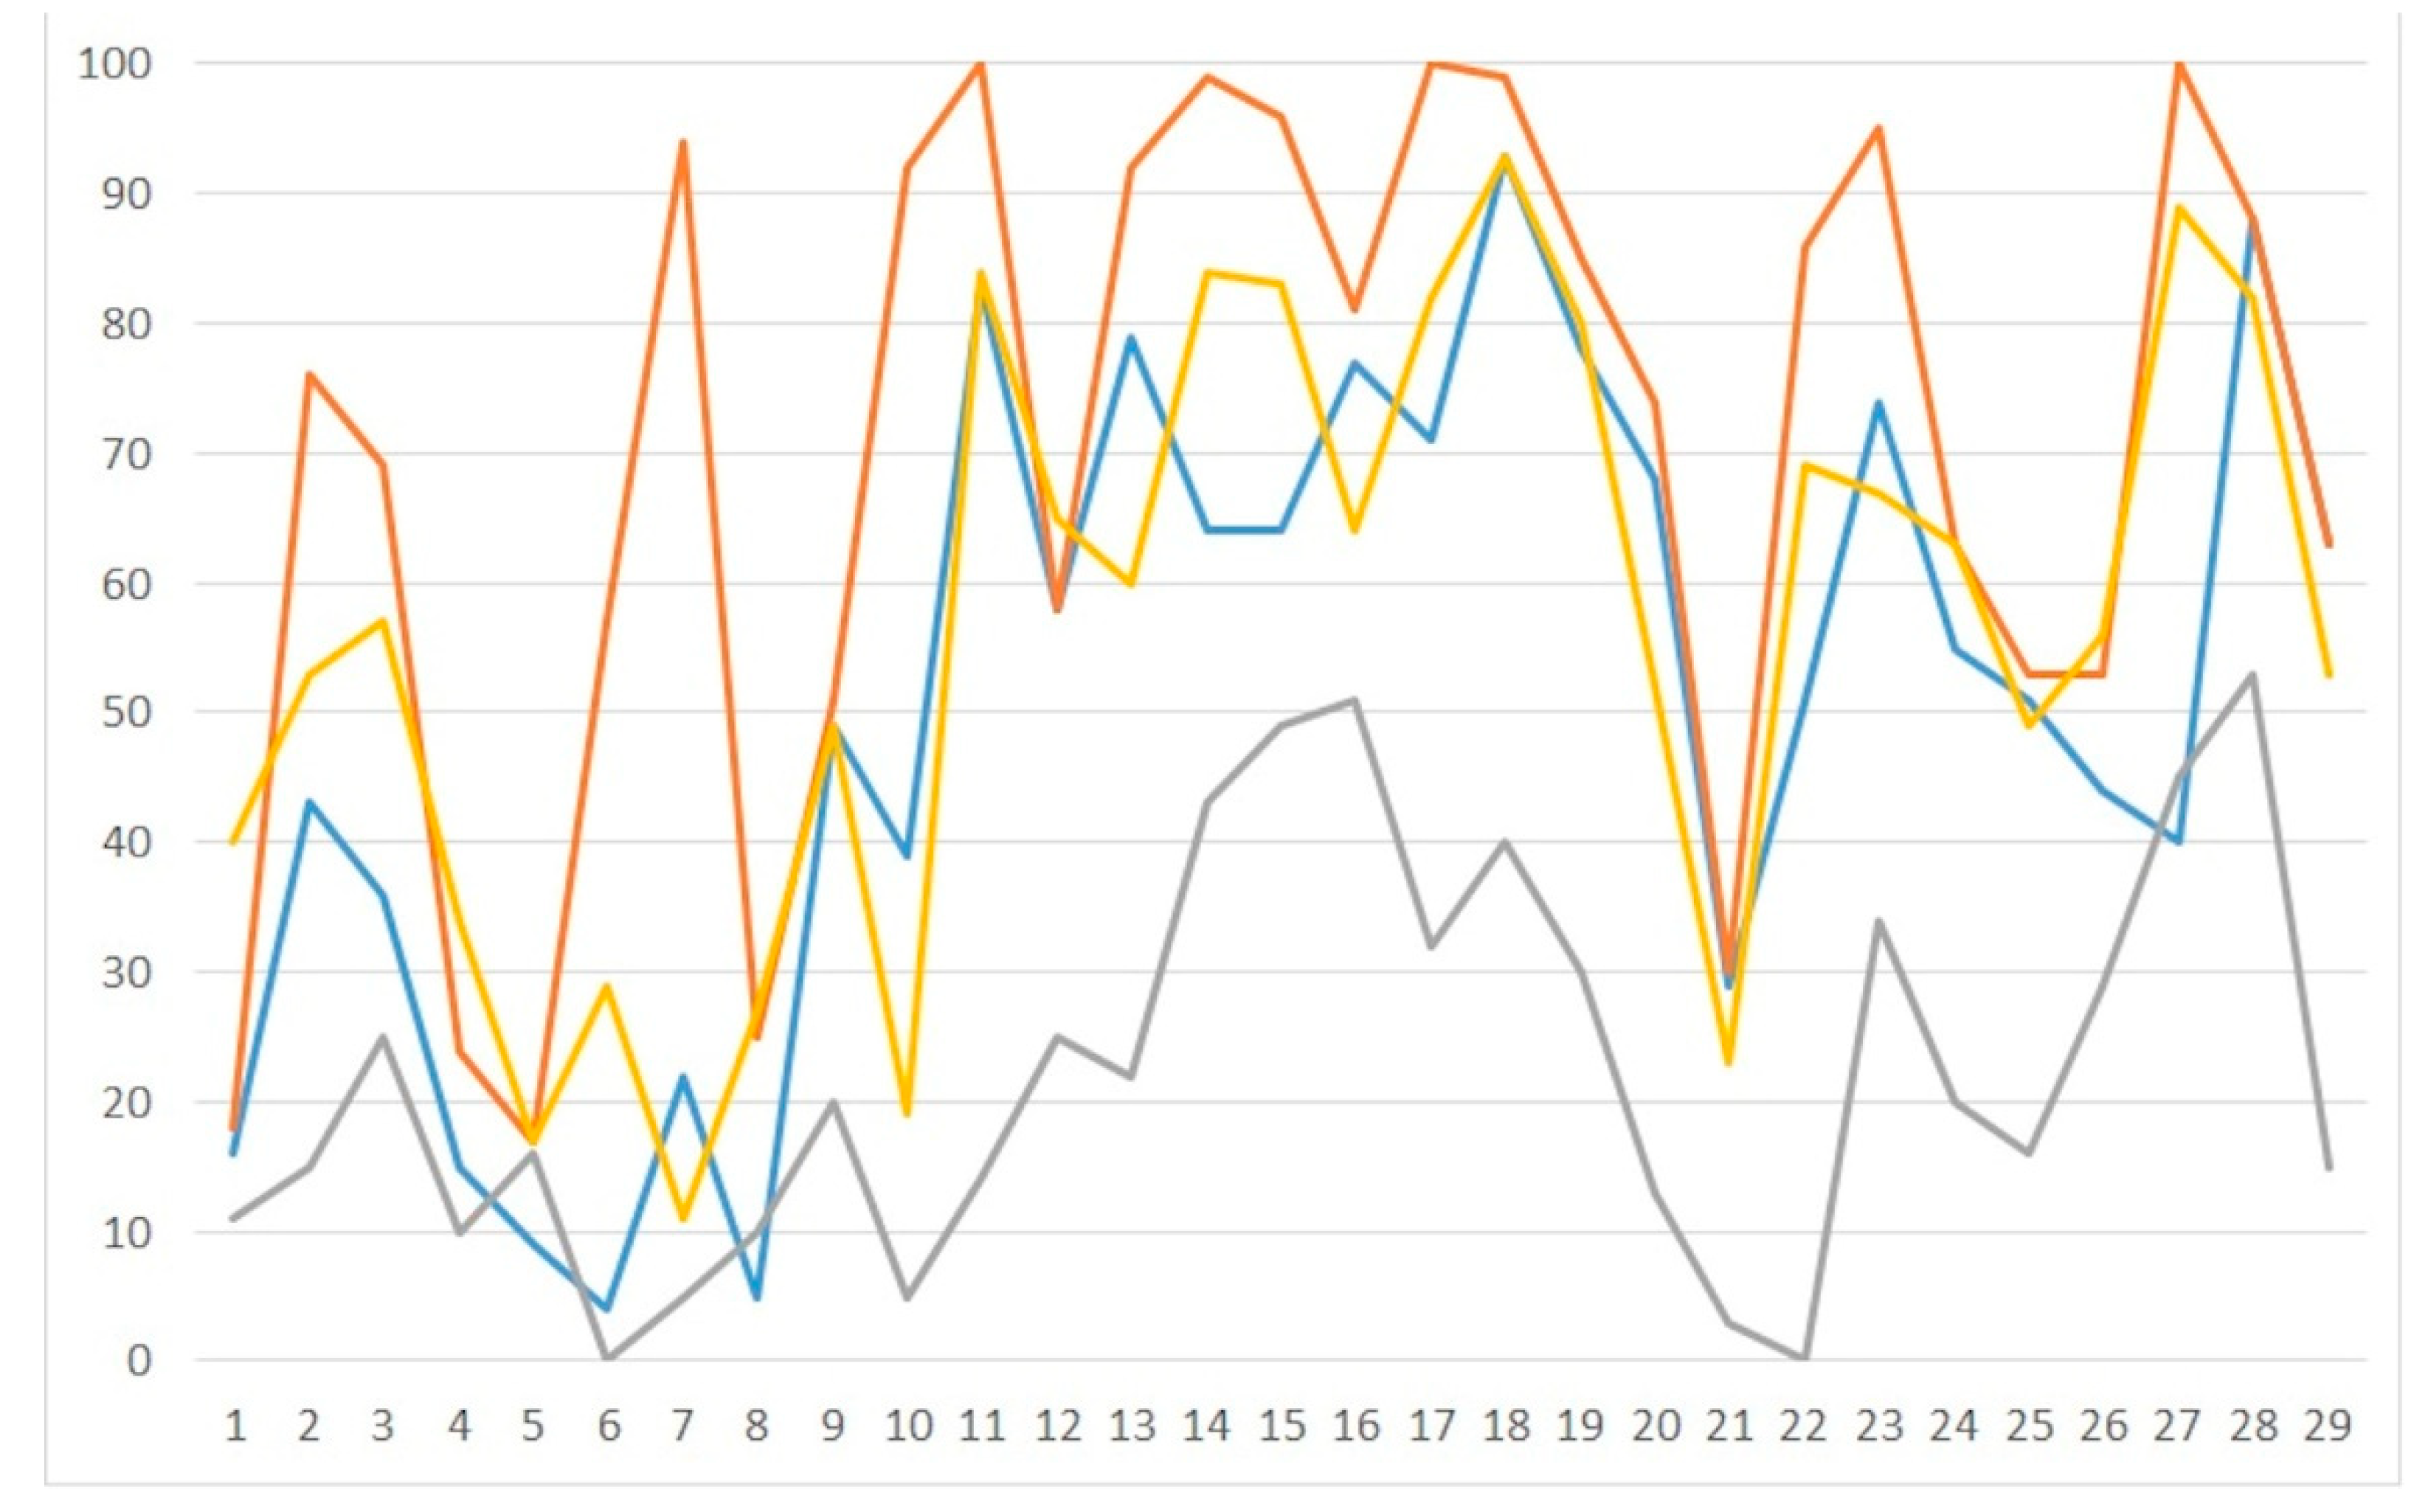
We briefly summarize, in this section, the main CAB algorithms that make the application of NAUTILUS cyclic. The different characteristics of nucleic acids with respect to proteins suggest that CAB algorithms cannot be the same for the two types of structures.
We suppose that REMO09 molecular replacement techniques were applied to the test structures, and then the corresponding phases were refined by SYNERGY. Let ϕr and wr be phases and weights at the end of the above procedure: they constitute the input for NAUTILUS, CAB, ARP/wARP and PHENIX.AUTOBUILD. Furthermore, let ϕb and wb be phases and weights obtained after the first application of NAUTILUS. We divided the CAB procedure into the following steps:
STEP 1: When a ligand contains heavy atoms, the procedure for locating them starts (see Section 2). ϕrh and wrh are phases and weights corresponding to the combination of the nucleic acid model and the heavy atoms; Rrh is the corresponding crystallographic residual and Rfrh the Rfree value. ϕrh and wrh coincide with ϕr and wr when ligand heavy atoms are not found;
STEP 2: ϕrh and wrh are used automatically to start the first NAUTILUS application, which provides a new molecular model of the nucleic acid. The Fourier inversion of the new model leads to a set of calculated structure factors to which the contribution of the ligand heavy atoms is added. Let Rb and Rfb be the corresponding crystallographic residuals, ϕb and wb the corresponding model phases and weights. If Rb is smaller than 0.30, then CAB stops and the model is considered not worthy of further improvement;
STEP 3: The wrh and wb distributions are fitted through histogram matching, to put them on the same statistical basis. Then, the tangent
tan ϕ C = w r h sin ϕ r h + S C   w b sin ϕ b w r h cos ϕ r h + S C   w b cos ϕ b
is calculated, to derive a set of combined ϕc phases. SC is the parameter that defines how ϕrh and ϕb should be combined. If the ϕb phases are supposed to be reliable, then SC is expected to be large; if the user is not confident of their quality, then SC has to be small. At this stage, the quality of the ϕb phases may be estimated through the Rb value. We heuristically decided to linearly relate SC to Rb via Equation (2) (owing to the different quality of the problem, this equation does not coincide with that used for proteins):
SC = 1.975 − 3.25Rb
with the conditions that if Rb < 0.30, then SC = 1, and if Rb > 0.5, then SC = 0.35.
The reason is the following: when Rb is sufficiently small, then the ϕb phases are expected to be reliable and their weights deserve to stay on the same scale of the ϕrh phases. If Rb is large, then the contribution of the ϕb phases to the tangent expression (1) has to be depleted. The weight
w C = 1 2 ( T 2 + B 2 ) 1 2
may be applied to the ϕc phases.
However, if Rb is large, then it is very likely that the weakly weighted ϕc phases are badly estimated. Accordingly, we decided to eliminate in Equation (1) a percentage (PERC) of the ϕb phases (those with lower weights) defined by the following equation:
PERC = 2.4Rfb − 0.84
with the conditions that if Rfb > 0.6, then PERC = 0.60, and if Rfb < 0.35, no reflection is eliminated.
Equation (3) is equivalent to assigning wb = 0 to 60% of the weakest estimates from NAUTILUS when Rfb is equal or larger than 0.6, and to assigning wb = 0 to the 12% of the weakest estimates from NAUTILUS when Rfb = 0.40. ϕc phases and wc weights thus obtained are used as input values for the next NAUTILUS run to produce new ϕb phases and wb weights, which are again combined according to Equation (1) with ϕrh phases and wrh weights in up to six cyclic NAUTILUS runs. The procedure stops if Rb < 0.30;
STEP 4: The cyclic procedure described in STEP 3 is a useful tool that offers a variety of electron density maps to NAUTILUS algorithms, to increase the chance of a good interpretation. The six maps, however, are close to each other: a large variety of maps could make success easier. A total of 12 supplementary cycles are thus introduced in the procedure. The ϕb phases and wb weights obtained at the cycle n are combined via a tangent expression with the ϕc phases and wc weights obtained at the end of the (n − 1)-th tangent cycle. The procedure stops if Rb < 0.30.
At the end of the above procedure, the minimum Rb value is selected (and denoted as RC); the corresponding model is considered the most accurate.
A special case, not very rare in nucleic acid crystallography, occurs when the model and target sequences are identical or differ by one nucleotide. Among the 29 test structures, seven cases (4xqz, 5ihd, 5jua, 5nt5, 5t4w, 2a0p, 5tpg) have identical nucleotides and four cases (3n4o, 1iha, 2fd0, 4enc) differ by one nucleotide. In the latter case, the lengths of the two sequences may be the same or may differ by one nucleotide. If Rrh < 0.35 and Rrh < RC, then SYNERGY and STEP 1 models are preferred to the CAB model (see Section 4).

4. Applications

In a previous paper [26], we selected from the Protein Data Bank (PDB) 38 nucleic acid structures for which phase solution attempts were made via molecular replacement (MR) techniques: we downloaded the observed diffraction data, unit cell dimensions, the space group symmetry, nucleotide sequence, and the structural models. We submitted the test structures to default runs of REMO09; for nine of them, REMO09 did not provide a sufficiently good model (i.e., the average phase error for such structures was larger than 80°). The remaining 29 structures, quoted in Table 1, are used as test cases for our applications: the first 16 of them are DNA, the other 13 are RNA fragments. For each structure, we show their PDB code (PDB), the space group (SG), and the data resolution (RES) in Table 1. The number of nucleotides in the asymmetric unit is reported in the form n·N, where n is the number of chains in the asymmetric unit and N is the number of nucleotides per chain. N is replaced by a sum of two numbers if two chains with a different type or number of nucleotides are present. The model used in the MR step (column model) is reported as p·CODE, where CODE is the PDB code of the molecular fragment and p is the number of fragments originally used in the MR process. The information on the ligands is given in the corresponding column, in the form of m·CODE, where CODE is the PDB code of a ligand and m is the number of ligands in the asymmetric unit of the target structure. The chemical formula for each ligand CODE is also specified at the bottom of Table 1, from which the possible presence of heavy atoms may be deduced.
Model phases obtained by REMO09 and refined by SYNERGY (ϕr and wr, respectively) constitute the input for CAB, ARP/wARP and PHENIX.AUTOBUILD. Because we are interested in procedures for the automatic crystal structure solution, we used default directives for all three AMB programs. The available documentation for these programs suggested the following instructions (adapted to the 3eil test structure, as an example):
for CAB-NAUTILUS
nautilus_pipeline–stdin < 3eil_nautilus.inp, where 3eil_nautilus.inp contains
seqin 3eil.pir
mtzin 3eil_synergy.mtz
colin-fo F, SIGF
colin-phifom PHIC, FOM
colin-free FreeR_flag
pdbin 3eil_po3o5_out.pdb
pdbin-ref nautilus_lib_dna.pdb
pdbout 3eil_nautilus.pdb
cycles 5
for ARP/wARP:
auto_nuce.sh \
datafile 3eil_synergy.mtz \
nucleotides 72 \
fp F sigfp SIGF phib PHIC fom FOM
for PHENIX.AUTOBUILD:
phenix.autobuild write_run_directory_to_file = 3eil_phenix.log \
seq_file = 3eil.pir \
input_data_fil e=3eil_synergy.mtz \
input_labels ="F SIGF PHIC FOM HLA HLB HLC HLD FreeR_flag" \
chain type =DNA \
ncs_copies = 1 \
nproc = 12
We are conscious that the above instructions do not correspond to the optimized ways of applying the mentioned AMB programs. Indeed, any of them may be more effective if suitable instructions are introduced to treat special types of DNA or RNA and/or to explore different building approaches. The directives we used are only simple tools for automatic runs, which, if successful, constitute important achievements by themselves.
In Table 2, we show the experimental results obtained by NAUTILUS and CAB, both obtained by using the new NAUTILUS library and the knowledge of the positions of the triples (O3’, P, O5’), when detected after the SYNERGY step. The results obtained without such tools were poorer and are not shown for brevity. <|Δϕr|>° is the average phase error at the end of SYNERGY, Rr and Rf are the corresponding crystallographic residual (for all of the data) and Rfree value. RN, RfN, RC and RfC are the R and Rf values at the end of NAUTILUS and CAB, respectively. During any AMB process, only the residuals R and Rf are known. They are efficient figures of merit for establishing the overall accuracy of the proposed models, but they are not sufficient for assessing their true quality. We, therefore, used two a posteriori additional figures of merit, MA and MAM, to check the quality of the models provided by NAUTILUS and CAB (denoted as MAN and MAMN for the NAUTILUS case, and MAC and MAMC for CAB).
Table 2 suggests the following conclusions:
(1) MAN and MAC only deal with the quality of the P chains; their usefulness as figures of merit has to be confirmed by MAMN and by MAMC, respectively, which define the overall quality of the structural model. Even if there is a good correlation between MA and MAM for all the tested AMB programs, their indications do not always agree;
(2) The inequality MAN > MAC is rare (only in four cases, 5lj4, 1iha, 2pn4, 3d2v), and in all cases MAMN ≤ MAMC;
(3) For a high percentage of test structures, the quality of the NAUTILUS model is largely improved by CAB (examples are not given for brevity). Frequently, quite poor initial models are transformed by CAB into almost complete models. These cases correspond to poor values of MAN and MAMN, and to large values of MAC and MAMC;
(4) In all test cases, RNRC. That increases the confidence of CAB users in the quality of the built model. In some cases, the final residuals are large because of the unmodeled contribution to the diffraction from ligands that are missing in the model;
(5) Eleven test cases (in bold) represent situations where the model and target sequences are identical or differ by only one residue and where the conditions Rrh < 0.35 and Rrh < RC are satisfied. The program automatically checks the sequence relationships and verifies if the numerical conditions are satisfied. As stated before, in all eleven cases, the program automatically chooses the models at the end of STEP 1 rather than the final CAB models. As an example, in Figure 1, we show the structure 2fd0, for which MAC = 0.95 and MAMC = 0.85. The CAB model is on the left and the published model on the right; the main difference concerns a nucleotide close to a chain terminal.
In Table 3, we quote MAC and MAMC values obtained with and without the application of the algorithm for the sequence control, to allow the reader to understand how these values differ from each other. It is easily seen that MAC and MAMC values without the control are much worse;
(6) CAB (and NAUTILUS, of course) usually fails when | Δ ϕ r | ° is close or larger than 50° (this is the case for 3ce5, 3tok, 4gsg, 4ms5, 5dwx, 3d2v), even if two cases can be found in which it has success (3eil and 3fs0). This error limit is usually exceeded when CAB is applied to proteins.
In Table 4 we show, for all test structures, the values of R, Rf, MA and MAM obtained after the application of ARP/wARP (say RA, RfA, MAA and MAMA, respectively), and the analogous values obtained by the application of PHENIX.AUTOBUILD (say RP, RfP, MAP and MAMP, respectively). Comparing the quartet RA, RfA, MAA and MAMA with the quartet RP, RfP, MAP and MAMP clearly suggests the larger effectiveness of PHENIX.AUTOBUILD: usually RP < RA, RfP < RfA, MAP > MAA and MAMP > MAMA. The cpu time, however, is much larger for PHENIX.AUTOBUILD.
PHENIX.AUTOBUILD and CAB results may be easily compared via their corresponding quartet (R, Rf, MA, MAM). Usually RP > RC, RfP > RfC, MAP < MAC, MAMP < MAMC, but there are also few cases in which PHENIX.AUTOBUILD alone performes better.
Figure 2 and Figure 3 synthetically represent the results quoted in Table 2 and Table 4. Figure 2 shows the MA values corresponding to the default application of NAUTILUS, CAB, ARP/wARP and PHENIX.AUTOBUILD. In this condition, ARP/wARP seems the least efficient program: MAA > MAC only in one case (5dwx) and MAA = MAC also in one case (4gsg). The NAUTILUS and PHENIX.AUTOBUILD lines are closer to the CAB line. For NAUTILUS, MAN > MAC in four cases (5kvj, 5l4o, 5uz6, 6az4) and MAN = MAC in three cases (1iha, 2pn4, 3d2v). For PHENIX.AUTOBUILD, MAP > MAC in only two cases (3ce5, 3tok) and MAP = MAC in four cases (5ju4, 5nt5, 2fd0, 5tgp).
As previously stated, MA values are not in themselves indisputable estimates of the quality of the built models, because they register only the correctness of the P atoms. MAM may be considered a more general figure of merit involving all the non-H atoms. The MAM values obtained by the four tested programs are plotted in Figure 3. A common feature, no matter the algorithm used for AMB, is that usually MA > MAM; the P positions are more easily located than the other atoms.
Even in this case, ARP/wARP seems the least efficient program, while the NAUTILUS and PHENIX.AUTOBUILD lines are closer to the CAB line, but the quality of the CAB models is markedly higher. In most cases, the CAB percentage of non-H atoms at a distance less than 0.6Å from the published positions is greater than 50.
A final observation is mandatory. This paper is mainly concerned with the full automation of the model building tools. However, the role of CAB for nucleic acids in the present scientific panorama may be better appreciated by including it in Table 5, where the most popular automated or semi-automated tools for model building are cited.

5. Discussion

The CAB approach, originally designed for making the BUCCANEER application to proteins cyclic, was modified for use as an AMB tool for nucleic acids. In the new CAB version, we included NAUTILUS; the purpose was to improve the AMB effectiveness without changing NAUTILUS algorithms.
We applied CAB to a set of 29 nucleic acids (DNA and RNA) and compared the models thus obtained with those available after the mere application of NAUTILUS. We also applied ARP/wARP and PHENIX.AUTOBUILD to the same set of test structures. The procedures were fully automatic: a set of default instructions were given as inputs to any AMB program. Obviously, more appropriate input directives may improve the experimental results described in this paper. The results thus obtained show that the CAB cyclic approach remarkably increases NAUTILUS effectiveness and it is quite competitive with ARP/wARP and PHENIX.AUTOBUILD.
The AMB programs tested in this paper clearly show that their efficiency for nucleic acids is much smaller than for proteins. This partly depends on the particular difficulties to overcome for nucleic acids (see Section 1), but also on the smaller efforts spent in this field. This conclusion is supported by the following observation: quite often, SYNERGY ends with <|Δϕr|>° ≤ 40° (16 times out of 29). This situation is usually very favourable for AMB programs when applied to proteins; on the contrary, Table 2 and Table 3 show that MA and MAM values are often far from the expected values. Further efforts are needed for a complete and satisfactory AMB automation. Some of these efforts may be spent on improving the ϕr phases, but most of them should concern the improvement of the AMB algorithms.
CAB for nucleic acids is part of an experimental version of SIR2014. Its full use requires that an experimental version of NAUTILUS, on which it is based, is also available. Hopefully, CAB will be released in late 2020.

Author Contributions

Conceptualization, G.L.C. and C.G.; methodology, C.G.; software, G.L.C.; validation, M.C.B., B.C. and G.P.; writing—review & editing, M.C.B., B.C. and G.P. All authors have read and agreed to the published version of the manuscript.

Funding

This research received no external funding.

Acknowledgments

We thank Kevin Cowtan for his illuminating discussions and for allowing us to use the experimental version of NAUTILUS. We also thank Blaine Mooers for his friendly and precious advice.

Conflicts of Interest

The authors declare no conflicts of interest.

Abbreviations

AMBautomated model building.
MRmolecular replacement.
Rcrystallographic residual between observed and calculated structure factor amplitudes (for all of the experimental data).
Rfcross validation R-value for the free data set [63].
MAratio “number of residues with P atoms within 0.6Å distance from the published positions/number of residues in the asymmetric unit”, according to the published sequence. It is an indication of the accuracy of the model.
MAM ratio“number of non-hydrogen atoms within 0.6Å distance from published positions/number of non-hydrogen atoms in the asymmetric unit”.

References

  1. Cowtan, K.D. The Buccaneer software for automated model building. Tracing protein chains. Acta Cryst. 2006, D62, 1002–1011. [Google Scholar] [CrossRef] [Green Version]
  2. Langer, G.; Cohen, S.X.; Lamzin, V.S.; Perrakis, A. Automated macromolecular model building for X-ray crystallography using ARP/wARP version 7. Nat. Protoc. 2008, 3, 1171–1179. [Google Scholar] [CrossRef] [PubMed]
  3. Terwilliger, T.C.; Grosse-Kunstleve, R.W.; Afonine, P.V.; Moriarty, N.W.; Zwart, P.H.; Hung, L.-W.; Read, R.J.; Adams, P.D. Iterative model building, structure refinement and density modification with the PHENIX AutoBuild wizard. Acta Cryst. 2008, D64, 61–69. [Google Scholar] [CrossRef] [Green Version]
  4. Wang, X.; Kapral, G.; Murray, L.; Richardson, D.; Richardson, J.; Snoeying, J. RNABC: Forward kinematics to reduce all-atom steric clashes in RNA backbone. J. Math. Biol. 2008, 56, 253–278. [Google Scholar] [CrossRef] [Green Version]
  5. Yamashita, K.; Zhou, Y.; Tanaka, I.; Yao, M. New model-fitting and model-completion programs for automated iterative nucleic acid refinement. Acta Cryst. 2013, D69, 1171–1179. [Google Scholar] [CrossRef]
  6. Keating, K.S.; Pyle, A.M. RCrane: Semi-automated RNA model building. Acta Cryst. 2012, D68, 985–995. [Google Scholar] [CrossRef] [Green Version]
  7. Keating, K.S.; Pyle, A.M. Semi-automated model building for RNA crystallography using a directed rotameric approach. Proc. Natl. Acad. Sci. USA 2010, 107, 8177–8182. [Google Scholar] [CrossRef] [Green Version]
  8. Murray, L.J.; Arendall, W.B.; Richardson, D.C.; Richardson, J.S. RNA backbone is rotameric. Proc. Natl. Acad. Sci. USA 2003, 100, 13904–13909. [Google Scholar] [CrossRef] [Green Version]
  9. Hattne, J.; Lamzin, V.S. Pattern-recognition-based detection of planar objects in three-dimensional electron-density maps. Acta Cryst. 2008, D64, 834–842. [Google Scholar] [CrossRef]
  10. Cowtan, K. Automated nucleic acid chain tracing in real time. IUCR J. 2014, 1, 387–392. [Google Scholar] [CrossRef] [Green Version]
  11. Murshudov, G.N.; Vagin, A.A.; Lebedev, A.; Wilson, K.S.; Dodson, E.J. Efficient anisotropic refinement of macromolecular structures using FFT. Acta Cryst. 1999, D55, 247–255. [Google Scholar] [CrossRef]
  12. Afonine, P.V.; Grosse-Kunstleve, R.W.; Echols, N.; Headd, J.J.; Moriarty, N.W.; Mustyakimov, M.; Terwilliger, T.C.; Urzhumtsev, A.; Zwart, P.H.; Adams, P.D. Towards automated crystallographic structure refinement with phenix.refine. Towards automated crystallographic structure refinement with phenix.refine. Acta Cryst. 2012, D68, 352–367. [Google Scholar] [CrossRef] [Green Version]
  13. Burla, M.C.; Carrozzini, B.; Cascarano, G.L.; Giacovazzo, C.; Polidori, G. CAB: A cyclic automatic model building procedure. Acta Cryst. 2018, D74, 1096–1104. [Google Scholar] [CrossRef]
  14. Caliandro, R.; Carrozzini, B.; Cascarano, G.L.; Giacovazzo, C.; Mazzone, A.; Siliqi, D. Molecular replacement: The probabilistic approach of the program REMO09 and its applications. Acta Cryst. 2009, A65, 512–527. [Google Scholar] [CrossRef]
  15. Burla, M.C.; Cascarano, G.L.; Giacovazzo, C.; Polidori, G. Synergy among phase-refinement techniques in macromolecular crystallography. Acta Cryst. 2017, D73, 877–888. [Google Scholar] [CrossRef]
  16. Cowtan, K. Fast Fourier feature recognition. Acta Cryst. 2001, D57, 1435–1444. [Google Scholar] [CrossRef] [Green Version]
  17. Caliandro, R.; Carrozzini, B.; Cascarano, G.L.; De Caro, L.; Giacovazzo, C.; Siliqi, D. Phasing at resolution higher than the experimental resolution. Acta Cryst. 2005, D61, 556–565. [Google Scholar] [CrossRef]
  18. Caliandro, R.; Carrozzini, B.; Cascarano, G.L.; De Caro, L.; Giacovazzo, C.; Siliqi, D. Ab initio phasing at resolution higher than experimental resolution. Acta Cryst. 2005, D61, 1080–1087. [Google Scholar] [CrossRef] [Green Version]
  19. Giacovazzo, C.; Siliqi, D. Improving Direct Methods phases by Heavy-Atom information and Solvent Flattening. Acta Cryst. 1997, D53, 789–798. [Google Scholar] [CrossRef] [Green Version]
  20. Burla, M.C.; Caliandro, R.; Giacovazzo, C.; Polidori, G. The difference electron density: A probabilistic reformulation. Acta Cryst. 2010, A66, 347–361. [Google Scholar] [CrossRef]
  21. Burla, M.C.; Giacovazzo, C.; Polidori, G. From a random to the correct structure: The VLD algorithm. J. Appl. Cryst. 2010, 43, 825–836. [Google Scholar] [CrossRef]
  22. Giacovazzo, C. Solution of the phase problem at non-atomic resolution by the Phantom Derivative method. Acta Cryst. 2015, D71, 483–512. [Google Scholar] [CrossRef] [PubMed]
  23. Giacovazzo, C. From direct-space discrepancy functions to crystallographic least squares. Acta Cryst. 2015, D71, 36–45. [Google Scholar] [CrossRef]
  24. Carrozzini, B.; Cascarano, G.L.; Giacovazzo, C. Phase improvement via the Phantom Derivative technique: Ancils that are related to the target structure. Acta Cryst. 2016, A72, 551–557. [Google Scholar] [CrossRef]
  25. Burla, M.C.; Caliandro, R.; Carrozzini, B.; Cascarano, G.L.; Cuocci, C.; Giacovazzo, C.; Mallamo, M.; Mazzone, A.; Polidori, G. Crystal structure determination and refinement via SIR2014. J. Appl. Cryst. 2015, 48, 306–309. [Google Scholar] [CrossRef]
  26. Burla, M.C.; Carrozzini, B.; Cascarano, G.L.; Giacovazzo, C.; Polidori, G. How far are we from automatic crystal structure solution via molecular-replacement techniques? Acta Cryst. 2020, D76, 9–18. [Google Scholar] [CrossRef]
  27. Campbell, N.H.; Parkinson, G.N.; Reszka, A.P.; Neidle, S. Structural basis of DNA quadruplex recognition by an acridine drug. J. Am. Chem. Soc. 2008, 130, 6722–6724. [Google Scholar] [CrossRef]
  28. Millonig, H.; Pous, J.; Gouyette, C.; Subirana, J.A.; Campos, J.L. The interaction of manganese ions with DNA. J. Inorg. Biochem. 2009, 103, 876–880. [Google Scholar] [CrossRef]
  29. Juan, E.C.M.; Shimizu, S.; Ma, X.; Kurose, T.; Haraguchi, T.; Zhang, F.; Tsunoda, M.; Ohkubo, A.; Sekine, M.; Shibata, T.; et al. Insights into the DNA stabilizing contributions of a bicyclic cytosine analogue: Crystal structures of DNA duplexes containing 7,8-dihydropyrido [2,3-d]pyrimidin-2-one. Nucleic Acids Res. 2010, 38, 6737–6745. [Google Scholar] [CrossRef]
  30. Carter, M.; Ho, P.S. Assaying the energies of biological halogen bonds. Cryst. Growth Des. 2011, 11, 5087–5095. [Google Scholar] [CrossRef]
  31. Carter, M.; Voth, A.R.; Scholfield, M.R.; Rummel, B.; Sowers, L.C.; Ho, P.S. Enthalpy-entropy compensation in biomolecular halogen bonds measured in DNA junctions. Biochemistry 2013, 52, 4891–4903. [Google Scholar] [CrossRef] [PubMed]
  32. Hall, J.P. The Effects of Disubstitution on the Binding of Ruthenium Complexes to DNA. Ph.D. Thesis, University of Reading, Reading, UK, 2014. [Google Scholar]
  33. Rohner, M.; Medina-Molner, A.; Spingler, B. N,N,O and N,O,N meridional cis coordination of two guanines to copper(II) by d(CGCGCG)2. Inorg. Chem. 2016, 55, 6130–6140. [Google Scholar] [CrossRef] [PubMed]
  34. Russo Krauss, I.; Ramaswamy, S.; Neidle, S.; Haider, S.; Parkinson, G.N. Structural insights into the quadruplex-duplex 3′ interface formed from a telomeric repeat: A potential molecular target. J. Am. Chem. Soc. 2016, 138, 1226–1233. [Google Scholar] [CrossRef] [PubMed] [Green Version]
  35. Ahmad Sobri, A.F.; Brady, R.L. Non-natural DNA pair Z (6-amino-5-nitro-2[1H] pyridone heterocycle)-guanosine. 2016; Unpublished work. [Google Scholar]
  36. Sbirkova, H.I.; Schivachev, B.L. Crystal structure of a DNA sequence d(CGTGAATTCACG) at 130K. Bulg. Chem. Commun. 2016, 48, 589–593. [Google Scholar]
  37. Reichenbach, L.F.; Sobri, A.A.; Zaccai, N.R.; Agnew, C.R.J.; Burton, N.; Eperon, L.P.; de Ornellas, S.; Eperon, I.C.; Brady, R.L.; Burley, G.A. Structural basis of the mispairing of an artificially expanded genetic information system. Chemistry 2016, 1, 946–958. [Google Scholar] [CrossRef] [Green Version]
  38. Hardwick, J.S.; Ptchelkine, D.; El-Sagheer, A.H.; Tear, I.; Singleton, D.; Phillips, S.E.V.; Lane, A.N.; Brown, T. 5-Formylcytosine does not change the global structure of DNA. Nat. Struct. Mol. Biol. 2017, 24, 544–552. [Google Scholar] [CrossRef] [Green Version]
  39. Sbirkova, H.I.; Schivachev, B.L. The effect of berenil and cacodylate on the crystal structure of d(CGTGAATTCACG). 2017; Unpublished work. [Google Scholar]
  40. Sbirkova-Dimitrova, H.I.; Shivachev, B.L. Crystal structure of the DNA sequence d(CGTGAATTCACG)2 with DAPI. Acta Cryst. 2017, 73, 500–504. [Google Scholar] [CrossRef]
  41. Cruse, W.; Saludjian, P.; Neuman, A.; Prange, T. Destabilizing effect of a fluorouracil extra base in a hybrid RNA duplex compared with bromo and chloro analogues. Acta Cryst. 2001, D57, 1609–1613. [Google Scholar] [CrossRef]
  42. Gherghe, C.M.; Krahn, J.M.; Weeks, K.M. Crystal structures, reactivity and inferred acylation transition states for 2′-amine substituted RNA. J. Am. Chem. Soc. 2005, 127, 13622–13628. [Google Scholar] [CrossRef]
  43. Haeberli, P.; Berger, I.; Pallan, P.S.; Egli, M. Syntheses of 4′-thioribonucleosides and thermodynamic stability and crystal structure of RNA oligomers with incorporated 4′-thiocytosine. Nucleic Acids Res. 2005, 33, 3965–3975. [Google Scholar] [CrossRef] [Green Version]
  44. Ennifar, E.; Paillart, J.C.; Bodlenner, A.; Walter, P.; Weibel, J.-M.; Aubertin, A.-M.; Pale, P.; Dumas, P.; Marquet, R. Targeting the dimerization initiation site of HIV-1 RNA with aminoglycosides: From crystal to cell. Nucleic Acids Res. 2006, 34, 2328–2339. [Google Scholar] [CrossRef] [Green Version]
  45. Zhao, Q.; Han, Q.; Kissinger, C.R.; Hermann, T.; Thompson, P.A. Structure of hepatitis C virus IRES subdomain IIa. Acta Cryst. 2008, D64, 436–443. [Google Scholar] [CrossRef] [Green Version]
  46. Thore, S.; Frick, C.; Ban, N. Structural basis of thiamine pyrophosphate analogues binding to the eukaryotic riboswitch. J. Am. Chem. Soc. 2008, 130, 8116–8117. [Google Scholar] [CrossRef]
  47. Pitt, J.N.; Ferre-D’Amare, A.R. Structure-guided engineering of the regioselectivity of RNA ligase ribozymes. J. Am. Chem. Soc. 2009, 131, 3532–3540. [Google Scholar] [CrossRef] [Green Version]
  48. Ren, A.; Rajashankar, K.R.; Patel, D.J. Fluoride ion encapsulation by Mg2+ ions and phosphates in a fluoride riboswitch. Nature 2012, 486, 85–89. [Google Scholar] [CrossRef]
  49. Vorobiev, S.M.; Ma, L.-C.; Montelione, G.T. Crystal structure of the 16-mer double stranded RNA. 2016; Unpublished work. [Google Scholar]
  50. Monestier, A.; Aleksandrov, A.; Coureux, P.D.; Panvert, M.; Mechulam, Y.; Schmitt, E. The structure of an E. coli tRNAf(Met) A1-U72 variant shows an unusual conformation of the A1-U72 base pair. RNA 2017, 23, 673–682. [Google Scholar] [CrossRef] [Green Version]
  51. Huang, L.; Wang, J.; Wilson, T.J.; Lilley, D.M.J. Structure of the guanidine III riboswitch. Cell Chem. Biol. 2017, 24, 1407–1415. [Google Scholar] [CrossRef] [Green Version]
  52. Zhang, W.; Huang, Z. DNA 8mer containing two 2SeT modifications. 2016; Unpublished work. [Google Scholar]
  53. Zhang, W.; Tam, C.P.; Zhou, L.; Oh, S.S.; Wang, J.; Szostak, J.W. Structural Rationale for the Enhanced Catalysis of Nonenzymatic RNA Primer Extension by a Downstream Oligonucleotide. J. Am. Chem. Soc. 2018, 140, 2829–2840. [Google Scholar] [CrossRef] [Green Version]
  54. Emsley, P.; Lohkamp, B.; Scott, W.G.; Cowtan, K. Features and development of Coot. Acta Cryst. 2010, D66, 486–501. [Google Scholar] [CrossRef] [Green Version]
  55. Case, D.A.; Cheatham, T.E.I.I.I.; Darden, T.; Gohlke, H.; Luo, R.; Merz KMJr Onufriev, A.; Simmerling, C.; Wang, B.; Woods, R.J. The Amber biomolecular simulation programs. J. Comput. Chem. 2005, 26, 1668–1688. [Google Scholar] [CrossRef] [Green Version]
  56. Chou, F.C.; Sripakdeevong, P.; Dibrov, S.M.; Hermann, T.; Das, R. Correcting pervasive errors in RNA crystallography through enumerative structure prediction. Nat. Methods 2013, 10, 74–76. [Google Scholar] [CrossRef]
  57. Das, R.; Karanicolas, J.; Baker, D. Atomic accuracy in predicting and designing noncanonical RNA structure. Nat. Methods 2010, 7, 291–294. [Google Scholar] [CrossRef]
  58. Cheng, C.Y.; Chou, F.-C.; Das, R. Modeling Complex RNA Tertiary Folds with Rosetta. Methods Enzymol. 2015, 553, 35–64. [Google Scholar] [CrossRef]
  59. Leaver-Fay, A.; Tyka, M.; Lewis, S.M.; Lange, O.F.; Thompson, J.; Jacak, R.; Kaufman, K.W.; Renfrew, P.D.; Smith, C.A.; Sheffler, W.; et al. Rosetta3: An Object-Oriented Software Suite for the Simulation and Design of Macromolecules. Methods Enzymol. 2011, 487, 545–574. [Google Scholar] [CrossRef] [Green Version]
  60. Pavelcik, F.; Schneider, B. Building of RNA and DNA double helices into electron density. Acta Cryst. 2008, D64, 620–626. [Google Scholar] [CrossRef]
  61. Pavelcik, F. Application of constrained real-space refinement of flexible molecular fragments to automatic model building of RNA structures. J. Appl. Cryst. 2012, 45, 309–315. [Google Scholar] [CrossRef]
  62. Lu, X.L.; Olson, W.K. 3DNA: A software package for the analysis, rebuilding and visualization of three-dimensional nucleic acid structures. Nucleic Acids Res. 2003, 31, 5108–5121. [Google Scholar] [CrossRef] [Green Version]
  63. Brünger, A.T. Free R value: A novel statistical quantity for assessing the accuracy of crystal structures. Nature 1992, 355, 472–475. [Google Scholar] [CrossRef]
Figure 1. 2fd0: the CAB model on the left, the published model on the right.
Crystals 10 00280 g001
Figure 2. The MA values for NAUTILUS (blue line), CAB (red line), ARP/wARP (grey line) and PHENIX.AUTOBUILD (yellow line). The numbers on the horizontal axis correspond to the order entries of the test structures in Table 2 and Table 4.
Crystals 10 00280 g002
Figure 3. The MAM values for NAUTILUS (blue line), CAB (red line), ARP/wARP (grey line) and PHENIX.AUTOBUILD (yellow line). The numbers on the horizontal axis correspond to the order enstries of the test structures in Table 2 and Table 4.
Crystals 10 00280 g003
Table 1. For the 29 nucleic acid test structures, the following abbreviations are used: Protein Data Bank (PDB) for the structure code, space group (SG) and the diffraction data resolution (RES) (Å). The number of nucleotides in the asymmetric unit (nN) is reported by the symbol n·N, where n is the number of chains per asymmetric unit, N is the number of nucleotides per chain. N is replaced by a sum of two numbers if chains with different type or different number of nucleotides are present. The model used in the MR step (column model) is reported as p·CODE, where CODE is the PDB code of the molecular fragment and p is the number of fragments originally used in the MR process. The information on the ligands is given in the corresponding column, in the form of m·CODE, where CODE is the PDB code of a ligand, and m is the number of ligands in the asymmetric unit of the target structure. The chemical formula for each ligand CODE is also specified at the bottom of the Table, from which the presence of heavy atoms may be deduced.
PDBSGRESnNModelLigand(s)
3ce5 [27]I 42.502·121k8p2·K + BRA
3eil [28]P 322.606·123·463d7·Mn
3n4o [29]P 21 21 212.902·121dnh2·B7C + HT
3tok [30]C 21.7410 + 102orgNa
4gsg [31]C 22.002·(10 + 10)2·2orgUCL
4ms5 [32]P 43 21 22.231·103qrnBa + RKF
4xqz [33]P 212.158·62·5ihd6·Cu + 4·Ca + 7·Cl + MES + MOH
5dwx [34]P 4 21 22.7124 + 81kf1K
5i4s [35]R 32.462·12476d8·Ca + 2·1W5
5ihd [33]P 211.574·62·2dcg4·Cu + 2·Ca + 2·2OP + SIN
5ju4 [36]P 21 21 212.002·121d29Mg + Cl
5lj4 [37]R 32.172·12463d4·Ca + 2·1W5 + 2·1WA
5mvt [38]P 31 2 11.892·125mvl3·Co
5nt5 [39]P 21 21 212.302·121d29Na + CAC
5t4w [40]P 21 21 212.302·125juaDAP
1iha [41]C 21.602·9165d2·Cl + 2·BRU + 2·RHD
1z7f [42]P 31 2 12.103·161yrm2·Sr
2a0p [43]R 3 21.952·8259dS4C
2fd0 [44]C 2 2 211.802·232fcyK + Cl + 5BU + LIV
2pn4 [45]P 21 21 212.322·(24 + 20)2·2pn310·Sr + 4·5BU
3d2v [46]P 21 21 22.002·772cky10·Mg + 2·PYI
3fs0 [47]P 312.3010 + 11½·3ftm3·Mg
4enc [48]P 21 21 22.27524enb5·Mg + K + F
5kvj [49]R 32.2616 + 162·3nd3ARG
5l4o [50]P 32 1 22.80773cw5Na + PSU + OMC + 4SU + 5MU + H2U
5nz6 [51]P 32 1 22.9441½·5nwq2·CBV + GAI
5tgp [52]P 611.602·82·1dns4·US3
5uz6 [53]C 22.103·(25 + 8)3·5ux38OS + LCC
6az4 [53]P 41 21 22.9832 + 94fnjGP3
Ligand Information
CodeFormulaCodeFormulaCodeFormula
1W5C10 H14 N3 O9 PBRUC9 H12 Br N2 O8 PMESC6 H13 N O4 S
1WAC10 H16 N5 O7 PCACC2 H6 As O2MOHC H4 O
2OPC3 H6 O3CBVC9 H13 Br N3 O8 POMCC10 H16 N3 O8 P
4SUC9 H13 N2 O8 P SDAPC16 H15 N5PSUC9 H13 N2 O9 P
5BUC9 H12 Br N2 O9 PGAIC H5 N3PYIC14 H21 N4 O7 P2
5MUC10 H15 N2 O9 PGP3C20 H27 N10 O18 P3RHDRh3 H18 N6
8OSC14 H18 N7 O7 PH2UC9 H15 N2 O9 PRKFC38 H20 F2 N13 Ru
ARGC6 H15 N4 O2HTC25 H24 N6 OS4CC9 H14 N3 O7 P S
B7CC12 H16 N3 O7 PLCCC11 H16 N3 O8 PSINC4 H6 O4
BRAC35 H43 N7 O2LIVC29 H55 N5 O18UCLC9 H12 Cl N2 O8 P
US3C10 H15 N2 O7 P Se
Table 2. NAUTILUS and cyclic automated model building (CAB) results. For the 29 test structures, PDB is their PDB code, <|Δϕr|>° is the average phase error at the end of SYNERGY, Rr and Rf are the crystallographic residuals (for all of the data) and the Rfree value. The corresponding ϕr phases are the input for NAUTILUS and CAB. RN, RfN, MAN and MAMN are the R, Rf, MA and MAM values obtained after the application of NAUTILUS; RC, RfC, MAC and MAMC are the corresponding values obtained at the end of CAB. R and MA values are percentages.
PDB<|Δϕr|>°RrRfRNRfNMANMAMNRCRfCMACMAMC
3ce55041435459361652534118
3eil4631364750594336388276
3n4o3323264445553623269169
3tok4935355758441552567224
4gsg533438454517942464417
4ms559466456570437417857
4xqz4832355858302227308094
5dwx584144575818548593225
5i4s3525293637594935348251
5ihd39343651525039252910092
5ju4262628373795832628100100
5lj42925294448865841458258
5mvt2829283837827931319592
5nt524272846478664272810099
5t4w25252943428664252910096
1iha4134353637947723258881
1z7f343234424369713030100100
2a0p312735323910093273510099
2fd03332363738897832369585
2pn44034404148876836418674
3d2v5747514951342949503230
3fs06342474041685129338986
4enc2825283639837425289895
5kvj4931393746945532419463
5l4o4031363539745134397453
5nz64523233943754431329053
5tgp262829515143402727100100
5uz63434363033998830339988
6az45136402830876328308763
Table 3. MAC and MAMC for the eleven structures for which model and target sequences are equal or differ in one position, and for which the conditions Rrh < 0.35 and Rrh < RC are satisfied. WITH and WITHOUT indicate if the control on the sequences has been applied or not. MA values are percentages.
WithWithout
PDBMACMAMCMACMAMC
3n4o91697738
4xqz80944330
5ihd100927047
5ju41001009583
5nt51009910087
5t4w100969164
1iha88818177
2a0p1009910099
2fd095859581
4enc98958378
5tgp10010010075
Table 4. ARP/wARP and PHENIX.AUTOBUILD experimental results for the 29 test structures. PDB is their PDB code; | Δ ϕ r | ° is the average phase error available at the end of the SYNERGY refinement process. The corresponding ϕr phases are the input for ARP/wARP and PHENIX.AUTOBUILD. RA, RfA, MAA and MAMA are the R, Rf, MA and MAM values obtained at the end of the automatic runs of ARP/wARP; RP, RfP, MAP and MAMP are the corresponding values obtained at the end of the automatic runs of PHENIX.AUTOBUILD. R and MA values are percentages.
ARP/wARPPHENIX.AUTOBUILD
PDB<|Δϕr|>°RARfAMAAMAMARPRfPMAPMAMP
3ce5505356231145475040
3eil464856261543477353
3n4o333352642533378257
3tok495253281045479434
4gsg533743441638383917
4ms559000048534429
4xqz48535413557601011
5dwx584047361049532727
5i4s353444502036395049
5ihd39515110552562519
5ju42649585914353310084
5lj4294152552540416865
5mvt284551502246449160
5nt52435489143353810084
5t4w253145914931339583
1iha414141755136338164
1z7f344046693235369182
2a0p313953864031379393
2fd0334552733037369580
2pn4404755321342485752
3d2v5756576347482623
3fs063000029347469
4enc283346793440417167
5kvj493955592035408463
5l4o404453461645505449
5nz6453438532935377856
5tgp2645518645343310089
5uz6343440915333339182
6az4514246381539406753
Table 5. Most popular automated or semi-automated tools for model building of nucleic acids. SUB1: automated model building into electron density map from sequence; SUB2: guided semi-automated model building into electron density maps; SUB3: completing and rebuilding existing models into electron density maps; SUB4: building models from sequences without electron density.
SUB1SUB2SUB3SUB4
NAUTILUS [10]RCRANE [6] in COOT [54]NAFIT, NABUILD in LAFIRE [5]AMBER [55]
ARP/wARP [9]ERRASER [56]FARFAR [57,58]
PHENIX.AUTOB [3]ROSETTA [59]
NUT/DHL/RSR [60,61]3DNA [62]
CAB

