Abstract
The (4′→6′)-linked DNA homolog 2′,3′-dideoxy-β-D-glucopyranosyl nucleic acid (dideoxy-glucose nucleic acid or homo-DNA) exhibits stable self-pairing of the Watson–Crick and reverse-Hoogsteen types, but does not cross-pair with DNA. Molecular modeling and NMR solution studies of homo-DNA duplexes pointed to a conformation that was nearly devoid of a twist and a stacking distance in excess of 4.5 Å. By contrast, the crystal structure of the homo-DNA octamer dd(CGAATTCG) revealed a right-handed duplex with average values for helical twist and rise of ca. 15° and 3.8 Å, respectively. Other key features of the structure were strongly inclined base-pair and backbone axes in the duplex with concomitant base-pair slide and cross-strand stacking, and the formation of a dimer across a crystallographic dyad with inter-duplex base swapping. To investigate the conformational flexibility of the homo-DNA duplex and a potential influence of lattice interactions on its geometry, we used molecular dynamics (MD) simulations of the crystallographically observed dimer of duplexes and an isolated duplex in the solution state. The dimer of duplexes showed limited conformational flexibility, and key parameters such as helical rise, twist, and base-pair slide exhibited only minor fluctuations. The single duplex was clearly more flexible by comparison and underwent partial unwinding, albeit without significant lengthening. Thus, base stacking was preserved in the isolated duplex and two adenosines extruded from the stack in the dimer of duplexes were reinserted into the duplex and pair with Ts in a Hoogsteen mode. Our results confirmed that efficient stacking in homo-DNA seen in the crystal structure of a dimer of duplexes was maintained in the separate duplex. Therefore, lattice interactions did not account for the different geometries of the homo-DNA duplex in the crystal and earlier models that resembled inclined ladders with large base-pair separations that precluded efficient stacking.
1. Introduction
Numerous carbohydrate moieties in place of the natural 2′-deoxyribose and ribose sugars within the framework of a phosphodiester backbone have been analyzed in terms of their potential to self-pair and/or cross-pair with DNA and RNA as part of systematic explorations of a chemical etiology of nucleic acid structure [1,2,3,4,5,6,7]. These investigations have demonstrated that Nature’s choice of the genetic system is not based on the criterion of maximal base-pairing strength and that Watson–Crick pairing is quite widespread among artificial nucleic acids and therefore not unique to DNA and RNA [2]. Further, multiple systems are capable of cross-pairing with DNA and RNA in addition to exhibiting stable self-pairing. Studies of oligo(2′,3′-dideoxy-β-D-glucopyranosyl)nucleotides (homo-DNA, Figure 1) marked the beginning of this research and were motivated by the question “why pentose and not hexose?” (in the backbone of DNA) [8,9]. Homo-DNA oligonucleotides were found to form duplexes with Watson–Crick base pairing that were of higher stability than those by the corresponding DNAs [10,11]. Perhaps not surprisingly, given the higher rigidity of the hexose sugar compared with 2′-deoxyribose, homo-DNA’s increased pairing stability is mainly due to the entropic contribution. However, homo-DNA constitutes an autonomous pairing system (i.e., it is unable to pair with DNA) and the familiar pairing priority (G:C > A:T) is altered in homo-DNA (G-C > A-A ≈ G-G > A-T) [11]. Therefore, it appears that the relative stability of pairing is not just an intrinsic property of the four nucleobases, but that it is intimately related to the nature of the sugar moiety in the backbone. In the case of homo-DNA, it was established that purine–purine pairs are of the reverse-Hoogsteen type with antiparallel orientation of strands [11,12].
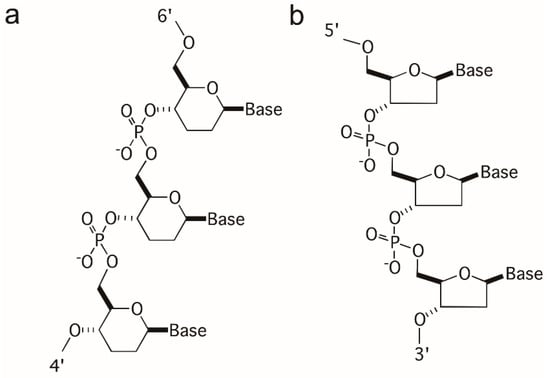
Figure 1.
Structures, configurations, and linkage modes of (a) homo-DNA (β-D-2′,3′-dideoxyglucopyranose sugars) and (b) DNA. Strand polarities are indicated by numbers and the backbone conformation for both can be described with six torsion angles α to ζ.
The crystal structure of the homo-DNA duplex [dd(CGAATTCG)]2 revealed a right-handed arrangement of the two strands, with irregular values for twist (winding; average 15°) and rise (stacking; average 3.8 Å) at individual base-pair steps [13] (Figure 2a). For example, the twist between T5 and T6 (nucleotides are numbered 1 to 8 in strand 1, and 9 to 16 in strand 2) amounts to 32°, whereas the twists between C1 and G2 and A4 and T5 are 1° and 10°, respectively. Similarly, the values for rise vary between 3.0 Å and 5.1 Å at the T13pT14 and C9pG10 steps, respectively. The conformation at the central A4pT5 step is particularly noteworthy in that base pairs there are stacked with an ideal spacing of 3.4 Å. Overall, the conformation of the homo-DNA duplex in the crystal differed dramatically from the quasi-linear ladder models for homo-DNA proposed on the basis of a qualitative conformational analysis that assumed ideal synclinal or antiperiplanar backbone torsion angles [14], molecular mechanics [14], and molecular dynamics simulations [15], or was determined by solution NMR [16] (Figure 2b). All these duplex models seemed to lack effective stacking, but like the [dd(CGAATTCG)]2 duplex in the crystal, they displayed strongly inclined base-pair and backbone axes (average +44° in the crystallographic model) and sliding between adjacent base pairs (average +4.4 Å in the crystallographic model) [17]. The latter parameter indicates that stacking in homo-DNA occurs mainly between bases from opposite strands. Adjacent bases from the same strand form virtually no stacking interaction in homo-DNA. Both backbone-base inclination and inter-strand stacking constitute fundamental differences between homo-DNA and DNA. The B-form DNA duplex displays a nearly perpendicular orientation between the helical axis and individual base-pairs and is essentially stabilized by stacking between adjacent bases from the same strand (Figure 2c).
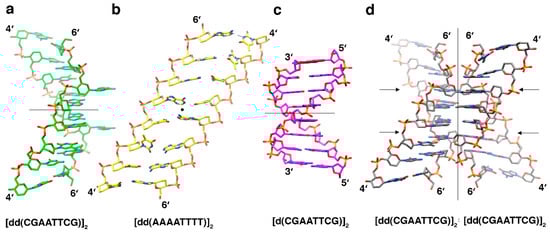
Figure 2.
Three-dimensional structures of homo-DNA and DNA. (a) Crystal structure of the homo-DNA duplex [dd(CGAATTCG)]2 viewed across the minor (left) and major (convex surface) grooves [13]. (b) NMR structure of the homo-DNA duplex [dd(AAAAATTTTT)]2 (terminal base pairs are omitted) [16], viewed approximately along the molecular dyad (indicated with a filled circle). (c) Model of the DNA duplex [d(CGAATTCG)]2 with a standard B-form geometry, viewed across the minor (left) and major grooves. (d) The homo-DNA tetraplex (dimer of [dd(CGAATTCG)]2 duplexes) formed around a crystallographic dyad in space group P6122 and featured swapping of nucleobases and reverse-Hoogsteen A:T pairs at two sites (arrows). Molecular (panels (a) and (c)) or crystallographic dyads (panel (d)) are indicated by thin solid lines, and carbon, nitrogen, oxygen, and phosphorus atoms are colored green (panel (a); yellow in (b), magenta in (c), and gray in (d)), blue, red, and orange, respectively.
Contrary to what one might have expected, given the bulkier nature of the 2′,3′-dideoxyhexopyranose compared to 2′-deoxyribose and the quasi-linear models lacking effective stacking proposed prior to the determination of the crystal structure, the average intra-strand phosphate-phosphate distance of the homo-DNA octamer duplex in the crystal structure is surprisingly short (5.8 Å on average) and below that in standard B-DNA (ca. 6.5 Å). Thus, the homo-DNA duplex turned out to be significantly more compact than any of the previously assumed models. Homo-DNA features a convex surface in place of a major groove (Figure 2), where hydrogen bond acceptors and donors from nucleobases are readily displayed for potential intermolecular interactions. In the crystal, homo-DNA duplexes dimerize around a crystallographic dyad (Figure 2d). The two duplexes cross at an angle of around 60° and looped-out adenines (A3 and A11) insert themselves into the opposite duplex under formation of reverse-Hoogsteen pairs with thymines. The dimer of dimers feature base tetrads in the four central layers; besides the above reverse-Hoogsteen A:T pairs as a result of inter-duplex base swapping, two further reverse-Hoogsteen A:A pairs (the adenines themselves are engaged in standard intra-duplex A:T pairs) stabilize the motif. Additional stability is provided by inter-strand phosphate…H-C8(G) contacts that flank the inner base tetrads [13] (Figure 3a). The lattice contacts in the homo-DNA crystal also stabilize a left-handed super-duplex around a right-handed crystallographic sixfold rotation axis [18].
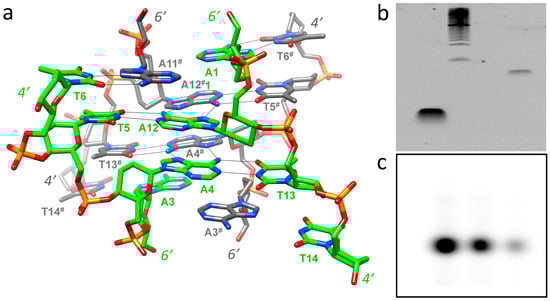
Figure 3.
Probing the potential formation of the homo-DNA tetraplex outside the crystal. (a) Inter-duplex hydrogen bonding interactions that stabilize the homo-DNA dimer of dimers in the crystal structure of the octamer dd(CGAATTCG). Carbon atoms of one duplex are colored in green, those in the other are colored in gray, and hydrogen bonds are thin solid lines. (b) Native PAGE for d(CGAATTCG) (left lane) and dd(CGAATTCG) (right lane) using ethidum bromide as the staining agent (the marker lane is in the middle). (c) Native PAGE for dd(CGAATTCG) using radioactively labeled oligonucleotide. The three lanes represent different concentrations (2, 1, and 0.5 pm; from left to right).
Despite the above interactions that contribute to a seemingly very stable dimer of homo-DNA duplexes in the crystal, it is unclear whether duplexes can also associate in the absence of the confines of the crystal lattice. To investigate a potential effect of the crystal lattice on the conformation of the homo-DNA octamer duplex [dd(CGAATTCG)]2, we probed formation of the complex in solution using native polyacrylamide gel electrophoresis (PAGE), its ability to bind a fluorescent DNA-intercalating dye, and we conducted molecular dynamics simulations of the dimer of duplexes in solution, as well as molecular dynamics of a single isolated duplex in solution.
2. Results and Discussion
2.1. Assays to Probe Dimer Formation Outside the Crystal
Two methods were used to probe potential dimerization of homo-DNA outside the crystal environment. Native PAGE did not show evidence of dimerization (Figure 3b,c). Similarly, dynamic light scattering did not show evidence of dimerization in solution (data not shown).
2.2. Intercalation into DNA and Homo-DNA Duplexes
The differences between the crystal structures of the homo-DNA dimer of duplexes and a canonical B-form DNA duplex raised the question of whether compounds, which are able to intercalate into DNA, would intercalate into homo-DNA in a similar fashion, differently, or not at all. This was tested by using thiazole orange, a dye that fluoresces upon binding to and intercalating into DNA. The fluorescent signal observed upon DNA binding was not seen when used with homo-DNA (Figure 4).
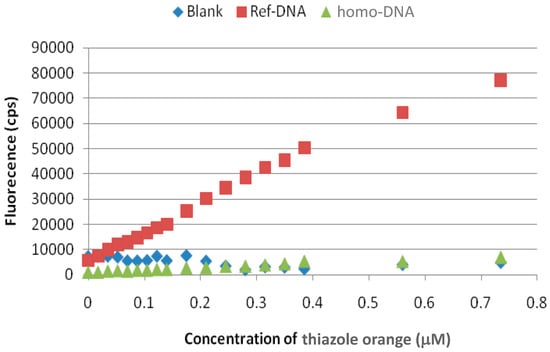
Figure 4.
Fluorescence intercalation assay. The thiazole orange dye exhibited dose-dependent fluorescence upon addition to DNA [d(CGAATTCG)]2 (red squares), but not homo-DNA [dd(CGAATTCG)]2 (green triangles), consistent with intercalation only into the former duplex type.
2.3. The Dimer of Homo-DNA Duplexes and the Separate Duplex Behave Differently in Molecular Dynamics (MD) Simulations
A 100 ns molecular dynamics simulation was performed on the homo-DNA duplex [dd(CGAATTCG)]2 to explore the difference between the conformational preference of the molecule in solution versus in the crystal. Simulations were run independently for the full tetrameric complex observed in the crystal structure, which contained a base-swapped “dimer of duplexes” (described in detail above), and for a single duplex extracted from the dimer. Both simulations included explicit water molecules and ions for solvation.
During the initial 10 ns of the simulations, the dimer of duplexes and the isolated duplex both relaxed from the crystal conformation. This subtle relaxation is a common feature of MD simulations that begin from a crystal structure, and is taken to arise from (i) differences between the crystallization conditions and the simulated solution conditions (although crystalline systems can be simulated with high precision as well [19,20]), and (ii) limitations of the classical molecular mechanics force field employed to model behavior that ultimately arises from quantum effects. These limitations do not preclude extracting highly precise structural and thermodynamic data from the simulations [21].
The conformation of the dimer of duplexes remained stable in solution MD (Figure 5a,b). The root mean square deviation (RMSD) of the dynamic model, relative to the crystal structure, maintained a value of ca. 2 Å. This suggests that the base-swapped dimeric conformation observed in the crystal was not solely due to a crystal packing artifact, but rather represented a stable local energy minimum in solution as well. In contrast, the isolated duplex diverged to an RMSD value between 5 and 6 Å relative to the conformation seen in the crystal (Figure 5a,c), suggesting that the energetic minimum for a single duplex of homo-DNA was distinct from the conformation observed in the crystal. The difference between the behavior of the single duplex and the dimer of duplexes can be appreciated by viewing the movies in the Supporting Information, available in the online version of this article.
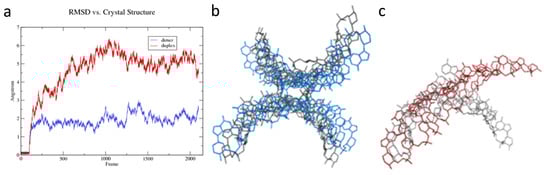
Figure 5.
An individual homo-DNA duplex unwound during MD simulation, whereas the dimer of duplexes that was found in the crystal did not. (a) The dimer of duplexes remained stable during the simulation after initial relaxation, staying within ~2 Å root mean square deviation (RMSD) of the crystal structure (blue curve). A single duplex removed from the dimeric context, in contrast, diverged from the original conformation by >5 Å RMSD (red curve). (b) The structure of the dimer of duplexes, viewed looking down the dyad axis. Shown in gray is the crystal structure, and in blue, the conformation after simulation in solution. (c) As in (b), but showing the increased unwinding of the isolated duplex during the simulation (in red).
The unwinding observed in the single duplex manifested in several structural parameters that changed over the course of the simulation, including rotational parameters such as twist and tilt, translational parameters such as rise and slide, and the dihedral angles of the phosphate backbone. For example, in the dimer of duplexes, the helical twist, averaged over all eight steps of each duplex, decreased slightly from 14.3° per base-pair in the crystal to 14.0° in the simulation, thus remaining relatively constant after the initial 10 ns relaxation. The single duplex, in contrast, unwound dramatically during the simulation, rapidly adopting a ‘skewed ladder’ conformation, with a greatly reduced twist of 6.6° per base-pair (Figure 5c). This reduction in twist was accompanied by an increase in the total length of the molecule (Figure 6a). The dimer of duplexes extended by 6%, whereas the isolated duplex extends by 20%. The change in length was based on measurements of distances between terminal phosphate groups in wound (dimer duplex) and unwound strands (isolated duplex). However, the increased length appeared not to alter the stacking distances between individual base pairs in a significant way, as illustrated by the side-by-side comparison of a duplex from the dimer and the isolated duplex (Figure 6b,c).
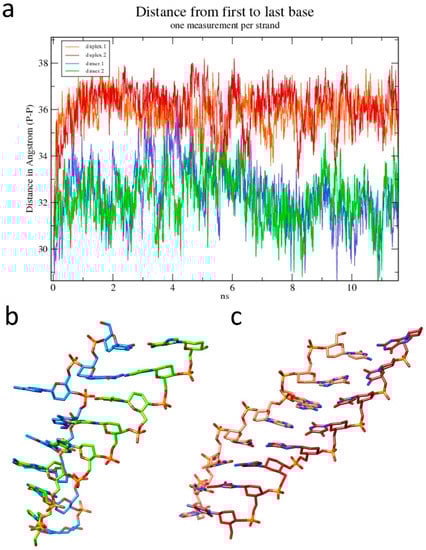
Figure 6.
Changes in the length of the homo-DNA octamer during simulation. (a) Plot of the fluctuating intra-strand distances between the first and last phosphate groups. Distances for the duplex from the dimer are shown in blue/green and those for the isolated duplex are in orange/red. Only the initial 12 ns of the simulation are shown here. Snapshots of (b) one of the duplexes from the dimer and (c) the isolated duplex with colors of carbon atoms matching those in the plot in panel (a).
2.4. The Single Duplex is More Flexible than the Duplex in the Dimer
The large slide between neighboring base pairs was a striking feature of the homo-DNA duplex in the crystal structure [13]. The average value for the slide parameter amounted to 4.4 Å and the largest slide was observed at the G2pA3 step (8.3 Å). This displacement of adjacent base pairs along their long axes was a consequence of the pronounced positive base-backbone inclination in homo-DNA and produced cross-strand stacking (overlaps between bases from opposite strands) [13,17]. Comparison between the MD evolutions of various inter-base and inter-base pair parameters in the dimer of duplexes and the single duplex showed that the latter retains large slides and concomitant cross-strand stacking (Figure 7). Interestingly, the fluctuations seen with the average slide between base pairs in the single duplex were significantly enhanced compared to those in the dimer of duplexes. The distinct magnitudes of base pair sliding in the MD simulations along with similar differences in other base pair parameters attest to the inherently greater flexibility of the isolated homo-DNA duplex relative to the duplex in the dimer.
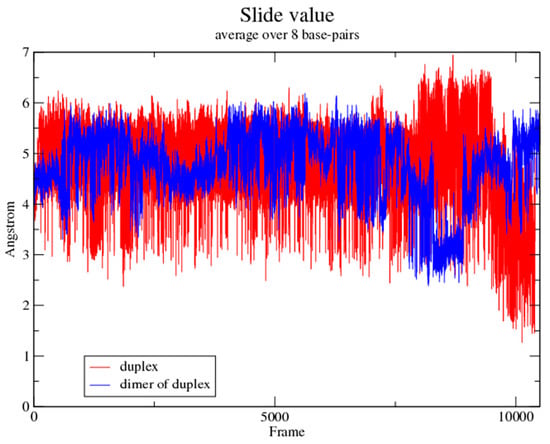
Figure 7.
The slide parameter displays increased variation in the isolated duplex compared to the dimer of duplexes.
2.5. Bases Involved in Inter-Duplex Swap Re-Insert
In the homo-DNA crystal structure, adenosines were extruded from the duplex at two sites and adenine bases from the paired duplex were inserted opposite orphaned thymines in a reverse-Hoogsteen fashion (Figure 2d and Figure 3a). This base swapping and the local formation of base tetrads remained intact in the MD simulation of the dimer of duplexes. However, during the MD simulation of the single duplex, flipped-out adenines inserted back into the duplex and thus re-established base-pairing opposite Ts, albeit in a Hoogsteen mode (Figure 8).
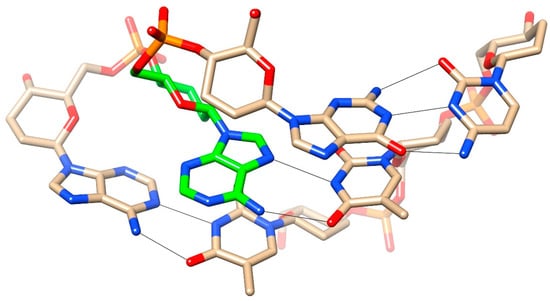
Figure 8.
An adenosine that adopted an extrahelical orientation in the homo-DNA crystal structure re-inserted into the stack (highlighted with green carbon atoms) during the molecular dynamics (MD) simulation of the isolated duplex and then formed a Hoogsteen pair with the T from the opposite strand. Note the orientation of the hexose sugar of the re-paired A that was roughly perpendicular relative to sugars of neighboring intra-strand residues.
2.6. Backbone Torsion Angles Fluctuate Differently
Monitoring the backbone torsion angles during various time ranges over the course of the MD simulations uncovered subtle differences between the dimer of duplexes and the isolated duplex (Figure 9). Torsion angles α for the most part remained in the sc- region, but strayed into the ac and ap ranges, and, in the case of a nucleotide in the separate duplex, occupied the sc+ region. Initial modeling studies with regard to the backbone conformation of homo-DNA had envisioned an α ap/γ ap backbone variant, a combination of angles that is frequently seen in A-form DNA [22] and RNA duplexes [23]. The flip from the standard sc-/sc+ (α/γ) to the ap/ap combination was achieved by a crankshaft motion around β and resulted in an extended backbone with a longer inter-phosphate distance compared to a canonical duplex. However, ap range visits by α were rather transient in both the dimer of homo-DNA duplexes and the isolated duplex. In the crystal structure of the former, only three residues displayed values for α that lay outside the sc- range: C7 (163°) and C15 (133°) (both were situated adjacent to Ts that paired in a reverse Hoogsteen fashion with As from a second duplex) and G16 (−131°), a terminal residue [13]. Torsion angles β were mostly limited to the ap range in the dimer of duplexes (C15 in the crystal structure has a β angle of −92°), but at least three residues of the isolated duplex spent considerable amounts of time in the sc+ region. The γ backbone angles of four residues in the homo-DNA crystal structure fell into the ap range, and the partitioning of γ angles between the sc- and ap ranges in the simulations of both the dimer and isolated duplexes was consistent with this trend.
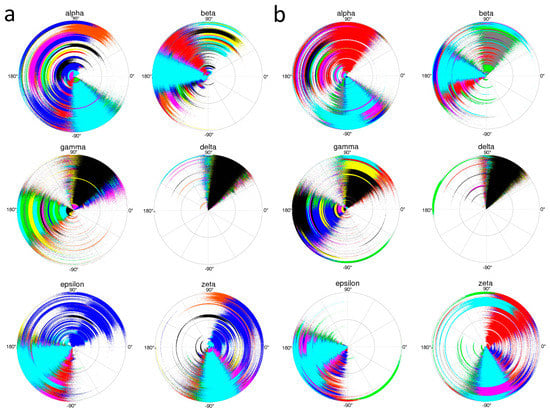
Figure 9.
Radial plots representing a 100 ns time range of the MD trajectory (0 ns at center of circle) and illustrating for (a) the homo-DNA duplex in the dimer and (b) the isolated duplex, sampling of the α, β, γ, δ, ε, and ζ backbone torsion angles by nucleotides at each step of the octamer. Each nucleotide is depicted in a different color.
By comparison, δ torsion angles were basically limited to the sc- range, reflecting the strict preference of the hexose sugar for a chair conformation. In the crystal structure, the sugar of nucleotide T14 mainly adopted a boat conformation (δ 122°). However, inspection of the radial plots in Figure 9 confirmed that excursions to the boat conformation were exceedingly rare in the simulations of both the isolated duplex and the dimer of duplexes. Both MD simulations also revealed similarities in the behavior by ζ angles in residues of the dimerized and isolated duplexes. In addition to the clear preference for the sc- range, the radial plots also revealed extended visits by a few residues to the sc+ range. Finally, there was an interesting difference between the radial plots for the two duplex types in the case of ε angles. In the isolated duplex, this angle was clearly restricted to the ac- and ap ranges. However, in the dimer of duplexes, the ε angle of a single residue occupied a region that reached from sc+ to ac-. Interestingly, in the crystal structure, the ε angle of T5 that was located in the center of the duplex adopted an ac+ orientation (136°).
2.7. Terminal Base Pairs Display Fraying
The base pairs at the ends of the duplex displayed increased mobility during the MD simulation, as seen in a plot of atomic fluctuations (Figure 10). This fraying by bases at the termini of duplexes is a common observation, as pairing gets disrupted and re-established at different times over the course of sufficiently long simulations [24]. Ensembles of duplex structures based on solution NMR typically display fraying of terminal bases as well (for an example see [25]). Moreover, unpairing of terminal bases is also a relatively common phenomenon in crystal structures of native and chemically modified DNA and RNA duplexes. For examples, see [26,27] and the case of an RNA structure in which duplexes are linked in a chain-like fashion, requiring base-pair opening and re-pairing, thus resulting in base-pair intercalation [28].
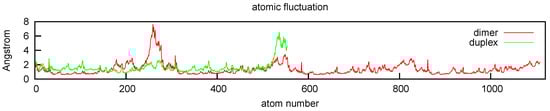
Figure 10.
Atomic fluctuation plot shows fraying, the characteristic increase in motion at chain termini as bases periodically separate and then re-pair.
3. Conclusions
The homo-DNA crystal structure displayed several characteristics that differed significantly from predictions in the literature, including significant twisting (average +14.3°) and efficient stacking (average rise +3.8 Å), with an ideal stacking distance of 3.4 Å between the central A:T base pairs. The formation of a dimer of duplexes across a twofold rotation axis with exchange of bases between duplexes was another unexpected finding in the crystal. These differences motivated us to examine the solution-state behavior of homo-DNA using MD simulations. Both the dimer of duplexes and a duplex isolated from the crystallographic dimer were subjected to simulations. The duplex in the dimer state was found to have lower conformational flexibility than the single duplex, and neither helical rise nor twist showed significant fluctuations over the duration of the MD simulation. Conversely, the single duplex untwisted by more than 50% (average twist of +6.6° per base pair), but retained stacking and showed little resemblance to earlier models with large axial base–base separations on the basis of various approaches [14,15,16]. The absence of base unstacking in the MD simulations of the duplex was also consistent with the inability of a DNA intercalating agent (thiazole orange) to slip between homo-DNA base pairs. These observations suggest that the base-swapped dimer of duplexes seen in the crystal was not an artifact of crystallization, but rather a stable conformational state for homo-DNA in solution.
4. Experimental Procedures
4.1. Oligonucleotide Synthesis and Purification
The homo-DNA d(CGAATTCG) was synthesized following standard solid phase synthesis protocols using phosphoramidite chemistry and a controlled pore glass (CPG) support, as previously described [10]. The detritylated strand was deprotected in dilute ammonia (65°C, 8 h) and HPLC-purified (RP-C4 column Rainin-Dynamax, 0.1 M triethylammonium acetate (TEAA,) pH 7.0, acetonitril gradient) [13]. The DNA d(CGAATTCG) was purchased from Integrated DNA Technologies (Coralville, IA). Following HPLC purification, the oligonucleotides were desalted on SEP PAK cartridges (Waters Inc.) and the solutions micro-filtered.
4.2. Native Gel Electrophoresis
To a native Tris/Borate/EDTA (TBE) polyacrylamide gel (15%), which was pre-run for 35 minutes at a voltage of 270 (set to 1000), 37 mA (set to 60) and 10 Watts were loaded 800 ng of reference DNA octamer (lane 1), 2 μL ladder (lane 2), and 1200 ng homo-DNA octamer (lane 3). The gel was then run at 228 V (set 1000 V), 22 mA (set 60), and 5 Watts for 8 hours. The gel was removed and washed with deionized water for 5 min, and then stained with SYBR-GOLD for 30 minutes. The image (Figure 3b) was captured by trans illumination at 300 nm.
The homo-DNA octamer was labeled by mixing 5 μL octamer (100 μM) with 28 μL H2O, 5 μL 10× T4 polynucleotide kinase reaction buffer (1X buffer composition: 70 mM Tris-HCl, 10 mM MgCl2, 5 mM dithiothreitol, pH 7.6 at 25 °C), 10 μL [γ-32P]ATP, and 2 μL T4 kinase. The sample was incubated at 37 °C for 2.5 hours, heat-treated at 95 °C for 15 min, and then spun through a desalting column. The homo-DNA that had a concentration of 10 pmol/μL after labeling was diluted and 2, 1, and 0.5 pmols were loaded onto the denaturing gel (23% polyacrylamide) and electrophoresed overnight.
4.3. Intercalation Fluorescence Assays
The fluorescence assay was carried out using a Fluorolog Tau-3 Lifetime System spectrophotometer equipped with four cell holders and a water jacket [29]. All fluorescence measurements were carried out at 20 °C. Changes in fluorescence intensity for oligonucleotides (reference DNA, homo-DNA) at 0.1 μM concentration in NaH2PO4 buffer (100 mM, 100 mM NaCl, pH 7.0), were measured after 5 min incubation with each addition of 2 μL thiazole orange (0.4 nM stock solution). The samples were excited at 500 nm and the emission was measured at 524 nm and integrated over a period of 30 sec. Fluorescence data for each concentration of thiazole orange were collected three times and averaged. The obtained fluorescence intensity data were corrected for volume and plotted against the thiazole orange concentration.
4.4. Molecular Dynamics Simulations
The initial models of the homo-DNA duplex [dd(CGAATTCG)]2 and the dimer of duplexes were based on the crystal coordinates deposited in the Protein Data Bank (PDB) http://www.rcsb.org (PDB ID code 2H9S). Molecular dynamics parameters for homo-DNA are available in the standard AMBER force field [30] with the exception of partial charges. Partial charge values were derived by first calculating a molecular electrostatic potential over a grid of points using the Hartree–Fock optimized geometry from Gaussian 03 [31] with a 6-31G* basis set. Atom-centered point charges were then fitted to reproduce that potential using the multi-orientation, multi-conformation procedure of RED-III [32], in accordance with the procedure of Cornell et al. [33].
MD simulations were run using AMBER [30] with the AMBER ff03 force field [34] and the extended simple point charge (SPC/E) water model [35]. The homo-DNA complexes were solvated in truncated octahedron periodic boxes of explicit water molecules with a minimum of 11 Å distance to the closest box edge. Sodium counterions were added for charge neutrality. The resulting systems contained 6563 waters in the duplex, for a total of 29,394 atoms, and 6713 waters for a total of 33,135 atoms in the dimer of duplexes. The systems were energy minimized with positional restraints on all non-solvent atoms, and then with no restraints. Heating was applied gradually under NVT conditions (constant particle number, N, volume, V, and temperature, T; T is regulated via a thermostat), followed by constant pressure density equilibration at NPT (as for NVT, but pressure, P, is regulated) for 10 ns. MD simulations were then propagated for 100 ns for both the homo-DNA duplex and the dimer of dimers complex.
Data analysis was performed using the cpptraj program in AMBER 14 [30], and the CURVES+ software for geometric analysis of nucleic acids [36]. Figures were produced using xmgrace [37], PyMOL [38], and UCSF Chimera [39].
Supplementary Materials
Movies showing conformational changes of homo-DNA duplex and dimer-of-duplexes during the molecular dynamics simulation. This material is available free of charge via the Internet at https://www.mdpi.com/2073-4352/9/10/532/s1.
Author Contributions
J.H.S. and J.A.S. performed the MD simulations, P.S.P. carried out the experiments probing homo-DNA dimerization in solution and intercalation, M.E. and T.P.L. conceived and designed the experiments and computational work, respectively, and J.H.S. and M.E. wrote the paper.
Funding
This research received no external funding.
Acknowledgments
We are grateful to Matt Pence for help with the gel electrophoresis experiments.
Conflicts of Interest
The authors declare no conflict of interest.
References
- Eschenmoser, A. Chemical etiology of nucleic acid structure. Science 1999, 284, 2118–2124. [Google Scholar] [CrossRef] [PubMed]
- Eschenmoser, A. The quest for the chemical roots of life. Chem. Comm. 2004, 1247–1252. [Google Scholar]
- Pitsch, S.; Krishnamurthy, R.; Bolli, M.; Wendeborn, S.; Holzner, A.; Minton, M.; Lesueur, C.; Schlönvogt, I.; Jaun, B.; Eschenmoser, A. Pyranosyl-RNA (‘p-RNA’): Base pairing selectivity and potential to replicate. Helv. Chim. Acta 1995, 78, 1621–1635. [Google Scholar] [CrossRef]
- Beier, M.; Reck, F.; Wagner, T.; Krishnamurthy, R.; Eschenmoser, A. Chemical etiology of nucleic acid structure: Comparing pentopyranosyl-(2′→4′) oligonucleotides with RNA. Science 1999, 283, 699–703. [Google Scholar] [CrossRef] [PubMed]
- Jungmann, O.; Wippo, H.; Stanek, M.; Huynh, H.K.; Krishnamurthy, R.; Eschenmoser, A. Promiscuous Watson-Crick cross-pairing within the family of pentopyranosyl (4′→2′) oligonucleotides. Org. Lett. 1999, 1, 1527–1530. [Google Scholar] [CrossRef] [PubMed]
- Reck, F.; Wippo, H.; Kudick, R.; Bolli, M.; Ceulemans, G.; Krishnamurthy, R.; Eschenmoser, A. L-α-Lyxopyranosyl (4′→3′) oligonucleotides: A base-pairing system containing a shortened backbone. Org. Lett. 1999, 1, 1531–1534. [Google Scholar] [CrossRef] [PubMed]
- Schöning, K.U.; Scholz, P.; Guntha, S.; Wu, X.; Krishnamurthy, R.; Eschenmoser, A. Chemical etiology of nucleic acid structure: The α-threofuranosyl-(3′ →2′) oligonucleotide system. Science 2000, 290, 1347–1351. [Google Scholar] [CrossRef] [PubMed]
- Eschenmoser, A.; Loewenthal, E. Chemistry of potentially prebiological natural products. Chem. Soc. Rev. 1992, 21, 1–16. [Google Scholar] [CrossRef]
- Eschenmoser, A. Toward a chemical etiology of the natural nucleic acids structure. In Proceedings of the Robert A Welch Foundation: 37th Conference on Chemical Research: 40 Years of the DNA Double Helix; The Robert A. Welch Foundation: Houston, TX, USA, 1996; pp. 201–235. [Google Scholar]
- Böhringer, M.; Roth, H.J.; Hunziker, J.; Göbel, M.; Krishnan, R.; Giger, A.; Schweizer, B.; Schreiber, J.; Leumann, C.; Eschenmoser, A. Why pentose and not hexose nucleic acids? Part II. Preparation of oligonucleotides containing 2′,3′-dideoxy-β-D-glucopyranosyl building blocks. Helv. Chim. Acta 1992, 75, 1416–1477. [Google Scholar] [CrossRef]
- Hunziker, J.; Roth, H.J.; Böhringer, M.; Giger, A.; Diedrichsen, U.; Göbel, M.; Krishnan, R.; Jaun, B.; Leumann, C.; Eschenmoser, A. Why pentose and not hexose nucleic acids? Part III. Oligo (2′,3′-dideoxy-β-D-glucopyranosyl) nucleotides (‘homo-DNA’): Base-pairing properties. Helv. Chim. Acta 1993, 76, 259–352. [Google Scholar] [CrossRef]
- Groebke, K.; Hunziker, J.; Faser, W.; Peng, L.; Diedrichsen, U.; Zimmermann, K.; Holzner, A.; Leumann, C.; Eschenmoser, A. Why pentose and not hexose nucleic acids? Part V. Purine-purine pairing in homo-DNA: Guanine, isoguanine, 2,6-diaminopurine and xanthine. Helv. Chim. Acta 1998, 81, 375–474. [Google Scholar] [CrossRef]
- Egli, M.; Pallan, P.S.; Pattanayek, R.; Wilds, C.J.; Lubini, P.; Minasov, G.; Dobler, M.; Leumann, C.; Eschenmoser, A. Crystal structure of homo-DNA and nature’s choice of pentose over hexose in the genetic system. J. Am. Chem. Soc. 2006, 128, 10847–10856. [Google Scholar] [CrossRef] [PubMed]
- Eschenmoser, A.; Dobler, M. Why pentose and not hexose nucleic acids? Part I. Introduction to the problem, conformational analysis of oligonucleotide single strands containing 2′,3′-dideoxyglucopyranosyl building blocks (homo-DNA), and reflections on the conformation of A- and B-DNA. Helv. Chim. Acta 1992, 75, 218–259. [Google Scholar] [CrossRef]
- Egli, M.; Lubini, P.; Pallan, P.S. The long and winding road to the structure of homo-DNA. Chem. Soc. Rev. 2007, 36, 31–45. [Google Scholar] [CrossRef] [PubMed]
- Otting, G.; Billeter, M.; Wüthrich, K.; Roth, H.J.; Leumann, C.; Eschenmoser, A. Why pentose and not hexose nucleic acids? Part IV. ‘homo-DNA’: 1H-, 13C-, 31P- and 15N-NMR-spectroscopic investigation of ddGlc(A-A-A-A-A-T-T-T-T-T) in aqueous solution. Helv. Chim. Acta 1993, 76, 2701–2756. [Google Scholar] [CrossRef]
- Pallan, P.S.; Lubini, P.; Bolli, M.; Egli, M. Backbone-base inclination as a fundamental determinant of nucleic acid self- and cross-pairing. Nucleic Acids Res. 2007, 35, 6611–6624. [Google Scholar] [CrossRef]
- Pallan, P.S.; Lubini, P.; Egli, M. A left-handed supramolecular assembly around a right-handed screw axis in the crystal structure of homo-DNA. Chem. Comm. 2007, 43, 1447–1449. [Google Scholar] [CrossRef]
- Cerutti, D.S.; Le Trong, I.; Stenkamp, R.E.; Lybrand, T.P. Simulations of a protein crystal: Explicit treatment of crystallization conditions links theory and experiment in the streptavidin-biotin complex. Biochemistry 2008, 47, 12065–12077. [Google Scholar] [CrossRef]
- Ekesan, S.; York, D.M. Framework for conducting and analyzing crystal simulations of nucleic acids to aid in modern force field evaluation. J. Phys. Chem. B 2019, 123, 4611–4624. [Google Scholar] [CrossRef]
- Dans, P.D.; Ivani, I.; Hospital, A.; Portella, G.; González, C.; Orozco, M. How accurate are accurate force-fields for B-DNA? Nucleic Acids Res. 2017, 45, 4217–4230. [Google Scholar] [CrossRef]
- Haran, T.E.; Shakked, Z.; Wang, A.H.J.; Rich, A. The crystal structure of d (CCCCGGGG): A new A-form variant with an extended backbone conformation. J. Biomol. Struct. Dyn. 1987, 5, 199–217. [Google Scholar] [CrossRef] [PubMed]
- Portmann, S.; Usman, N.; Egli, M. The crystal structure of r (CCCCGGGG) in two distinct lattices. Biochemistry 1995, 34, 7569–7575. [Google Scholar] [CrossRef] [PubMed]
- Galindo-Murillo, R.; Roe, D.R.; Cheatham, T.E., III. Convergence and reproducibility in molecular dynamics simulations of the DNA duplex d (GCACGAACGAACGAACGC). Biochim. Biophys. Acta 2015, 1850, 1041–1058. [Google Scholar] [CrossRef] [PubMed]
- Ebert, M.O.; Mang, C.; Krishnamurthy, R.; Eschenmoser, A.; Jaun, B. The structure of a TNA-TNA complex in solution: NMR study of the octamer duplex derived from alpha-(L)-threofuranosyl-(3′-2′)-CGAATTCG. J. Am. Chem. Soc. 2008, 130, 15105–15115. [Google Scholar] [CrossRef]
- Minasov, G.; Tereshko, V.; Egli, M. Atomic-resolution crystal structures of B-DNA reveal specific influences of divalent metal ions on conformation and packing. J. Mol. Biol. 1999, 291, 83–99. [Google Scholar] [CrossRef]
- Pallan, P.S.; Ittig, D.; Heroux, A.; Wawrzak, Z.; Leumann, C.J.; Egli, M. Crystal structure of tricyclo-DNA: An unusual compensatory change of two adjacent backbone torsion angles. Chem. Comm. 2008, 44, 883–885. [Google Scholar] [CrossRef]
- Harp, J.; Guenther, D.; Bisbe, A.; Perkins, L.; Matsuda, S.; Bommineni, G.; Zlatev, I.; Foster, D.; Taneja, N.; Charisse, K.; et al. Structural basis for the synergy of 4′-and 2′-modifications on siRNA nuclease resistance, thermal stability and RNAi activity. Nucleic Acids Res. 2018, 46, 8090–8104. [Google Scholar] [CrossRef]
- Tse, W.C.; Boger, D.L. A fluorescent intercalator displacement assay for establishing DNA binding selectivity and affinity. Curr. Protoc. Nucleic Acid Chem. 2005, 20, 8.5.1–8.5.11. [Google Scholar] [CrossRef]
- Case, D.A.; Babin, V.; Berryman, J.T.; Betz, R.M.; Cai, Q.; Cerutti, D.S.; Cheatham, T.E., III; Darden, T.A.; Duke, R.E.; Gohlke, H.; et al. AMBER14; University of California: San Francisco, CA, USA, 2014. [Google Scholar]
- Frisch, M.J.; Trucks, G.W.; Schlegel, H.B.; Scuseria, G.E.; Robb, M.A.; Cheeseman, J.R.; Scalmani, G.; Barone, V.; Petersson, G.A.; Nakatsuji, H.; et al. Gaussian 09, revision D.01; Gaussian, Inc.: Wallingford, CT, USA, 2009. [Google Scholar]
- Dupradeau, F.Y.; Pigache, A.; Zaffran, T.; Savineau, C.; Lelong, R.; Grivel, N.; Lelong, D.; Rosanski, W.; Cieplak, P. The R.E.D. tools: Advances in RESP and ESP charge derivation and force field library building. Phys. Chem. Chem. Phys. 2010, 12, 7821–7839. [Google Scholar] [CrossRef]
- Cieplak, P.; Cornell, W.D.; Bayly, C.; Kollman, P.A. Application of the multimolecule and multiconformational RESP methodology to biopolymers: Charge derivation for DNA, RNA, and proteins. J. Comput. Chem. 1995, 16, 1357–1377. [Google Scholar] [CrossRef]
- Duan, Y.; Wu, C.; Chowdhury, S.; Lee, M.C.; Xiong, G.; Zhang, W.; Yang, R.; Cieplak, P.; Luo, R.; Lee, T.; et al. Point-charge force field for molecular mechanics simulations of proteins based on condensed-phase quantum mechanical calculations. J. Comput. Chem. 2003, 24, 1999–2012. [Google Scholar] [CrossRef] [PubMed]
- Pekka, M.; Nilsson, L. Structure and dynamics of the TIP3, SPC, and SPC/E water models at 298 K. J. Phys. Chem. A 2001, 105, 9954–9960. [Google Scholar]
- Lavery, R.; Moakher, M.; Maddocks, J.H.; Petkeviciute, D.; Zakrzewska, K. CURVES+ web server for analyzing and visualizing the helical, backbone and groove parameters of nucleic acid structures. Nucleic Acids Res. 2009, 37, 5917–5929. [Google Scholar] [CrossRef] [PubMed]
- Vaught, A. Graphing with Gnuplot and Xmgr. Linux J. 1996. issue #28. Available online: https://nnc3.com/mags/LM18/LJ/028/1218.html.
- DeLano, W.L. Pymol: An open-source molecular graphics tool. CCP4 Newsl. Protein Crystallogr. 2002, 40, 82–92. [Google Scholar]
- Pettersen, E.F.; Goddard, T.D.; Huang, C.C.; Couch, G.S.; Greenblatt, D.M.; Meng, E.C.; Ferrin, T.E. UCSF Chimera-A visualization system for exploratory research and analysis. J. Comput. Chem. 2004, 25, 1605–1612. [Google Scholar] [CrossRef]
© 2019 by the authors. Licensee MDPI, Basel, Switzerland. This article is an open access article distributed under the terms and conditions of the Creative Commons Attribution (CC BY) license (http://creativecommons.org/licenses/by/4.0/).