Article

Effects of Interfacial Reactions on Microstructures and Mechanical Properties of 3003 Al/T2 Cu and 1035 Al/T2 Cu Brazed Joints

Faculty of Mechanical & Material Engineering, Huaiyin Institute of Technology, Huai’an 223001, China
Crystals 2020, 10(4), 248; https://doi.org/10.3390/cryst10040248
Submission received: 3 March 2020 / Revised: 23 March 2020 / Accepted: 25 March 2020 / Published: 27 March 2020

Abstract

:
To meet the demand for efficient and reliable copper and aluminum (Cu/Al) joints in refrigeration and electric power industries, interfacial reactions in 3003 Al/T2 Cu and 1035 Al/T2 Cu joints brazed by Zn-xAl (x ranged from 2–25 wt.%) filler metals and their effects on the mechanical properties of the joints were investigated. Microstructures and fracture surfaces were observed combining with composition analysis. For 3003 Al/Cu joints, bulk CuAl and CuAl2 intermetallic compound (IMC) formed in brazing seams, and a CuAl IMC layer formed at the Cu side interfaces. For 1035 Al/Cu joints, bulk CuAl2 IMC formed in brazing seams, and an Al4.2Cu3.2Zn0.7 IMC layer formed at the Cu side interfaces. For both kinds of joints, shear strength increased first, then decreased with the increasing Al content. The increase in shear strength was because Al promoted the formation of Cu-Al IMC, and caused dispersion strengthening. With the excessive Al content, however, the bulk IMC became coarse and the IMC layers at Cu side interfaces grew thick, causing the joint strength to decrease due to stress concentration. The strength of 3003 Al/Cu joints was always higher than that of 1035 Al/Cu, and their highest strength were achieved by Zn-12Al and Zn-15Al, respectively.

1. Introduction

Both copper (Cu) and aluminum (Al) present high electrical conductivity, good thermal conductivity and excellent corrosion resistance [1]. Cu/Al dissimilar joints combine the advantages of Cu and Al [2,3,4], and therefore are widely used in the industries that require not only excellent electrical and thermal conductivity, but also weight and cost reduction, such as refrigeration, electric power and automobiles, etc. [5,6,7,8]. Excessive brittle Cu-Al IMCs formed in a weld seam through a conventional welding method is the main reason for fractures of Cu/Al joints, since the fractures are easily generated at the edge of coarse IMCs [9,10]. Fusion welding processes such as laser welding [11] have quality concerns including spatter, porosity, heat-affected zone or burn-through [12]. Moreover, these welding processes are easy to cause the excessive interaction of base materials and the formation of intermetallic phases with high hardness and brittleness [13]. However, solid state welding methods such as friction stir welding [14,15,16], ultrasonic welding [17], explosive welding [18] and electrical resistance welding [19] are able to suppress the growth of IMCs during the heating. Their restriction on the structure and size of the workpiece decreases the versatility and effectiveness of the processes.
Considering simplicity and non-restriction in shape and size as compared to solid state welding, brazing is an alternative method to achieve a Cu/Al joint. Moreover, brazing allows a low process temperature with a thinner IMCs layer, which is beneficial to metallurgical bonding due to an interface reaction [20]. At present, the filler metals to braze Cu/Al joints mainly consist of Al-Si alloy, Sn-Zn alloy and Zn-Al alloy. Xia et al. used an Al-Si filler metal in vacuum brazing, finding that Cu3Al2 and CuAl2 formed in the region on the Cu side and in the brazing seam [21]. Due to the high liquidus temperature of Al-Si alloys, however, brazing processes usually require higher temperatures, which easily cause the overheating and even overburning of Al base metals. Moreover, the nucleation and growth of Cu-Al IMC are promoted at such a high process temperature. With regard to Sn-Zn filler metal, the poor corrosion resistance of the brazed joint is a main problem. Huang et al. added Ag to Sn-Zn alloys to increase potential, and thus improve their corrosion resistance, but the addition decreased the joint strength [22]. Considering the weakness of Al-Si and Sn-Zn alloys, Zn-Al filler metal becomes a hotspot due to its moderate melting point and excellent mechanical properties. The melting point of Zn-Al alloy can be controlled in the range of 381−490 °C with the change of the Al content, which is a suitable temperature to braze a Cu/Al joint. Niu et al. obtained a Cu/Al joint using Zn-Al filler metal in an argon-shielded furnace, suggesting that CuZn, Al4.2Cu3.2Zn0.7, CuAl2, Cu9Al4 and CuAl compounds could form at the Cu side interface depending on brazing parameters. They also claimed that when the thin CuZn and Al4.2Cu3.2Zn0.7 IMC layers formed, the joint possessed higher shear strength of up to 65−75 MPa [23]. Ji et al. added Ti and Ce into Zn-Al filler metal, finding that the addition of Ti and Ce decreased thickness of the IMC layer, and therefore resulted in a higher shear strength [24,25]. Additionally, CuAl2, CuZn and Cu9Al4 compounds were observed to form at the brazing seam/Cu substrate interface when Zn-Al-xTi filler metal was used, which could further strengthen the joints. Xiao et al. achieved Cu/Al joints using a Zn-3Al filler metal by an ultrasonic-assisted brazing method [26]. They indicated that when the brazing temperature increased to 440 °C, a thin Al4.2Cu3.2Zn0.7 IMC layer formed at the brazing seam/Cu interface, which helped to increase the shear strength of the joint to 78.93 MPa.
In a Cu/Al brazing joint, reactions at brazing seam/Cu interfaces, in brazing seams and at Al/brazing seam interfaces all have a great influence on the performances of the Cu/Al joints. However, existing research mostly focuses on the reactions and microstructures at the brazing seam/Cu interfaces [27]; influences of the reactions in brazing seams and at Al/brazing seam interfaces on joint properties are barely studied. Moreover, most researchers used a pure Al or 1××× series Al alloy as a base metal [28,29,30], while 3003 Al alloy is rarely researched. Compared with pure Al or 1××× series Al alloy, 3003 Al alloy presents more excellent mechanical properties due to the addition of Mn. In this study, 3003 Al alloy and T2 Cu were used as the base metals to obtain a Cu/Al joint. Zn-xAl alloys, with the Al content ranging from 2 wt.% to 25 wt.%, were used as filler metals to investigate the influences of interfacial reactions on joint strength. 1035 Al/Cu joints were also obtained to be compared with 3003 Al/Cu joints. This paper investigated the effect of Al content in the Zn-Al filler metal on the interfacial microstructure of 3003 Al/T2 Cu and 1035 Al/T2 Cu brazing joints, as well as the bulk IMC ratio in the brazing seam. The evolution mechanisms of the joint shear strength and fracture behavior were discussed by analyzing the changes of the IMC layer thickness and the bulk IMC ratio. Finally, the optimum compositions of Zn-Al filler metal for the above two Cu/Al joints were obtained. The results provide guidance for choosing appropriate filler metal and achieving highly reliable Cu/Al dissimilar joints for the refrigeration and electric power industries.

2. Materials and Methods

The commercial flux CsF-AlF3 (Zhejiang Xinrui Welding Material Co., Ltd., Shaoxing, China) was applied to remove the oxide film of a base metal and improve its wettability. The melting point of the flux CsF-AlF3 is about 475 °C. The chemical composition of Zn-xAl filler metals is shown in Table 1. The filler metals were produced by Zhejiang Xinrui Welding Material Co., Ltd. (Shaoxing, China). The melting point of Zn-Al alloy can be controlled in the range of 381–490 °C with the change of Al content from 2 wt.% to 25 wt.%, which is a suitable temperature to match with the commercial flux CsF-AlF3. Moreover, it is a proper temperature to braze copper/aluminum (Cu/Al) joints without overheating. Plates (60 mm × 25 mm × 3 mm) of 1035 Al alloy, 3003 Al alloy and T2 Cu (hereinafter referred to as 1035 Al, 3003 Al and Cu) were used as base metals. The composition of copper plates and aluminum plates are shown in Table 2. Before brazing, contaminants layers (oxides, grease and dust particles) adhering to the surfaces of base metals were removed. The 1035 Al plates and 3003 Al plates were cleaned with 60 °C 5 wt.% NaOH solution for 10−15 s, and then rinsed with water. The Cu plates were soaked in 15 wt.% H2SO4 for 15 min, and then rinsed with water. After rinsing, all plates were dried with warm air [31].
Flame brazing was utilized as a brazing method to obtain lap joints with a lap width of 3 mm. A schematic diagram of the lap Cu/Al brazed joint is shown in Figure 1. A fire-suction welding torch (H01-12, Qingdao Yinte Fardware Tools Co., Ltd., Qingdao, China) was used to join Cu and Al specimens. Shear strength was chosen to estimate the joint strength, and the average shear strength was determined by six specimens. A universal tensile testing machine (SANS-CMT5105, Changchun Test Machine Research Institute, Changchun, China) was used to conduct the shear test. The shear force was divided by the shearing area of the brazed joint to calculate the shear strength. The shear force equals the max load applied in the fracture course of the brazed joint. The lap area of the brazed joint before the shear test was measured as the shearing area. Microstructures of 1035Al/Cu brazed joints were characterized by an optical microscope (XJP-300, Shanghai Optical Instrument Five Factory, Shanghai, China), and joint fractures were analyzed by a scanning electron microscope (SEM, S-3000, HITACHI corporation, Tokyo, Japan) with energy dispersive spectroscopy (EDS). Microstructures of 3003 Al/Cu brazed joints were characterized by an optical microscope (Axio Imager AIM, Carl Zeiss, Oberkochen, Germany), and joint fractures were analyzed by a FEG electron microscope (Quanta 250, FEI Corporation, Hillsboro, USA) with EDS. The area of the IMC layer (dark area) at the Cu side was measured digitally by Image Pro-Plus software, as shown in Figure 2. The average thickness of the IMC layer (d) was then calculated with the following Equation (1)
d = A/l
where (A) is the IMC layer area and (l) is the length of the IMC layer. Meanwhile, the area of bulk IMC was measured with Image Pro-Plus, as shown in Figure 3. The IMC ratio in the brazing seam in which the IMC layer is not included was calculated by the following Equation (2)
N = A3/(A1A2)
where (A3) is the bulk IMC area, (A1) is the total brazing seam area and (A2) is the IMC layer area at the Cu side.

3. Result and Discussion

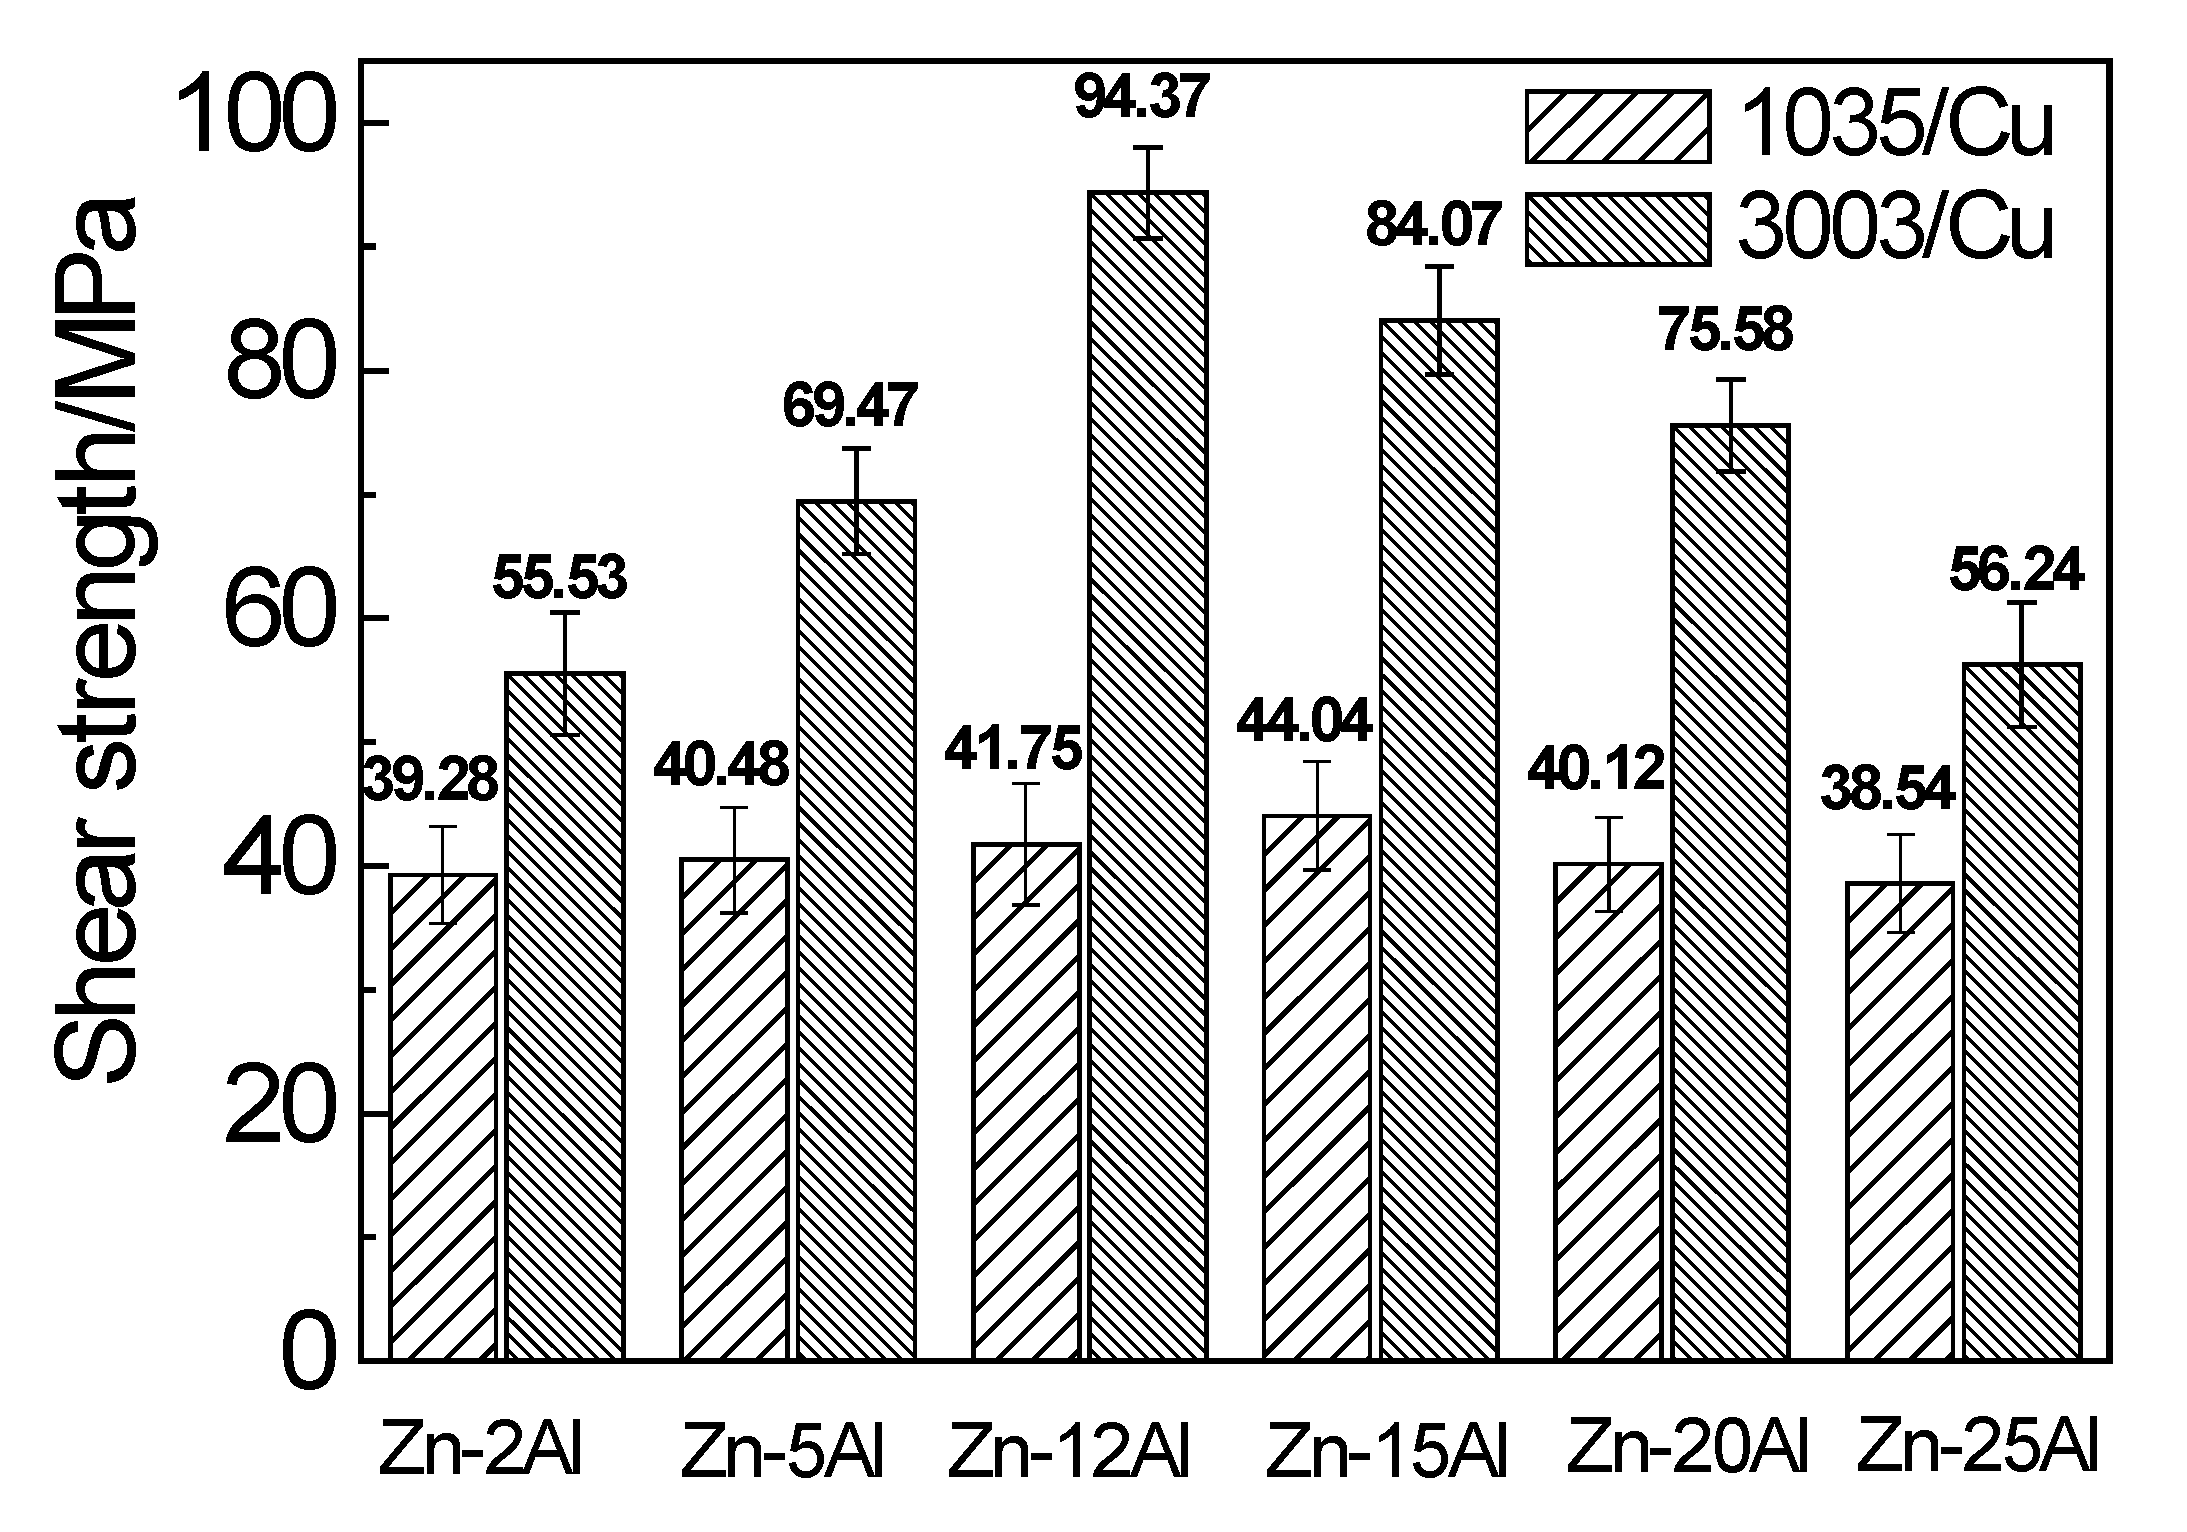
3.1. Joint Mechanical Property

Macro fracture surfaces of 3003 aluminum/copper (Al/Cu) and 1035 Al/Cu joints are shown in Figure 4; Figure 5. Both 3003 Al/Cu and 1035 Al/Cu joints were fractured in brazing seams, and had similar morphology. After shearing, the brazing seam alloys mostly attached to Al sides, and a thin IMC layer could be observed on the Cu sides, which implied that the fracture occurred at a brazing seam/IMC layer interface at the Cu sides.
Figure 6 shows the average shear strength of 3003 Al/Cu and 1035 Al/Cu joints brazed by Zn-xAl filler metals. With the increase of Al content in the filler metals, the shear strength of both 3003 Al/Cu and 1035 Al/Cu joints increased first, then decreased. The 3003 Al/Cu joints brazed by Zn-12Al achieved the highest average shear strength of 94.37 MPa, while the 1035 Al/Cu joints brazed by Zn-15Al achieved the highest average shear strength of 44.04 MPa among the same kind of base metal. Obviously, shear strengths of 3003 Al/Cu joints were greatly higher than that of 1035 Al/Cu joints.

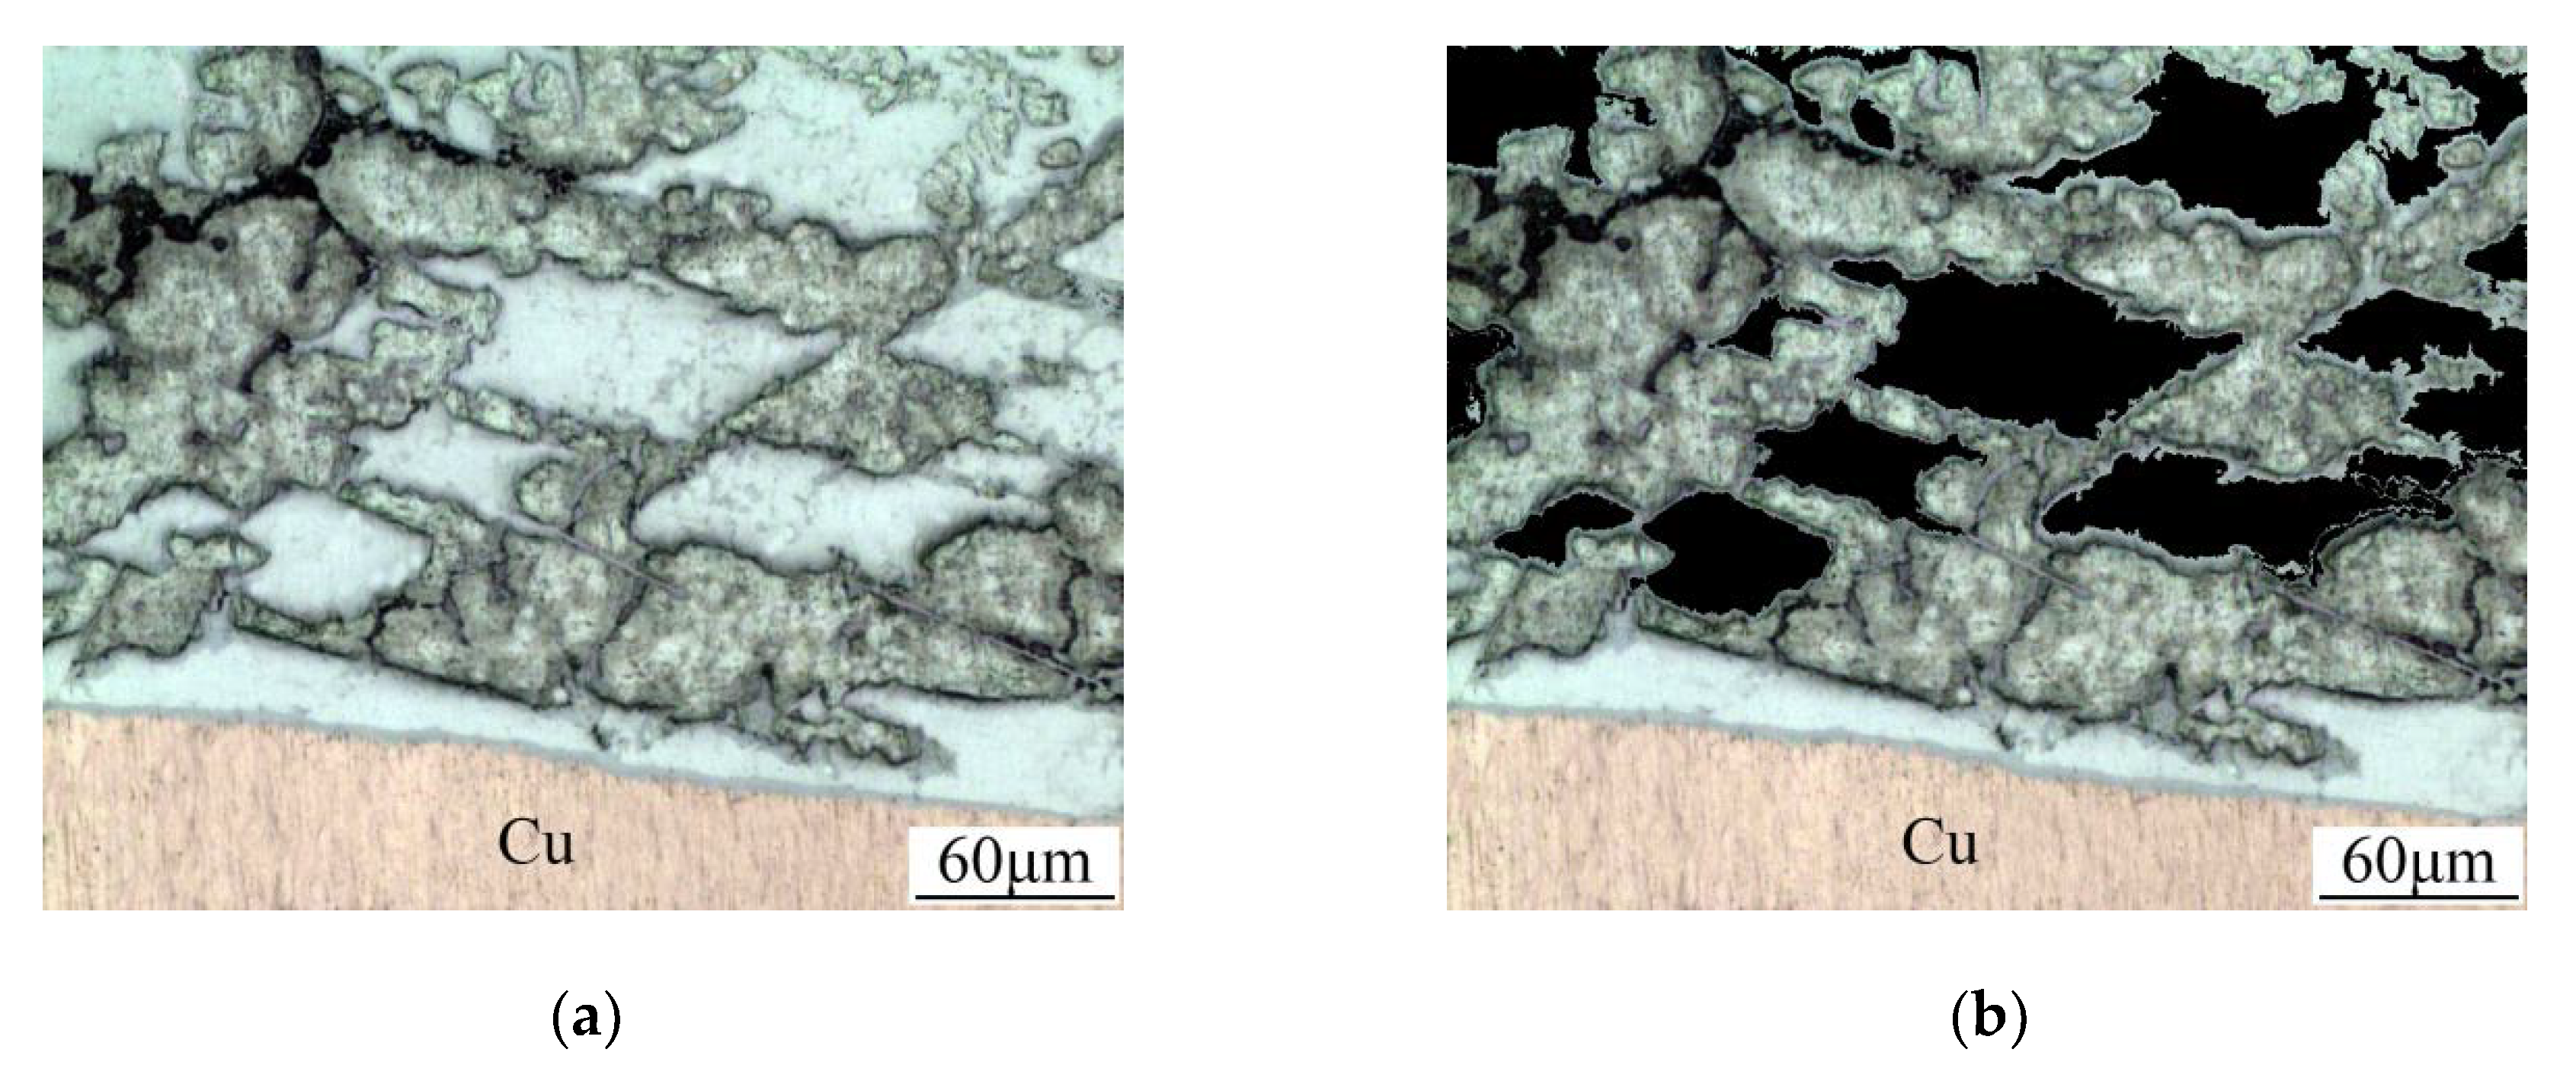
3.2. Microstructures of 3003 Al/Cu Brazed Joints

Figure 7 shows the microstructures of Al/brazing seam interfaces of 3003 Al/Cu joints. During solidification, heterogeneous nucleation of the brazing seam alloys occurred on surfaces of the Al plates, and then formed an Al-based solid solution that grew towards the center of the brazing seam, resulting in a sound joint.
The microstructures of a brazing seam/Cu interface of 3003 Al/Cu joints are shown in Figure 8 and Figure 9. According to the Al-Cu phase diagram and the energy dispersive spectroscopy (EDS) result (Table 3), the phase transition during the brazing process is illustrated as follows. CuAl layers formed at brazing seam/Cu interface, while bulk CuAl2 and CuAl formed and dispersed in the brazing seam alloys. Meanwhile, the brazing seam alloys mainly composed of Al-based and Zn-based solid solutions.
By comparing Figure 7 and Figure 8, it can be found that the amount of bulk Cu-Al IMCs at the Cu side was more than that of the Al side. Because Cu atom concentration was higher at the Cu side, it was favorable for Cu-Al IMC to form. Meanwhile, the microstructure was more complicated at the Cu side, and a layer of CuAl IMC could be observed at the interface of the brazing seam/Cu. The hardness of the IMC layer was significantly higher than that of the brazing seam. Therefore, compared with that of the Al side, the interface at the Cu side became a weak area.
Figure 10 shows the schematic diagram of the microstructure of the Cu/Al joint. The Al-Cu and Zn-Cu phase diagrams suggest that Al is able to form IMC with both Cu and Zn, but Al preferentially reacts with Cu to form IMC due to a stronger chemical affinity between Al and Cu, which is estimated from the electronegativity difference among the three (Al: 1.61, Zn: 1.65 and Cu: 1.9) [32]. Additionally, Cu atoms that concentrated in the molten brazing seam alloys on Cu sides promoted the formation of CuAl. Therefore, CuAl was the dominating phase both at the brazing seam/Cu interface and in brazing seams that were near Cu sides, while the formation of bulk CuAl2 was promoted in the other regions further away from Cu base metal, hence the higher Al atom concentration. However, the hardness of the brittle CuAl layer is much higher than that of brazing seam alloys, which caused a stiffness mismatch. The hardness HV (10 g) of CuAl, CuAl2, Cu and Al are 905, 630, 75 and 36, respectively, which are taken from [30]. Compared with other phases, the hardness of CuAl is extremely high. Therefore, under an external stress load, cracks are prone to occur at the brazing seam/CuAl IMC layer interface due to stress concentration, and propagate along the edge of the IMC layer, as shown in Figure 10.
The formation of Cu-Al IMC at the interface and inside the brazing seam alloys is driven by the diffusion of Cu and Al atoms. During the solidification of brazing seam alloys, the diffusion exists inside Cu-Al IMC and brazing seam alloys, as well as at Cu-Al IMC/brazing seam interface and brazing seam alloy/base metal interfaces. Figure 11 shows the IMC layer thickness and the bulk IMC ratio in Figure 8. For the joint brazed by Zn-2Al, the IMC layer thickness and the bulk IMC ratio are 11.01 μm and 9.91%, respectively. The microstructure was mainly composed of an Al-based and Zn-based solid solution, as lower Al atom concentration led to slower diffusion, hence less Cu-Al IMC. However, the Al-based and Zn-based solid solutions are much softer than the brittle CuAl layer at the Cu side, which could induce stress concentration and cracks under an external stress load, as mentioned—therefore, the shear strength was lower. When Al content is less and equal to 12 wt.%, the IMC layer thickness becomes thinner and the bulk IMC ratio gets higher with the increase of the Al content, as shown in Figure 11.
When the Al content of Zn-xAl filler metals reached 12 wt.%, the ratio of bulk Cu-Al IMC increased to 13.01%. This is because Cu diffusion from base metals to brazing seam alloys has been promoted with increasing Al atom concentration, driven by the strong chemical affinity between Al and Cu. The hardness of the bulk Cu-Al IMC is much larger than that of the Al-based and the Zn-based solid solution, which can work as dispersion strengthening phases to increase the joint strength. On the other hand, the CuAl layer formed at the Cu side gets thinner to 9.64 μm, therefore the effect of the mismatch of stiffness and stress concentration should be lesser. Thus, the joints brazed by Zn-12Al possessed the highest shear strength. When the Al content exceeded 12 wt.%, the formation of the Cu-Al IMC was further promoted, hence the coarse bulk Cu-Al IMC in the brazing seam. Meanwhile, the IMC layer thickness became bigger and the bulk IMC ratio increased significantly. Coarse brittle Cu-Al IMCs readily cause stress concentration and crack initiation, which decreases the joint strength.
During solidification, Al and Mn atoms in 3003 Al base metals diffused into a brazing seam. According to the Al-Mn and Zn-Mn phase diagrams, a small amount of Mn dissolves into Al and Zn, forming a solid solution. The EDS result (Table 3, point D) confirms the existence of Mn in the brazing seam alloy. Due to the similar atomic radii of Al (118 pm), Zn (125 pm) and Mn (117 pm) [33], Mn atoms in 3003Al readily formed a substitutional solid solution with both Al and Zn. Because of the dissolution of Mn, brazing seam alloys of 3003 Al/Cu joints possess larger lattice distortion and stronger solution strengthening, compared with that of 1035 Al/Cu joints. Therefore, 3003 Al/Cu joints with an Mn addition have a higher joint strength than 1035 Al/Cu joints.

3.3. Microstructures of 1035 Al/Cu Brazed Joints

Figure 12 shows the microstructures of Al/brazing seam interfaces of 1035 Al/Cu joints. Similar to 3003 Al/Cu joints, the heterogeneous nucleation of the brazing seam alloy occurred on surfaces of the Al plates, resulting in sound joints, and the fractures mainly occurred at the brazing seam/IMC layer interface at the Cu sides.
The microstructures of brazing seam/Cu interfaces of 1035 Al/Cu joints are shown in Figure 13 and Figure 14. A continuous IMC layer, which is suggested to be Al4.2Cu3.2Zn0.7 by EDS results shown in Table 4, formed at the brazing seam/Cu interface. However, the brazing seam alloy was mainly composed of an Al-based and Zn-based solid solution, while bulk CuAl2 was formed in the brazing seams. The hardness of Al4.2Cu3.2Zn0.7 and Cu are 11.40 GPa and 2.02 GPa, respectively [26]. Consequently, the hardness of Al4.2Cu3.2Zn0.7 is extremely high in comparison with the Zn-based or Al-based solid solution. Therefore, under an external stress load, cracks are prone to occur at the brazing seam/Al4.2Cu3.2Zn0.7 IMC layer interface.
Similar to 3003 Al/Cu joints, the interface reaction of brazing seam/Cu interfaces in 1035 Al/Cu joints was much more complex due to the higher Cu concentration at Cu sides than that of Al sides. After brazing, a continuous IMC layer and more bulk Cu-Al IMCs formed at this interface, and the great gap of stiffness between the IMC layer and brazing seam alloy could easily induce stress concentration and crack initiation. Therefore, the joint strength was mainly decided by the microstructure and performance of the brazing seam/Cu interface. Figure 5 also showed that the fracture location was at brazing seam/Cu interface, indicating that this interface was a weak area.
Cu-Al IMCs at brazing seam/Cu interface and in brazing seam alloys are essentially due to the diffusion and combination of Cu and Al atoms. Figure 15 shows the IMC layer thickness and the bulk IMC ratio of the interfacial structures shown in Figure 13. For the joint brazed by Zn-2Al, the IMC layer thickness and the bulk IMC ratio are 14.33 μm and just 0%. The bulk CuAl2 barely formed, as a lower Al atom concentration led to slower diffusion. The ratio of bulk CuAl2 increases with the increase of Al content in the filler metals. Fine CuAl2 bulks dispersed in brazing seams alloys, which thus increased their stiffness; the effect of the mismatch of stiffness between the brazing seam alloy and the IMC layer at the Cu side was therefore reduced. Hence, the joint strength increased with increasing Al content. When the Al content reached 15 wt.%, the bulk IMC ratio increased to 5.82%. On the other hand, the IMC layer becomes thinner with a thickness of 11.43 μm, showing that stress concentration was suppressed, and it was difficult for the crack to initiate at the at brazing seam/Cu interface, resulting in the highest joint strength.
When the Al content exceeded 15 wt.%, the IMC layer thickness became bigger and the bulk IMC ratio increased significantly. Meanwhile, the formation and growth of bulk CuAl2 was promoted due to the high Al atom concentration, which resulted in a coarse IMC bulk and induced stress concentration. As a consequence, the joint strength decreased. Moreover, it is noteworthy that the IMC layer thickness decreased when the Al content went from 20 wt.% to 25 wt.% in Figure 15. For the joint brazed by Zn-25Al, a huge bulk Cu-Al IMC occupied a great deal of Al atoms and Cu atoms near the IMC layer, with the area reaching 2557.48 μm2. Hence, the IMC layer thickness became thinner when compared to Zn-20Al.
In summary, when the Al content of filler metals is 15 wt.% or less, the amount of dispersed fine Cu-Al IMC in 3003 Al/Cu joints is larger than that of 1035 Al/Cu joints. When the Al content of filler metals exceeds 15 wt.%, the distribution of Cu-Al IMC bulks is more homogenous in 3003 Al/Cu joints than in 1035 Al/Cu joints. Additionally, Mn atoms in 3003 Al base metals diffuse into a brazing seam and then form a solid solution with Al and Zn. Because of the dissolution of Mn, 3003 Al/Cu joints possess larger lattice distortion and stronger solution strengthening. Therefore, the joint strengths of 3003 Al/Cu joints are significantly higher than that of 1035 Al/Cu joints.

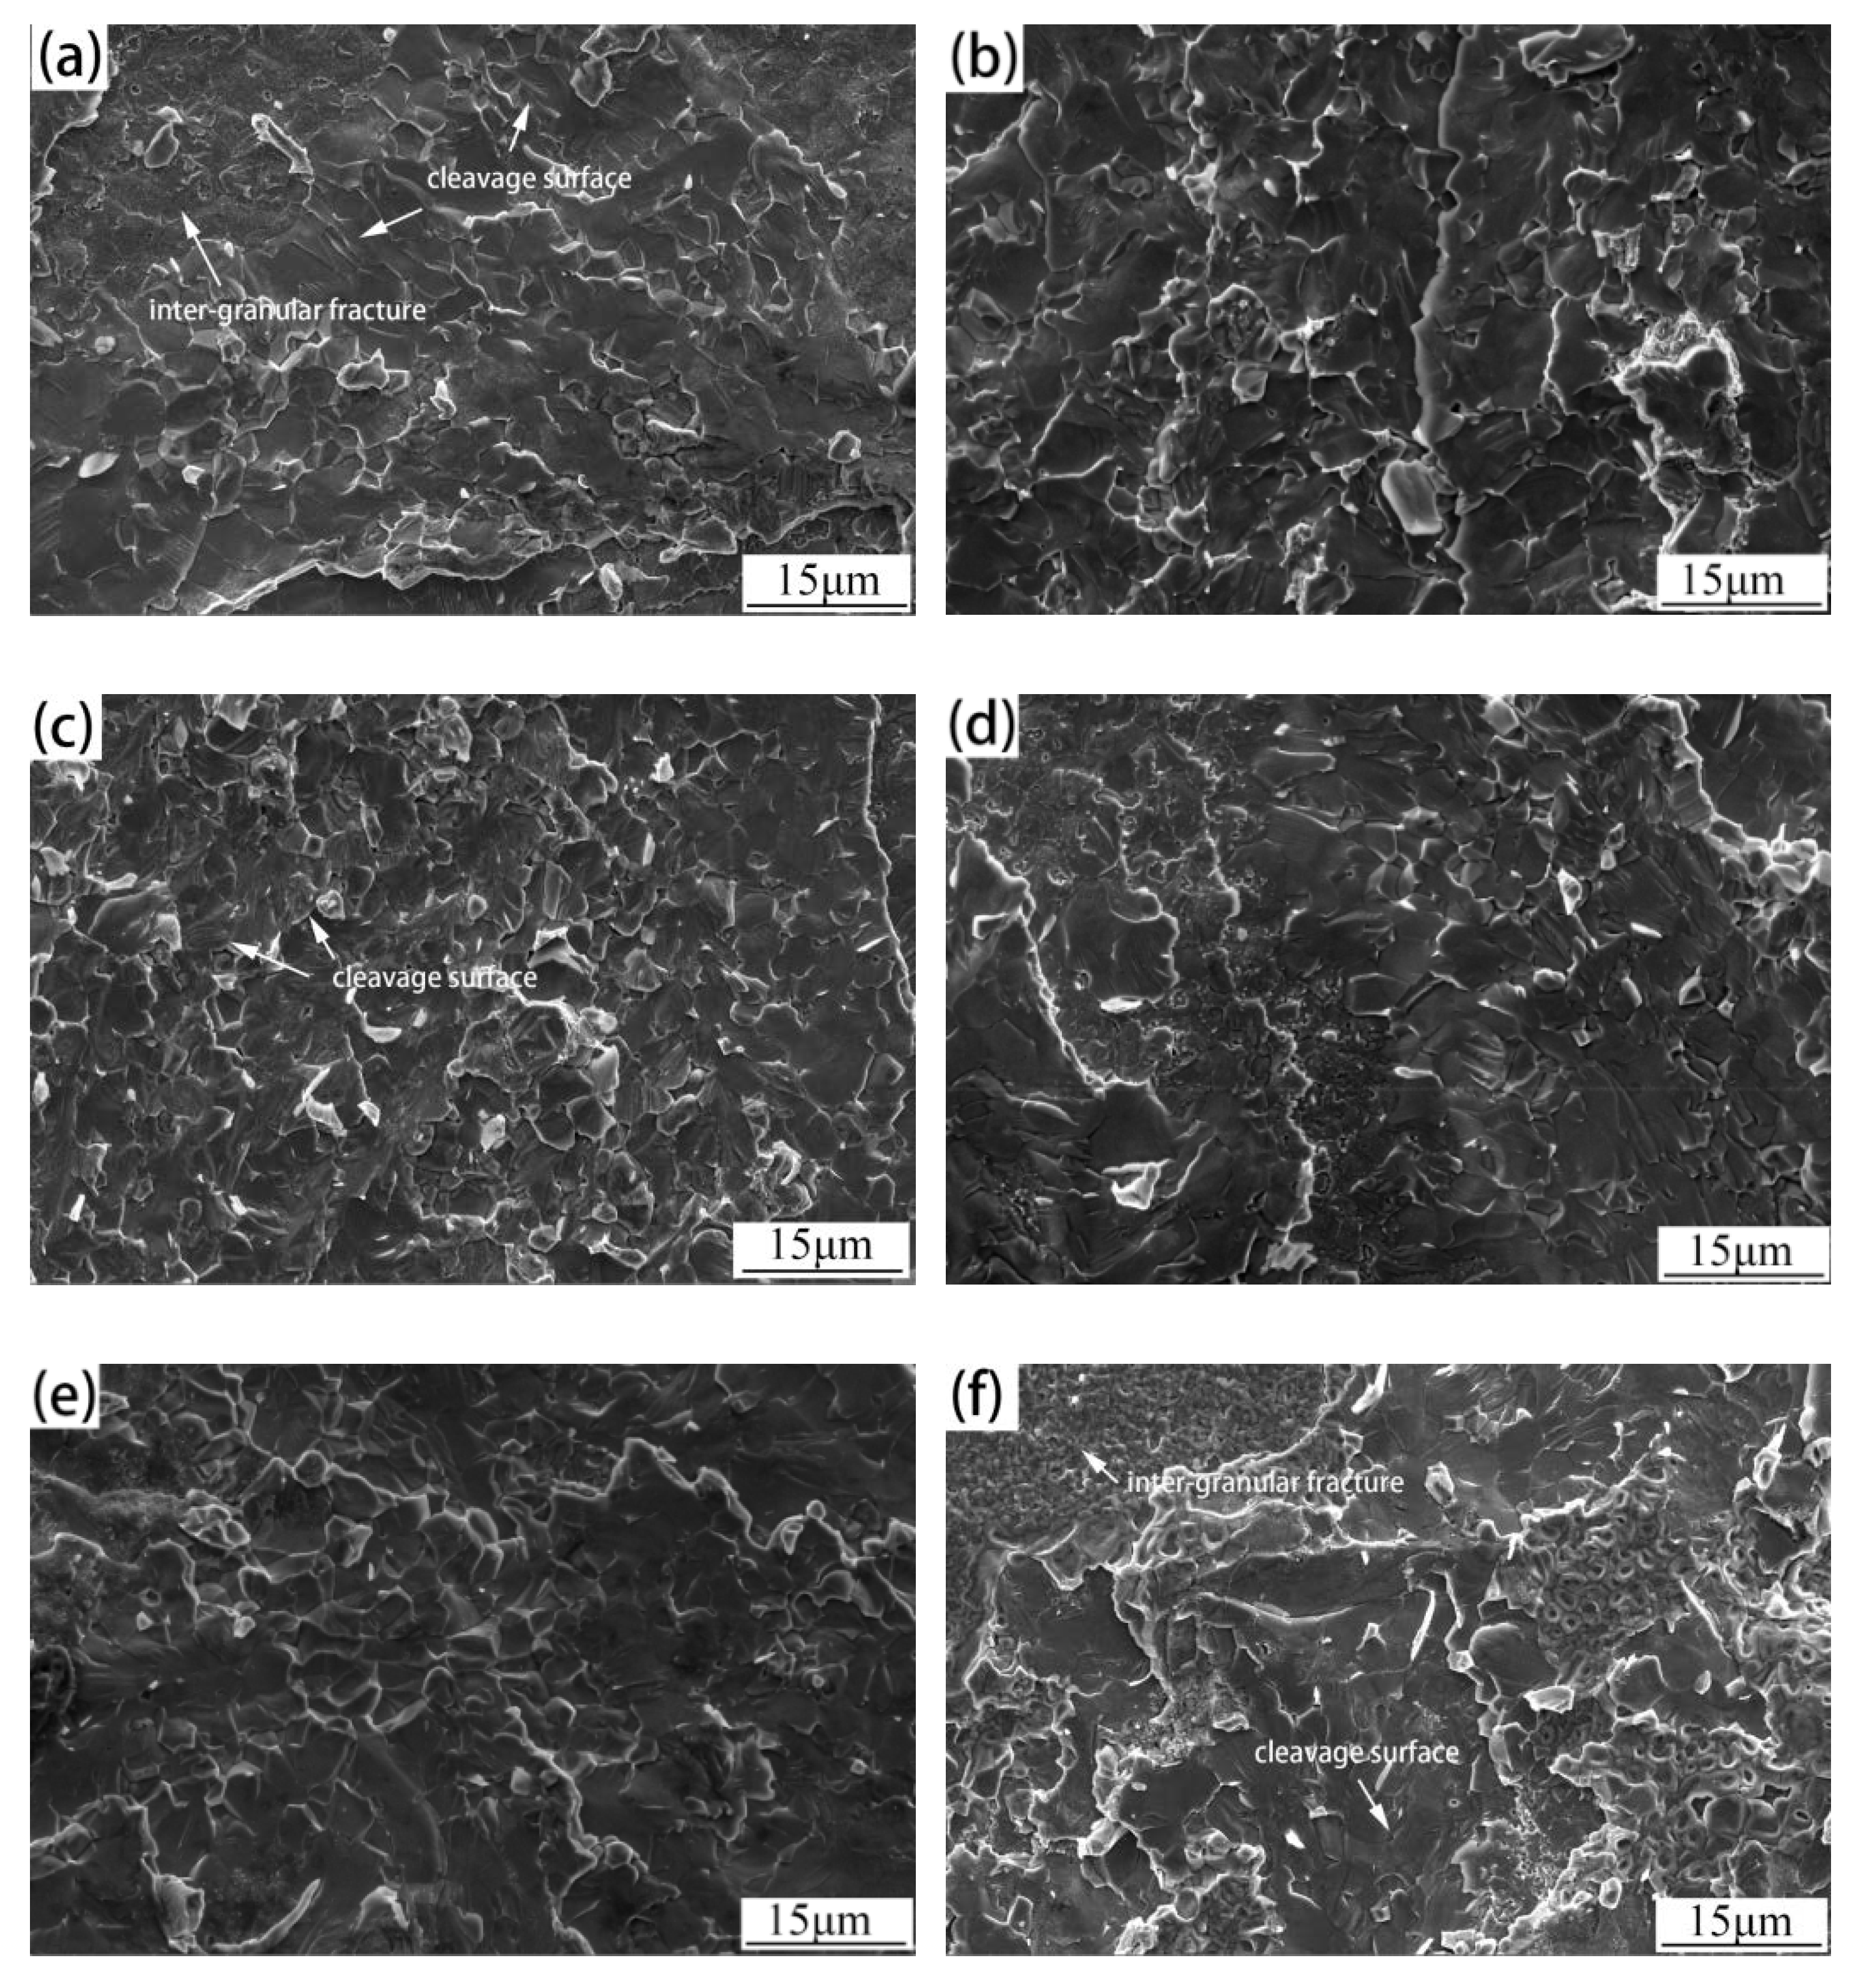
3.4. Fracture Analysis of 3003 Al/Cu Joints

Figure 16 shows the fractography of 3003 Al/Cu joints at Cu side. The results show that the fracture behaviors belong to brittle fracture, as plastic deformations were not obviously caused in the course of joint fracture. For joints brazed by Zn-2Al and Zn-5Al, as shown in Figure 16a,b, a cleavage surface and inter-granular fracture can be observed, indicating a mixed-mode fracture. For the joint brazed by Zn-12Al, only the cleavage surfaces can be seen as shown in Figure 16c, which exhibits cleavage fracture. Because of the small IMC layer thickness and the proper IMC ratio in the brazing seam, it is not liable to induce stress concentration at the interface when the joint is under load. Thus, the shear strength of joint brazed by Zn-12Al is highest, at 94.37 MPa. Meanwhile, for joints brazed by Zn-15Al, Zn-20Al and Zn-25Al, the fracture exhibits a mixture of inter-granular fracture and cleavage fracture again, as shown in Figure 16d−f. When Al content exceeded 12 wt.%, the bulk IMC in brazing seams became coarse, and the CuAl layer grew thick. This caused stress concentration and crack initiation, and led to a decrease of the joint strength.

3.5. Fracture Analysis of 1035 Al/Cu Joints

Figure 17 shows the fractography of 1035 Al/Cu joints at the Cu side. All the fracture modes have a brittle fracture due to some plastic deformations during shear tests. The fractographies of all the brazing joints indicate inter-granular fracture. For the joints brazed by Zn-2Al, Zn-5Al and Zn-12Al, the bright even plane morphology can be seen, as shown in Figure 17a−c. For the joints brazed by Zn-15Al and Zn-20Al, some pits caused by grain detachment from the fracture surface can be observed in Figure 17d,e. Stress concentration can hardly be induced at the interface at the Cu side when the joint brazed by Zn-15Al is under load, which benefits from the thin interfacial layer and proper IMC ratio in the brazing seam. Thus, the shear strength is the highest, at 44.04 MPa. For the joint brazed by Zn-25Al, a large plane morphology is observed, as shown in Figure 17f. The unevenly distributed coarse bulk CuAl2 induced stress concentration and crack initiation at the interface at the Cu side, which reduced the joint strength.

4. Conclusions

(1) Microstructure analysis showed the number of bulk IMCs at the Cu sides was larger than that at the Al sides in both 3003 Al/Cu joints and 1035 Al/Cu joints, which was caused by the higher Cu concentration at the brazing seam/Cu interface. Therefore, stress concentration and crack initiation were readily formed at this interface at the Cu side, due to the stiffness mismatch between the IMC layer and the brazing seam alloy, as well as fractures that mainly occurred at the brazing seam/IMC interface at the Cu sides.
(2) A CuAl IMC layer and an Al4.2Cu3.2Zn0.7 IMC layer formed at brazing seam/Cu interface in 3003 Al/Cu joints and 1035 Al/Cu joints, respectively. For 3003 Al/Cu joints, bulk CuAl and CuAl2 IMC formed in brazing seams, while for 1035 Al/Cu joints, only bulk CuAl2 IMC formed in brazing seams. The bulk IMC ratio continuously increased with the Al content in the filler metals, and the thinnest thicknesses of IMC layers at the brazing seam/Cu interface in 3003 Al/Cu joints and 1035 Al/Cu joints were achieved with Zn-12Al and Zn-15Al, respectively.
(3) In general, the joint strength of 3003 Al/Cu joints were always higher than that of 1035 Al/Cu joints. For both 3003 Al/Cu joints and 1035 Al/Cu joints, the joint strength increased first, then decreased with the increasing Al content. The highest joint strength of 3003 Al/Cu joints achieved 94.37 MPa by Zn-12Al, while that of 1035 Al/Cu joints achieved 44.04 MPa by Zn-15Al. The increase in the joint strength is due to the dispersion strengthening of Cu-Al IMC in brazing seams, since amounts of bulk Cu-Al IMC increased with increasing Al content in filler metals. However, with the excessive Al content (beyond 12 wt.% for 3003 Al/Cu joints and 15 wt.% for 1035 Al/Cu joints), the IMC in brazing seams became coarse, and the IMC layers at brazing seam/Cu interface grew thick. Therefore, the joint strength decreased due to stress concentration.

Author Contributions

All work has been done by M.Z. All author have read and agreed to the published version of the manuscript.

Funding

This research received no external funding.

Conflicts of Interest

The authors declare no conflict of interest.

References

  1. Eslami, N.; Hischer, Y.; Harms, A.; Lauterbach, D.; Böhm, S. Optimization of process parameters for friction stir welding of aluminum and copper using the Taguchi method. Metals 2019, 9, 63. [Google Scholar] [CrossRef] [Green Version]
  2. Mubiayi, M.P.; Akinlabi, E.T. Evolving properties of friction stir spot welds between AA1060 and commercially pure copper C11000. Trans. Nonferr. Metals Soc. 2016, 26, 1852–1862. [Google Scholar] [CrossRef]
  3. Ni, Z.L.; Ye, F.X. Effect of lap configuration on the microstructure and mechanical properties of dissimilar ultrasonic metal welded copper-aluminum joint. J. Mater. Process. Technol. 2017, 245, 180–192. [Google Scholar] [CrossRef]
  4. Balasundaram, R.; Patel, V.K.; Bhole, S.D.; Chen, D.L. Effect of zinc interlayer on ultrasonic spot welded aluminum-to-copper joints. Mater. Sci. Eng. A 2014, 607, 277–286. [Google Scholar] [CrossRef]
  5. Zhang, W.; Shen, Y.F.; Yan, Y.F.; Guo, R. Dissimilar friction stir welding of 6061 Al to T2 pure Cu adopting tooth-shaped joint configuration: Microstructure and mechanical properties. Mater. Sci. Eng. A 2017, 690, 355–364. [Google Scholar] [CrossRef]
  6. Reisgen, U.; Olschok, S.; Jakobs, S.; Holtum, N. Influence of the degree of dilution with laser beam vacuum-welded Cu-Al mixed joints on the electrical properties. Procedia CIRP 2018, 74, 23–26. [Google Scholar] [CrossRef]
  7. Zhang, J.Q.; Shen, Y.F.; Yao, X.; Xu, H.S.; Li, B. Investigation on dissimilar underwater friction stir lap welding of 6061-T6 aluminum alloy to pure copper. Mater. Des. 2014, 64, 74–80. [Google Scholar] [CrossRef]
  8. Das, A.; Li, D.Z.; Williams, D.; Greenwood, D. Weldability and shear strength feasibility study for automotive electric vehicle battery tab interconnects. J. Braz. Soc. Mech. Sci. Eng. 2019, 41, 54. [Google Scholar] [CrossRef] [Green Version]
  9. Wei, Y.N.; Li, J.L.; Xiong, J.T.; Zhang, F.S. Investigation of interdiffusion and intermetallic compounds in Al–Cu joint produced by continuous drive friction welding. Eng. Sci. Technol. Int. J. 2017, 19, 90–95. [Google Scholar] [CrossRef] [Green Version]
  10. Zhou, X.L.; Zhang, G.; Shi, Y.; Zhu, M.; Yang, F.Q. Microstructures and mechanical behavior of aluminum-copper lap joints. Mater. Sci. Eng. A 2017, 705, 105–113. [Google Scholar] [CrossRef]
  11. Das, A.; Butterworth, I.; Masters, I.; Williams, D. Microstructure and mechanical properties of gap-bridged remote laser welded (RLW) automotive grade AA 5182 joints. Mater. Charact. 2018, 145, 697–712. [Google Scholar] [CrossRef]
  12. Das, A.; Masters, I.; Williams, D. Process robustness and strength analysis of multi-layered dissimilar joints using ultrasonic metal welding. Int. J. Adv. Manuf. Technol. 2019, 101, 881–900. [Google Scholar] [CrossRef] [Green Version]
  13. Weigla, M.; Alberta, F.; Schmidt, M. Enhancing the ductility of laser-welded copper-aluminum connections by using adapted filler materials. Phys. Procedia 2011, 12, 332–338. [Google Scholar] [CrossRef] [Green Version]
  14. Li, W.Y.; Wen, Q.; Yang, X.W.; Wang, Y.S.; Gao, D.L.; Wang, W.B. Interface microstructure evolution and mechanical properties of Al/Cu bimetallic tubes fabricated by a novel friction-based welding technology. Mater. Des. 2017, 134, 383–393. [Google Scholar] [CrossRef]
  15. Tan, C.W.; Jiang, Z.G.; Li, L.Q.; Chen, Y.B.; Chen, X.Y. Microstructural evolution and mechanical properties of dissimilar Al–Cu joints produced by friction stir welding. Mater. Des. 2013, 51, 466–473. [Google Scholar]
  16. Eslami, N.; Hischer, Y.; Harms, A.; Lauterbach, D.; Böhm, S. Influence of copper-sided tin coating on the weldability and formation of friction stir welded aluminum-copper-joints. Metals 2019, 9, 179. [Google Scholar] [CrossRef] [Green Version]
  17. Satpathya, M.P.; Sahoob, S.K. Mechanical performance and metallurgical characterization of ultrasonically welded dissimilar joints. J. Manuf. Process. 2017, 25, 443–451. [Google Scholar] [CrossRef]
  18. Shiran, M.K.G.; Khalaj, G.; Pouraliakbar, H.; Jandaghi, M.R.; Dehnavi, A.S.; Bakhtiari, H. Multilayer Cu/Al/Cu explosive welded joints: Characterizing heat treatment effect on the interface microstructure and mechanical properties. J. Manuf. Process. 2018, 35, 657–663. [Google Scholar] [CrossRef]
  19. Zhang, Y.; Li, Y.; Luo, Z.; Yuan, T.; Bi, J.; Wang, Z.M.; Wang, Z.P.; Chao, Y.J. Feasibility study of dissimilar joining of aluminum alloy 5052 to pure copper via thermo-compensated resistance spot welding. Mater. Des. 2016, 106, 235–246. [Google Scholar] [CrossRef]
  20. Wang, X.G.; Li, X.G.; Wang, C.G. Influence of diffusion brazing parameters on microstructure and properties of Cu/Al joints. J. Manuf. Process. 2018, 35, 343–350. [Google Scholar] [CrossRef]
  21. Xia, C.Z.; Li, Y.J.; Puchkov, U.A.; Gerasimov, S.A.; Wang, J. Microstructure and phase constitution near the interface of Cu/Al vacuum brazing using Al–Si filler metal. Vacuum 2008, 82, 799–804. [Google Scholar] [CrossRef]
  22. Huang, M.L.; Huang, Y.Z.; Ma, H.T.; Zhao, J. Mechanical properties and electrochemical corrosion behavior of Al/Sn-9Zn-xAg/Cu joints. J. Electron. Mater. 2011, 40, 315–323. [Google Scholar] [CrossRef]
  23. Niu, Z.W.; Ye, Z.; Huang, J.H.; Yang, H.; Yang, J.; Chen, S.H. Interfacial structure and properties of Cu/Al joints brazed with Zn-Al filler metals. Mater. Charact. 2018, 138, 78–88. [Google Scholar] [CrossRef]
  24. Ji, F.; Xue, S.B.; Dai, W. Effects of Ti on the Brazability of Zn-22AI-xTi Filler Metals as Well as Properties of Cu/Al Brazing Joints. Rare Metal Mater. Eng. 2013, 42, 2453–2457. [Google Scholar]
  25. Ji, F.; Xue, S.B. Growth behaviors of intermetallic compound layers in Cu/Al joints brazed with Zn–22Al and Zn–22Al–0.05Ce filler metals. Mater. Des. 2013, 51, 907–915. [Google Scholar]
  26. Xiao, Y.; Ji, H.J.; Li, M.Y.; Kim, J. Ultrasound-assisted brazing of Cu/Al dissimilar metals using a Zn–3Al filler metal. Mater. Des. 2013, 52, 740–747. [Google Scholar] [CrossRef]
  27. Zhang, H.W.; Cui, W.; He, J.S.; Yan, J.C.; Yang, S.Q. Formation and evolution of intermetallic compounds at interfaces of Cu/Al joints by ultrasonic-assisted soldering. J. Mater. Process. Technol. 2015, 223, 1–7. [Google Scholar]
  28. Ye, Z.; Yang, H.; Huang, J.H.; Yang, J.; Chen, S.H. A novel Zn-Al-Si corrosion resistant filler metal for Cu/Al brazing. Mater. Lett. 2017, 206, 201–204. [Google Scholar] [CrossRef]
  29. Liu, G.P.; Hu, X.W.; Fu, Y.S.; Li, Y.L. Microstructure and mechanical properties of ultrasonic welded joint of 1060 aluminum alloy and T2 pure copper. Metals 2017, 7, 361. [Google Scholar] [CrossRef] [Green Version]
  30. Solchenbach, T.; Plapper, P. Mechanical characteristics of laser braze-welded aluminium–copper connections. Opt. Laser Technol. 2013, 54, 249–256. [Google Scholar] [CrossRef]
  31. Zhang, Q.Y.; Zhuang, H.S. Brazing and Soldering Manual, 2nd ed.; China Machine Press: Beijing, China, 2005; pp. 66–120. [Google Scholar]
  32. Wang, Z.Z. Material Science Foundation, 1st ed.; China Machine Press: Beijing, China, 2005; p. 51. [Google Scholar]
  33. Wuhan University; Jilin University. Inorganic Chemistry, 3rd ed.; Higher Education Press: Beijing, China, 1994; p. 106. [Google Scholar]
Figure 1. The schematic diagram of the lap Cu/Al brazed joint (unit: mm).
Crystals 10 00248 g001
Figure 2. The schematic diagram for the calculation of the IMC layer area.
Crystals 10 00248 g002
Figure 3. The schematic diagram for the calculation of bulk IMC area: (a) the original image; and (b) the image processed by Image Pro-Plus software.
Crystals 10 00248 g003
Figure 4. Macro fracture surfaces of 3003 Al/Cu joint brazed by (a) Zn-2Al; (b) Zn-5Al; (c) Zn-12Al; (d) Zn-15Al; (e) Zn-20Al; and (f) Zn-25Al.
Crystals 10 00248 g004aCrystals 10 00248 g004b
Figure 5. Macro fracture surfaces of 1035 Al/Cu joint brazed by (a) Zn-2Al; (b) Zn-5Al; (c) Zn-12Al; (d) Zn-15Al; (e) Zn-20Al; and (f) Zn-25Al.
Crystals 10 00248 g005
Figure 6. Shear strength of 3003 Al/Cu and 1035 Al/Cu joints brazed by the Zn-xAl filler metals.
Crystals 10 00248 g006
Figure 7. Microstructures of Al/brazing seam interfaces of 3003 Al/Cu joints brazed by (a) Zn-2Al; (b) Zn-5Al; (c) Zn-12Al; (d) Zn-15Al; (e) Zn-20Al; and (f) Zn-25Al.
Crystals 10 00248 g007
Figure 8. Microstructures of Cu/brazing seam interfaces of 3003 Al/Cu joints brazed by (a) Zn-2Al; (b) Zn-5Al; (c) Zn-12Al; (d) Zn-15Al; (e) Zn-20Al; and (f) Zn-25Al.
Crystals 10 00248 g008
Figure 9. SEM image of Cu/brazing seam interfaces of 3003 Al/Cu joints brazed by Zn-25Al.
Crystals 10 00248 g009
Figure 10. Schematic diagram of microstructure in the Cu/Al brazed joint.
Crystals 10 00248 g010
Figure 11. Changes of (a) IMC layer thickness and (b) bulk IMC ratio in Figure 8.
Crystals 10 00248 g011
Figure 12. Microstructures of Al/brazing seam interfaces of 1035 Al/Cu joints brazed by (a) Zn-2Al; (b) Zn-5Al; (c) Zn-12Al; (d) Zn-15Al; (e) Zn-20Al; and (f) Zn-25Al.
Crystals 10 00248 g012aCrystals 10 00248 g012b
Figure 13. Microstructures of brazing seam/Cu interfaces of 1035 Al/Cu joints brazed by (a) Zn-2Al; (b) Zn-5Al; (c) Zn-12Al; (d) Zn-15Al; (e) Zn-20Al; and (f) Zn-25Al.
Crystals 10 00248 g013
Figure 14. SEM image of brazing seam/Cu interfaces of 1035 Al/Cu joint brazed by Zn-15Al.
Crystals 10 00248 g014
Figure 15. Changes of (a) IMC layer thickness and (b) bulk IMC ratio in Figure 13.
Crystals 10 00248 g015
Figure 16. Fractography at the Cu side of 3003 Al/Cu joints brazed by: (a) Zn-2Al; (b) Zn-5Al; (c) Zn-12Al; (d) Zn-15Al; (e) Zn-20Al; and (f) Zn-25Al.
Crystals 10 00248 g016
Figure 17. Fractography of at Cu side 1035 Al/Cu joints brazed by: (a) Zn-2Al; (b) Zn-5Al; (c) Zn-12Al; (d) Zn-15Al; (e) Zn-20Al; and (f) Zn-25Al.
Crystals 10 00248 g017
Table 1. Composition of filler metals (wt.%).
Element123456
Al2512152025
Zn989588858075
Table 2. Composition of copper plates and aluminum plates.
MaterialComposition (wt.%)
AlZnCuFeSbVSiMgMnAsBiPbTiS
1035Bal.0.10.10.6-0.050.350.050.05---0.03-
3003Bal.0.10.05~0.20.7--0.6 1.0~1.5-----
T2Cu--Bal.0.0050.002----0.0020.0010.005-0.005
Table 3. EDS results of chemical compositions (at.%) of points marked in Figure 9.
PointAlCuZnMn
A63.1636.84--
B57.0842.92--
C52.9747.03--
D81.296.5211.220.97
Table 4. EDS results of chemical compositions (at. %) of points marked in Figure 14.
PointAlCuZn
E67.4230.272.31
F56.2635.987.76
G75.915.3418.75

