Article

Microstructure and Properties of Bulk Ultrafine-Grained Cu1.5Cr0.1Si Alloy through ECAP by Route C and Aging Treatment

1
State Key Laboratory of Advanced Processing and Recycling of Nonferrous Metals, Lanzhou University of Technology, Lanzhou 730050, Gansu, China
2
School of Materials Science and Engineering, Lanzhou University of Technology, Lanzhou 730050, Gansu, China
*
Author to whom correspondence should be addressed.
Crystals 2020, 10(3), 207; https://doi.org/10.3390/cryst10030207
Submission received: 26 February 2020 / Revised: 11 March 2020 / Accepted: 12 March 2020 / Published: 16 March 2020

Abstract

:
The evolutions of the microstructure and its effect on the mechanical and electrical conductivity properties of Cu1.5Cr0.1Si alloy after equal channel angle pressing (ECAP)-C path deformation and aging treatment have been investigated using scanning electron microscopy (SEM), X-ray diffraction (XRD), and electron back-scattered diffraction (EBSD). It was found that after the ECAP-C deformation at room temperature, with an extension of aging time, the strong (111) macro orientation formed in the Cu1.5Cr0.1Si alloy. The ultrafine crystals formed by ECAP and the rich chromium phase precipitated along grain boundaries during the aging process greatly improved the material strength. After aging at 350 °C for 4 h, the tensile strength, elongation, and conductivity reached 528 MPa, 15.27%, and 78.9% IACS, respectively. The fracture mode of the alloy was ductile fracture. The steady-oriented {111} <110> texture was beneficial to improving the conductivity of the material.

1. Introduction

The rapid development of electric power and emerging industries has increasingly demanded certain performance requirements of copper and copper alloy materials. High-strength, high-conductivity copper alloys have become a focus of worldwide attention. Cu-Cr-based alloys are widely used in such important fields as electronics and electrical, transportation, and aerospace due to their excellent electrical conductivity and good mechanical properties [1,2]. Traditional high alloying can greatly improve the strength of these materials [3,4]; however, it can also seriously reduce the materials’ conductivity, which severely limits the application of metal materials, such as copper, in some key areas. Therefore, improving the strength and toughness of materials without significantly reducing their electrical conductivity has become an important issue that researchers have focused on in recent years.
The combination of super plastic deformation (SPD) and heat treatment processing is an effective method of improving the strength and conductivity of metal materials [5], of which equal channel angle pressing (ECAP) combined with aging treatment is one of the most effective methods in this field [6]. As a kind of SPD, the ECAP method has been gradually used for the preparation of bulk ultrafine-grained high-performance metal materials [7,8,9,10]. The ultrafine crystal materials have significantly better physical and mechanical properties than similar coarse-crystalline materials [11]. Lu et al. [12,13] found that the high-density ultrafine crystals/nano twins induced by SPD can greatly improve the materials’ strength and conductivity. Wang et al. [14] found that the tensile strength of a Cu-Cr-Zr alloy after ECAP and aging treatment was increased to 623.1 MPa, and the conductivity was maintained at 85.34% IACS. Vinogradov et al. [15] found that the tensile strength of a Cu-0.44Cr-0.2Zr alloy after ECAP combined with aging treatment reached 710 MPa, and the conductivity reached 71% IACS. Purcek [16] found that after eighteight passes of ECAP and agingeight passes, the tensile strength of the Cu-Cr-Zr alloy increased significantly, from 189 MPa to 688 MPa, while the conductivity remained basically unchanged. However, due to poor stability and proneness to aggregation and growth during aging, the chromium phase can increase the scattering of moving electrons on grain boundaries (GBs) and reduce the conductivity of Cu-Cr based alloys [17]. Zhou et al. [18,19] found that the addition of a Si element in the Cu-Cr alloy can effectively refine the precipitated phase while suppressing the growth of the chromium phase, reducing the stacking fault energy and significantly improving the toughness of the material, which greatly solved the problems of easy aggregation and build up in the chromium phase.
Studies [20,21] have found that the evolution of texture during the deformation process can seriously affect the conductivity of the metal, and that the stable {hkl} <110> texture can effectively reduce the scattering of electrons from the GBs and slightly increase conductivity. Based on previous studies on copper materials, this work focused on the effects of microstructure and orientation evolution on the mechanical properties and conductivity of the Cu1.5Cr0.1Si alloy during ECAP and the aging process.

2. Materials and Methods

The samples were prepared by cutting a cold-drawn Cu1.5Cr0.1Si alloy rod with a diameter of Φ12 mm into a cylindrical rod with a size of Φ12 mm × 70 mm, which was then homogenized at 900 °C for 3 h and deformed through ECAP-C path (rotation 180°after each deformation) using a YT071-100A hydraulic press. The internal angle of the ECAP mold was (Φ = 105°) and the external angle was (Φ = 37°). Samples underwent artificial aging treatment for 1–8 h at 350 °C and 400 °C, respectively. Samples were polished with 800~2000# sandpaper, and then mechanically and ion polished. Quanta FEG-450 thermal field emission scanning electron microscope was used for scanning electron microscopy (SEM) and electron back-scattered diffraction (EBSD). D8ADVANCE was used for X-ray diffraction (XRD) grain macroscopic orientation detection. The mechanical properties test used a WWD-100D microcomputer-controlled electronic universal material testing machine. The Sigma2008B/C digital eddy current metal conductivity meter was used to measure the conductivity of the Cu1.5Cr0.1Si alloy before and after ECAP. The measurement error is 0.1%.

3. Results

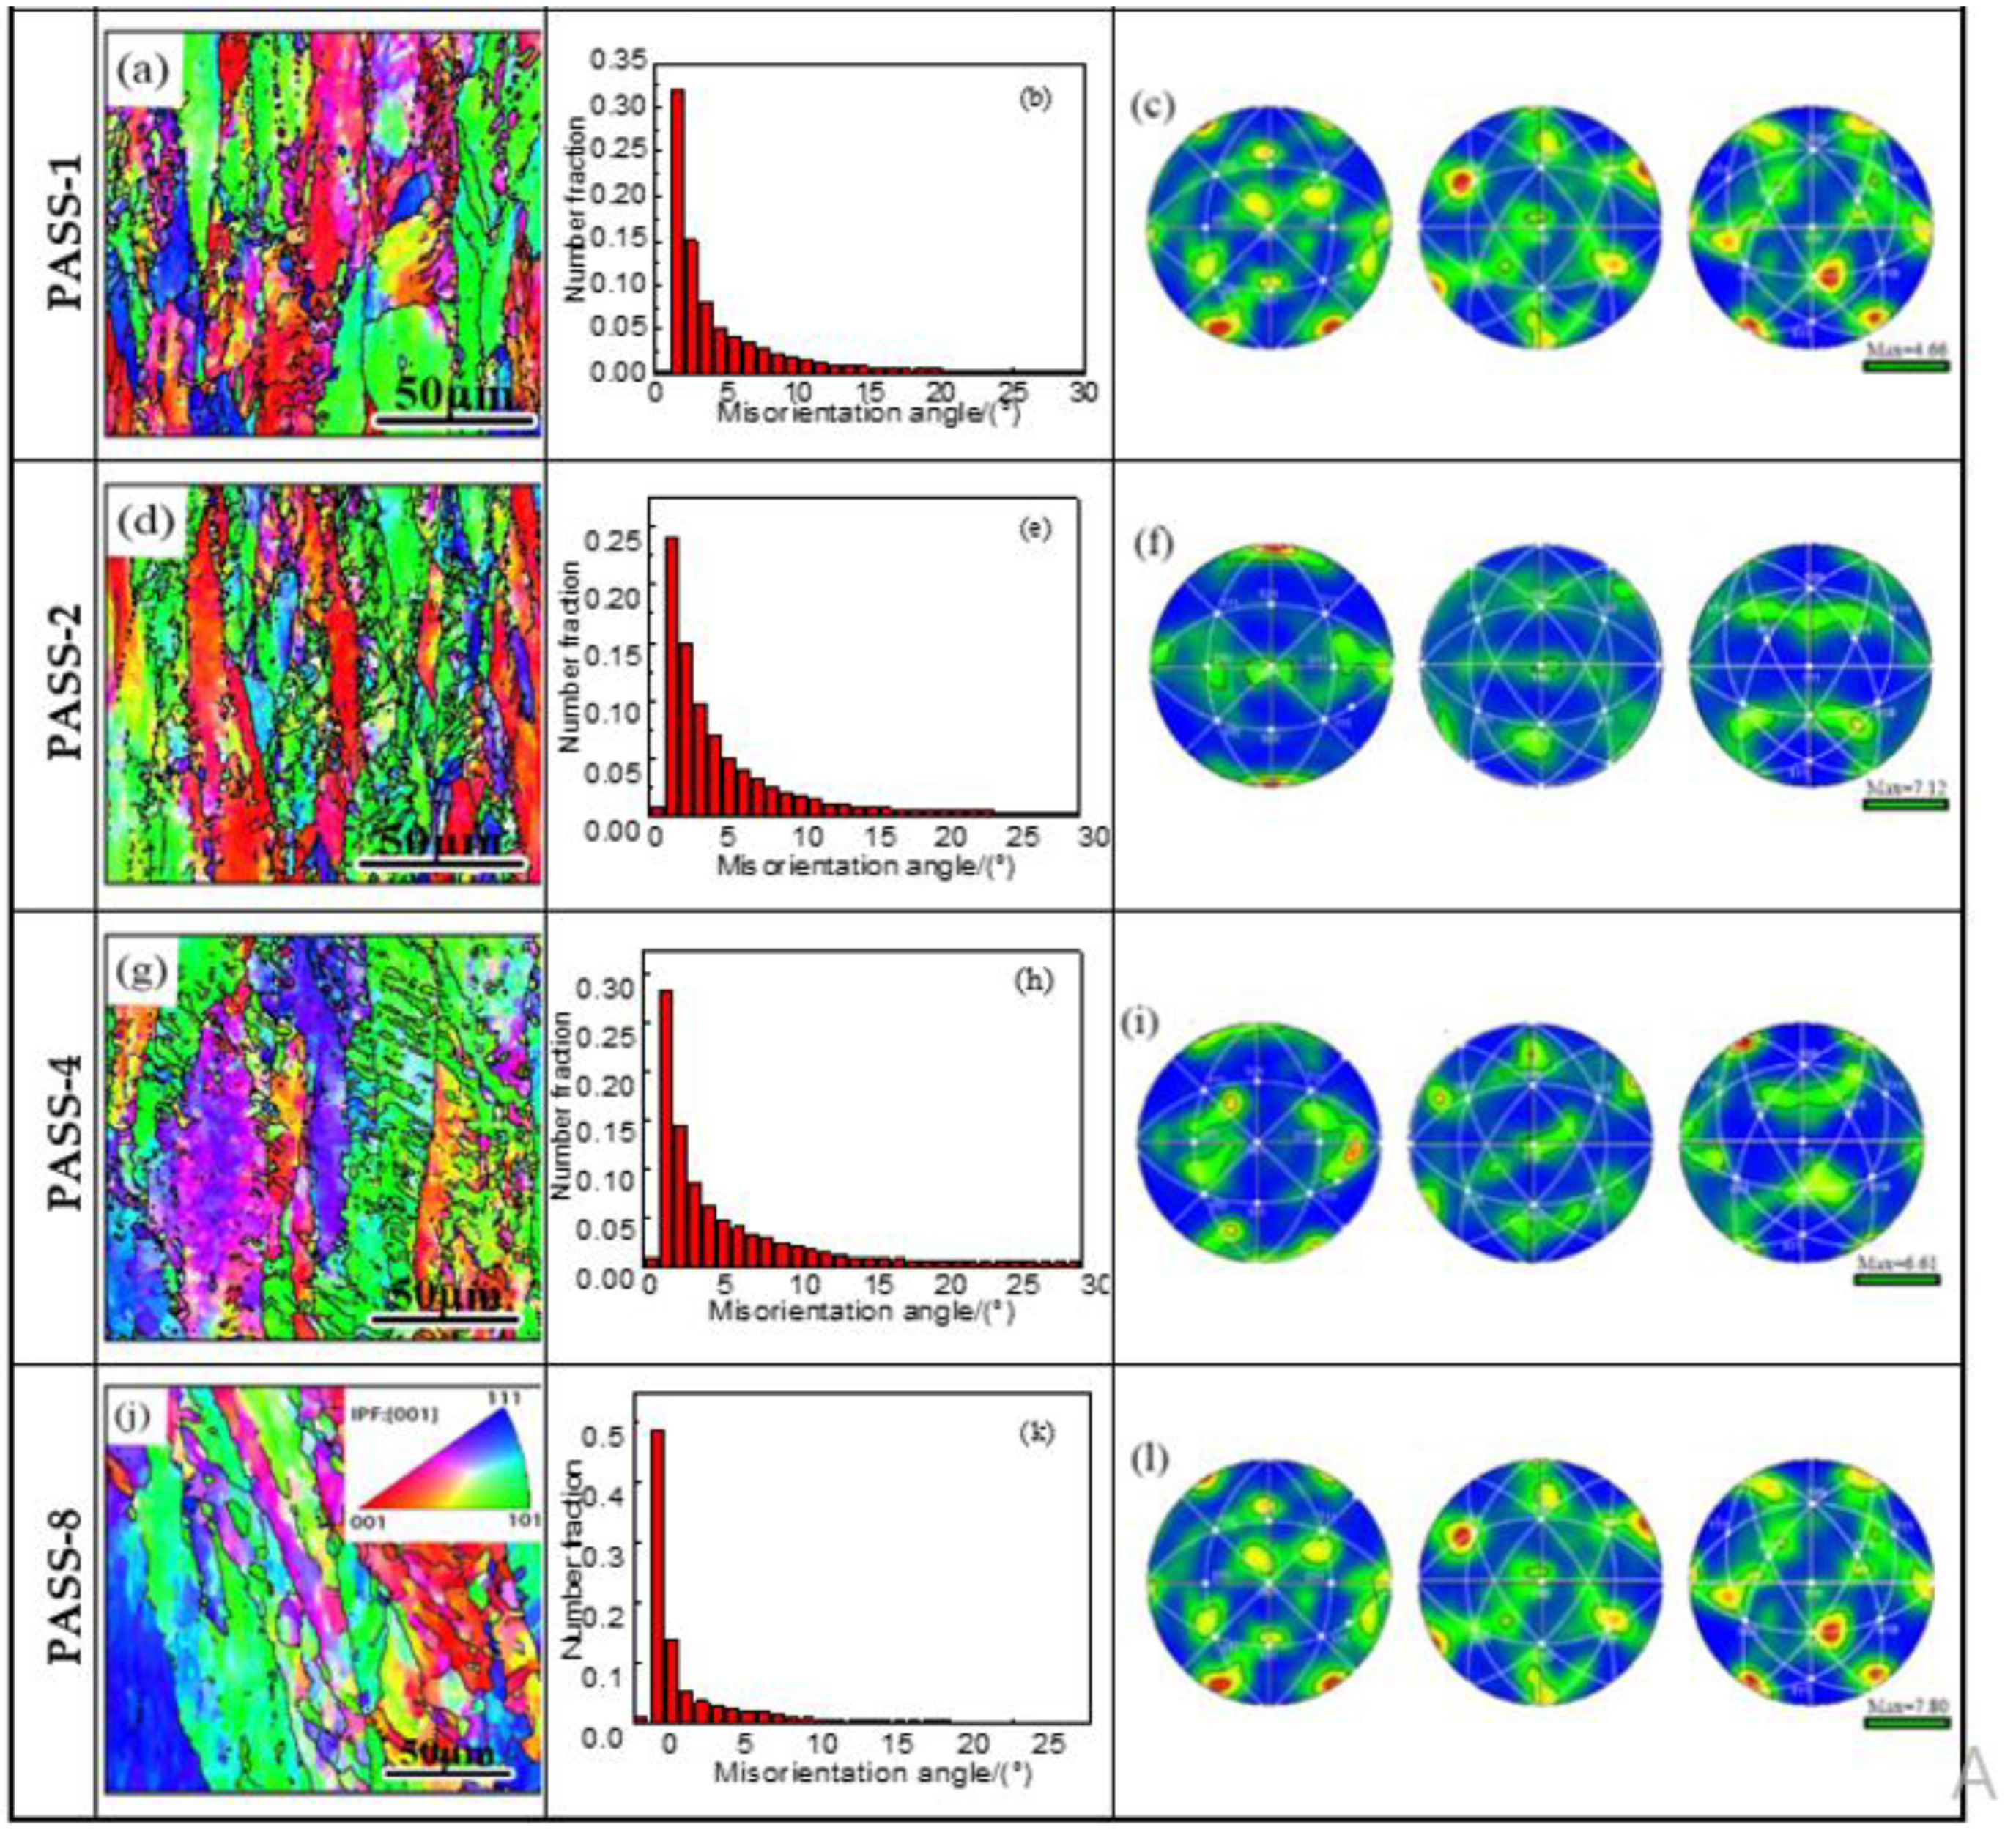
3.1. Microstructure Characterization

Figure 1 shows the evolution of the EBSD result of microstructure and misorientation, and pole diagrams of the Cu1.5Cr0.1Si alloy after ECAP deformation by route-C and aging at 350 °C for 4 h. As can be seen from the pole diagram, after one pass of deformation and aging, the grain size perpendicular to the extrusion direction is about 20 μm to 30 μm. With increasing of strain with every pass, after eight passes the dislocation density was greatly reduced, the grain orientation tended to the (111) crystal plane, and the average width of the deformed grain along the pressing direction was reduced to about 5 μm to 20 μm. Because the shear mode of each pass of the C-path deformation was opposite [22], the deformation generated by each pass offset the deformation of the previous pass, resulting in the reduction of the deformation bands of the C-path as the strain increased, with grains gradually turning to the uniform fibrous orientation. From the distribution of the GBs orientation in Figure 1, it can be clearly seen that with the increasing of deformation and aging, the low-angle grain boundaries (LAGBs) increased as the high-angle grain boundaries (HAGBs) gradually reduced. After eight passes of deformation and aging treatment, the LAGBs increased from 80% to 95%, which indicated that the aging treatment greatly eliminated dislocation and other defects in the alloy.
As shown in the orientation distribution function (ODF), after one pass of deformation and aging treatment, the strongest orientation was concentrated in the (110) crystal plane and the extreme density reached 4.66. After two passes, GBs tended to be homogenized, without obvious strong orientation, and the extreme density reached 7.12. After four passes, the preferred orientation of the crystals was again concentrated in the (110) crystal plane. After eight passes, the preferred orientation deflected clockwise by 60°, still concentrated in the (110) crystal plane, with an extreme density of 7.80, which is different from the results of previous studies on single crystal Cu [23]. At the same time, the preferential orientation was mostly segregated in the (110) crystal plane, and previous research on single crystal Cu also found that the strong orientation is easily segregated in the (110) crystal plane family, which may be a result of the grains broken and oriented along the pressure axis under the action of the applied stress, resulting in the orientation concentrated along the sliding direction.

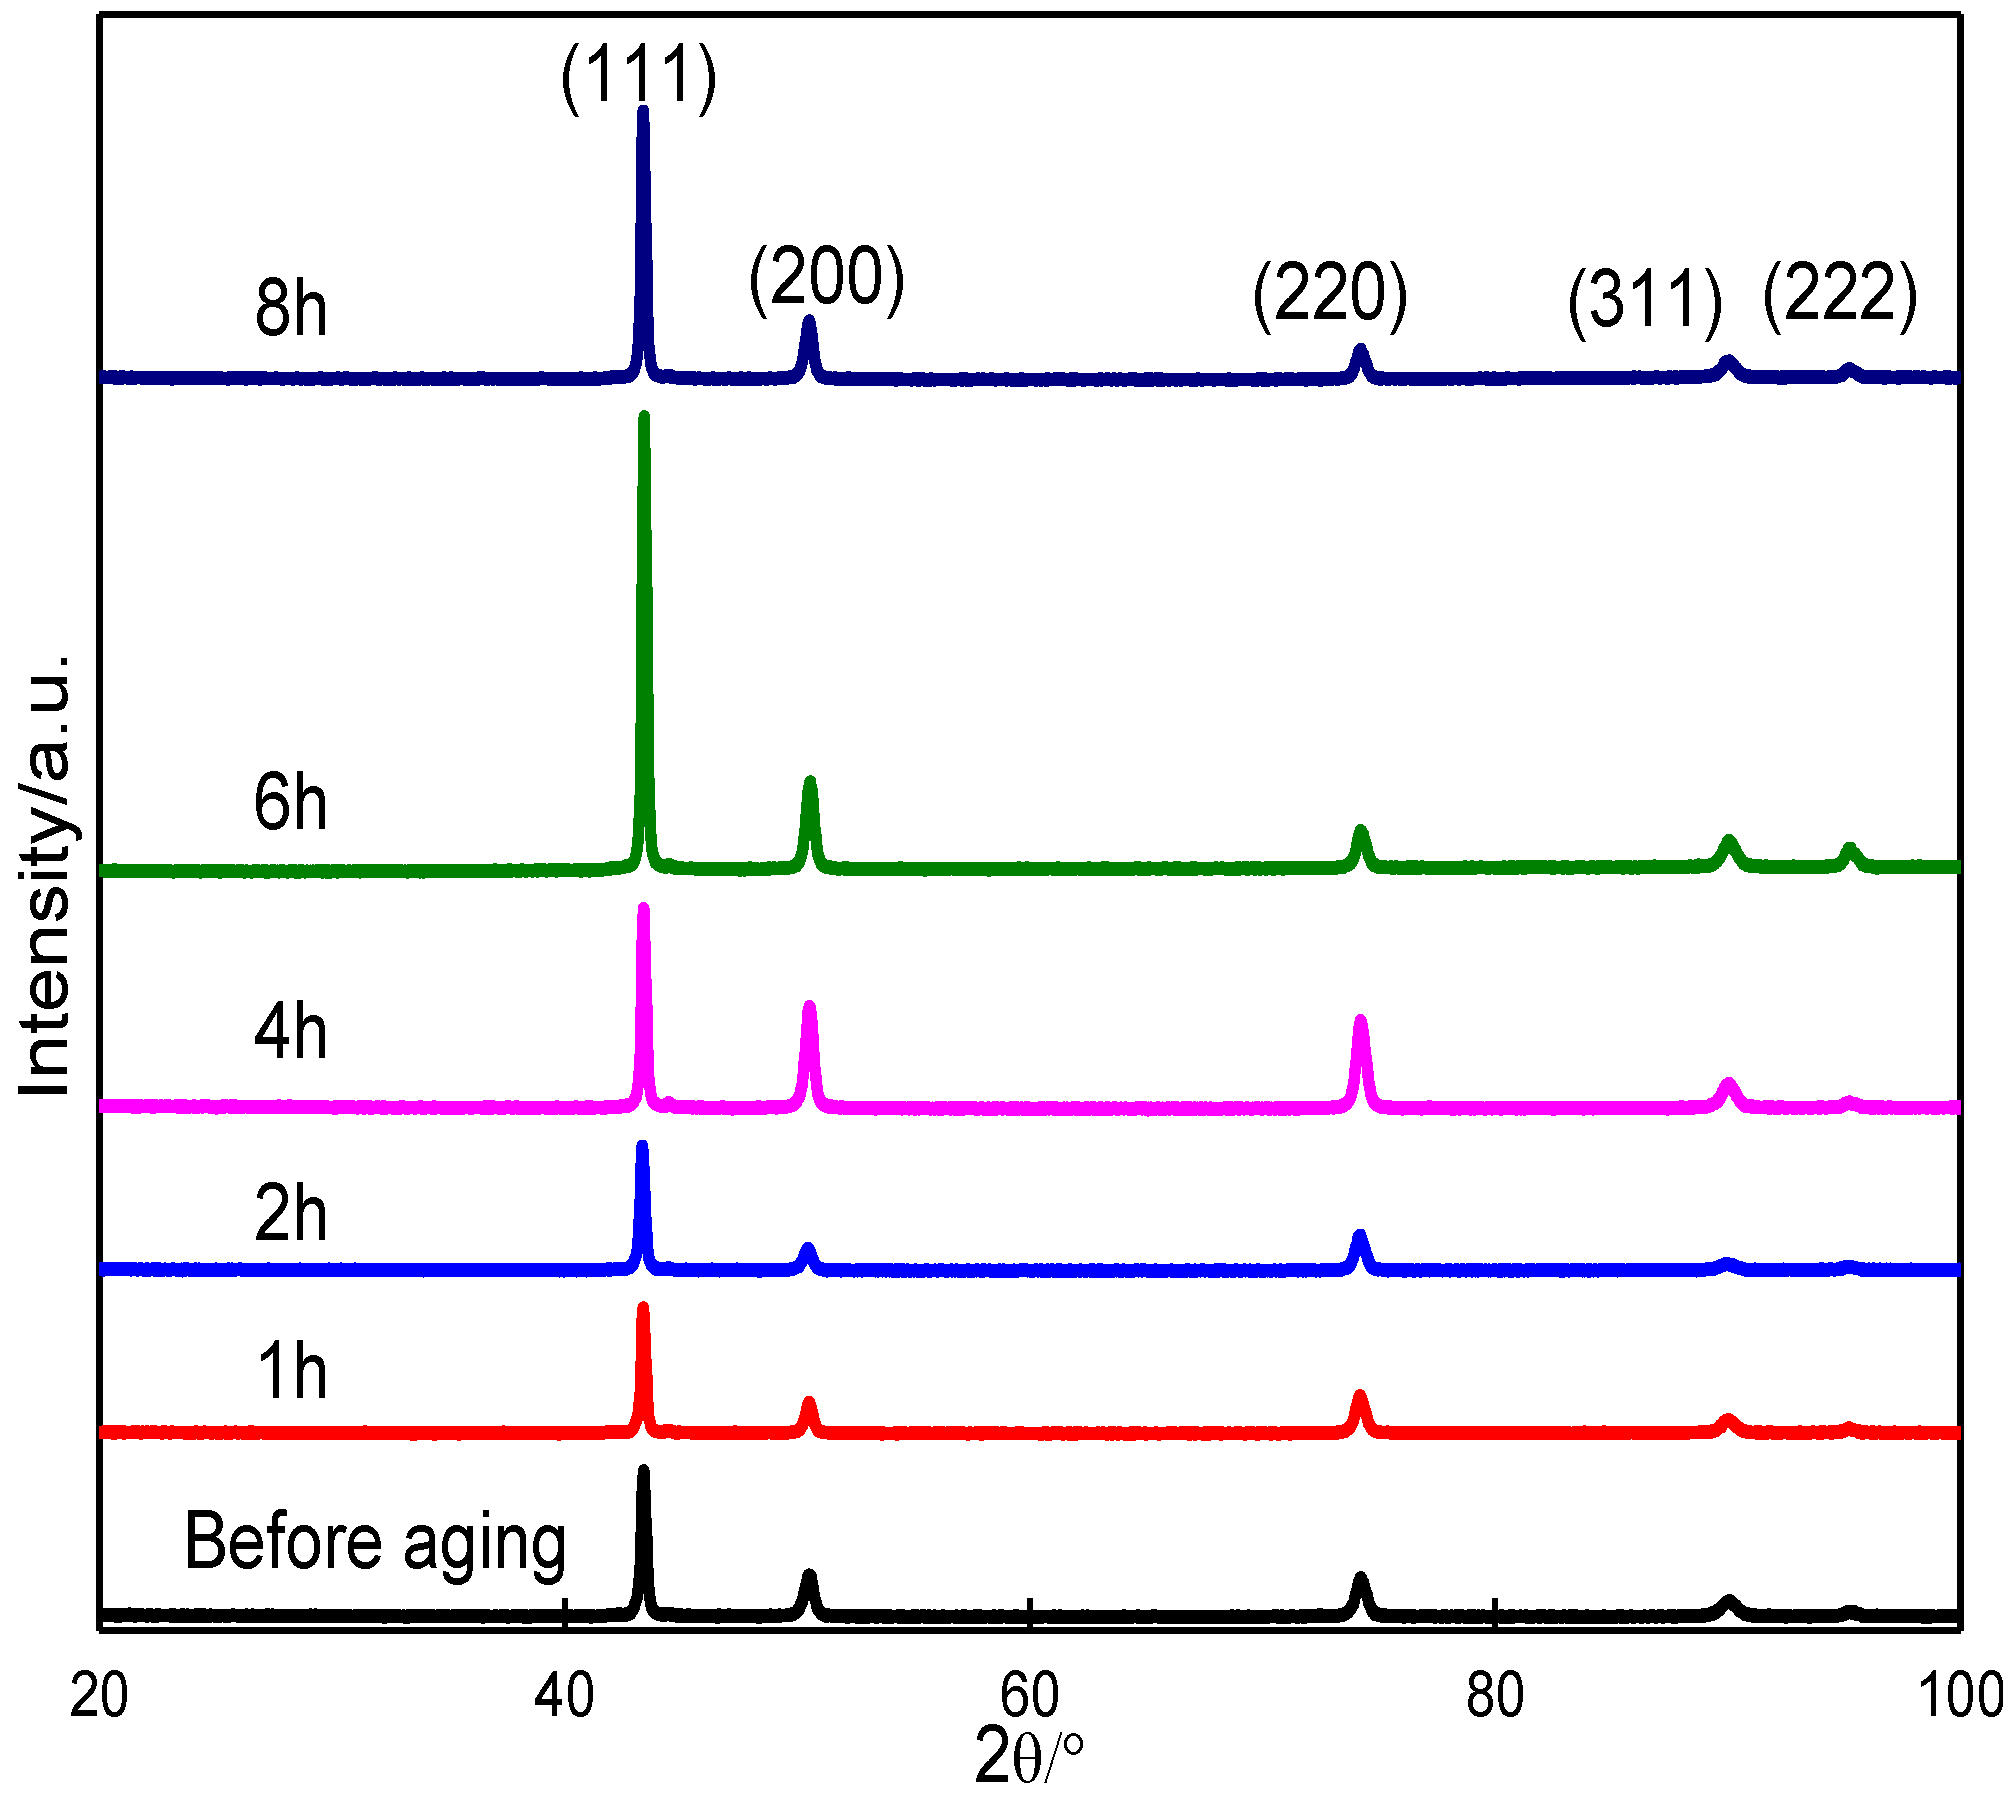
3.2. X-ray Diffraction (XRD) Analysis
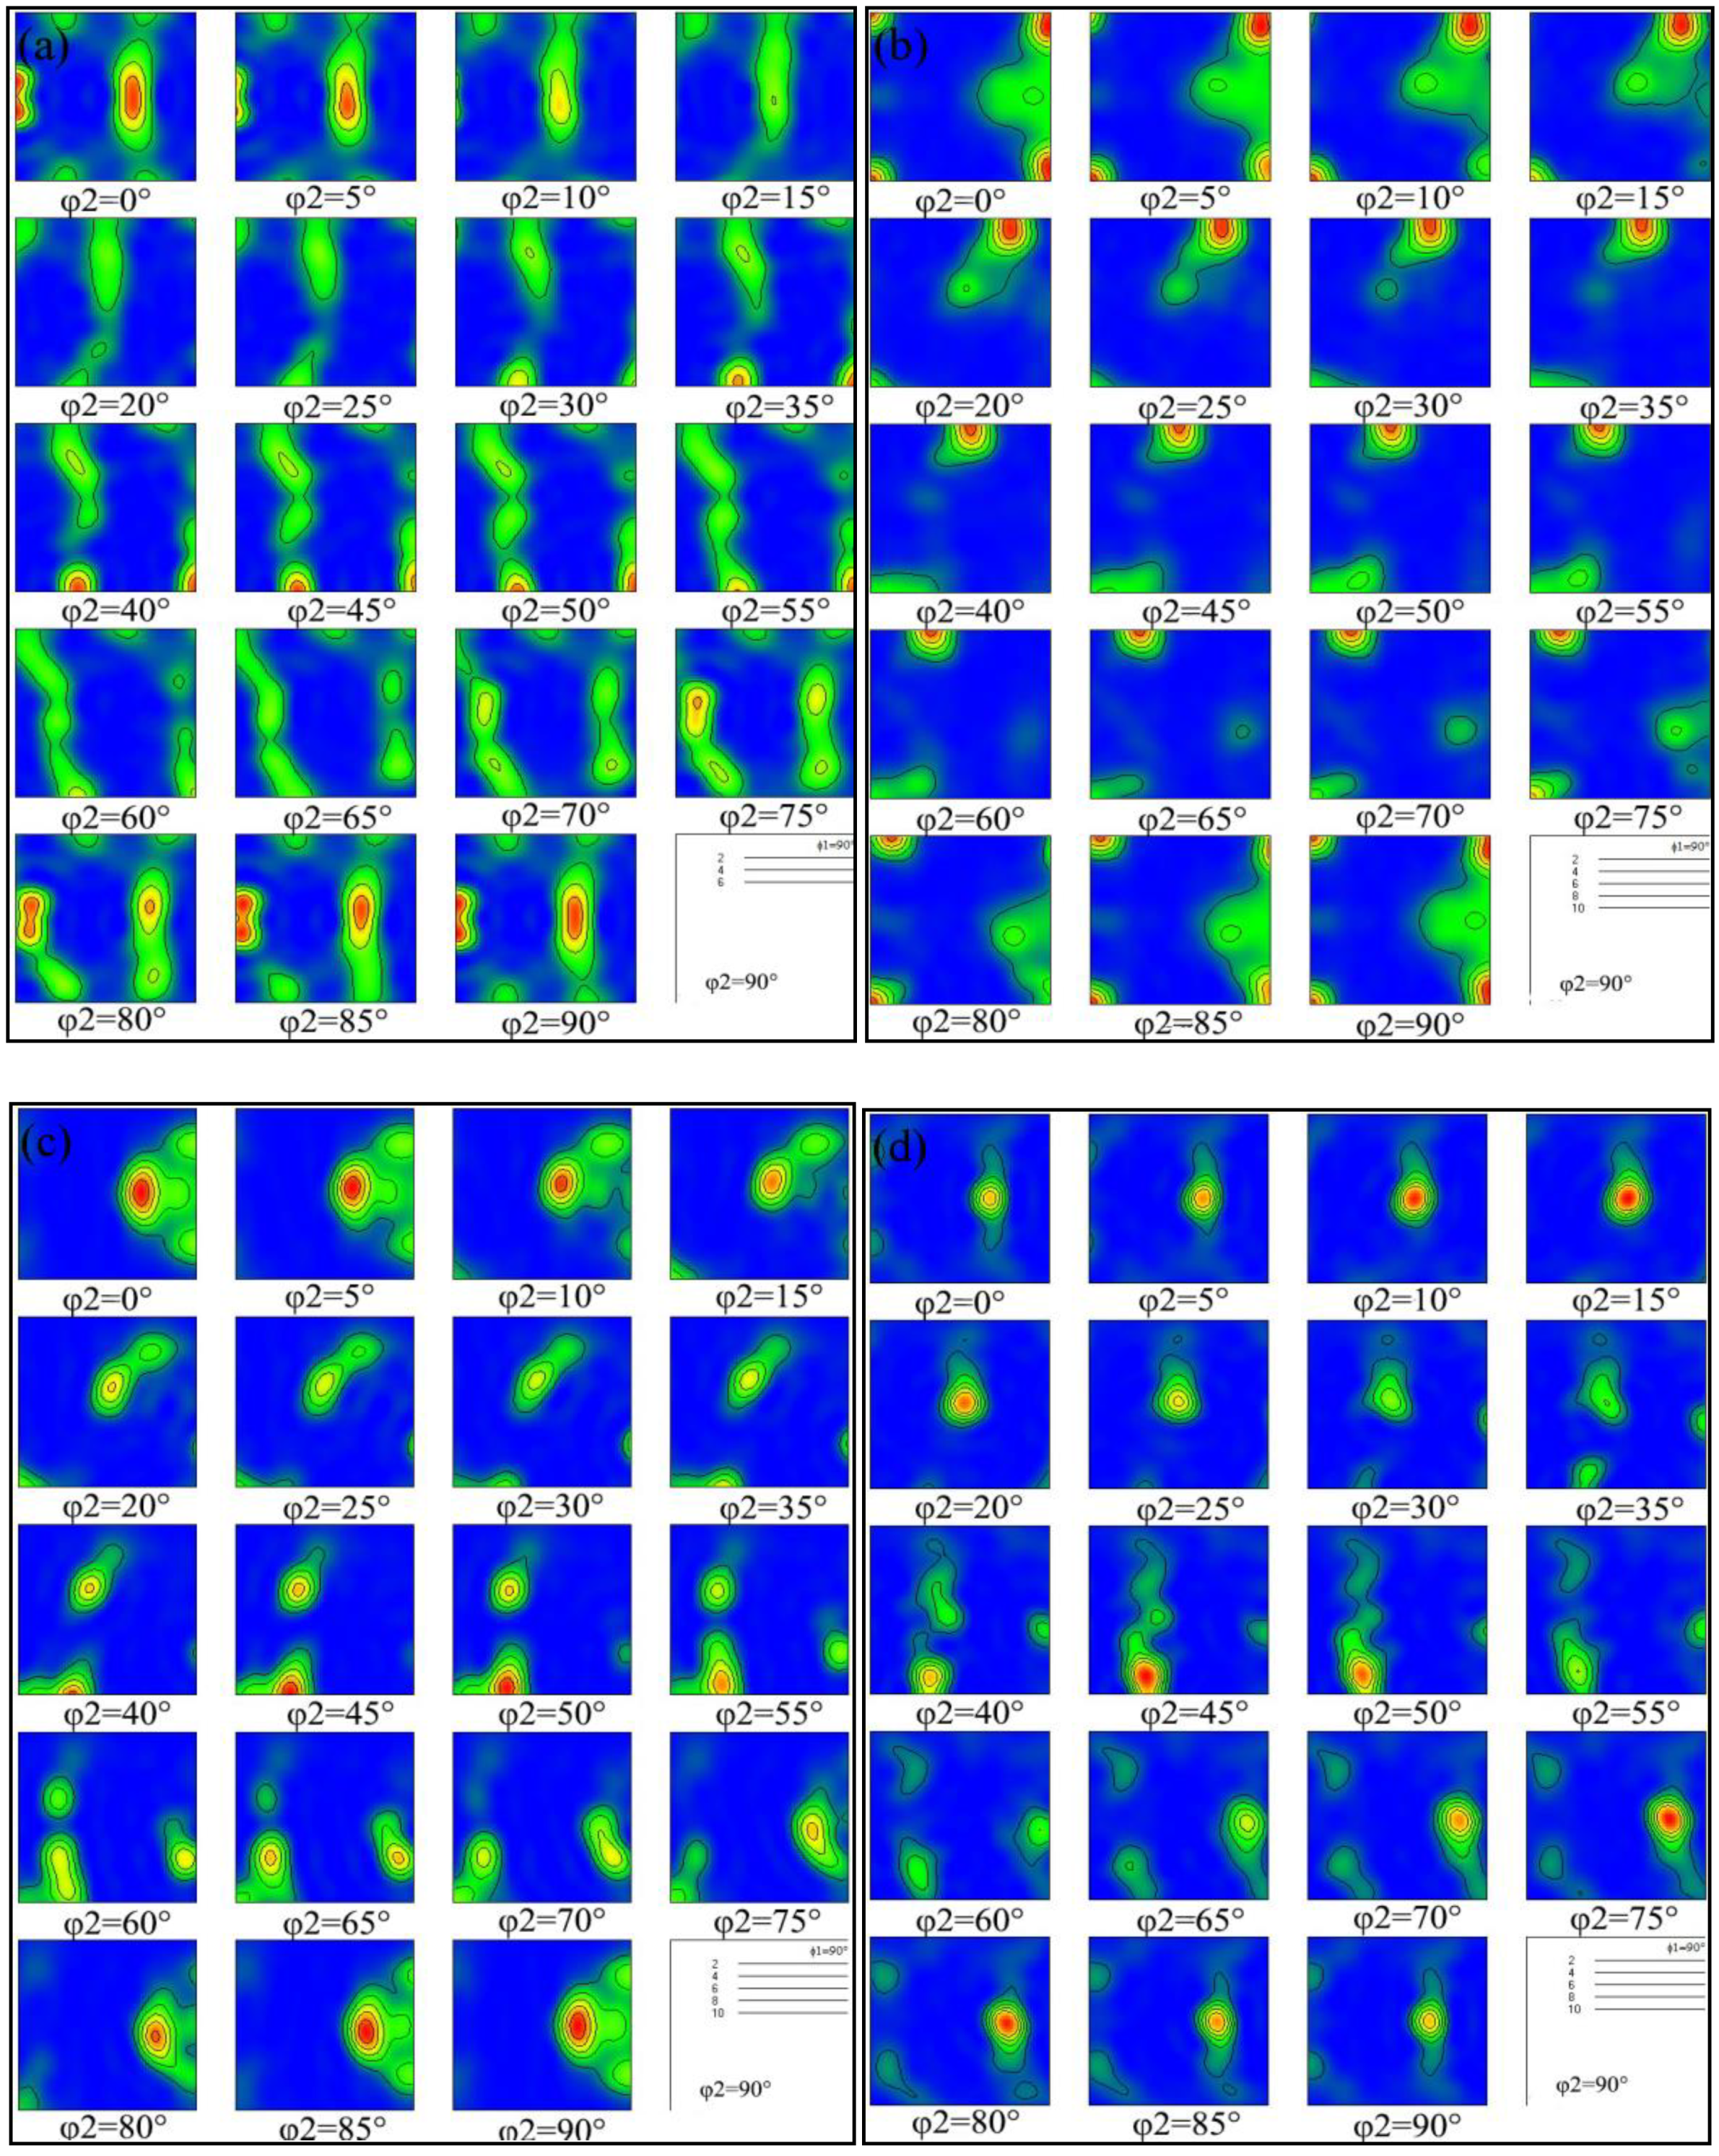
XRD patterns of the Cu1.5Cr0.1Si alloy after eight passes of C-path extrusion and different aging at 350 °C are shown in Figure 2. It can be seen from the figure that the main diffraction peak of the alloy before aging is the (111) crystal plane, and that the main diffraction peak remains the (111) crystal plane after aging. The relative intensity of the (111) and (200) crystal plane diffraction peaks increased continuously before aging for 6h, and the intensity of the (111) crystal plane diffraction peaks decreased relatively after 8 h, while the width of the diffraction peaks increased throughout the aging treatment. The analysis suggests that the precipitation of a large number of strengthening phases near the (111) crystal plane during the aging process, and the superposition of the precipitate phase peak and the matrix peak, resulted in a significant increase in the diffraction peak intensity [24]. The decrease after 8 h occurred because the number of precipitated phases gradually decreased, as the material was in an over-aged state. The increase in diffraction peak width was due to grain fibrosis and the precipitation of nano-scale precipitated phases after deformation and aging. It was found in the XRD phase search that the precipitated phases were mainly CrxSi strengthened phases and the chromium phase, mainly because the Cr element and Cu were difficult to dissolve. In addition, there was no significant change in the other diffraction peaks except the main diffraction peak, which indicates that the crystal slip was suppressed and the cross slip phenomenon was significantly reduced.

3.3. ODF Analysis

Figure 3 shows the orientation distribution function diagram (ODF) of the Cu1.5Cr0.1Si alloy ECAP deformation by route C and aging at 350 °C for 4 h. As can be seen from Figure 3, the crystal orientation is concentrated around {110} <112> and {110} <001> after oneone pass of deformation and aging treatment, which belong to the brass texture and Gaussian texture, respectively. After two passes and aging, the textures of {110} <112> and {110} <001> were significantly reduced and transformed into {001} <100> cubic textures. After four passes and aging, the crystal texture gradually turned to {110} <112>. The strong {110} <112> and {111} <110> textures were finally formed after eight passes and aging. This demonstrated that with the increase of the strain variable, the preferred orientation of the texture changed continuously until finally a relatively stable {hkl} <110> texture was formed inside the crystal. Previous studies have shown that a stable {hkl} <110> texture can reduce the degree of electron scattering and increase the conductivity of the material. Because the {111} <110> texture indicates that there are a large number of grains with {111} <110> orientation in the crystal, Cu alloys are face-centered cubic crystals (fcc). While the face-centered cubic metals have close-packed and densely packed atoms, the direction is exactly that of the {111} <110> direction. At this time, the number of atoms in the crystal was the highest, and the metal had conductivity due to the movement of the outermost electrons of the atom. The highest atomic number represents the highest number of free electrons. Therefore, the {111} <110> texture could improve the conductivity of the material.

4. Discussion

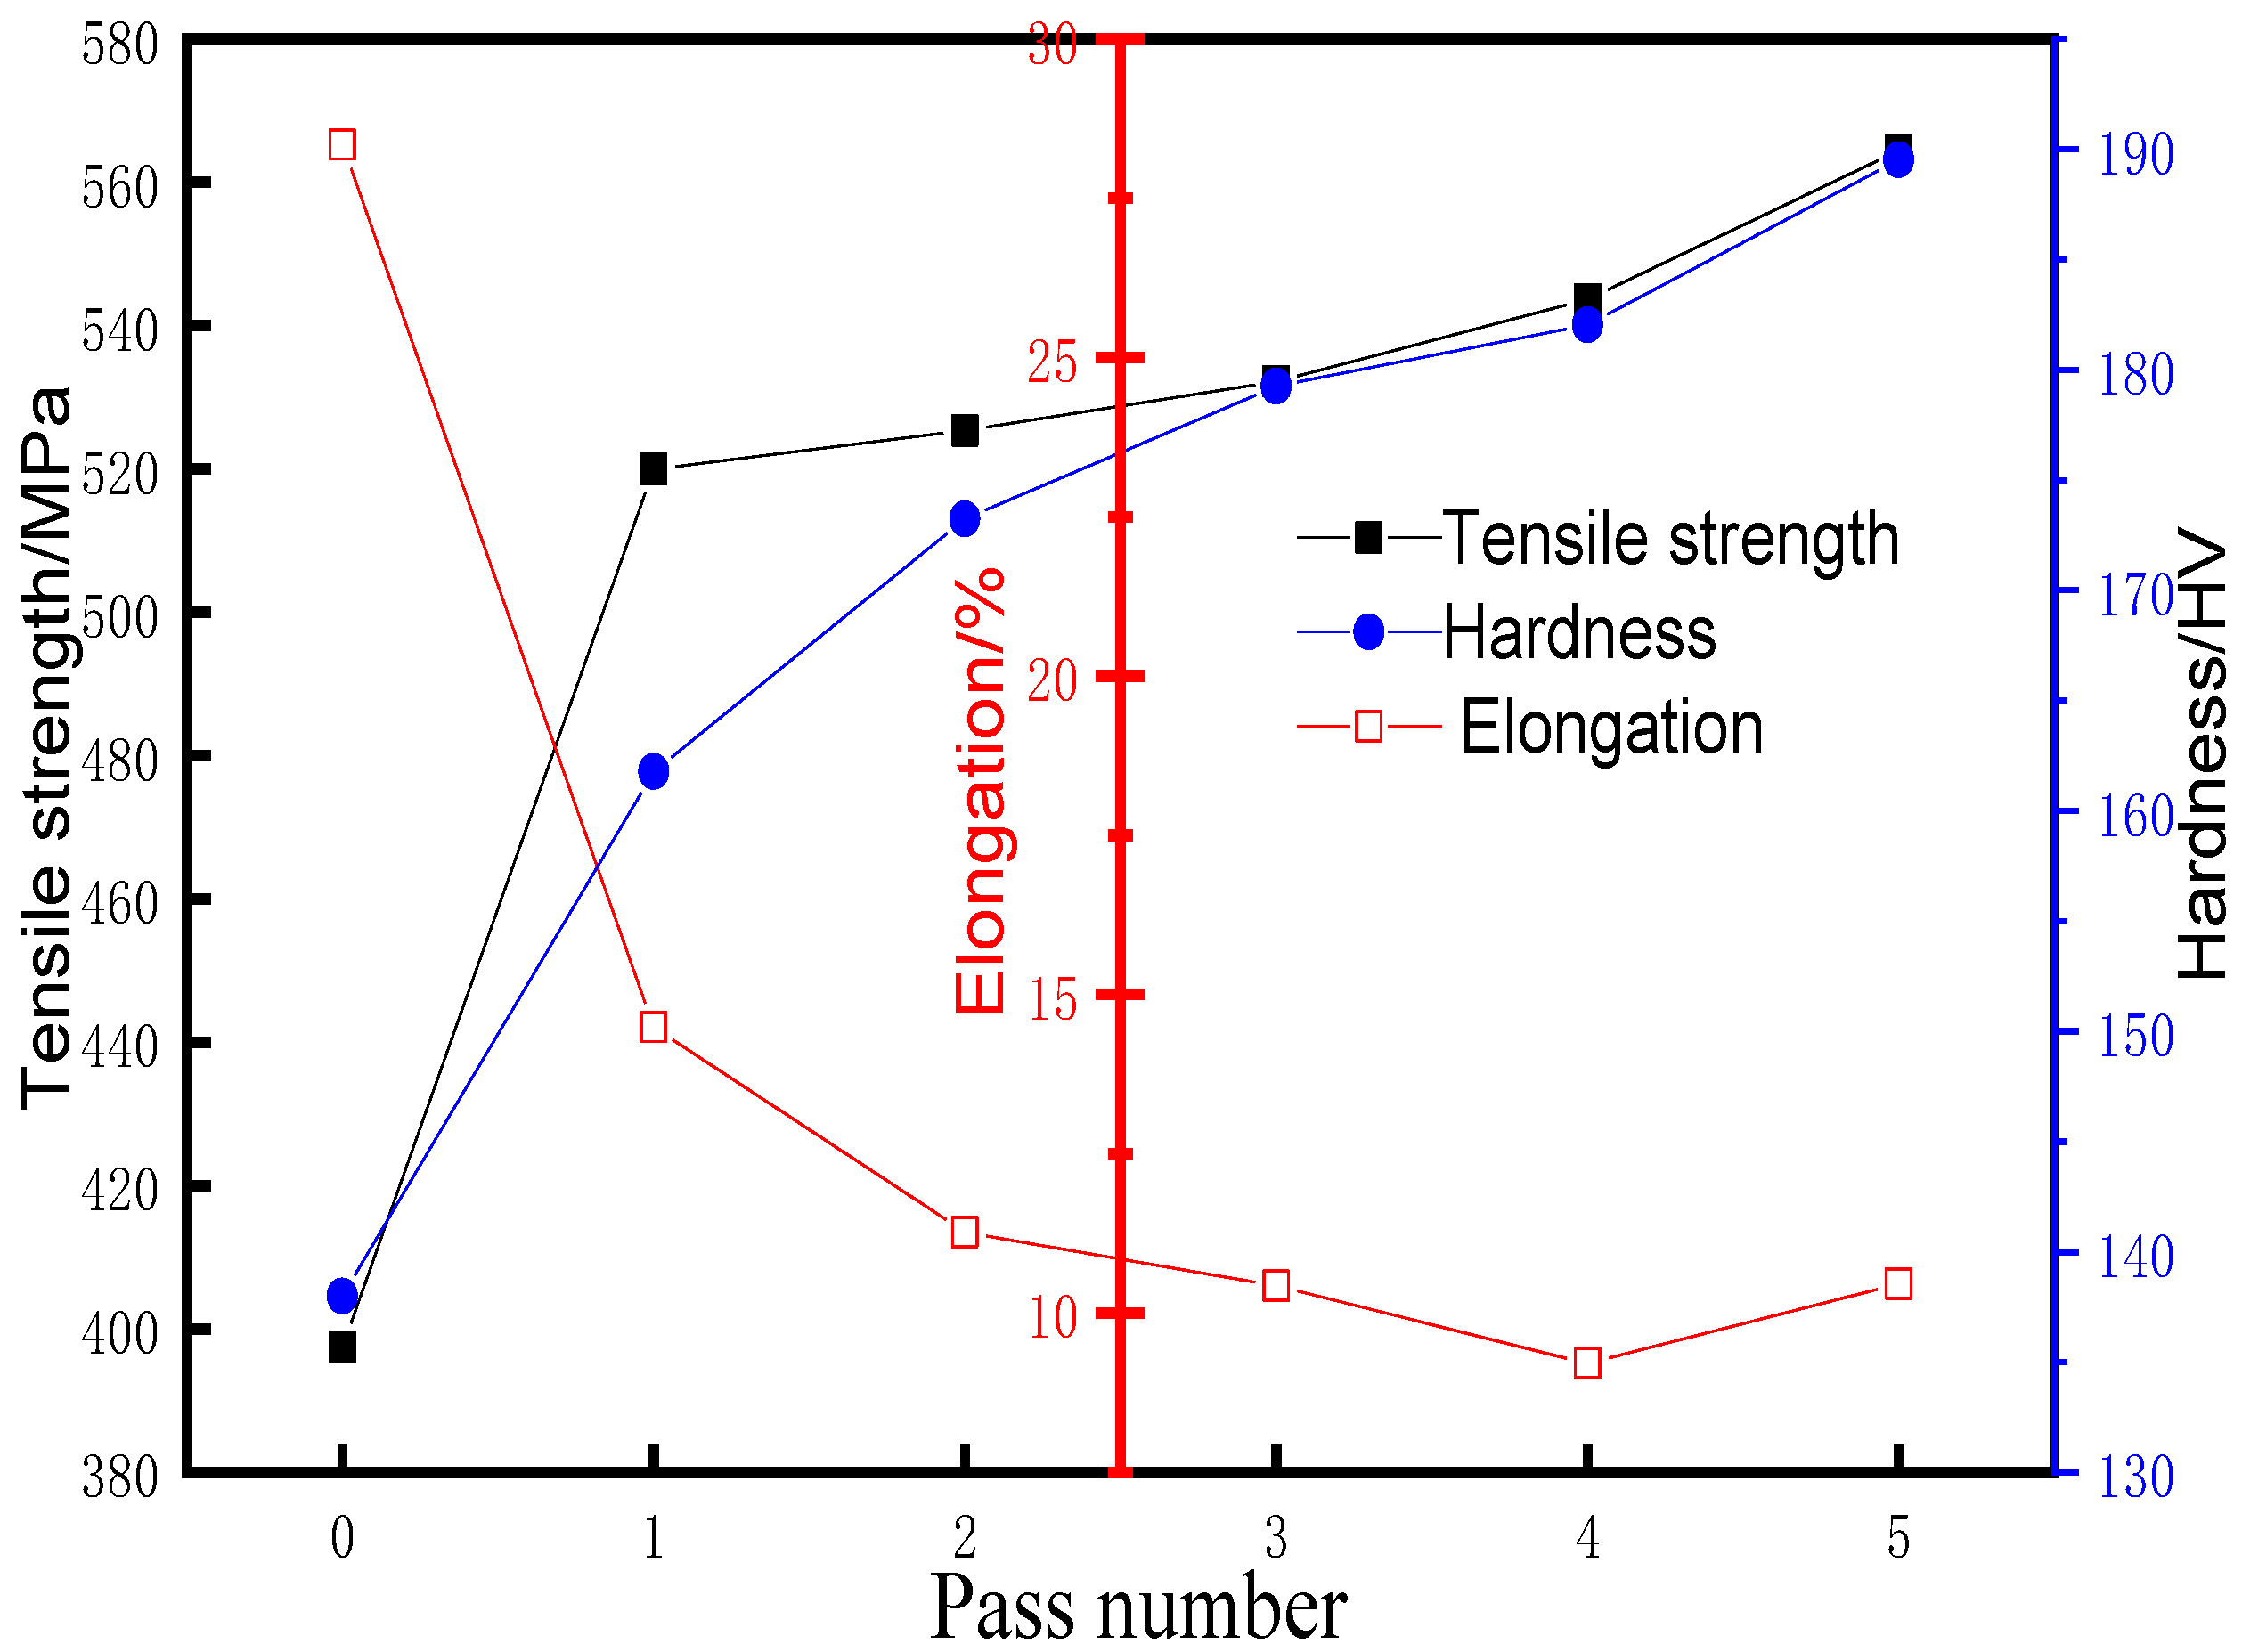
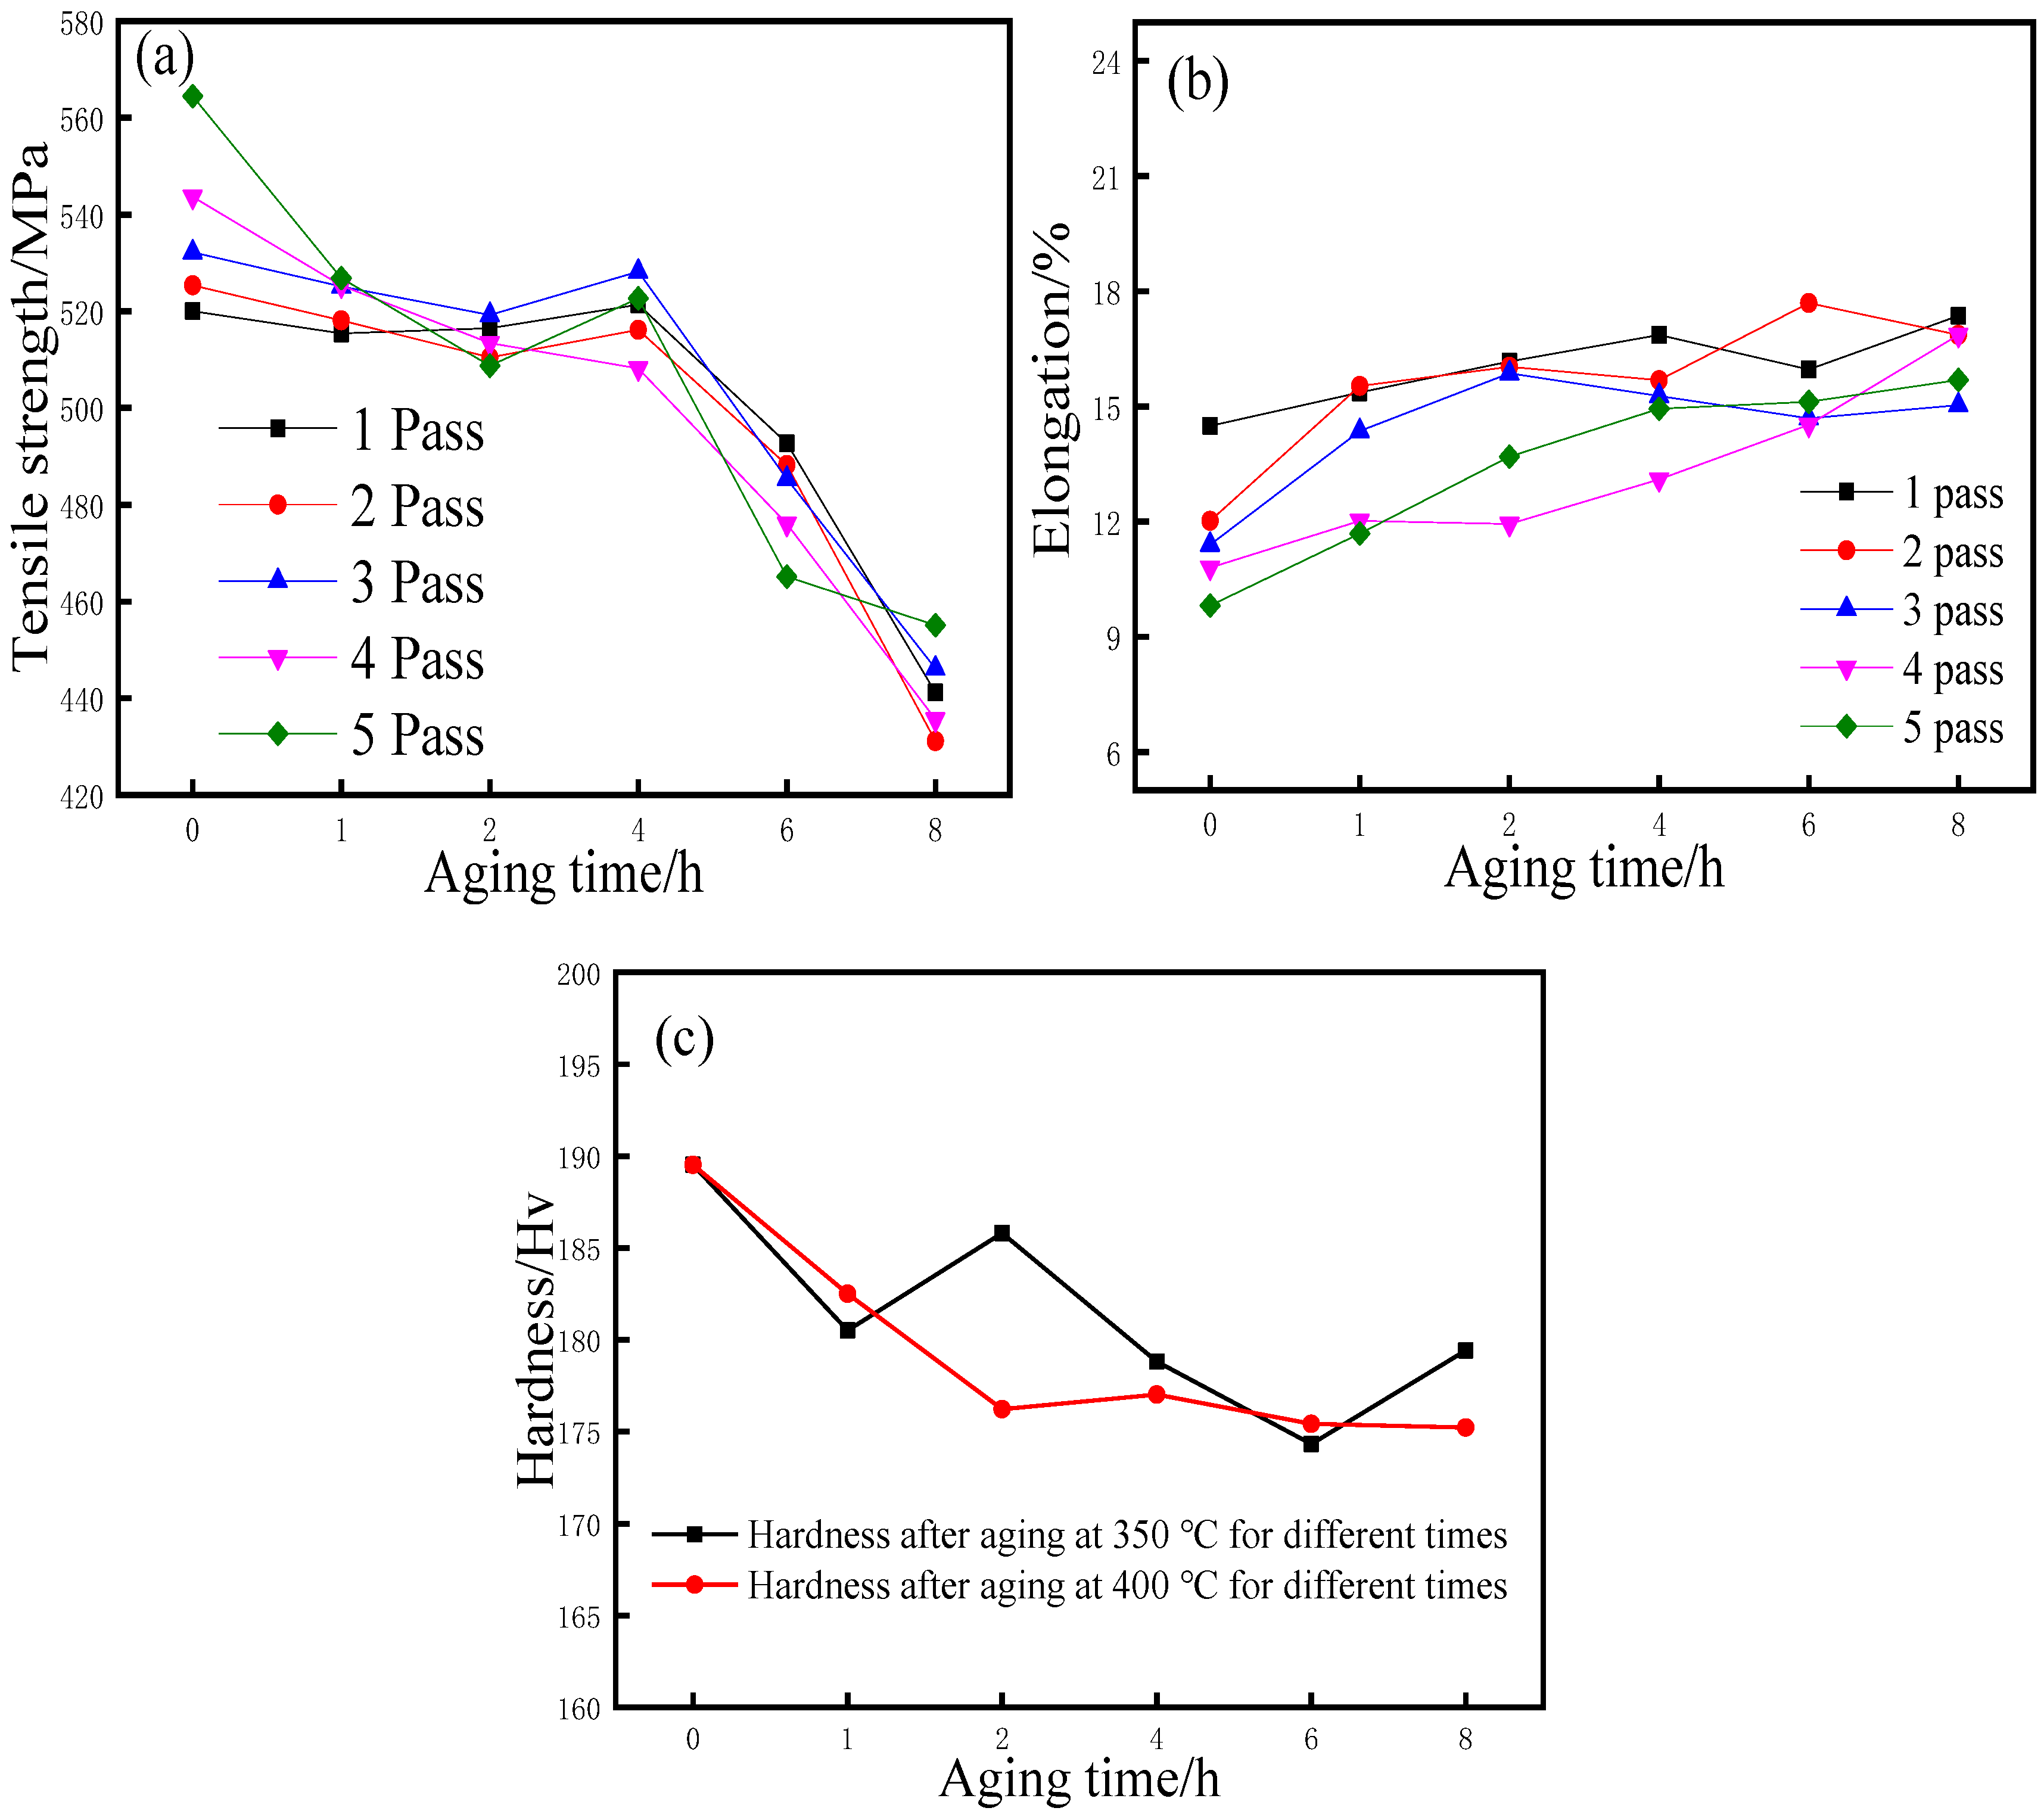
4.1. Mechanical Properties Analysis

Figure 4 shows the hardness, tensile strength, and elongation of the Cu1.5Cr0.1Si alloy after five passes of ECAP deformation by route C. As can be seen, the original hardness of the Cu1.5Cr0.1Si alloy was 138.00 HV, which increased to 188.52 HV after five passes of deformation, and the increase range reached 36.60%. The tensile strength of the alloy before deformation was 397.50 MPa, and its change trend was consistent with the hardness curve. The strength, however, increased sharply after one pass of deformation, from 397.50 MPa to 520.00 MPa, an increase of 30.82%, and to a maximum of 573.54 MPa after five passes of deformation. It can be seen from the elongation curve that the elongation before deformation was 28.30%, and that the elongation decreased the most after one pass of deformation to 14.49%; after five passes it decreased to 10.46%. The analysis shows that the increase in strength and hardness was mainly due to the strengthening of grain refinement, the increase of broken small-angle grain boundaries, and the increase of dislocation density during the ECAP deformation process, as well as the precipitation of some strengthened phases due to the temperature rise effect under high strain. Precipitation strengthening occurred, increasing the strength and hardness of the material. Therefore, the strength and hardness still increased after five passes of deformation. The decrease in elongation was mainly due to the increase in dislocation density during deformation, which made slippage difficult and caused plasticity to decrease.
Figure 5a–c shows the strength, elongation, and hardness of the Cu1.5Cr0.1Si alloy after five passes of ECAP deformation by route C and 350 °C aging treatment. From the strength evolution trend of Figure 5a, we see that the strength decreased continuously after aging. This is because the dislocation density decreased and the strengthening effect was weakened at the beginning of aging. The difference is that the material strength increased during the aging of 2 to 4 h. According to the analysis, the strength of the material increased due to the dispersed distribution of the precipitated phase at this time; and after 4 h of aging, the strength of the material decreased sharply. This decrease was the most significant, reaching about 15%−14.83%. The growing phase destroyed the coherent relationship with the matrix, resulting in a decrease in the strength of the material. It can be seen in Figure 5b that as the aging time increased, the elongation of the material generally showed an upward trend, and in some passes we see a decrease in the later period of aging. This may be because the strengthening phase precipitated in the later period of aging hindered the movement of dislocations. The elongation of the material decreased, with the elongation after the first deformation always remaining the highest. It can be seen that the plastic deformation had a relatively large impact on the elongation of the material.
As shown in the hardness curve in Figure 5c, during the aging process at 350 °C, the hardness shows a downward trend, but a significant increase occurred after 1 h. This was due to the large number of dislocations annihilating and disappearing after aging at 350 °C. The strengthening effect caused by deformation was largely eliminated, and in the early stage of aging the number of precipitated phases was not enough to strengthen the material; as a result, the hardness of the material was reduced [25]. With the increase of aging time, the precipitation phase increased and pinned with dislocations, which greatly increased the shear stress required for a dislocation slip, slowing down the dislocation annihilation speed and at the same time hindering dislocation movement along the sliding surface; therefore, the hardness of the material was increased. The gradual growth of the precipitated phase destroyed the coherent relationship within the matrix, which caused the alloy to soften and reduce the hardness, so the hardness curve at 350 °C dynamically fluctuated. During the aging process at 400 °C, the hardness of the material continuously decreased, with the largest decrease in hardness occurring at 0–2 h and then gradually flattening. This is because the work hardening effect of ECAP was gradually eliminated after aging at 400 °C for 2 h, and the hardness of the material was reduced. However, due to the higher aging temperature, the number of precipitated phases was greater, and the hardness of the material increased. The combined effect of the two resulted in the material. The hardness value remained dynamic and stable.

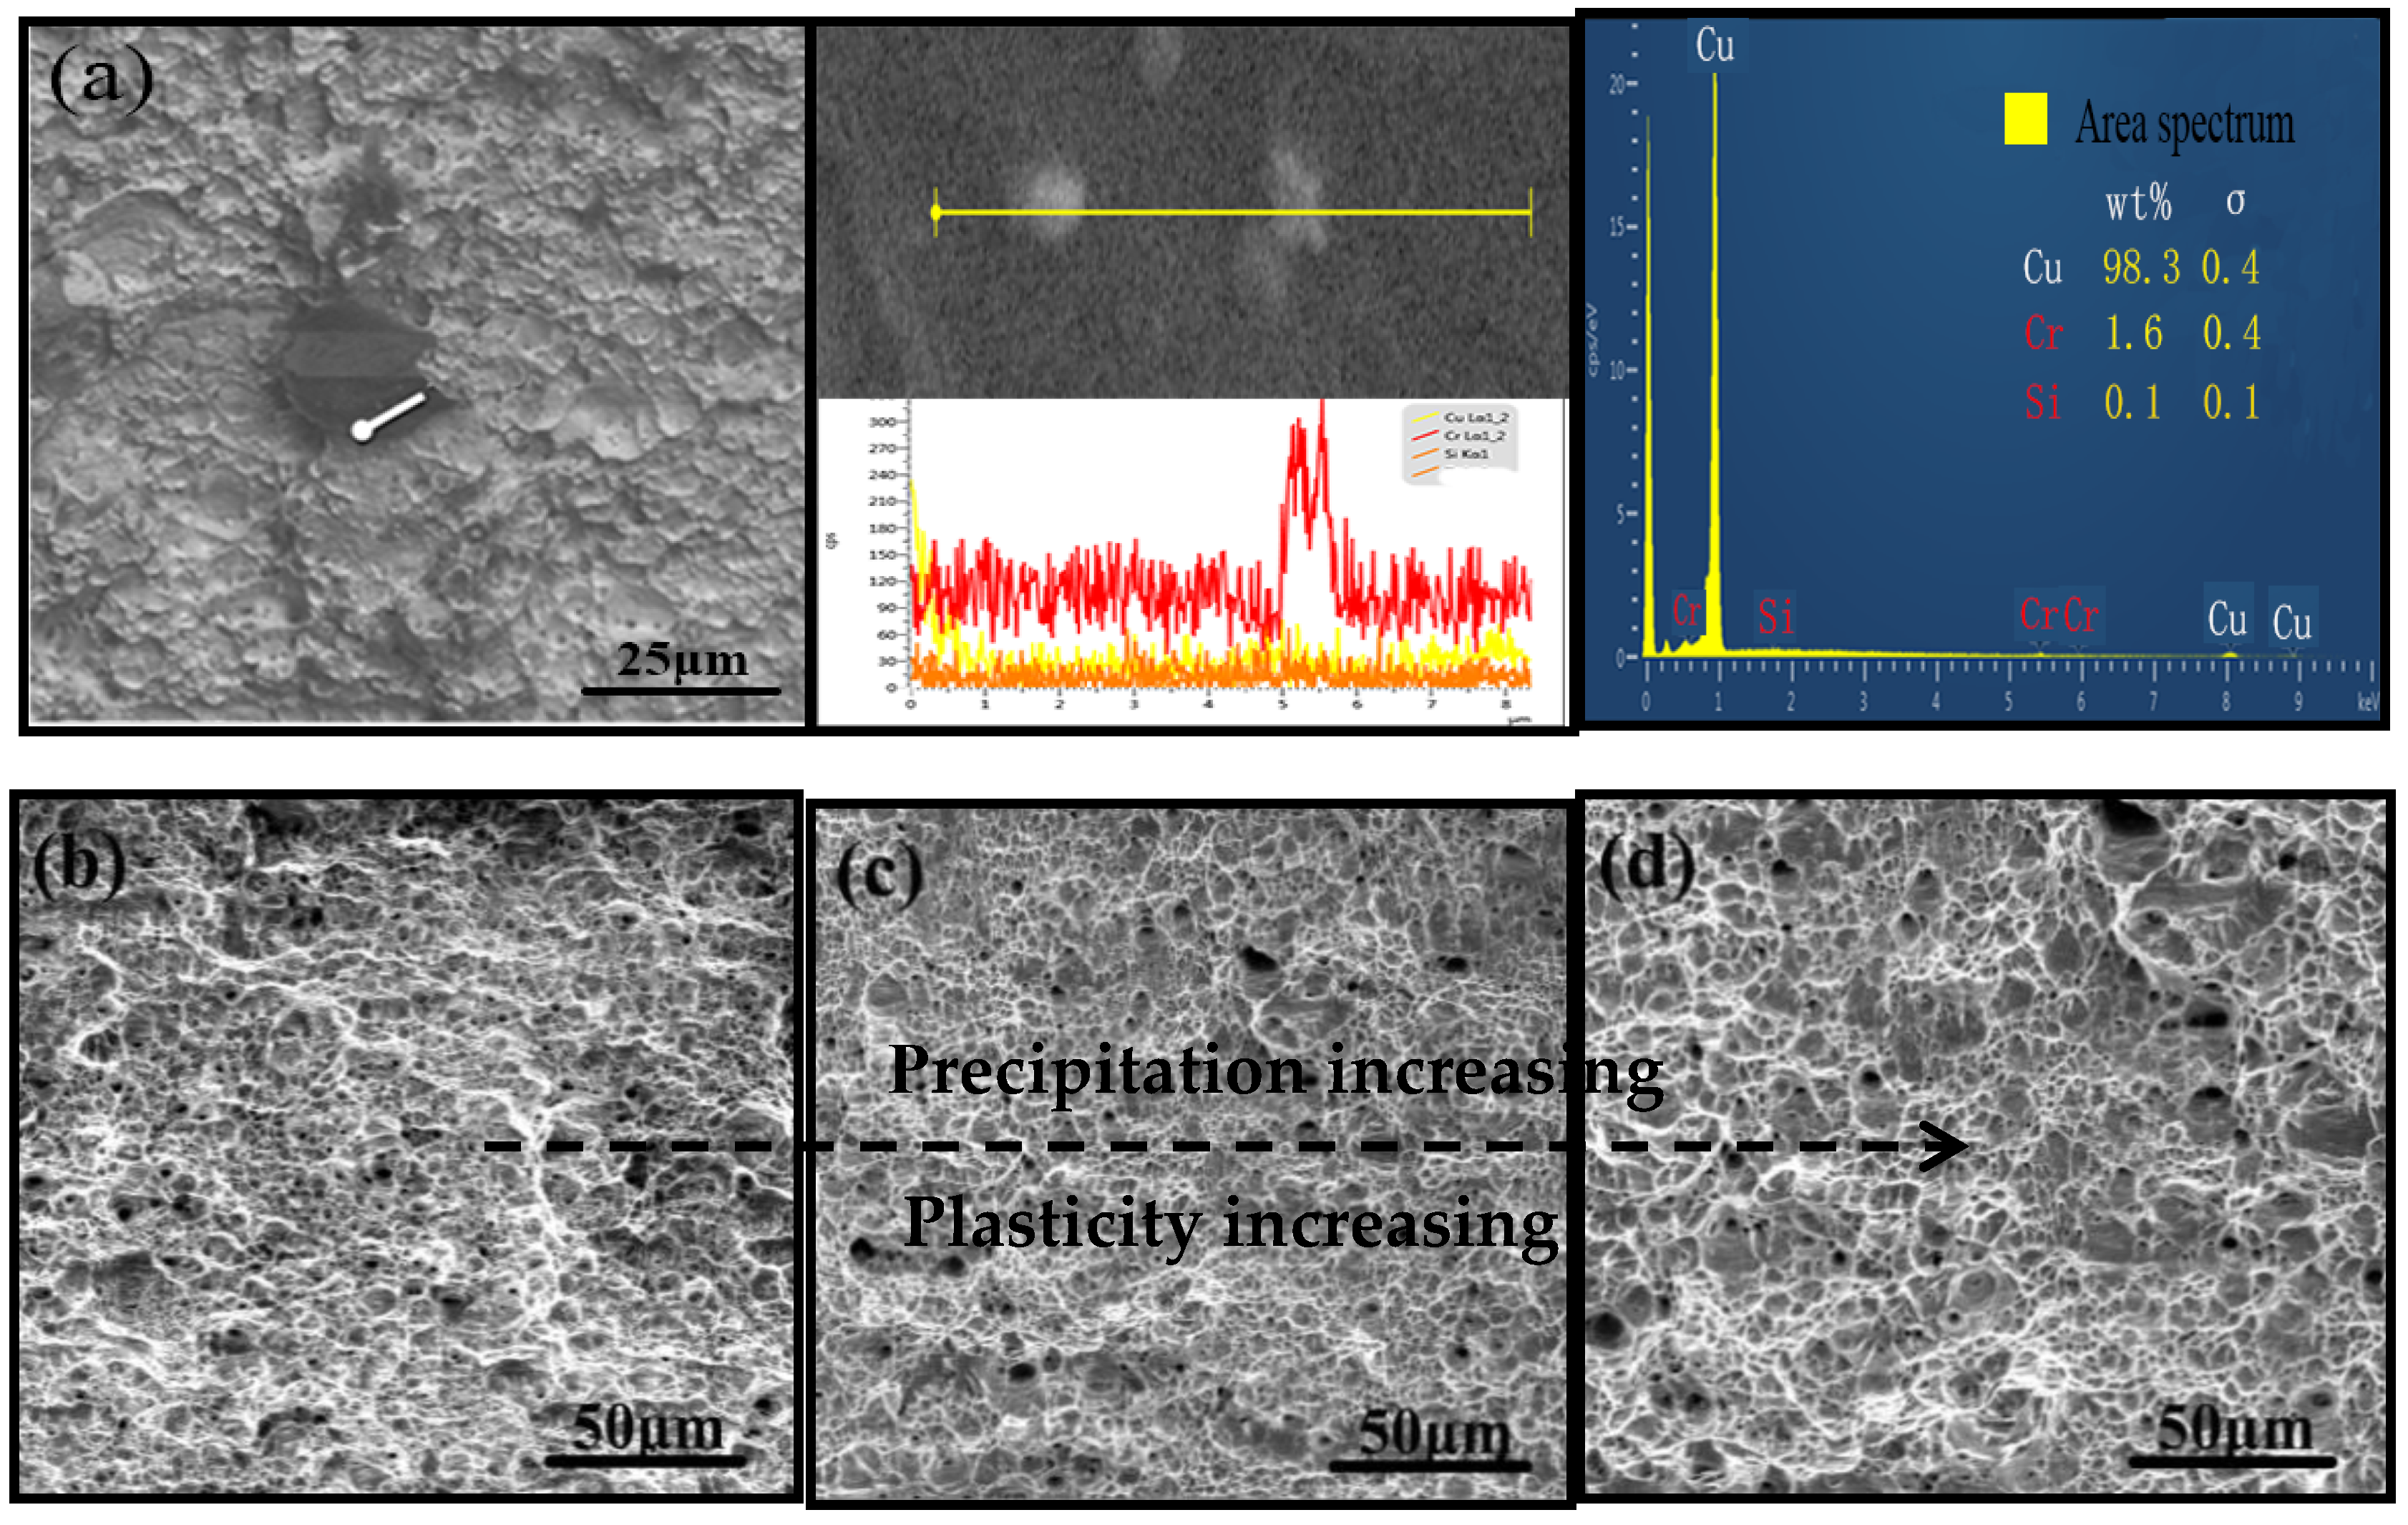
4.2. Fracture Characteristics

Figure 6 shows the fracture map of the Cu1.5Cr0.1Si alloy after five passes ECAP deformation by route C and aging at 350 °C. It can be seen from the energy spectrum of the fracture in Figure 6a that there is a precipitated phase at the fracture. The precipitated phase is mainly Cr and a small amount of Si element. This is mainly because the Si element is a trace amount of Cu-1.5Wt% Cr-0.1Wt% Si. The precipitation degree of alloying elements was relatively limited. As the aging time increased, the precipitation phase also increased, and it was dispersed in the alloy as a reinforcing phase. From the microscopic fracture morphology in Figure 6, it is observed that the fracture morphology was a typical microporous aggregate, which was composed of the dimple zone and the tear zone. The fracture was distributed, with a large number of dimples and tear edges of different sizes. As shown in Figure 6b, the morphology of the large dimple surrounding the small dimple appeared at the fracture after 4 h of aging, and this morphology depended on the order of the nucleus and the expansion of the dimple. In addition, there were more obvious dimple veins at the fracture, which were formed by parts of the dimples growing. After 8 h of aging, the dimples tended to be small and uniform, mainly presenting as shallow isometric dimples. It can be seen from the fracture map that the fracture mode of the material was obviously ductile fracture. The aging treatment eliminated the work-hardening phenomenon caused by the high strain after ECAP deformation, and the ductility of the material also increased. It can be seen that the aging treatment could help improve the Cu1.5Cr0.1Si alloy’s plastic toughness.

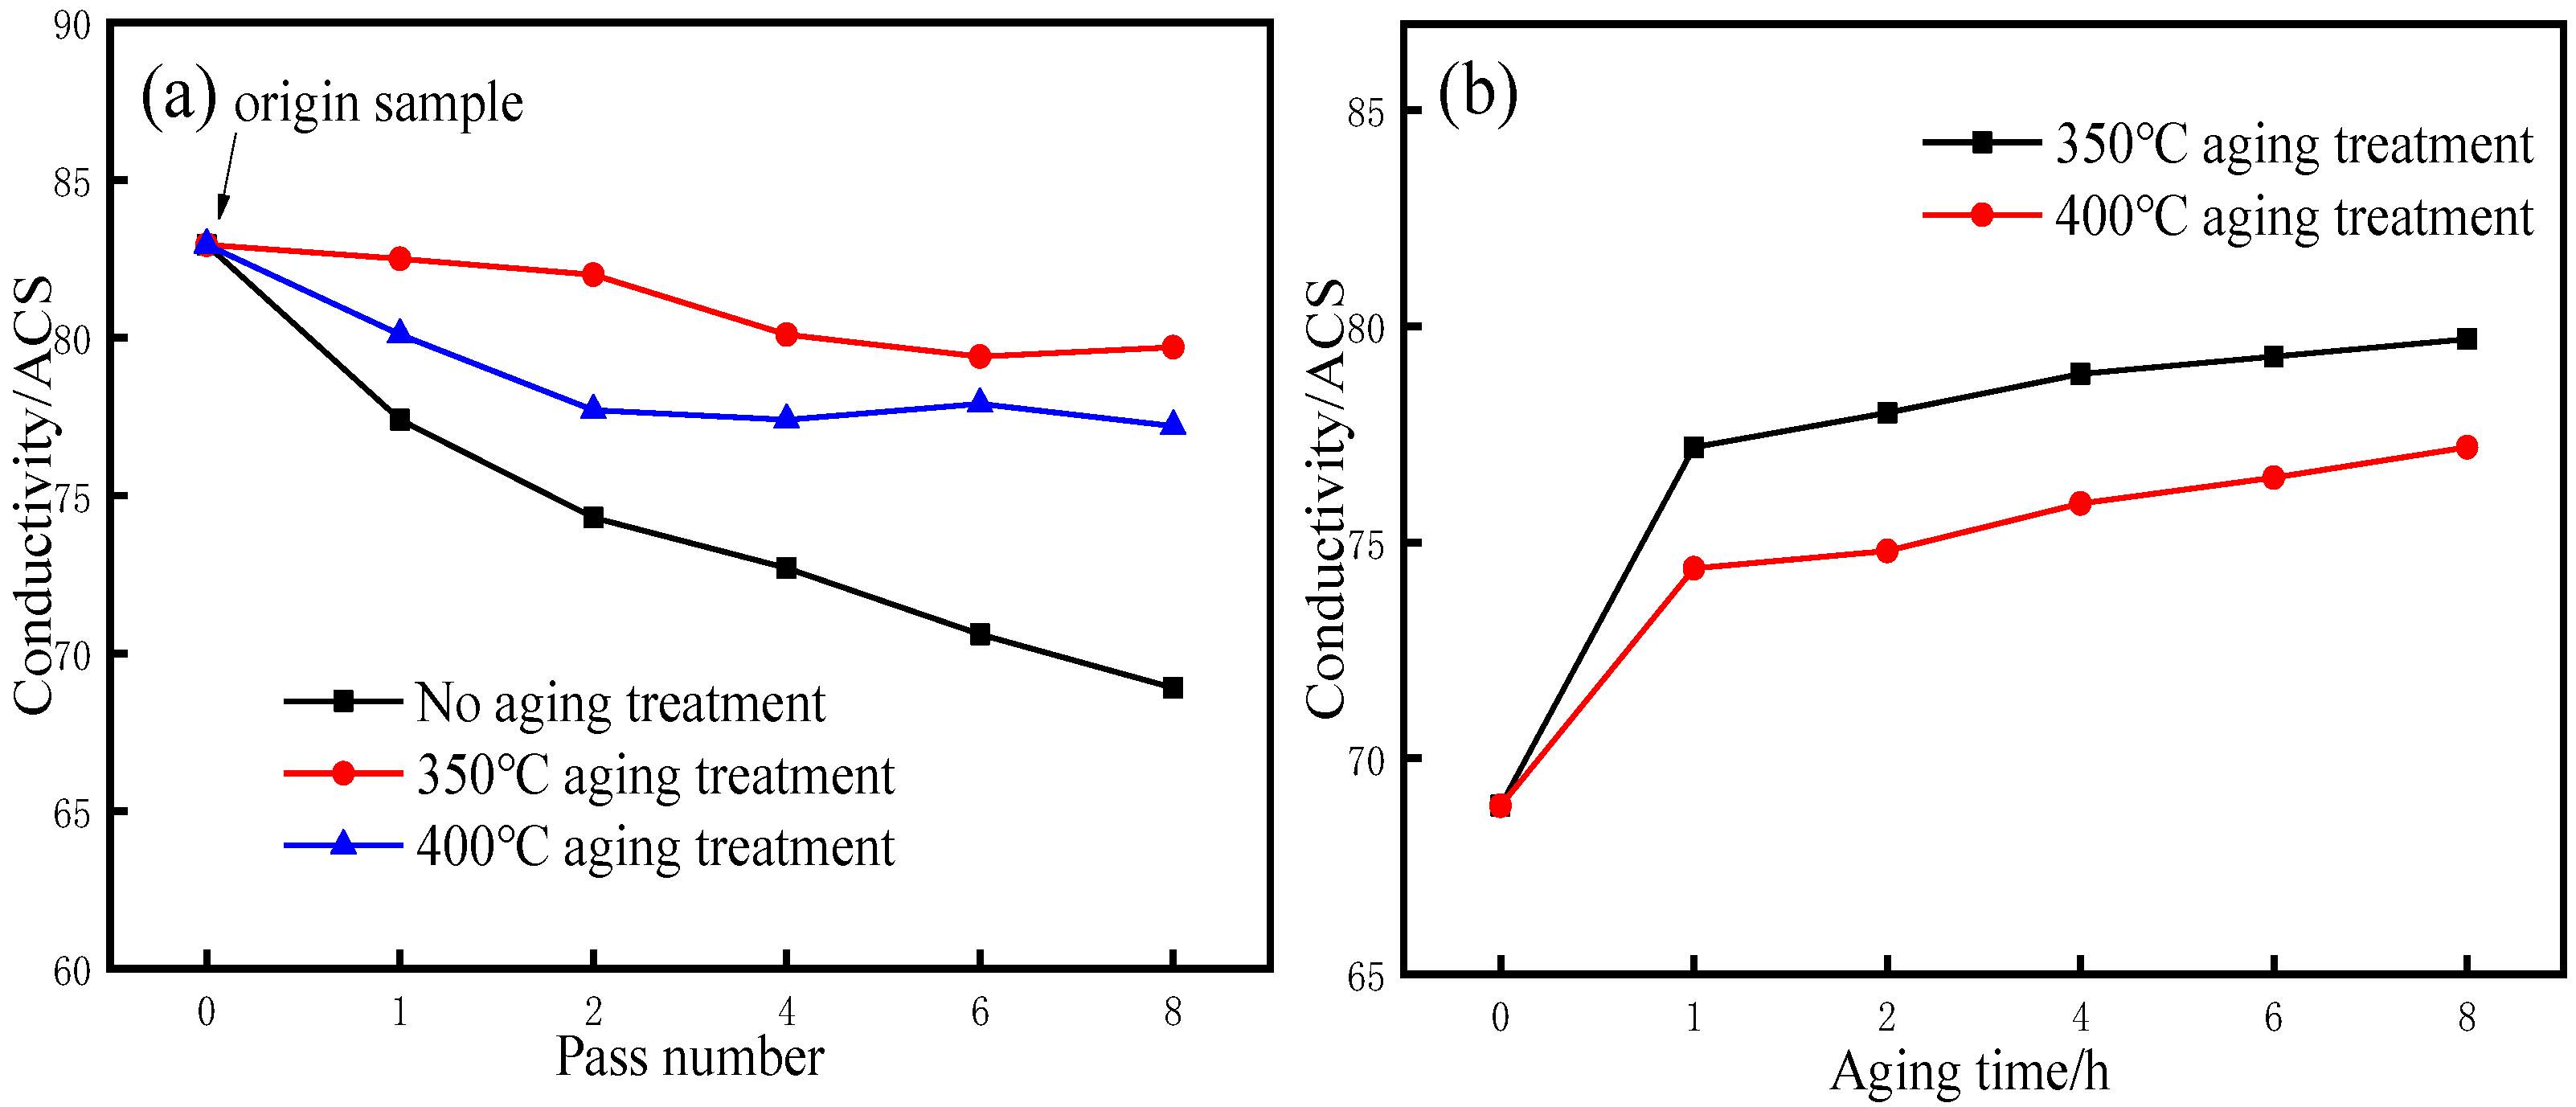
4.3. Conductivity Analysis

Figure 7a,b shows the conductivity and, respectively, relationship diagrams of the Cu1.5Cr0.1Si alloy after C-path ECAP deformation and aging treatment. As can be seen in Figure 7a, as the amount of deformation increased, the electrical conductivity of the material showed a downward trend; however, the electrical conductivity after aging treatment is always higher than that of unaged. The reason for this is that during the aging process, a large number of vacancies and interstitial atoms generated by plastic deformation would disappear, thereby reducing the degree of crystal lattice distortion, further reducing the scattering of moving electrons, and increasing the conductivity of the material. The increase in electrical conductivity was also due to the reduction in dislocation strain energy. Comparing the change in conductivity at two temperatures, it can be clearly seen that 350 °C was the best aging temperature for the Cu1.5Cr0.1Si alloy to improve conductivity. Figure 7b shows that after aging at 350 °C and 400 °C, the conductivity continuously increased, especially after aging for 0–1 h, the maximum increase in conductivity; during the aging for 1–8 h, the increase tended to be gentle. The conductivity of the material after aging at 350 °C was always higher than at 400 °C. The analysis indicated that this was because the conductivity of the alloy was greatly affected by the amount of solid-solution alloy elements in the matrix. The material underwent eight ECAP deformations before aging, and the conductivity was reduced to 68.9% IACS. During the aging process, the solid-solution atoms continue to precipitate due to the supersaturation of alloying elements at the initial stage of aging and the rapid precipitation rate. The maximum increase in electrical conductivity occurred during the initial stage of aging. After 1 h of aging, the precipitation rate of solid solution atoms gradually slowed down, and, at the same time the strengthening phase that precipitated earlier began to aggregate, which resulted in a decrease to the increase in conductivity. During the aging process, the orientation of the texture occurred, forming a stable {hkl} <110> texture, which reduced the degree of electron scattering and increase the conductivity of the material, consistent with the evolution of the texture.

5. Conclusions

(1)
After ECAP deformation by route C and aging treatment, the grains of the Cu1.5Cr0.1Si alloy changed from columnar grains to a fiber structure along the (111) direction, with an average width of the grain of about 5–20 μm, perpendicular to the direction of extrusion.
(2)
ECAP deformation by route C and aging promote formed {111} <110> and {111} <112> textures. The transformation process was {110} <112>→{110} <001>→{001} <100>→{111} <110> + {110} <112>. The stable {111} <110> texture could effectively improve the conductivity of the Cu1.5Cr0.1Si alloy.
(3)
ECAP deformations and the precipitated phases along the GBs after aging greatly improved the mechanical properties of the alloy. After eight passes of C-path deformation, the tensile strength and hardness increased to 528.00 MPa and 188.52 HV, respectively. The elongation was 28.42%, and the electrical conductivity stabilized at 78.9% IACS. After aging, the fracture mode of the alloy was ductile fracture. Appropriately extending the aging time could promote an increase in the conductivity of the Cu1.5Cr0.1Si alloy.

Author Contributions

Conceptualization, T.G.; Data curation, X.T. and J.W.; Formal analysis, Z.J. and Y.D.; Funding acquisition, T.G.; Investigation, X.T. and J.W.; Methodology, T.G. and S.W.; Project administration, T.G.; Resources, T.G.; Supervision, T.G.; Writing—original draft, T.G.; Writing—review and editing, X.T. All authors have read and agreed to the published version of the manuscript.

Funding

This work is supported by the National Natural Science Foundation of China under Grants No. 51861022 and 51261016.

Conflicts of Interest

The authors declare that they have no known competing financial interests or personal relationships that could have appeared to influence the work reported in this paper.

References

  1. Zhang, Y.; Zeng, X.Y.; Tian, B.H.; Liu, P.; Liu, Y.; Li, R.Q.; Xu, Q.Q. High temperature deformation behavior of Cu-Cr-Zr alloy. Chin J Nonferrous Met 2014, 24, 745. [Google Scholar]
  2. Pan, Z.Y.; Chen, J.B.; Li, J.F. Microstructure and properties of rare earth-containing Cu–Cr–Zr alloy. Trans Nonferrous Met Soc China 2015, 25, 1206. [Google Scholar] [CrossRef]
  3. Hong, M.-S.; Park, I.-J.; Kim, J.-G. Alloying effect of copper concentration on the localized corrosion of aluminum alloy for heat exchanger tube. Metals Mater. Int. 2017, 23, 708–714. [Google Scholar] [CrossRef]
  4. Martienssen, W.; Warlimont, H. Springer Handbook of Condensed Mater and Materials Data; Springer: Berlin/Heidelberg, Germany, 2005; p. 296. [Google Scholar]
  5. Vaseghi, M.; Kim, H.S. A combination of severe plastic deformation and ageing phenomena in Al-Mg-Si alloys. Mater. Des. 2012, 36, 735. [Google Scholar] [CrossRef]
  6. Lium, F.; Wangm, Q.; Du, Z.; Wang, J.-Y. Effect of ECAP process and aging treatment on microstructure and properties of Cu-Cr-Zr alloy. Funct. Mater. 2014, 45, 7. [Google Scholar]
  7. Dai, J.Y.; Yin, Z.M.; Song, L.P.; Yuan, Y. Microstructure and pro-perties evolution of Cu-2.5Fe-0.03P alloy under different treatment conditions. Chin. J. Nonferrous Met. 2009, 19, 1969. (In Chinese) [Google Scholar]
  8. Gholami, M.; Vesely, J.; Altenberger, I.; Kuhn, H.-A.; Wollmann, M.; Janecek, M.; Wagner, L. Influence of grain size and precipitation hardening on high cycle fatigue performance of CuNiSi alloys. Mater. Sci. Eng. A 2017, 684, 524. [Google Scholar] [CrossRef]
  9. Aifantis, E.C. Deformation and failure of bulk nanograined and ultrafine-grained materials. Mater. Sci. Eng. A 2008, 503, 190–197. [Google Scholar] [CrossRef]
  10. Wang, C.; Li, F.; Chen, B.; Yuan, Z.; Lu, H. Severe Plastic Deformation Techniques for Bulk Ultrafine-grained Materials. Rare Metal Mater. Eng. 2012, 41, 941–946. [Google Scholar] [CrossRef]
  11. Du, Z.Z.; Feng, G.H.; Fu, H.G.; Wang, J.T.; Zhao, X.C. Study of ECAP and control of materials structure and property. Mater. Eng. 2006, 3, 64–68. [Google Scholar]
  12. Lu, L.; Lu, K. Nano-twin metal materials. Acta Metall. Sinica 2010, 46, 1422–1427. [Google Scholar] [CrossRef]
  13. Lu, L.; Chen, X.; Huang, X.; Lu, K. Extreme strength of nano-twin pure copper and nano-twin increase the comprehensive strength and toughness of metal materials. China Basic Sci. 2010, 12, 16–18. [Google Scholar]
  14. Wang, Q.; Zhou, X.; Liang, B.; Zhou, Y. High temperature tensile properties and fracture mechanism of ultra-fine grained Cu-Cr-Zr alloys. Acta Metall. Sinica 2016, 52, 1477–1483. [Google Scholar]
  15. Vinogradov, A.; Patlan, V. Structure and properties of ultra-fine grain Cu-Cr-Zr alloy produced by equal-channel angular pressing. Acta Mater. 2002, 50, 1639–1651. [Google Scholar] [CrossRef]
  16. Purcek, Y.H. Influence of high pressure torsion-induced grain refinement and subsequent aging on tribological properties of Cu-Cr-Zr alloy. J. Alloys Compd. 2018, 303, 742. [Google Scholar] [CrossRef]
  17. An, X.; Wu, S.; Zhang, Z. Effect of stacking fault energy on tensile and fatigue properties of microstructure of nanocrystalline Cu-Al alloy. Acta Metall. Sin. 2014, 50, 191–201. [Google Scholar]
  18. Zhou, Q.; Shuai, G.; Liu, J. Effect of Ni and Si Element Proportion on Microstructure and Properties of Cu-Cr-Zr Alloy. Mater. Rev. 2017, 31, 76–80. [Google Scholar]
  19. Zhao, Z.; Xiao, Z.; Li, Z.; Qiu, W.; Jiang, H.; Lei, Q.; Zhang, S. Microstructure and properties of a Cu–Ni–Si–Co–Cr alloy with high strength and high conductivity. Mater. Sci. Eng. A 2019, 759, 396–403. [Google Scholar] [CrossRef]
  20. Li, Q. ECAP Strong Plasticity Control of Highly Conductive Copper and Cu-Zr-Si Alloy. Master’s Thesis, Lanzhou University of Technology, Lanzhou, China, 2018. [Google Scholar]
  21. Guo, T.; Ding, Y.; Yuan, X.; Hu, Y. Microstructure and orientation evolution of unidirectional solidification pure copper during ECAP. Rare Met. Mater. Eng. 2011, 40, 171. [Google Scholar]
  22. Zhou, Q. Microstructure and Control of Plastic Deformation; Science Press: Beijing, China, 2016. [Google Scholar]
  23. Guo, T.; Li, Q.; Wang, C.; Zhang, F.; Jia, Z. Deformation Characteristics and Mechanical Properties of Single Crystal Copper During Equal Channel Angular Pressing by Route A. Acta Metall. Sin. 2017, 53, 991–1000. [Google Scholar]
  24. Hou, D. Aging Behavior of Cu-Cr-Zr High Strength and High Conductivity Copper Alloy. Master’s Thesis, Nanjing University of Science and Technology, Nanjing, China, 2017. [Google Scholar]
  25. Geng, G.; Qin, C.; Zhang, W.; Zhang, L.; Yan, J. Effects of solidification rate and aging treatment on microstructure and properties of high-strength and high-conductivity Cu-3.2Ni-0.7Si alloy. Rare Metal Mater. Eng. 2018, 47, 3867–3871. [Google Scholar]
Figure 1. Electron back-scattered diffraction (EBSD), grain boundary evolution, and pole diagrams of Cu1.5Cr0.1Si alloy after C-path of ECAP deformation and aging at 350 °C for 4 h.Electron back-scattered diffraction (EBSD) after (a) 1 pass (d) 2 passes (g) 4 passes (j) 8 passes; grain boundary evolution after (b) 1 pass (e) 2 passes (h) 4 passes (k) 8 passes; pole diagrams after (c) 1pass (f) 2 passes (i) 4 passes (l) 8 passes.
Crystals 10 00207 g001
Figure 2. XRD patterns of Cu1.5Cr0.1Si alloy after ECAP by route C and aging at 350 °C for 1 to 8 h.
Crystals 10 00207 g002
Figure 3. Orientation distribution function (ODF) of the Cu1.5Cr0.1Si alloy after C-path ECAP deformation and aging at 350 °C for 4 h. (a) one pass (b) two passes (c) four passes (d) eight passes.
Crystals 10 00207 g003
Figure 4. Mechanical properties of the Cu1.5Cr0.1Si alloy after C-path deformation.
Crystals 10 00207 g004
Figure 5. The Cu1.5Cr0.1Si alloy C-path deformation and aging at 350 °C for different times (a) strength (b) elongation (c) hardness.
Crystals 10 00207 g005
Figure 6. Fracture characteristics of Cu1.5Cr0.1Si alloy after five passes of ECAP deformation and aging at 350 °C; (a) Energy spectrum (b) 1 pass (c) 4 passes (d) 8 passes.
Crystals 10 00207 g006
Figure 7. Electrical conductivity curve of the Cu1.5Cr0.1Si alloy after C-path ECAP deformation and aging. (a) Curves of 1-five passes under different aging temperatures (b) 350 °C and 400 °C aging for 1–8 h.
Crystals 10 00207 g007

