Abstract
A new 5-(4-((2-(benzothiazole-2-carbonyl)hydrazono)methyl)-3-hydroxyphenoxy)-N,N,N-trimethylpentan-1-aminium bromide (BTABr) fluorescent and colorimetric pH probe was easily synthesized by the condensation reaction of benzothiazole-2-carbohydrazide with 5-(4-formyl-3-hydroxyphenoxy)-N,N,N-trimethylpentan-1-aminium bromide. The benzothiazole moiety provided the emissive part of the molecule and the charged trimethyl amino group guaranteed outstanding solubility in water, for an organic molecule. pH titration experiments indicated that the probe is useful for monitoring acidic and alkaline solutions, turning reversibly in color/fluorescence just at a neutral pH value. Naked-eye colorimetric response was observed both in solution and in the solid state. In addition, the probe showed high stability and selectivity and large Stokes shifts. Because of these features, BTABr can potentially work as an on-off real-time pH sensor for intracellular pH imaging. The crystal structure of BTABr examined by single-crystal analysis showed a planar geometry of the molecule and confirmed the presence of a molecular stacking between molecules joined in a complex tridimensional hydrogen bonding pattern.
1. Introduction
The design of pH-responsive molecules is a remarkable field of research, finding applications in environmental, biochemical, electrochemical, and analytical technologies [1,2]. As a key parameter for cell survival, its determination is crucial in living systems. Optical pH sensors are currently considered the cutting edge in the field of chemosensors due to the ease of use, low-cost process, high sensitivity and selectivity, and fast response [3,4,5,6].
Many optical pH sensors are both colorimetric and fluorometric pH probes. Typical fluorescence pH sensors are based on photoinduced electron transfer (PET), intramolecular charge transfer (ICT), and electron transfer (ET) effect. Organic molecules with a photon interaction site undergo electronic transfer effects turning in different tautomeric forms in a dependent manner from pH. Among them, Schiff-base-containing molecules are excellent candidates to promote color/fluorescence response depending on protonation and deprotonation. On the other hand, fluorescence must be guaranteed by a suited emissive core. Heterocyclic molecules [7,8,9,10,11,12,13,14,15,16,17,18,19,20,21], as one of the most important classes of compounds, can play the role of fluorogenic moiety. At present, one of the major problems encountered in optimizing optical sensors is achieving the right balance between the presence of the fluorogenic unit (soluble in organic solvents) and the water solubility. Water-soluble pH sensors may provide a diagnostic tool [22,23] by measuring intracellular pH gradient and evaluating the differences in pH between normal and altered cells.
Recently, we designed and synthesized an amphiphilic picolinoyl-hydrazone-based sensor [24] with a charged side chain capable of guaranteeing water solubility. In that study, we checked the effect of the heterocycle on the spectroscopic response involving pH determination.
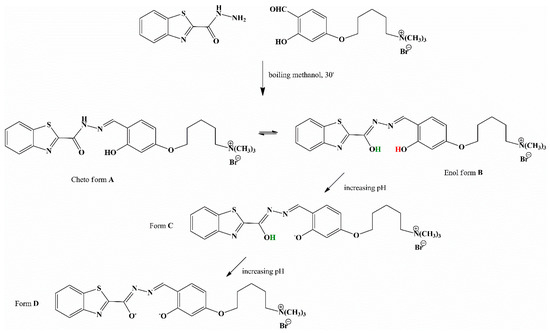
In the present work, we explored the potential of a benzothiazole moiety, one of the most widely known heterocycles, in the production of an optical pH sensor. A new highly water-soluble, 5-(4-((2-(benzothiazole-2-carbonyl)hydrazono)methyl)-3-hydroxyphenoxy)-N,N,N-trimethylpentan-1-aminium bromide (BTABr) fluorescent and colorimetric probe was easily obtained by condensation reaction (see Scheme 1). In the keto-enolic tautomeric equilibrium, form B of the sensor undergoes two deprotonation steps, turning to forms C and finally D, respectively, by increasing pH parameter. Variation of pH includes a variation in the electronic state of the molecule and consequently in the absorbance/emission spectra. A full characterization of the probe was performed by NMR spectroscopy, elemental analysis, mass spectrometry measurements, DSC/TGA methods, and absorption and emission titrations in the pH range of 2.0–11.0. Single-crystal X-ray analysis of the BTABr probe clarified the structural aspects.
Scheme 1.
Synthetic route to the target compound BTABr in the two tautomeric forms (A and B) at pH acidic-neutral. In red, the more acid proton (lost in the C form) and, in green, the second acid proton (lost in the D form).
2. Experimental Section
All starting products were commercially available. 5-(4-Formyl-3-hydroxyphenoxy)-N,N,N-trimethylpentan-1-aminium bromide [24] was obtained as described in the literature. Benzothiazole-2-carboxylic acid hydrazide [25] was obtained by common synthetic route placing ethyl benzothiazole-2-carboxylate under reflux in ethanol with an excess of hydrazine for 1 h.
Optical microscopy was carried out with a Zeiss Axioscope polarizing microscope (Carl Zeiss, Oberkochen, Germany) equipped with a FP90 Mettler hot stage (Mettler-Toledo, LLC - Columbus, OH, USA). The decomposition temperature (Td), assumed as the temperature where is recorded the 5% weight loss, was determined by thermogravimetric analysis in air, using a PerkinElmer TGA 4000 (PerkinElmer, Inc., Waltham, MA, USA). Phase transition temperatures and enthalpies were measured using a PerkinElmer Pyris 1 DSC scanning calorimeter (PerkinElmer, Inc., Waltham, MA, USA) at a scanning rate of 10 °C/min, under nitrogen flow. 1H NMR and 13C NMR spectra were recorded with a Bruker 400 MHz apparatus (Bruker Corporation, Billerica, MA, USA). Ultraviolet–visible (UV–Vis) and fluorescence spectra were recorded with JASCO spectrometers (JASCO Inc., Mary’s Court, Easton, MD, USA).
2.1. Synthesis of BTABr
A 0.137 g (1.00 mmol) amount of benzothiazole-2-carboxylic acid hydrazide was added to 15 mL of a methanol solution containing 0.345 g (1.00 mmol) of 5-(4-formyl-3-hydroxyphenoxy)-N,N,N-trimethylpentan-1-aminium bromide. The reaction mixture was refluxed for 30 min then was cooled to 0 °C. Under this condition, a pale yellow crystalline solid precipitates. The solid was recovered by filtration and crystallized from methanol. Yield: 80%. Mp = 252 °C, ΔH = 84.69 J/g. Decomposition temperature: 293 °C. 1H NMR (400 MHz, DMSO-d6, 25 °C): δ = 12.82 (s, 1H), 11.26 (s, 1H), 8.73 (s, 1H), 8.24 (d, 4.2 Hz, 1H), 8.17 (d, 4.3 Hz, 1H), 7.65 (t, 5.4 Hz, 1H), 7.60 (t, 6.8 Hz, 1.7 Hz, 1H), 7.41 (d, 7.0 Hz, 1H), 6.49 (d, 6.9 Hz, 1H), 6.48 (s, 1H), 4.00 (t, 6.6 Hz, 2H), 3.28 (m, 2H), 2.47 (s, 9H), 1.74 (m, 4H), 1.40 (m, 2H) ppm. 13C NMR (400 MHz, DMSO-d6, 25 °C): δ = 163.7, 162.3, 160.0, 156.3, 153.2, 151.7, 136.5, 131.8, 127.8, 127.6, 124.6, 123.5, 112.1, 107.6, 102.1, 67.8, 65.7, 52.7, 28.4, 22.8, 22.2.
HRMS(ESI): m/z calculated for C23H29N4O3S+: 441.566; found 441.193 [M]+.
Elemental analysis calculated (%) for C23H29N4O3SBr: C, 52.96; H, 5.61; N, 10.74; found: C, 52.93; H, 5.67; N, 10.70.
2.2. X-ray Crystallography
X-ray crystal structure analysis was carried out on single crystals of BTABr obtained from slow evaporation of acetone/water solution at room temperature. One selected crystal was mounted in flowing N2 at 173 K on a Bruker-Nonius KappaCCD diffractometer equipped with an Oxford Cryostream apparatus (graphite monochromated MoKα radiation, λ = 0.71073 Å, CCD rotation images, thick slices, φ and ω scans to fill asymmetric unit). The structure was solved by direct methods (SIR97 program [26]) and anisotropically refined by the full matrix least-squares method on F2 against all independent measured reflections using SHELXL-2018/3 [27] and WinGX software [28]. In BTABr crystallization, H2O is present. The H atoms bound to N(amide), to the hydroxy group, and to the O(water) were located in different Fourier maps and their coordinates were refined with Uiso(H) equal to 1.2Ueq of the carrier atom. Some constraints were introduced in the last stage of refinement to regularize some H2O hydrogens (DFIX command of SHELXL). All the other hydrogen atoms were introduced in calculated positions and refined according to a riding model (C–H distances equal to 0.95–0.99 Å and Uiso(H) equal to 1.2Ueq of the carrier atom). Crystals resulted in being twinned (−1 0 0, 0 −1 0, −1 0 1 twinning law), no merging of reflections was made, and HKLF5 command was used. Crystal data and structure refinement details are reported in Table 1. Hydrogen bond geometry is reported in Table 2. The figures were generated using the ORTEP-3 [28] and Mercury CSD 4.0 [29] programs.

Table 1.
Crystal data and structure refinement details for BTABr.

Table 2.
Hydrogen bonding geometry for BTABr (e.s.d. values are in parentheses).
Crystal data were deposited at the Cambridge Crystallographic Data Centre with assigned number CCDC 1954197. These data can be obtained free of charge from www.ccdc.cam.ac.uk/data_request/cif.
2.3. UV–Vis and Fluorescence pH Titrations and Naked-Eye Detection
Stock solutions (1.00M) of Britton–Robinson buffer (at 2.0, 3.0, 4.0, 5.0, 6.0, 7.0, 8.0, 9.0, 10.0, and 11.0 pH value) were prepared in bidistilled water (pH 6.25) as described in the literature [30]. Aqueous solutions of BTABr (100 μM and 20 μM, respectively), from bidistilled water, were prepared for fluorescence and absorbance titrations. The probe titration was performed by adding 60 μL of the buffer stock solutions to 2.5 mL of BTABr dissolved in the solvent. After mixing for a few seconds, the absorption or fluorescence spectra were recorded at room temperature.
For the naked-eye detection, solutions of 200 μM of BTABr in 1.00 M buffer of pH 2.0, 3.0, 4.0, 5.0, 6.0, 7.0, 8.0, 9.0, 10.0, and 11.0 were prepared. The laboratory paper soaked using a 0.01 M water solution of the probe was Labor filter paper, 67 g/m2, minimum porosity. The samples were immediately photographed.
3. Results and Discussion
3.1. Characterization and Sensing Ability of BTABr
Compound BTABr was obtained as summarized in Scheme 1 by condensation reaction. 1H-NMR and 13C‑NMR were used to identify the compounds and evaluate their degree of purity. Phase behavior was examined by optical observation as well as DSC and TGA analysis. The probe shows a large range of stability after melting (at 252 °C) and no decomposition is detected until about 293 °C in air, making it a good candidate for its stability.
Remarkably, it was not necessary to employ mixed organic solvent–water solutions [31] because of the excellent water solubility of the probe (0.12 M in bidistilled water at pH = 6.25 for the protonated form). All photophysical measurements were performed in water solution or water–ethanol (8:2), the addition of ethanol slightly increasing emission intensity. The fluorescence quantum yield was measured in water for the deprotonated form D at pH = 11.0 by relative methods using quinine sulfate (QS) as standard (0.546 in H2SO4 1 N, excited at 365 nm) according to [32,33,34]. The value of 6.20% is comparable to that reported for water-soluble pH probes [35,36]. In more concentrated solutions, the emission increases become perceptible to the naked eye (see Section 2.3).
In the UV–Vis experiments, the absorption maximum was recorded at about 351 nm for the chromophore in the protonated form (at pH from 2.0 to 6.0). In the pH range from 8.0 to 11.0, the peak undergoes a relevant red shift to about 425 nm, consistent with the gradual deprotonation of the tautomeric form B to the deprotonated forms C and then D in increasingly basic media. At pH = 7.0, the absorbance pattern reveals two peaks at 344 nm and at 425 nm. This behavior is evident in Figure 1 (on the left) where the titration in the 100 μM water solution of BTABr is reported. The acidic solutions are pale yellow and the broad absorption band at about 425 nm is responsible for the bright yellow color of the basic solutions. The naked-eye response of the same solutions is quite evident (see Figure 2, solutions in natural light). The net color change from acidic to alkaline forms is observable also when the probe is adsorbed on laboratory paper (Figure 2, paper disc, upper half).
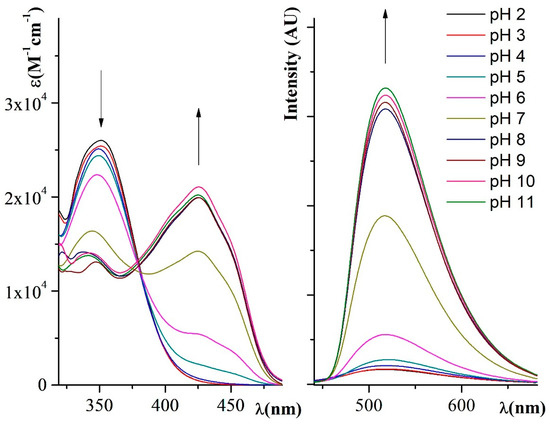
Figure 1.
UV–Visible (UV–Vis) spectral titration of BTABr 100 μM in water using Britton–Robinson buffers from pH = 2.0 to pH = 11.0 (on the left). Fluorescence spectral titration of BTABr 20 μM in water using Britton–Robinson buffers from pH = 2.0 to pH = 11.0 (excitation wavelength of 350 nm).
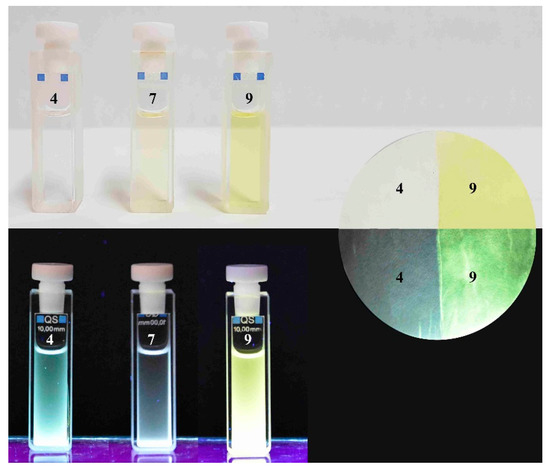
Figure 2.
On the left: color of 100 μM BTABr probe in buffer of pH = 4.0, pH = 7.0, and pH = 9.0 photographed under visible light (above) and UV lamp at 365 nm (below). On the right: color of laboratory paper soaked in the probe at pH = 4.0 (on the left) and pH = 9.0 (right) photographed at visible light (above) and under UV lamp at 365 nm (down).
The diagram of the fluorescence titration performed using the 20 μM solution of BTABr in water is reported in Figure 1 on the right. The emission was recorded as a band peaked at 517 nm which increases and sharpens from the 2.0 to 11.0 pH values. The acid solutions are much less intense in emission with respect to the basic ones, as can be observed with the naked eye in Figure 2 (solutions photographed in UV–Vis light). The same behavior is shown by the soaked-on paper sample (Figure 2, paper disc, lower half). Under the UV–Vis lamp, the deprotonated samples give a more intense yellow emission with respect to the quite colorless protonated form.
Finally, high Stokes shifts were evaluated in the basic range (92 nm), becoming even larger in the acidic solution (166 nm). Replicability and reversibility were positively checked by repeatedly turning on and off absorbance/fluorescence real-time response by NaOH or HCl addition in the fluorescence/absorbance experiments.
3.2. Crystal Structure of BTABr
A complete XRD analysis was performed on the single crystals of the BTABr probe obtained from slow evaporation of the acetone/water solution at room temperature. BTABr crystallizes in the triclinic P -1 space group with one BTA+ cation, one bromine anion, and three lattice water molecules contained in the independent unit. All bond lengths and angles are in the normal range. Crystal data and structural details are reported in Table 1. The hydrogen bonding geometry is reported in Table 2. The ORTEP view of the molecular structure is reported in Figure 3.
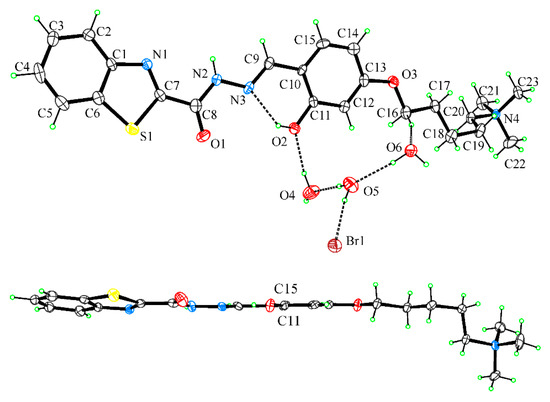
Figure 3.
UP: Ortep view of BTABr normal to phenol ring with the H bonding pattern of H2O molecules drawn as dashed lines. DOWN: view of BTA+ cation down the C11-C15 line. Thermal ellipsoids are drawn at 50% probability level.
The pattern of bond lengths in the compound agrees with the more stable keto form A of Scheme 1; in particular, the typical carbonyl double bond distance of 1.219(9) Å is found for the C8-O1 bond. The presence of the N(amide) hydrogen atom is proved by its localization in different Fourier maps. The existence of an intramolecular hydrogen bond between the OH donor and the N(imine) acceptor groups locks the phenol-azo group into a planar conformation (Table 2). In the side benzothiazole group, the N(thiazole) is cis-disposed to the N(amide) atom. A slight inclination of the benzotriazole group with respect to the phenol ring is observed, mainly due to the torsion around the C7-C8 bond (N1-C7-C8-N2 = 7.3(11)°). The side oxoalkylamino group is in the all-trans conformation and in plane with the attached phenol group, except for the terminal -CH2-N(CH3)3 group that protrudes out of the mean plane of the molecule as a consequence of the torsion angle around the C18-C19 bond (C17-C18-C19-C20 = −68.3(9)°). In this way a flat, elongated hooked shape of the molecular cation is achieved (Figure 3).
The crystal packing is stabilized by intermolecular hydrogen bonds that involve the strong donor/acceptor groups of the molecule, the lattice water molecules, and the bromine anion in a complex tridimensional H-bonding pattern. In the molecule, the imine group acts as donor towards a water molecule and the hydroxy group acts as acceptor from another water molecule. The lattice water molecules are also involved in hydrogen bonds with the acceptor bromine anion to form an H-bonded ring across a crystallographic inversion center having an R4,6(12) graph set (Figure 4). In the crystal packing, the molecules are joined through H-bonded water molecules in an antiparallel stacking at about 3.4 Å, with benzothiazole and alkyl groups of adjacent molecules facing each other and adjacent phenol rings slipped to each other.
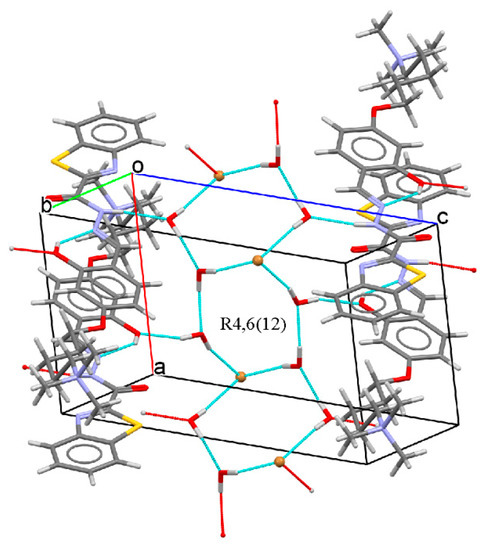
Figure 4.
Partial packing showing the H-bonding pattern. Intra- and intermolecular hydrogen bonds are drawn as cyan dashed lines.
The Hirshfeld surfaces and two-dimensional fingerprint plots using CrystalExplorer 17.5 [37] were utilized to analyze the close intermolecular contacts. The presence of hydrogen bonds was confirmed by the red spots on the Hirshfeld surface mapped over dnorm (Figure 5, left) and by the bidimensional fingerprint plot (Figure 5, right).
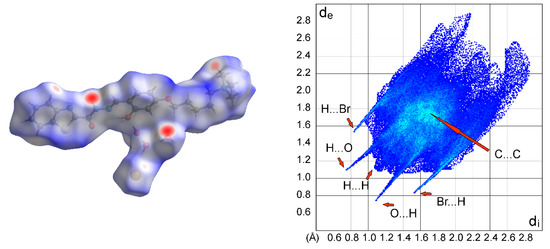
Figure 5.
Left: Two-dimensional full fingerprint plot of BTABr. Significative contacts: H…H (46.2%), O…H/H…O (12.9%), Br…H/H…Br (10.8%), and C…C (2.7%). Right: Hirshfeld surface mapped over dnorm.
In the Hirshfeld fingerprint plot (Figure 5, right), the intermolecular O···H/H···O (12.9%) and Br…H/H…Br (10.8%) interactions are displayed as a pair of sharp spikes symmetrically disposed with respect to the diagonal. As expected, a large part of H···H (46.2%) interactions are found (diagonal blue strip that ends at about di = de = 1.1 Å). A small green area at about di + de = 3.4 Å with a small amount of C…C (2.7%) interactions is diagnostic of few π···π interactions between molecules, due to their antiparallel stacking with prevalent contacts between alkyl and aromatic groups.
4. Conclusions
The BTABr probe shows a remarkable pH-dependent behavior both in absorbance and in emission and a net on-off switch effect at neutral pH. The effect is clearly perceivable even to the naked eye in solution and on the soaked-on paper sample. Common drawbacks of many pH probes, such as scarce stability, replicability and reversibility, slow response, and narrow Stokes shifts do not affect BTABr. Moreover, the sensor is so soluble in water that it can be dissolved without any addition of organic solvents. Based on these characteristics, BTABr is a good candidate as on-off colorimetric and fluorescence real-time pH sensor, potentially employable for biological determinations.
Author Contributions
For research articles with several authors, a short paragraph specifying their individual contributions must be provided. The following statements should be used U.C., B.P., and R.D. conceptualized and designed the experiments; R.D., and A.T. performed the experiments; R.D. and B.P. analyzed the data; U.C. methodology, resources and wrote the paper. All authors have read and agreed to the published version of the manuscript.
Funding
This research was funded by by the Italian Ministry of Education, University and Research (MIUR) (Piano Lauree Scientifiche “Scienza dei Materiali” 2016–2018).
Conflicts of Interest
The authors declare no conflict of interest.
References
- Das, D.K.; Dutta, K. pH dependent fluorescence switching in salicylideneaniline: ‘off–on–off’ operation controlled by surfactant micelles. J. Lumin. 2014, 145, 454–458. [Google Scholar] [CrossRef]
- Kumar, J.; Sarma, M.J.; Phukan, P.; Das, D.K. Surfactant Dependent pH Controlled “off-on”, “off-on-off” and “on-off” Fluorescent Switches Exhibited by N-Benzylidenenaphthalen-1-Amine. J. Fluoresc. 2015, 25, 1431–1435. [Google Scholar] [CrossRef] [PubMed]
- Ni, Y.; Wu, J. Far-red and near infrared BODIPY dyes: Synthesis and applications for fluorescent pH probes and bio-imaging. Org. Biomol. Chem. 2014, 12, 3774–3791. [Google Scholar] [CrossRef] [PubMed]
- Werner, T.; Huber, C.; Heinl, S.; Kollmannsberger, M.; Daub, J.; Wolfbeis, O.S. Novel optical pH-sensor based on a boradiaza-indacene derivative. Fresenius’ J. Anal. Chem. 1997, 359, 150–154. [Google Scholar] [CrossRef]
- Kollmannsberger, M.; Rurack, K.; Resch-Genger, U.; Daub, J. Ultrafast Charge Transfer in Amino-Substituted Boron Dipyrromethene Dyes and Its Inhibition by Cation Complexation: A New Design Concept for Highly Sensitive Fluorescent Probes. J. Phys. Chem. A 1998, 102, 10211–10220. [Google Scholar] [CrossRef]
- Valeur, B. Molecular Fluorescence. Digit. Encycl. Appl. Phys. 2009, 477–531. [Google Scholar] [CrossRef]
- Roviello, A.; Borbone, F.; Carella, A.; Diana, R.; Roviello, G.; Panunzi, B.; Ambrosio, A.; Maddalena, P. High quantum yield photoluminescence of new polyamides containing oligo-PPV amino derivatives and related oligomers. J. Polym. Sci. Part A Polym. Chem. 2009, 47, 2677–2689. [Google Scholar] [CrossRef]
- Chalansonnet, V.; Lowe, J.; Orenga, S.; Perry, J.D.; Robinson, S.N.; Stanforth, S.P.; Sykes, H.E.; Truong, T.V. Fluorogenic 7-azidocoumarin and 3/4-azidophthalimide derivatives as indicators of reductase activity in microorganisms. Bioorganic Med. Chem. Lett. 2019, 29, 2354–2357. [Google Scholar] [CrossRef]
- Stress, C.J.; Schmidt, P.J.; Gillingham, D.G. Comparison of boron-assisted oxime and hydrazone formations leads to the discovery of a fluorogenic variant. Org. Biomol. Chem. 2016, 14, 5529–5533. [Google Scholar] [CrossRef]
- Piotto, S.; Concilio, S.; Sessa, L.; Diana, R.; Torrens, G.; Juan, C.; Caruso, U.; Iannelli, P. Synthesis and Antimicrobial Studies of New Antibacterial Azo-Compounds Active against Staphylococcus aureus and Listeria monocytogenes. Molecules 2017, 22. [Google Scholar] [CrossRef]
- Zanotti, K.J.; Silva, G.L.; Creeger, Y.; Robertson, K.L.; Waggoner, A.S.; Berget, P.B.; Armitage, B.A. Blue fluorescent dye-protein complexes based on fluorogenic cyanine dyes and single chain antibody fragments. Org. Biomol. Chem. 2011, 9, 1012–1020. [Google Scholar] [CrossRef] [PubMed]
- Panunzi, B.; Concilio, S.; Diana, R.; Shikler, R.; Nabha, S.; Piotto, S.; Sessa, L.; Tuzi, A.; Caruso, U. Photophysical Properties of Luminescent Zinc(II)‒Pyridinyloxadiazole Complexes and their Glassy Self-Assembly Networks. Eur. J. Inorg. Chem. 2018, 2018, 2709–2716. [Google Scholar] [CrossRef]
- Panunzi, B.; Borbone, F.; Capobianco, A.; Concilio, S.; Diana, R.; Peluso, A.; Piotto, S.; Tuzi, A.; Velardo, A.; Caruso, U. Synthesis, spectroscopic properties and DFT calculations of a novel multipolar azo dye and its zinc(II) complex. Inorg. Chem. Commun. 2017, 84, 103–108. [Google Scholar] [CrossRef]
- Abbotto, A.; Beverina, L.; Bozio, R.; Bradamante, S.; Pagani, G.A.; Signorini, R. Heterocycle-based materials for frequency-upconverted lasing. Synth. Met. 2001, 121, 1755–1756. [Google Scholar] [CrossRef]
- Rosenberg, L.S.; Simons, J.; Schulmans, S.G. Determination of pKa values of N-heterocyclic bases by fluorescence spectrophotometry. Talanta 1979, 26, 867–871. [Google Scholar] [CrossRef]
- Borbone, F.; Caruso, U.; Concilio, S.; Nabha, S.; Piotto, S.; Shikler, R.; Tuzi, A.; Panunzi, B. From cadmium(II)-aroylhydrazone complexes to metallopolymers with enhanced photoluminescence. A structural and DFT study. Inorg. Chim. Acta 2017, 458, 129–137. [Google Scholar] [CrossRef]
- Borbone, F.; Caruso, U.; Palma, S.D.; Fusco, S.; Nabha, S.; Panunzi, B.; Shikler, R. High solid state photoluminescence quantum yields and effective color tuning in polyvinylpyridine based zinc(II) metallopolymers. Macromol. Chem. Phys. 2015, 216, 1516–1522. [Google Scholar] [CrossRef]
- Wu, Y.; Han, X.; Qu, Y.; Zhao, K.; Wang, C.; Huang, G.; Wu, H. Two Cu(I) complexes constructed by different N-heterocyclic benzoxazole ligands: Syntheses, structures and fluorescent properties. J. Mol. Struct. 2019, 1191, 95–100. [Google Scholar] [CrossRef]
- Akchurin, I.O.; Yakhutina, A.I.; Bochkov, A.Y.; Solovjova, N.P.; Medvedev, M.G.; Traven, V.F. Novel push-pull fluorescent dyes—7-(diethylamino)furo- and thieno[3,2-c]coumarins derivatives: Structure, electronic spectra and TD-DFT study. J. Mol. Struct. 2018, 1160, 215–221. [Google Scholar] [CrossRef]
- Jin, G.-X.; Ma, J.-P.; Dong, Y.-B. Metal–organic coordination polymers based on imidazolyl- and benzimidazolyl-containing 4,4′-bipy type ligands. J. Mol. Struct. 2013, 1052, 146–157. [Google Scholar] [CrossRef]
- Diana, R.; Panunzi, B.; Tuzi, A.; Caruso, U. Two tridentate pyridinyl-hydrazone zinc(II) complexes as fluorophores for blue emitting layers. J. Mol. Struct. 2019, 1197, 672–680. [Google Scholar] [CrossRef]
- Chen, J.W.; Chen, C.M.; Chang, C.C. A fluorescent pH probe for acidic organelles in living cells. Org. Biomol. Chem. 2017, 15, 7936–7943. [Google Scholar] [CrossRef] [PubMed]
- Panunzi, B.; Diana, R.; Concilio, S.; Sessa, L.; Tuzi, A.; Piotto, S.; Caruso, U. Fluorescence pH-dependent sensing of Zn(II) by a tripodal ligand. A comparative X-ray and DFT study. J. Lumin. 2019, 212, 200–206. [Google Scholar] [CrossRef]
- Diana, R.; Panunzi, B.; Tuzi, A.; Piotto, S.; Concilio, S.; Caruso, U. An Amphiphilic Pyridinoyl-hydrazone Probe for Colorimetric and Fluorescence pH Sensing. Molecules 2019, 24, 3833. [Google Scholar] [CrossRef] [PubMed]
- Argeri, M.; Borbone, F.; Caruso, U.; Causà, M.; Fusco, S.; Panunzi, B.; Roviello, A.; Shikler, R.; Tuzi, A. Color tuning and noteworthy photoluminescence quantum yields in crystalline mono-/dinuclear ZnII complexes. Eur. J. Inorg. Chem. 2014, 2014, 5916–5924. [Google Scholar] [CrossRef]
- Altomare, A.; Burla, M.C.; Camalli, M.; Cascarano, G.L.; Giacovazzo, C.; Guagliardi, A.; Moliterni, A.G.G.; Polidori, G.; Spagna, R. SIR97: A new tool for crystal structure determination and refinement. J. Appl. Crystallogr. 1999, 32, 115–119. [Google Scholar] [CrossRef]
- Sheldrick, G.M. Crystal structure refinement with SHELXL. Acta Crystallogr. Sect. C Struct. Chem. 2015, 71, 3–8. [Google Scholar] [CrossRef]
- Farrugia, L.J. WinGXandORTEP for Windows: An update. J. Appl. Crystallogr. 2012, 45, 849–854. [Google Scholar] [CrossRef]
- Macrae, C.F.; Bruno, I.J.; Chisholm, J.A.; Edgington, P.R.; McCabe, P.; Pidcock, E.; Rodriguez-Monge, L.; Taylor, R.; van de Streek, J.; Wood, P.A. Mercury CSD 2.0—New features for the visualization and investigation of crystal structures. J. Appl. Crystallogr. 2008, 41, 466–470. [Google Scholar] [CrossRef]
- Britton, H.T.S.; Robinson, R.A. CXCVIII.—Universal buffer solutions and the dissociation constant of veronal. J. Chem. Soc. 1931, 0, 1456–1462. [Google Scholar] [CrossRef]
- Diana, R.; Caruso, U.; Concilio, S.; Piotto, S.; Tuzi, A.; Panunzi, B. A real-time tripodal colorimetric/fluorescence sensor for multiple target metal ions. Dyes and Pigment. 2018, 155, 249–257. [Google Scholar] [CrossRef]
- Melhuish, W.H. Quantum Efficiencies of Fluorescence of Organic Substances: Effect of Solvent and Concentration of the Fluorescent Solute1. J. Phys. Chem. 1961, 65, 229–235. [Google Scholar] [CrossRef]
- Williams, A.T.R.; Winfield, S.A.; Miller, J.N. Relative fluorescence quantum yields using a computer-controlled luminescence spectrometer. Analyst 1983, 108. [Google Scholar] [CrossRef]
- Panunzi, B.; Diana, R.; Concilio, S.; Sessa, L.; Shikler, R.; Nabha, S.; Tuzi, A.; Caruso, U.; Piotto, S. Solid-state highly efficient dr mono and poly-dicyano-phenylenevinylene fluorophores. Molecules 2018, 23, 1505. [Google Scholar] [CrossRef]
- Ma, P.; Liang, F.; Wang, D.; Yang, Q.; Yang, Z.; Gao, D.; Yu, Y.; Song, D.; Wang, X. A novel fluorescence and surface-enhanced Raman scattering dual-signal probe for pH sensing based on Rhodamine derivative. Dye. Pigment. 2015, 122, 224–230. [Google Scholar] [CrossRef]
- Shih, K.-Y.; Hsiao, T.-S.; Deng, S.-L.; Hong, J.-L. Water-Soluble Poly(γ-propargyl-l-glutamate) Containing Pendant Sulfonate Ions and Terminal Fluorophore: Aggregation-Enhanced Emission and Secondary Structure. Macromolecules 2014, 47, 4037–4047. [Google Scholar] [CrossRef]
- Turner, M.J.; Thomas, S.P.; Shi, M.W.; Jayatilaka, D.; Spackman, M.A. Energy frameworks: Insights into interaction anisotropy and the mechanical properties of molecular crystals. Chem. Commun. (Camb.) 2015, 51, 3735–3738. [Google Scholar] [CrossRef]
© 2020 by the authors. Licensee MDPI, Basel, Switzerland. This article is an open access article distributed under the terms and conditions of the Creative Commons Attribution (CC BY) license (http://creativecommons.org/licenses/by/4.0/).