Article

In Situ Neutron Diffraction Study of Phase Transformation of High Mn Steel with Different Carbon Content

1
Department of Materials Science and Engineering, Chungnam National University, Daejeon 34134, Korea
2
Department of Materials Science and Engineering, University of Tennessee, Knoxville, TN 37996, USA
3
Oak Ridge National Laboratory, Oak Ridge, TN 37831, USA
4
Department of Chemical Engineering and Applied Chemistry, Chungnam National University, Daejeon 34134, Korea
*
Author to whom correspondence should be addressed.
Crystals 2020, 10(2), 101; https://doi.org/10.3390/cryst10020101
Submission received: 22 December 2019 / Revised: 5 February 2020 / Accepted: 6 February 2020 / Published: 10 February 2020

Abstract

:
In situ neutron diffraction was employed to examine the phase transformation behavior of high-Mn steels with different carbon contents (0.1, 0.3, and 0.5 wt.%C). With increasing carbon contents from 0.1 C to 0.5 C, the austenite phase fraction among the constituent phases increased from ~66% to ~98%, and stacking fault energy (SFE) increased from ~0.65 to ~16.5 mJ/m2. The 0.1 C and 0.3 C steels underwent phase transformation from γ-austenite to ε-martensite or α’-martensite during tensile deformation. On the other hand, the 0.5 C steel underwent phase transformation only from γ-austenite to ε-martensite. The 0.3 C steel exhibited a low yield strength, a high strain hardening rate, and the smallest elongation. The high strain hardening of the 0.3 C alloy was due to a rapid phase transformation rate from γ-austenite to ε-martensite. The austenite of 0.5 C steel was strengthened by mechanical twinning during loading process, and the twinning-induced plasticity (TWIP) effect resulted in a large ductility. The 0.5 wt.% carbon addition stabilized the austenite phase by delaying the onset of the ε-martensite phase transformation.

1. Introduction

High-Mn steel often shows characteristics of transformation-induced plasticity (TRIP) and twinning-induced plasticity (TWIP) at room temperature because it contains various phases, including a metastable austenitic phase. When a dislocation glide and secondary deformation mechanisms such as TRIP/TWIP are activated together, high-Mn steel exhibits a superior ultimate tensile strength (UTS) and strain hardening rate due to the martensitic transformation acting on a hard phase and/or mechanical twinning, which is a planar obstacle that reduces a mean free path of dislocation glide [1]. The alloying elements significantly influence the phase transformation behavior of the high-Mn steel because they change the stacking fault energy (SFE), which can control the activation of the secondary deformation mechanism [2]. The SFE is changed by the chemical composition and deformation temperature. The TRIP deformation mode is known to be activated when the SFE value is less than 20 mJ/m2 [3,4,5]. Lee et al. [6] reported that the SFE decreases up to the addition of about 13 at.% Mn and then increases with a further increase of Mn content. In the case of carbon addition, the SFE increases and the austenite phase becomes more stabilized [7,8]. Thus, it is of great importance to understand how the addition of carbon and manganese elements influence the stability of the retained austenite associated with phase transformation, the SFEs, and the deformation mechanisms in high-Mn steel. In this work, high-Mn (17 wt.%) steels with different carbon contents (0.1, 0.3, and 0.5 wt.%C) were studied. The 17 wt.% Mn steel was specifically selected to observe characteristics of TRIP and/or TWIP as functions of the carbon composition. The alloys were plastically deformed under tensile loading, during which the evolution of various phases were examined using in situ neutron diffraction. In situ neutron diffraction is suitable for tracking phase transformation phenomena and monitoring the evolution of internal stresses among the various constituent phases in a bulk material due to its nature of deep penetration of neutrons inside metallic alloys [9]. The diffraction pattern of high-Mn TRIP steel contains many diffraction peaks, and it is very difficult to separate these peaks to analyze respective deformation behaviors among the various phases. Kwon et al. [10,11] studied a similar composition of TRIP steel using in situ neutron diffraction, and they analyzed constituent phases through the whole pattern via the application of the Rietveld method. Although electron backscatter diffraction (EBSD) and conventional X-ray diffraction (XRD) have been extensively used to examine the phase transformations among various phases, these analytical techniques have limitations in obtaining average information from the bulk sample. The current research requires either synchrotron high-energy XRD or neutron diffraction to study the phase transformation behavior in the bulk sample. The current study evaluates the effect of carbon addition on the phase transformation behavior and deformation characteristics of each phase of high-Mn steel using a bulk-averaged neutron diffraction technique.

2. Materials and Methods

2.1. Materials

The TRIP steels used in this study had a nominal composition of Fe-17Mn-xC (x = 0.1, 0.3, and 0.5 in wt.%). The analyzed chemical composition is shown in Table 1. The steels were manufactured through induction melting in an Ar atmosphere and soaking at 1150 °C for 2 h, followed by a hot rolling process with a total reduction of about 55% at the final rolling temperature of 850 °C (Figure 1). The specimens for the in situ neutron diffraction measurements were prepared as a cylindrical dog-bone sample according to ASTM standard E8.

2.2. In situ Neutron Diffraction

In situ neutron diffraction measurements were conducted during tensile deformation using the VULCAN engineering diffractometer at the Spallation Neutron Source (SNS) of the Oak Ridge National Laboratory. The neutron diffraction data were obtained continuously during tensile deformation. The applied loading axis was oriented at 45º from the neutron incident beam, as shown in Figure 2. The two stationary detector banks centered on diffraction angles of 2 θ = ± 90° recorded the entire time-of-flight (TOF) diffraction patterns with scattering vectors parallel and perpendicular to the applied load. Hence, interplanar spacings (d-spacings) parallel and perpendicular to the applied load were acquired as a function of applied stress from the sets of crystal planes. The VDRIVE [12] was employed to slice the load frame and neutron data into 4 min intervals, which was the minimum acquisition time to guarantee the suitable quality for diffraction peak analysis.

3. Results

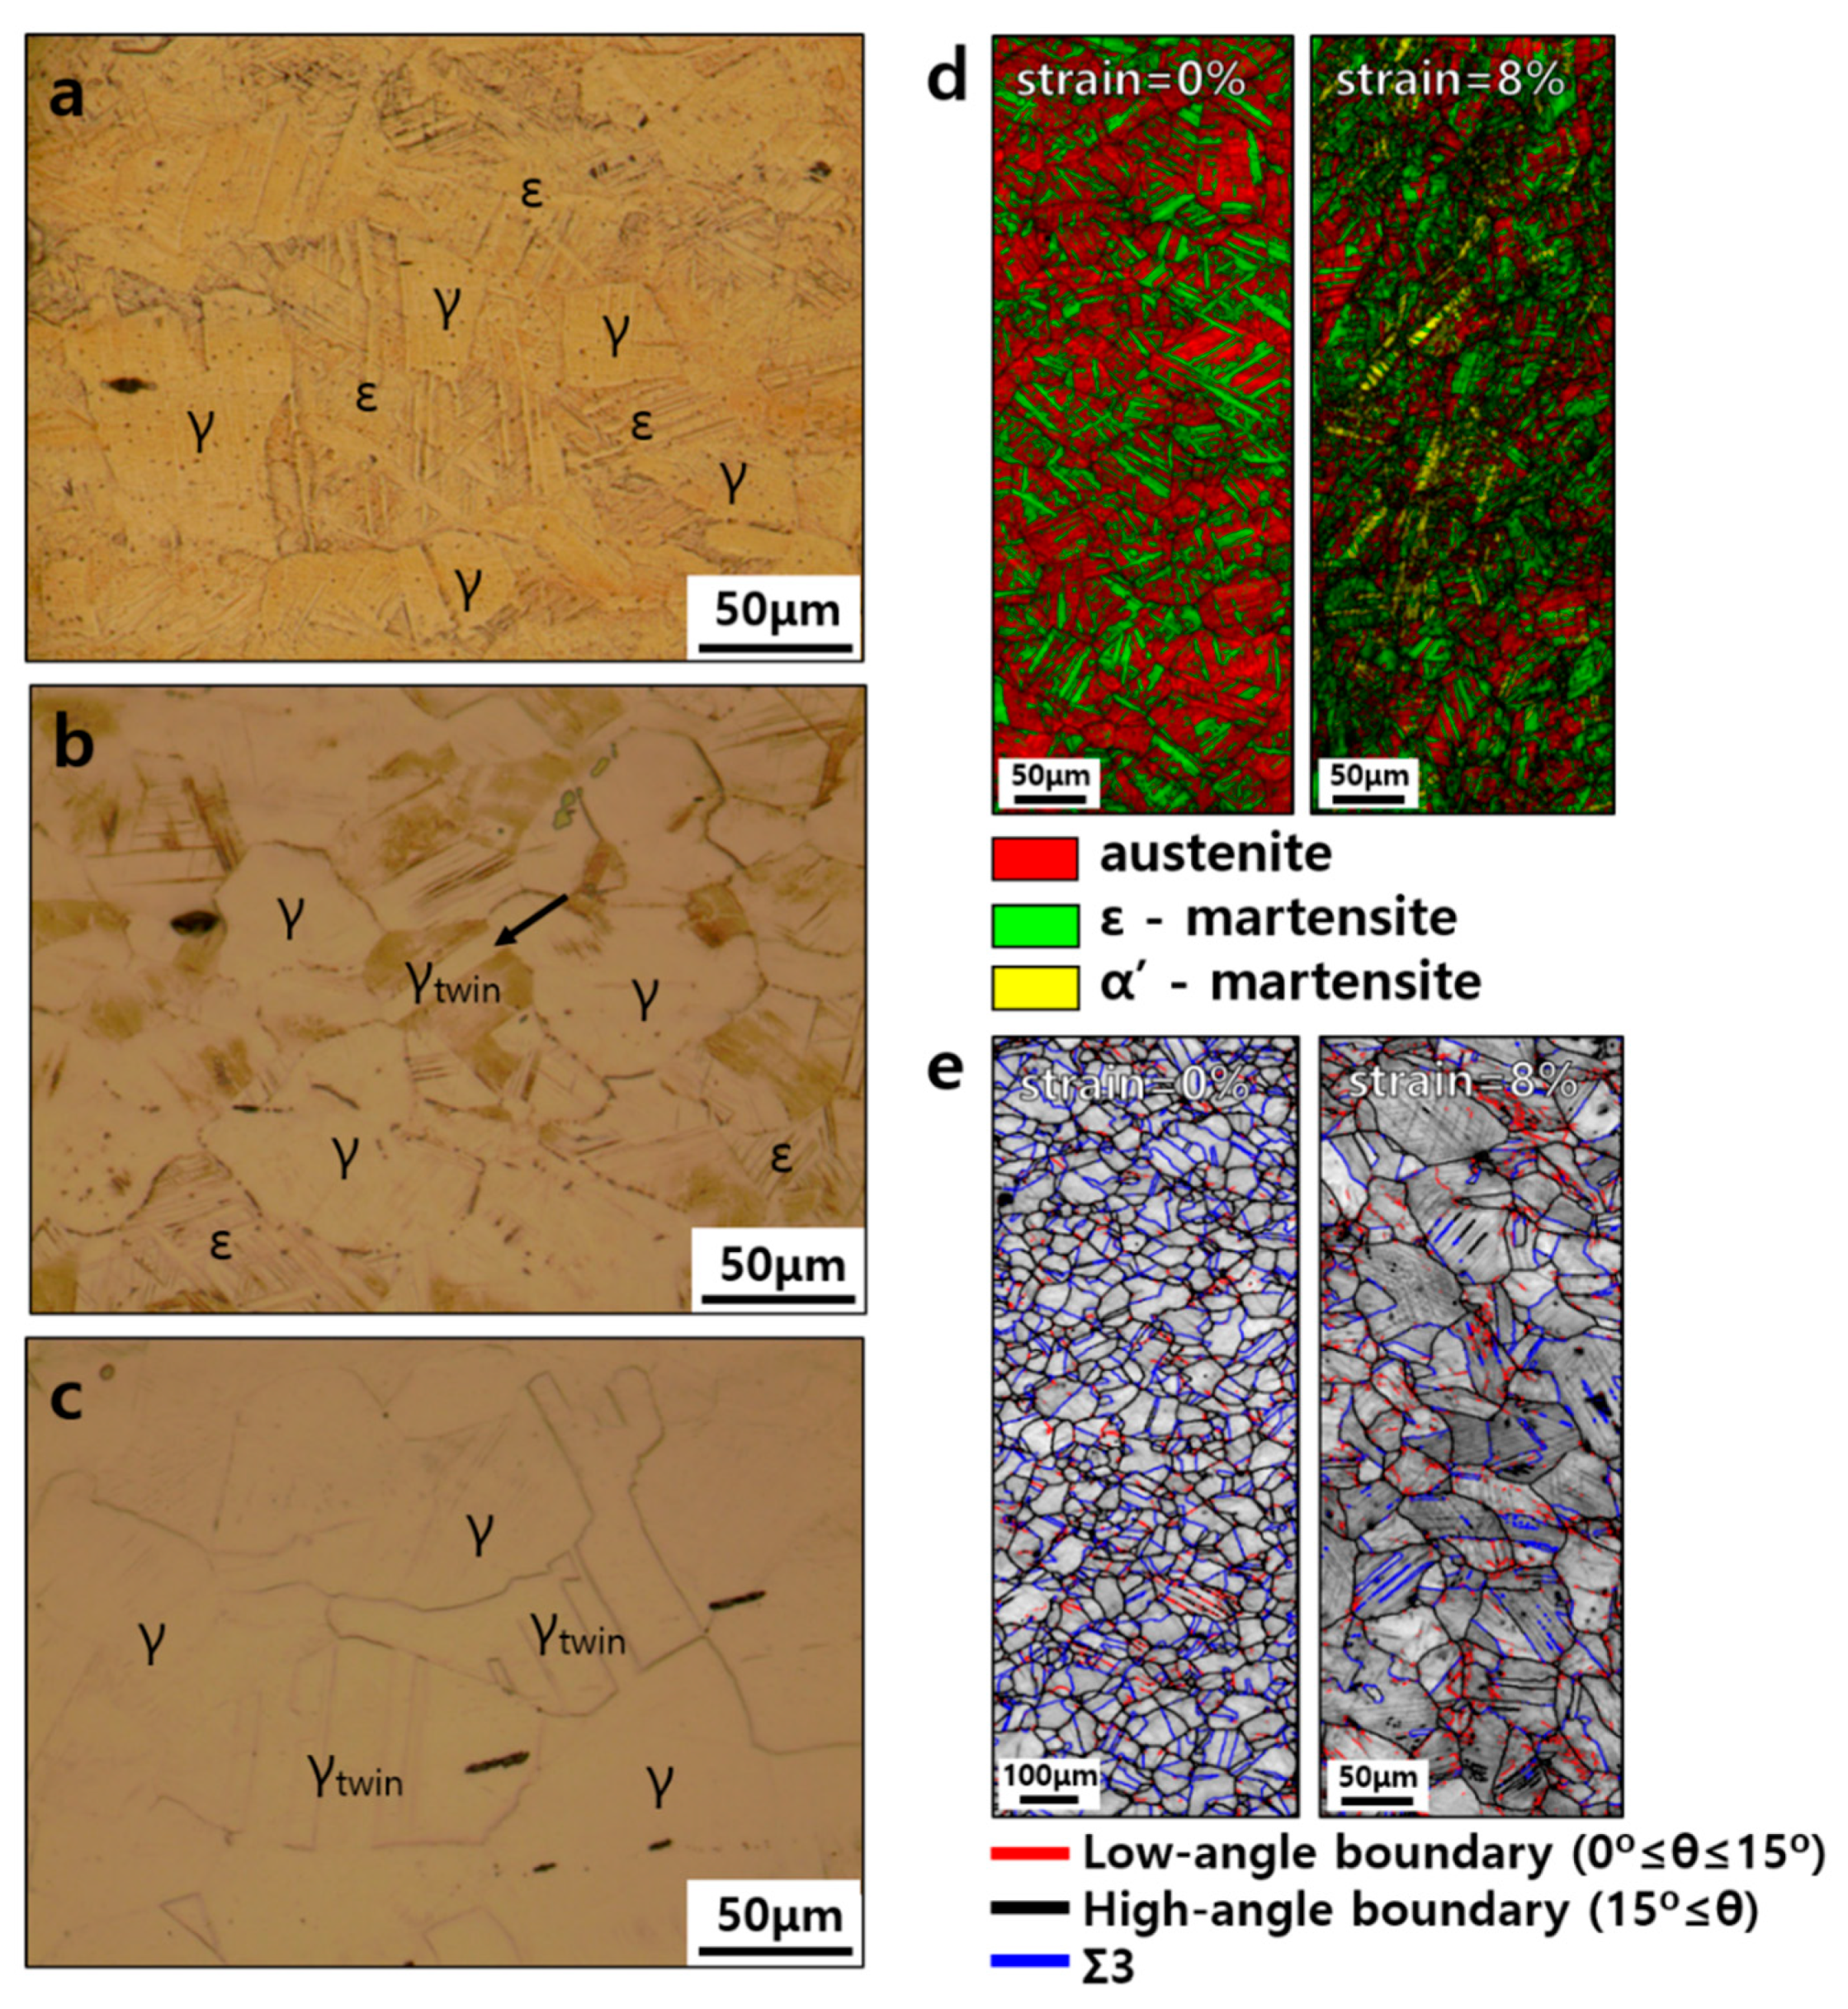
3.1. Microstructure and Stacking Fault Energies

The microstructures of the as-prepared and tensile-deformed specimens were examined using an optical microscope and electron backscatter diffraction (EBSD) (Figure 3). The two alloys except 0.5 C steel had two initial phases (austenite and ε-martensite), and the prior austenite grain size was ~70 μm. Some annealing twins and mechanical twins were observed for all three alloys (Figure 3) The SFEs were calculated using a thermodynamic model based on the Olson-Cohen model [13] as follows:
Γ = 2 ρ Δ G γ ε + 2 σ γ / ε + 2 ρ Δ G e x
where Γ is the SFE, ΔGγε is the difference in Gibbs free energy between the γ and ε phases, σγ/ε is the interfacial energy between the γ and ε phases, ρ is the molar surface density of {111}γ, and ΔGex is the excess free energy arising from the austenite grain size. The effective austenite grain sizes on the EBSD images of the 0.1 C and 0.5 C steels were about 20 and 40 μm, respectively. The free energy change and the interaction parameters were extracted from other studies [5,14,15,16,17,18]. The interfacial energy between austenite and ε-martensite is assumed to be 10 mJ/m2 [13]. Table 2 shows the stacking fault energies (SFEs) from the thermodynamic calculation and the deformation mode observed from the EBSD results.

3.2. Macroscopic Stress-Strain Responses

All three samples were deformed under tension, during which the samples were unloaded at a strain of ~10% and reloaded under tension until fracture (Figure 4). The engineering stress and engineering strain were obtained from the load frame data and the extensometer, respectively. The purpose of the unloading–reloading sequence is to examine whether the phase transformation is reversible. The 0.2% offset yield stresses were used to determine the yield strengths of each alloy by drawing the dashed lines parallel to the slope of elastic modulus of each alloy. The yield strength of the 0.1 C steel was the highest, and 0.3 C steel had the lowest yield strength. On the other hand, the ductility of the 0.5 C steel was the highest, showing a strain of ~21%. The second highest ductility was observed in the 0.1 C steel with a strain of ~15.5%. The 0.3 C steel exhibited the lowest elongation (13.5%) and yield strength (195 MPa), while the strain hardening rate was the highest among the three alloys.

3.3. Phase Transformation During in Situ Loading

The neutron diffraction patterns of the starting samples and those of samples subjected to a strain of 10% are compared in Figure 5. The 0.1 C steel initially had both γ-austenite and ε-martensite. After the plastic deformation of 10%, intensities in the γ diffraction peaks decreased, while the intensities in the ε-martensite and α’-martensite increased or evolved as a new peak. This indicates that phase transformation occurred from γ-austenite to ε-martensite or α’-martensite during tensile deformation. The 0.3 C steel at the initial state had γ-austenite as the major phase with a small amount of ε-martensite. Phase transformation was observed with a plastic deformation of 10%, indicating a slight increase in the α’{110} / ε{00.2} peaks or a significant increase in the ε{10.1} peak. However, the α’-martensitic transformation was not observed in the 0.5 C steel (Figure 5c). Regardless of the carbon content of the alloy, the peak intensities of the austenite weakened during the deformation, and those of the ε-martensite increased relatively or remained constant during deformation. The presence of non-increasing ε-peaks might be due to the competitive phase transformation between γ 🢂 ε and ε 🢂 α’.
The evolution of each phase during tensile deformation was analyzed by the Rietveld refinement using the GSAS (General Structure Analysis System) software [19,20] and the results are shown in Figure 6. In Figure 6, the accumulated stress shown in the x-axis was employed to clearly present the evolution of each phase chronologically as a function of the applied stress shown in Figure 4. The apparent phase transformation occurred in the first tensile loading treatment, as indicated by the changes in the phase fraction among the three phases. As the carbon content was increased from 0.1 C to 0.3 C, the γ-austenite phase transformed into the ε-martensite at approximately the same level of applied stress, but the phase transformation to the α’-martensite was delayed (Figure 6a,b). The onset of the phase transformation to the α’-martensite was delayed in the 0.5 C steel compared with to the other two alloys.

3.4. Lattice Strain Evolution

Figure 7 shows the lattice strain evolution as a function of applied stress for the various grain orientations in the 0.1 C steel. The lattice strains were calculated from the change in the interplanar spacings for each {hkl} of the diffraction pattern, as shown in Equation (2).
ε h k l = ( d h k l d 0 , h k l ) / d 0 , h k l
where dhkl is the interplanar spacing under an applied load, and d0,hkl is the reference interplanar spacing at the stress-free state [9]. The lattice strain identified by diffraction represents the elastic component of deformation that is obtained from the change of interplanar spacing in the grain whose normal plane is parallel to the applied stress. The lattice strains for different grains increase linearly with increasing applied stress at the early deformation. When the grain starts to undergo plastic deformation, the lattice strain starts to deviate from linearity, resulting in strain partitioning among the different grain orientations shown in Figure 7. When the polycrystalline materials are plastically deformed, the stresses acting on the grains are redistributed from the soft grains (which are easy to be deformed plastically (e.g., γ{111}, ε{10.3})) to the hard grains (which remain elastic even in macroscopic plastic regim and are hard to be deformed plastically (e.g., γ{200}, ε{10.0}, and α’{20.0})). It was found that hard orientation (a grain unfavorably oriented for easy deformation mode) showed tensile residual stresses upon unloading, while soft orientation (a grain favorably oriented for easy deformation mode) revealed compressive residual stresses due to the effect of the stress partitioning upon loading.
Figure 8 shows the lattice strain evolution of the 0.1 C and 0.3 C steels during the first loading part. Accumulated stress was introduced to clearly demonstrate the unloading process. σM,ε, σM,α’, and σy,bulk, shown by the vertical dotted line, indicate the onset of ε-martensite transformation, α’-martensite transformation, and 0.2% offset yield stress, respectively. The nonlinearlity in the lattice strain during loading is due to the micro-yielding of the particular grain orientation. Before σy,bulk, the 0.1 C steel showed a nonlinear elastic-lattice strain evolution. The nonlinear lattice strains were influenced by the phase transformation behavior, as reported by [11]. Beyond ~226 MPa, which marks the onset of ε-martensite phase transformation, the lattice strains of the austenite started deviating from the linear elastic response. When the α’-martensite phase started to evolve at σM,α’, the lattice strain of the austenite phase increased steadily. However, a slope change in the lattice strain of the ε-martensite was observed in some orientations (e.g., {10.0} and {10.1}), suggesting that the α’-martensite is generated from the ε-martensite phase, which is consistent with other literature [21,22].
The lattice strain behavior of the 0.3 C steel is somewhat similar to that of the 0.1 C steel. The change in the slope of austenite immediately reacted with the phase transformation to ε-martensite, and the slope of the austenite did not change with the formation of α’-martensite. In contrast, the different lattice strain evolution of ε{10.1} was observed in 0.3 C steel. The lattice strain increased initially with an increase in applied stress, but it became saturated before the occurrence of α’-martensite. The nucleation sites of α’-martensite are known as the intersection of the ε-martensite laths [21,22].

3.5. Stress Contribution from Each Phase

Figure 9 shows the phase stresses evaluated using Hooke’s law. We assumed that the transverse direction (TD) and normal direction (ND) strains were the same ( ε T D h k l = ε N D h k l ) due to the cylindrical geometry of the specimen. The longitudinal direction (LD, parallel to the applied tensile stress) stress levels of each phase were estimated as follows:
σ L D h k l = E h k l 1 + ν { ε L D h k l + ν 1 2 ν ( ε L D h k l + ε T D h k l + ε N D h k l ) }
where E h k l is the elastic modulus of the phase obatined from diffraction data, ε L D h k l is the axial lattice strain of the phase, and ν is the Poisson’s ratio. In this work, austenite and martensite used the {311} peak and averaged value, respectively, for calculation. The value of ε L D 311 is well known to represent average macroscopic strains for face-centered cubic alloy [23]. The fraction-weighted average stresses were calculated as follows:
σ t o t a l = f γ σ γ , L D + f ε σ ε , L D + f α σ α , L D
where f i is the phase fraction of each phase during deformation (Figure 6) and σ i , L D is the LD stress levels of each phase obtained from Equation (3). Figure 9 shows the difference in the stress contribution from each phase to the total macroscopic stress, calculated by Equation (4), as the carbon content increases. In the 0.1 C steel, γ-austenite and ε-martensite contributed equally in the elastic regime and early plastic deformation. With further plastic deformation beyond a 10% strain, the contribution of the ε-martensite was the highest followed by α’-martensite and γ-austenite. In the 0.3 C steel, the dominant stress contribution was from γ-austenite, and the contribution of ε-martensite increased gradually. At ~8% strain the hard-phase α’-martensite started contributing to the plastic deformation. In the 0.5 C steel, the dominant contribution to tensile deformation was from γ-austenite, with a small contribution of ε-martensite.

4. Discussion

Reed and Schramm [24] reported that the difference in the peak shifts between γ{111} and γ{222} might be due to the elastic strain and structure factor of the stacking faults for the austenitic steel. The stacking fault energy (SFE) can be calculated from the change in the diffraction peak position of γ{111} and γ{222}. However, the difference in the peak shift of γ{111} and γ{222} was not significant (Figure 7 and Figure 8). This means that the SFE of the 17wt.% Mn steels was too small to be estimated from diffraction, and residual stacking faults are rare since the ε-martensite transformation is very active. On the other hand, in the case of TWIP steel with a similar composition, not only do various twins exist after deformation, but the residual stacking faults also remain due to planar slip [25,26]. In the ternary Fe-Mn-C system, a SFE exceeding 20 mJ/m2 is needed to ensure the twinning mode [7,27,28]. Although the SFE of 0.5 C steel is less than 20 mJ/m2, the EBSD measurement confirmed mechanical twinning in the alloy. The deviation of the γ{111} and γ{222} lattice strains in the 0.5 C steel closely reflects the increase of SFEs during deformation.
The macroscopic stress–strain response is influenced by microstructural evolution and phase transformation characteristics during deformation. The 0.1 C steel showed the highest ultimate tensile strength (UTS) among the three alloys, because the 0.1 C steel had the largest amount of α’-martensite. With increasing applied stress, the evolution rate of α’-martensite in the stress contribution was the highest among the constituent phases. In the case of the 0.3 C steel, the rapid phase transformation rate with the early activation resulted in a higher strain hardening rate and shorter elongation than 0.1 C and 0.5 C steels. Less α’-martensite was produced in the 0.3 C steel compared with the 0.1 C steel, and no mechanical twinning was activated, unlike the 0.5 C steel. The phase transformation from γ-austenite to ε-martensite was delayed in 0.5 C steel, as compared with the 0.1 C and 0.3 C steels. The higher carbon content of 0.5 C steel stabilized the austenite phase by delaying phase transformation during deformation. It also contributed to hardening and elongation by providing the increased stacking fault energy to activate the mechanical twinning.

5. Conclusions

We investigated the influence of carbon addition on the phase transformation behavior of high-Mn steels using in situ neutron diffraction at room temperature. The important findings are summarized as follows:
As the carbon content was increased from 0.1 C to 0.5 C, the stacking fault energies of 17wt.% Mn steels increased from ~0.65 to ~16.5 mJ/m2. The 0.1 C and 0.3 C steels initially had both γ-austenite and ε-martensite, and underwent a phase transformation from γ-austenite to ε-martensite or α’-martensite during tensile deformation. On the other hand, the 0.5 C steel initially had only γ-austenite, and no transformation of α’-martensite occurred.
The highest yield strength and tensile strength in the early plastic regime of the 0.1 C steel were attributed to the relatively large amount of ε-martensite phase and the continuous phase transformation from γ-austenite to ε-martensite. The large amount of α’-martensite formed in the higher plastic regime resulted in the highest UTS. The 0.3 C steel exhibited a low yield strength, a high strain hardening rate, and the shortest elongation. The high strain hardening of the 0.3 C steel was due to the rapid phase transformation rate from γ-austenite to ε-martensite compared with the other alloys.
In the 0.5 C steel with a SFE of ~18 mJ/m2, the austenite was strengthened by mechanical twinning during the loading process, and the TWIP effect resulted in a large ductility. The 0.5 C steel only underwent a phase transformation from γ-austenite to ε-martensite, and the α’-martensite transformation was not observed in any of the regimes. The 0.5 wt.% carbon addition appears to have stabilized the austenite phase by delaying the onset of the ε-martensite phase transformation.

Author Contributions

Conceptualization, S.Y.L.; data analysis, Y.K., W.C. and S.Y.L.; neutron experiment, H.C., K.A.; writing—original draft preparation, Y.K. and S.Y.L.; writing—review and editing, H.C., K.A., H.-S.C. and S.Y.L.; supervision, S.Y.L. All authors have read and agreed to the published version of the manuscript.

Funding

This work was supported by a National Research Foundation (NRF) grant funded by the Korean government (No. 2013R1A1A1076023, No, 2017R1A4A1015360, No. 2019R1H1A2080092).

Acknowledgments

A portion of this research used resources at the Spallation Neutron Source, a DOE Office of Science User Facility operated by the Oak Ridge National Laboratory.

Conflicts of Interest

The authors declare no conflict of interest.

References

  1. Bouaziz, O.; Allain, S.; Scott, C.P.; Cugy, P.; Barbier, D. High manganese austenitic twinning induced plasticity steels: A review of the microstructure properties relationships. Curr. Opin. Solid State Mater. Sci. 2011, 15, 141–168. [Google Scholar] [CrossRef]
  2. Tomota, Y.; Strum, M.; Morris, J.W., Jr. Microstructural dependence of Fe-high Mn tensile behavior. Mater. Trans. A 1986, 17, 537–547. [Google Scholar] [CrossRef]
  3. Remy, L.; Pineau, A. Twinning and strain-induced FCC→HCP transformation in the Fe-Mn-Cr-C system. Mater. Sci. Eng. 1977, 28, 99–107. [Google Scholar] [CrossRef]
  4. Sato, K.; Ichinose, M.; Hirotsu, Y.; Inoue, Y. Effects of deformation induced phase transformation and twinning on the mechanical properties of austenitic Fe–Mn–Al alloys. ISIJ Int. 1989, 29, 868–877. [Google Scholar] [CrossRef]
  5. Allain, S.; Chateau, J.-P.; Bouaziz, O.; Migot, S.; Guelton, N. Correlations between the calculated stacking fault energy and the plasticity mechanisms in Fe–Mn–C alloys. Mater. Sci. Eng. A 2004, 387–389, 158–162. [Google Scholar] [CrossRef]
  6. Lee, Y.-K.; Choi, C.-S. Effects of thermal cycling on the kinetics of the γε martensitic transformation in an Fe-17 wt pct Mn alloy. Metall. Mater. Trans. A 2000, 31, 355–360. [Google Scholar] [CrossRef]
  7. Saeed-Akbari, A.; Imlau, J.; Prahl, U.; Bleck, W. Derivation and variation in composition-dependent stacking fault energy maps based on subregular solution model in high-manganese steels. Metall. Mater. Trans. A 2009, 40, 3076–3090. [Google Scholar] [CrossRef]
  8. Andrews, K.W. The calculation of transformation temperatures and austenite-ferrite equilibria in steels. J. Iron. Steel. Inst. 1956, 184, 414–427. [Google Scholar]
  9. Hutchings, M.T.; Withers, P.J.; Holden, T.M.; Lorentzen, T. Introduction to the Characterization of Residual Stress by Neutron Diffraction; Taylor & Francis Group: Boca Raton, FL, USA, 2005; pp. 160–192. [Google Scholar]
  10. Kwon, K.H.; Suh, B.-C.; Baik, S.-I.; Kim, Y.-W.; Choi, J.-K.; Kim, N.J. Deformation behavior of duplex austenite and ε-martensite high-Mn steel. Sci. Technol. Adv. Mater. 2013, 14, 014204. [Google Scholar] [CrossRef] [Green Version]
  11. Kwon, K.H.; Jeong, J.S.; Choi, J.-K.; Koo, Y.M.; Tomota, Y.; Kim, N.J. In situ neutron diffraction analysis on deformation behavior of duplex high Mn steel containing austenite and ε-Martensite. Met. Mater. Int. 2012, 18, 751–755. [Google Scholar] [CrossRef]
  12. An, K. VDRIVE- Data Reduction and Interactive Visualization Software for Event Mode Neutron Diffraction; ORNL Report ORNL-TM-2012-621; Oak Ridge National Laboratory: Tennessee, TN, USA, 2012.
  13. Olson, G.B.; Cohen, M. A general mechanism of martensitic nucleation: Part II. FCC→BCC and other martensitic transformations. Metall. Trans. A 1976, 7, 1905–1914. [Google Scholar] [CrossRef]
  14. Dumay, A.; Chateau, J.-P.; Allain, S.; Migot, S.; Bouaziz, O. Influence of addition elements on the stacking-fault energy and mechanical properties of an austenitic Fe–Mn–C steel. Mater. Sci. Eng. A 2008, 483–484, 184–187. [Google Scholar] [CrossRef]
  15. Dew-Hughes, D.; Kaufman, L. Ternary phase diagrams of the manganese-titanium-iron and the aluminum-titanium-iron systems: A comparison of computer calculations with experiment. Calphad 1979, 3, 175–203. [Google Scholar] [CrossRef]
  16. Breedis, J.F.; Kaufman, L. The formation of Hcp and Bcc phases in austenitic iron alloys. Metall. Trans. 1971, 2, 2359–2371. [Google Scholar] [CrossRef]
  17. Yang, W.S.; Wan, C.M. The influence of aluminium content to the stacking fault energy in Fe-Mn-Al-C alloy system. J. Mater. Sci. 1990, 25, 1821–1823. [Google Scholar] [CrossRef]
  18. Lee, Y.-K. Relationship between austenite dislocation density introduced during thermal cycling and M s temperature in an Fe-17 wt pct Mn alloy. Metall. Mater. Trans. A 2002, 33, 1913–1917. [Google Scholar] [CrossRef]
  19. Larson, A.C.; Von Dreele, R.B. General Structure Analysis System (GSAS); Los Alamos National Laboratory Report LAUR: California, CA, USA, 2000.
  20. Toby, B.H.; Von Dreele, R.B. GSAS-II: The genesis of a modern open-source all purpose crystallography software package. J. Appl. Crystallogr. 2013, 46, 544–549. [Google Scholar] [CrossRef]
  21. Bracke, L.; Kestens, L.; Penning, J. Transformation mechanism of α′-martensite in an austenitic Fe–Mn–C–N alloy. Scripta Mater. 2007, 57, 385–388. [Google Scholar] [CrossRef]
  22. Seol, J.-B.; Jung, J.E.; Jang, Y.W.; Park, C.G. Influence of carbon content on the microstructure, martensitic transformation and mechanical properties in austenite/ε-martensite dual-phase Fe–Mn–C steels. Acta Mater. 2013, 61, 558–578. [Google Scholar] [CrossRef]
  23. Harjo, S.; Tsuchida, N.; Abe, J.; Gong, W. Martensite phase stress and the strengthening mechanism in TRIP steel by neutron diffraction. Sci. Rep. 2017, 7, 15149. [Google Scholar] [CrossRef]
  24. Reed, R.P.; Schramm, R.E. Relationship between stacking fault energy and x-ray measurements of stacking fault probability and microstrain. J. Appl. Phys. 1974, 45, 4705–4711. [Google Scholar] [CrossRef]
  25. Kang, M.; Woo, W.; Lee, Y.K.; Seong, B.S. Neutron diffraction analysis of stacking fault energy in Fe–18Mn–2Al–0.6C twinning-induced plasticity steels. Mater. Lett. 2012, 76, 93–95. [Google Scholar] [CrossRef]
  26. Gutiérrez-Urrutia, I.; Raabe, D. Multistage strain hardening through dislocation substructure and twinning in a high strength and ductile weight-reduced Fe–Mn–Al–C steel. Acta Mater. 2012, 60, 5791–5802. [Google Scholar] [CrossRef]
  27. Tian, X.; Li, H.; Zhang, Y. Effect of Al content on stacking fault energy in austenitic Fe–Mn–Al–C alloys. J. Mater. Sci. 2008, 43, 6214–6222. [Google Scholar] [CrossRef]
  28. Huang, B.X.; Wang, X.D.; Wang, L.; Rong, Y.H. Effect of nitrogen on stacking fault formation probability and mechanical properties of twinning-induced plasticity steels. Metall. Mater. Trans. A 2008, 39, 717–724. [Google Scholar] [CrossRef]
Figure 1. The manufacturing history of the tested materials.
Crystals 10 00101 g001
Figure 2. Schematic of the in situ neutron diffraction experiment.
Crystals 10 00101 g002
Figure 3. Optical microscopy and EBSD measurements of 17wt.% Mn steel: (a) OM image of the 0.1 C steel; (b) OM image of the 0.3 C steel; (c) OM image of the 0.5 C steel; (d) EBSD phase map of 0.1 C steel; (e) EBSD image quality (IQ) map of 0.5 C steel. Note that the blue line inside the grains shows formed mechanical twins.
Crystals 10 00101 g003
Figure 4. The macroscopic stress–strain response acquired during in situ loading neutron diffraction experiments of Fe-17wt.% Mn steels. Note that red square, blue circle, and green triangle symbols represent the stress-strain responses for 0.1 C steel, 0.3 C steel, and 0.5 C steel, respectively. The inset is a zoom-in of the stress–strain curve at the initial stage to compare 0.2% offset yield stresses among the three alloys.
Crystals 10 00101 g004
Figure 5. Neutron diffraction patterns at the initial state (starting sample) and at a strain of 10%: (a) 0.1 C; (b) 0.3 C; (c) 0.5 C. Note that black lines represent the initial state, and red lines represent the diffraction patterns after 10% straining.
Crystals 10 00101 g005
Figure 6. Evolution of the phase fraction under accumulated stress: (a) 0.1 C, (b) 0.3 C, and (c) 0.5 C alloy. Note red squares represent austenite, blue circles represent ε-martensite, and green triangles represent α’-martensite.
Crystals 10 00101 g006
Figure 7. Lattice strain evolutions of various grain orientations under applied stress in the 0.1 C steel: (a) γ-austenite; (b) ε-martensite; (c) α´-martensite.
Crystals 10 00101 g007
Figure 8. Lattice strain evolution of 0.1 C and 0.3 C alloys during the first loading part: (a) austenite of 0.1 C; (b) ε-martensite of 0.1 C; (c) α’-martensite of 0.1 C; (d) austenite of 0.3 C; (e) ε-martensite of 0.3 C; (f) α’-martensite of 0.3 C.
Crystals 10 00101 g008
Figure 9. Stress contribution from each phase to the total macroscopic stresses: (a) 0.1 C; (b) 0.3 C; (c) 0.5 C.
Crystals 10 00101 g009
Table 1. The analyzed chemical composition of the specimens.
(wt.%)FeMnCCuCrNiZnPS
0.1 CBal.16.400.1090.470.190.260.150.020.01
0.3 CBal.16.350.3720.590.200.300.320.010.05
0.5 CBal.16.780.5350.520.140.140.330.020.04
Table 2. The calculated SFEs and the measured deformation mode of 17wt.% Mn steels.
SFE(mJ/m2)TRIPTWIP
0.1 C steel0.5–0.8-
0.3 C steel9.9–11.6
0.5 C steel15.2–17.8
○: Measured in EBSD image
△: Measured only in OM image
-: Not observed

