Article

Synthesis by Hydrothermal Treatment of ZnO-Based Varistors Doped with Rare Earth Oxides and Their Characterization by Impedance Spectroscopy

by
J. Porcayo-Calderon
1,*,
J.J. Ramos-Hernandez
2,
C.D. Arrieta-Gonzalez
3,
J.G. Chacon-Nava
4,
J.G. Gonzalez-Rodriguez
1,
E. Porcayo-Palafox
1,
M. Sanchez-Carrillo
5,
J.P. Flores-De los Rios
5 and
L. Martinez-Gomez
2
1
Centro de Investigación en Ingeniería y Ciencias Aplicadas, Universidad Autónoma del Estado de Morelos, Avenida Universidad 1001, 62209 Cuernavaca, Mexico
2
Instituto de Ciencias Físicas, Universidad Nacional Autónoma de Mexico, Avenida Universidad s/n, 62210 Cuernavaca, Mexico
3
Tecnológico Nacional de Mexico-Instituto Tecnológico de Zacatepec, Calzada Instituto Tecnológico 27, 62780 Zacatepec, Mexico
4
Centro de Investigación en Materiales Avanzados (CIMAV), Miguel de Cervantes 120, Complejo Industrial Chihuahua, 31136 Chihuahua, Mexico
5
Tecnológico Nacional de Mexico-Instituto Tecnológico de Chihuahua, Av. Tecnologico 2909, 31130 Chihuahua, Mexico
*
Author to whom correspondence should be addressed.
Crystals 2020, 10(12), 1134; https://doi.org/10.3390/cryst10121134
Submission received: 6 November 2020 / Revised: 7 December 2020 / Accepted: 10 December 2020 / Published: 12 December 2020
(This article belongs to the Section Crystal Engineering)

Abstract

:
ZnO-based ceramic varistors have shown excellent electrical and dielectric properties due to their characteristics microstructures represented by the arrangement of their grains and grain boundaries that allow the absorption and flow of energy when subjected to an electrical surge. Their properties and characteristics depend on their chemical compositions and processing routes. Typical processing routes involve several stages of grinding and precalcination—which are time consuming processes. Because of this, this study proposes a simpler and cheaper alternative route for processing ceramic varistors. The alternative process proposed is the mixing of the precursor oxides by means of a hydrothermal treatment. The characteristics and properties of the synthesized ceramic varistors were evaluated by means of scanning electron microscopy, X-ray diffraction and impedance spectroscopy, considering the effect of the addition of rare earth oxides (La2O3, CeO2 and Nd2O3). The results showed that the mixing of the oxides through hydrothermal treatment produces ceramic varistors with characteristics and properties similar to those obtained by other processing routes. Furthermore, it was observed that the addition of rare earth oxides affects the characteristics and properties of the ceramic varistor depending on the type of rare earth oxide added, its concentration and ionic radius.

1. Introduction

Due to its extraordinary electrical, dielectric and optical properties, zinc oxide (ZnO) has been used in various industrial applications, and one of the most notable applications is its use in varistor systems [1]. ZnO-based ceramic varistors are used as surge protection devices in the electronics industry and as lightning conductors in power distribution systems. Ceramic varistors show non-ohmic behavior attributed to their microstructure and to the conduction processes that take place between the different phases present [2]. The varistor behavior depends on the different components added to its formulation, where Bi2O3 is one of the main components and it is responsible for inducing non-linear behavior, while on the other hand Sb2O3 and other oxides enhance the non-linearity of the ceramic varistor [3].
Ceramic varistors have a high dielectric constant due to the formation of (non-conductive grain boundary–conductive grain) pairs [4]. In particular, grain boundaries act as potential barriers because they favor the absorption and flow of energy when subjected to an electrical surge [5]. The microstructure of a typical ceramic varistor is heterogeneous in nature and consists of three main phases, namely ZnO grains and grain boundaries consisting of a bismuth-rich phase and a spinel phase (Zn7Sb2O12) [6]. In general, ceramic varistors behave as variable resistance systems with a resistive behavior at low voltages and as a conductor at a certain voltage [5]. This behavior is possible due to the existing arrangement between the grains and grain boundary, which behave like a multiple bonding device with serial and parallel connections [7,8,9].
The particular performance of a ceramic varistor can be obtained from its V–I relationship. The characteristic footprint of the V–I relationship comprises three main regions: a low current region (1), a non-linearity region (2) and a pickup region (3). In region 1, known as the linear region, an ohmic behavior is observed where the current is a function of the resistivity of the grain boundaries, which is 10 orders of magnitude greater than the ZnO grain resistivity [10,11]. The maximum voltage reached in region 1 is known as the breakdown voltage, and it has been found to be inversely proportional to the grain size [12]. In region 2 the current suddenly increases several orders of magnitude, with an insignificant increase in voltage. In this region the current is expressed as: I = kVα, where I is the current, V the voltage, k is a constant related to the microstructure and α is the non-linearity coefficient. In region 3, there is a high current level and the loss of non-linearity. The observed V–I behavior is a function of the characteristics of the double Schottky barrier formed at the grain boundaries, therefore, both the chemical composition and the sintering process of the ceramic varistor are important in defining this behavior.
Various attempts have been made to improve the V–I characteristics of ceramic varistors, one of them being the reduction in the size of ZnO grains. In this sense, it has been reported that the addition of small amounts of dopants can affect the electrical and dielectric properties of the ceramic varistor [1]. In particular, it has been observed that the addition of rare earth oxides shows a strong effect in reducing the grain size [3,13,14,15,16,17,18,19], thus affecting the electrical and dielectric properties of ceramic varistors. However, many of these studies have been carried out by conventional grinding and precalcination processes of the precursor oxides, which are time consuming in the manufacture of ceramic varistors.
Based on the above, this study proposes the elaboration of ceramic varistors through the hydrothermal treatment of the precursor oxides, and their subsequent calcination. This process eliminates typical mechanical mixing steps, thus reducing processing times. The ceramic varistors thus synthesized were evaluated by analyzing the effect of the addition of rare earth oxides (La2O3, CeO2 and Nd2O3) on their microstructural characteristics and the properties of grains and grain boundaries by means of impedance spectroscopy.

2. Materials and Methods

In this work, a formulation similar to that reported by Keil et al. [20] was used with some modifications. The chemical composition of the base formulation consisted of zinc oxide (ZnO) with a content of 0.5 mol% of the following transition metal oxides: bismuth oxide (Bi2O3), antimony oxide (Sb2O3), cobalt oxide (Co2O3), manganese oxide, (MnO2), chromium oxide (Cr2O3) and nickel oxide (NiO). Base formulation was doped with rare earth oxides (REOs) such as La2O3, CeO2 and Nd2O3. The REOs concentration added was 0.1, 0.25 and 0.5 mol%, and keeping constant the amount of the transition metal oxides, and only decreasing proportionally the amount of ZnO. The raw materials used were Sigma-Aldrich© with a purity of 99.8%.
The mixing and homogenization of the different metal oxides used was carried out by means of hydrothermal treatment. This processing route allows for reduced processing times compared to traditional methods. In summary, each formulation (10 grams) was hydrothermally treated in a Teflon-lined autoclave at 200 °C for 24 h. The mixture was kept under constant stirring using a magnetic stirrer. After hydrothermal treatment, the resulting slurry was dried at 60 °C for 12 h, and then pulverized in an agate mortar. From the resulting mixture, 1.7 gram samples were pressed at 70 MPa using a hydraulic laboratory press. With this amount of mass, the average diameter of the green body was 12.8 mm and its height varied between 4.11 and 4.38 mm. The working pressure used was based on working pressures suggested in similar studies [21].
The sintering of the green-bodies was carried out in an electric furnace under an air atmosphere. The green-bodies were subjected to a heat treatment from room temperature to 320 °C with a holding time of 60 minutes to remove both moisture and binder [22], then the temperature was increased to 1200 °C and was held for 120 minutes. Finally, the ceramic varistors were naturally cooled inside the furnace. In all cases, the heating rate was 5 °C/min.
The morphological aspects of the ceramic varistors were performed using a scanning electron microscope (SEM, JEOL model JSM IT 500). Elemental chemical analysis and element mapping were carried out using an energy dispersion spectrometer (EDS) coupled to the SEM.
The grain size distribution was carried out by measuring the grain size of at least 150 randomly selected grains [23] using the ImageJ software [24]. The formula d = 1.56 L was applied to each measurement, where d is the grain size and L is the length of the line that touches two faces of the grain (passing through the center of the grain) [25,26,27].
The structural properties of ceramic varistors were determined using a BRUKER© Model D8 Advance Eco diffractometer. X-ray diffraction patterns (XRD) were taken in the range of 10° to 100° (2θ) with a scanning rate of 0.02°s-1 with Cu-Ka radiation (wavelength 1.54 Å).
Impedance spectra were obtained using an Interphase 1000 potentiostat/galvanostat/ZRA analyzer from Gamry, in a frequency range of 100 kHz to 0.001 Hz and a sinusoidal voltage of 1 V at room temperature. Prior to impedance characterization, both surfaces were coated with silver paste and fired at 550 °C in air for 15 min.

3. Results and Discussions

3.1. XRD Analysis

Figure 1 shows the diffractogram of the base ceramic varistor, it is observed that the highest intensity peaks correspond to ZnO, and the lowest intensity peaks correspond to the spinel (Zn7Sb2O12) and a Bi2O3-rich phase [28,29]. The diffraction pattern shows the polycrystalline nature of the identified phases and the hexagonal structure of ZnO [1]. The presence of both Bi2O3 and Sb2O3, in the formulation of the base ceramic varistor, are important since the first one is responsible for the nonlinear characteristics of the ceramic varistor and the second one is responsible for the formation of the spinel that inhibits growth ZnO grain [3]. The absence of signals corresponding to the pyrochlorine phase (Bi3Zn2Sb3O14), which forms at temperatures between 700 and 900 °C, indicates its complete decomposition. This decomposition reaction occurs between 900 and 1050 °C according to the following reaction:
2 Bi3Zn2Sb3O14 (s) + 17 ZnO (s) → 3 Zn7Sb2O12 (s) + 3 Bi2O3,
Corresponding peaks were not identified for the other dopants (Cr, Mn, Co, Ni). This may be because they were part of a solid solution in Bi2O3 or ZnO [28] or they could form spinels with a crystalline structure and diffraction pattern similar to that of the spinel phase (Zn7Sb2O12).
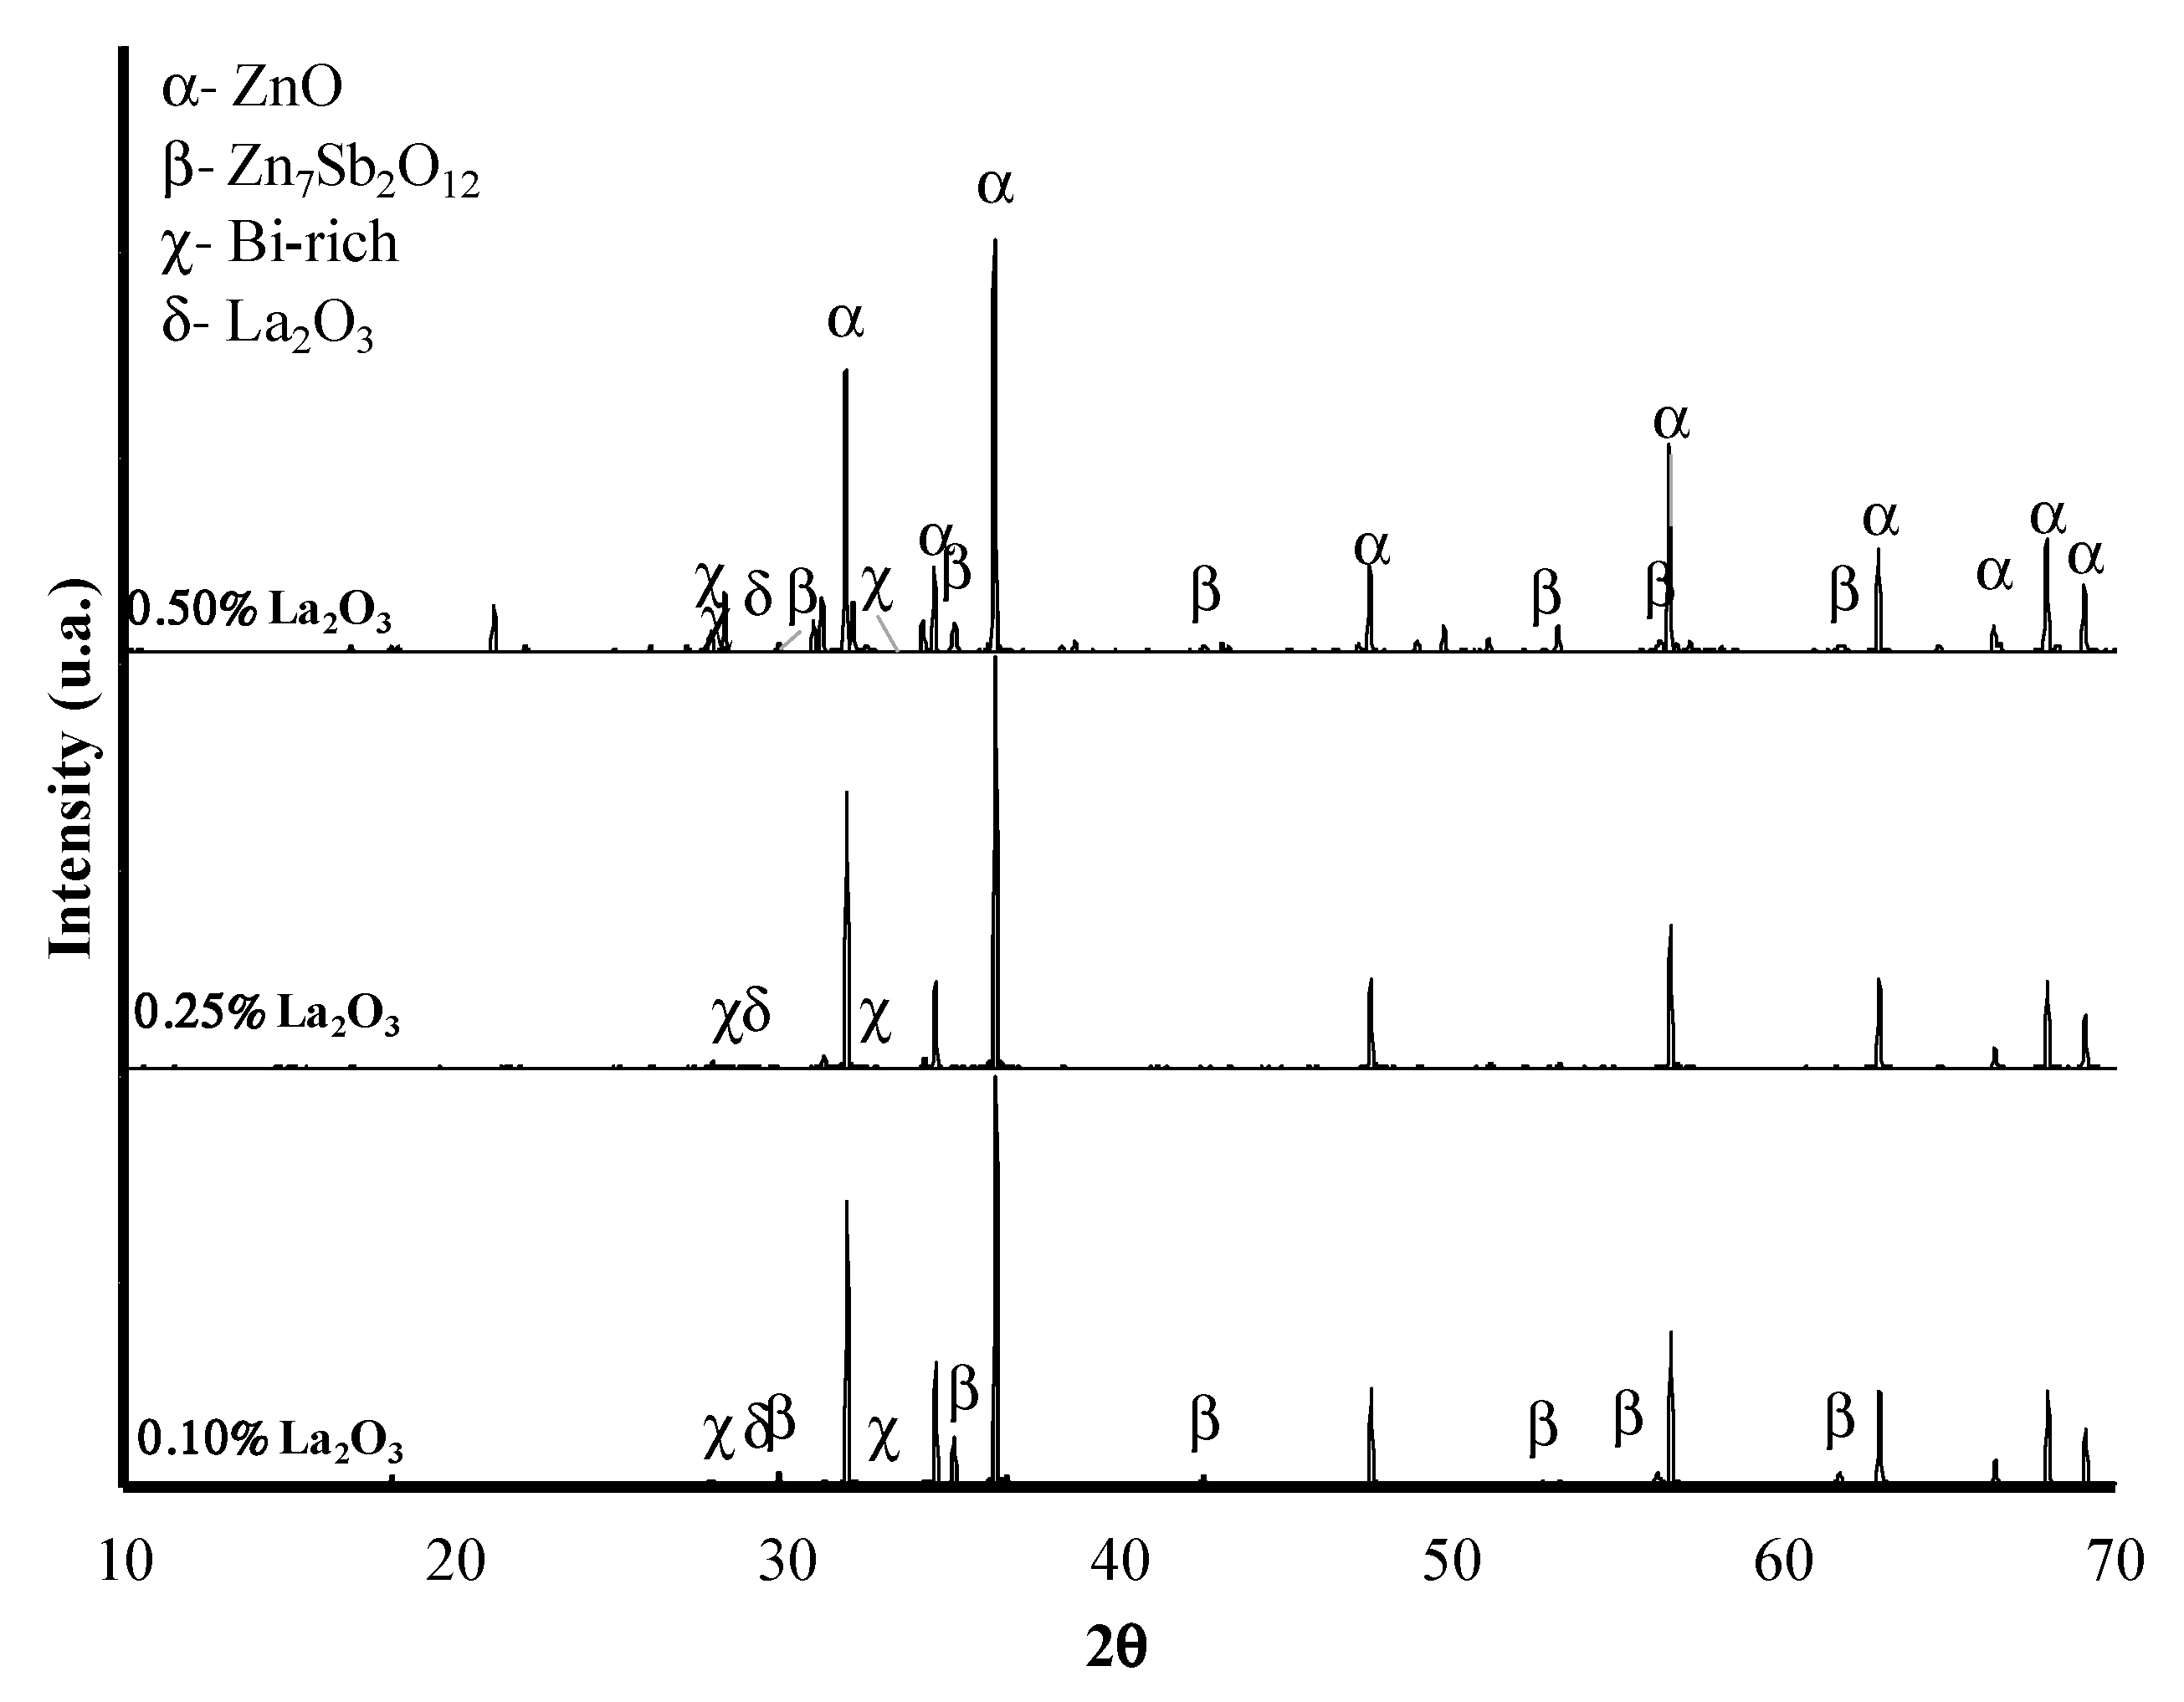
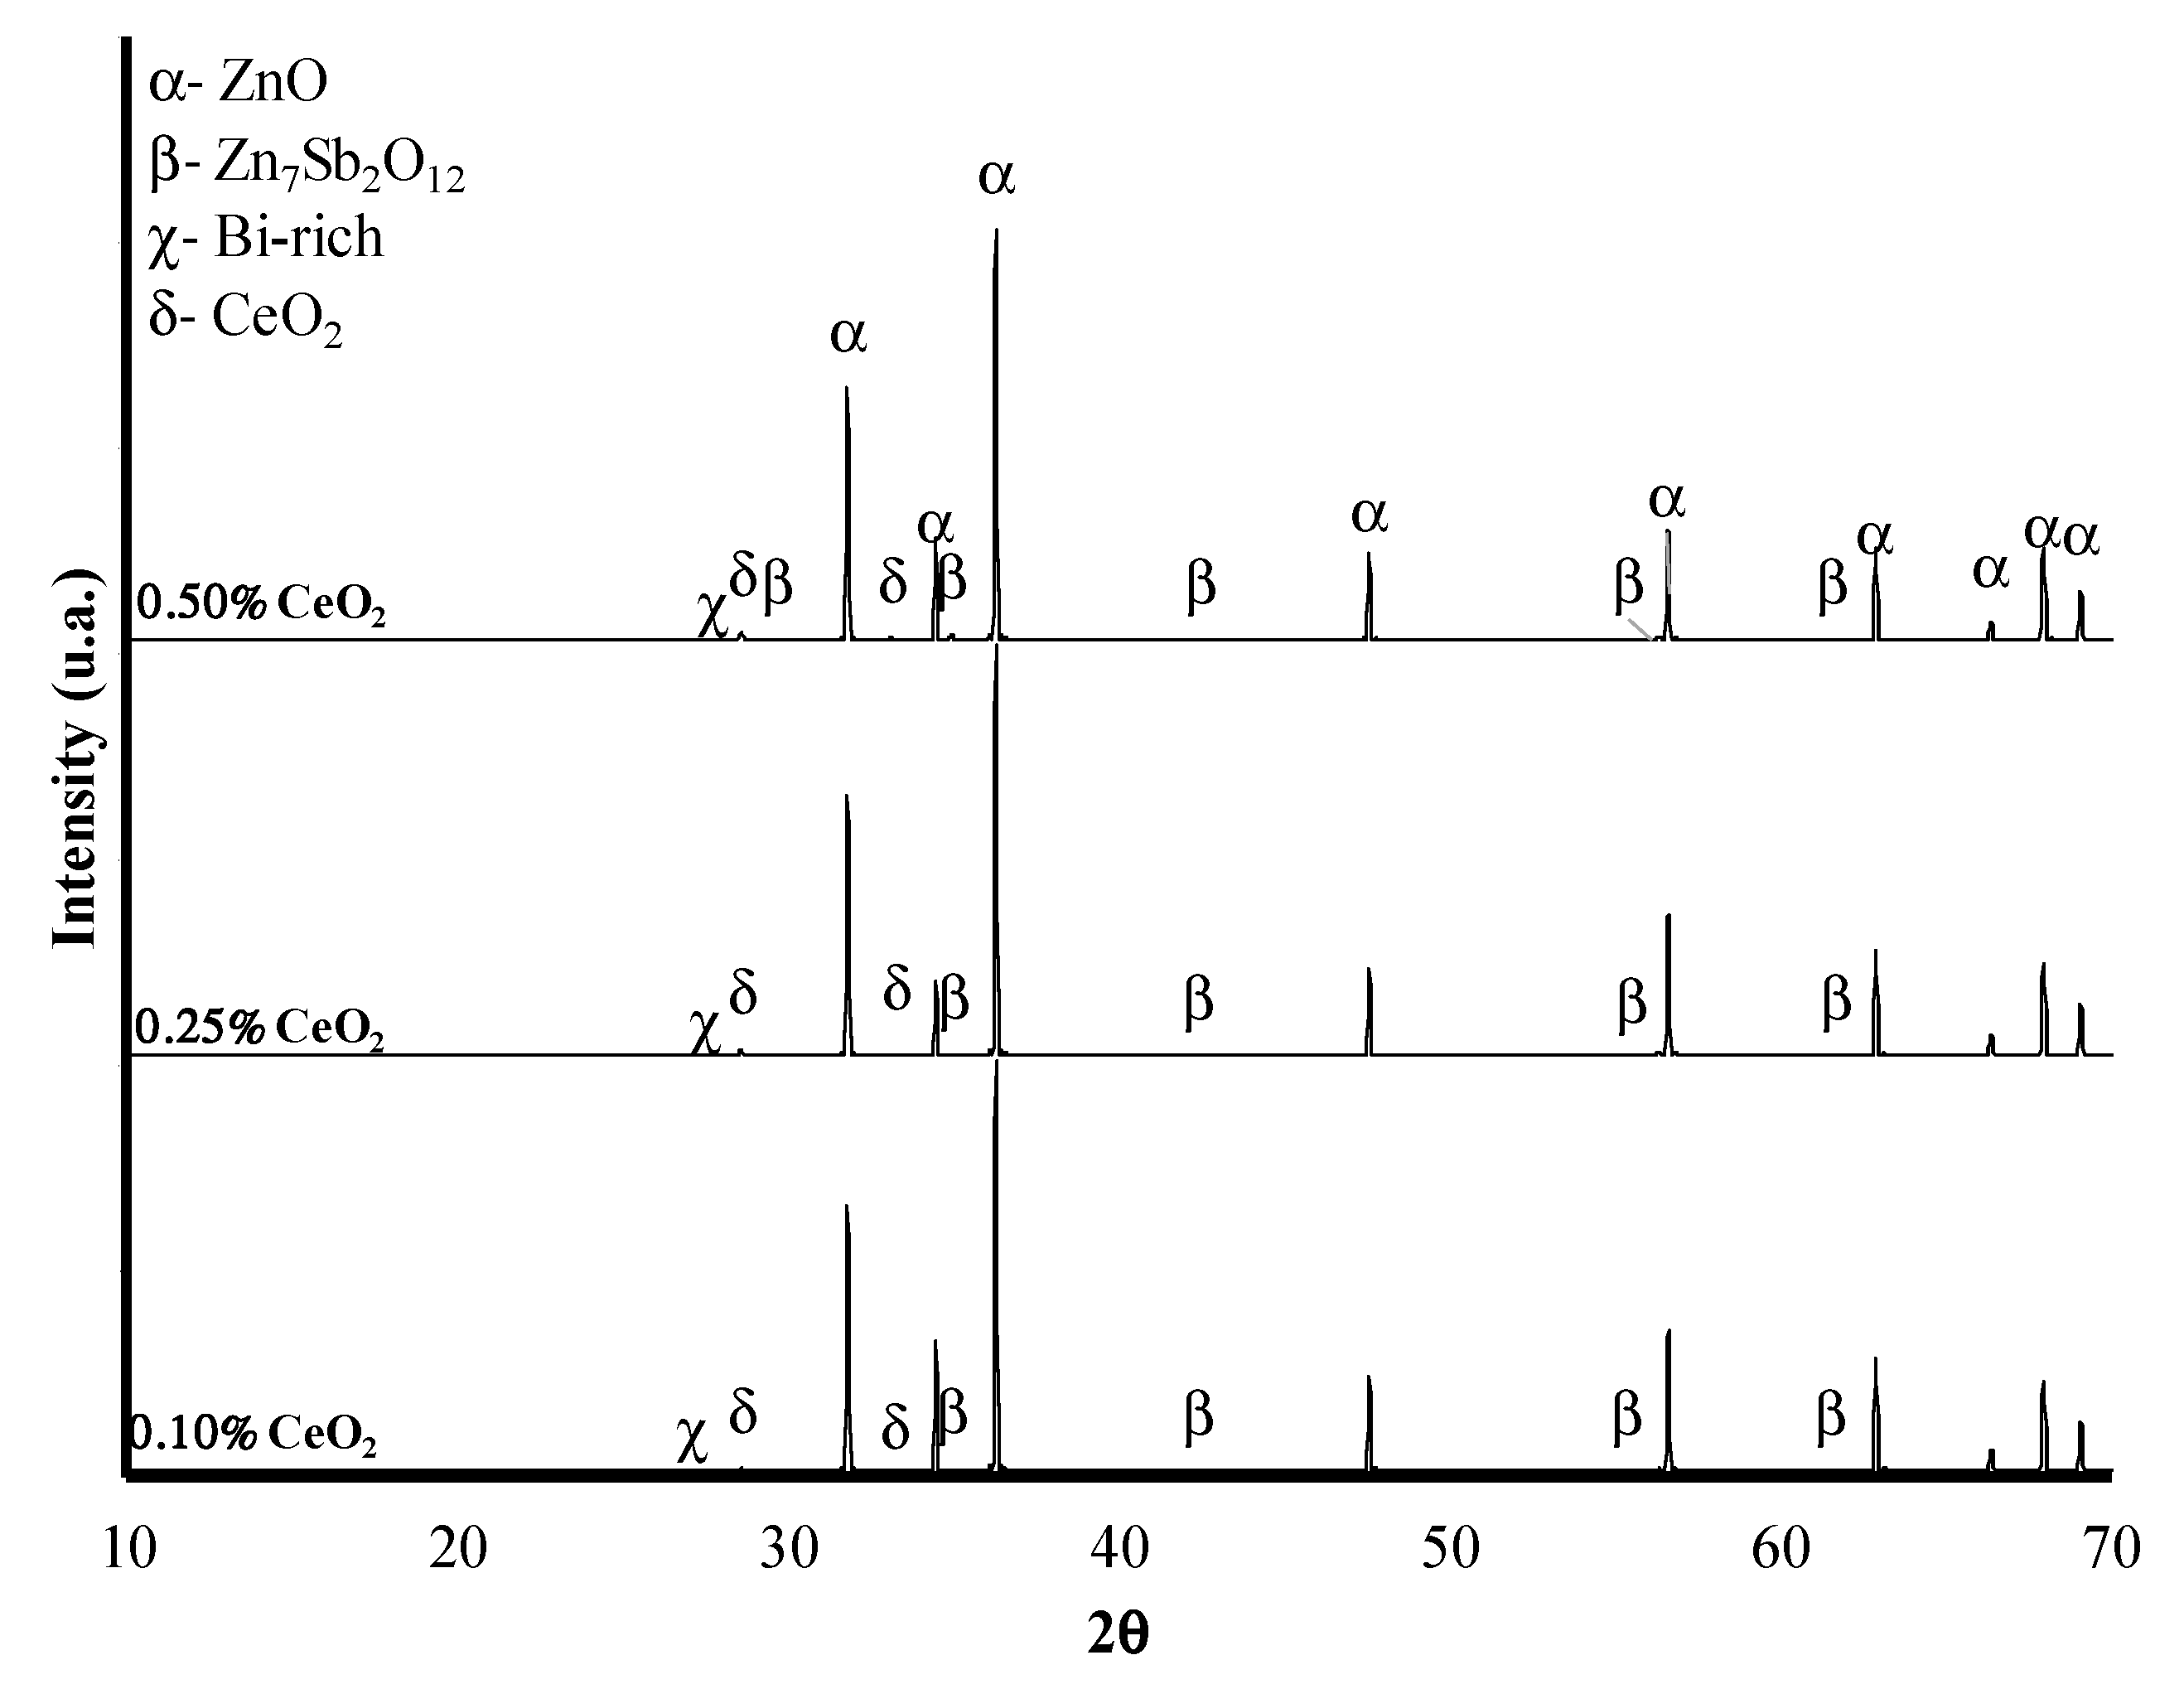
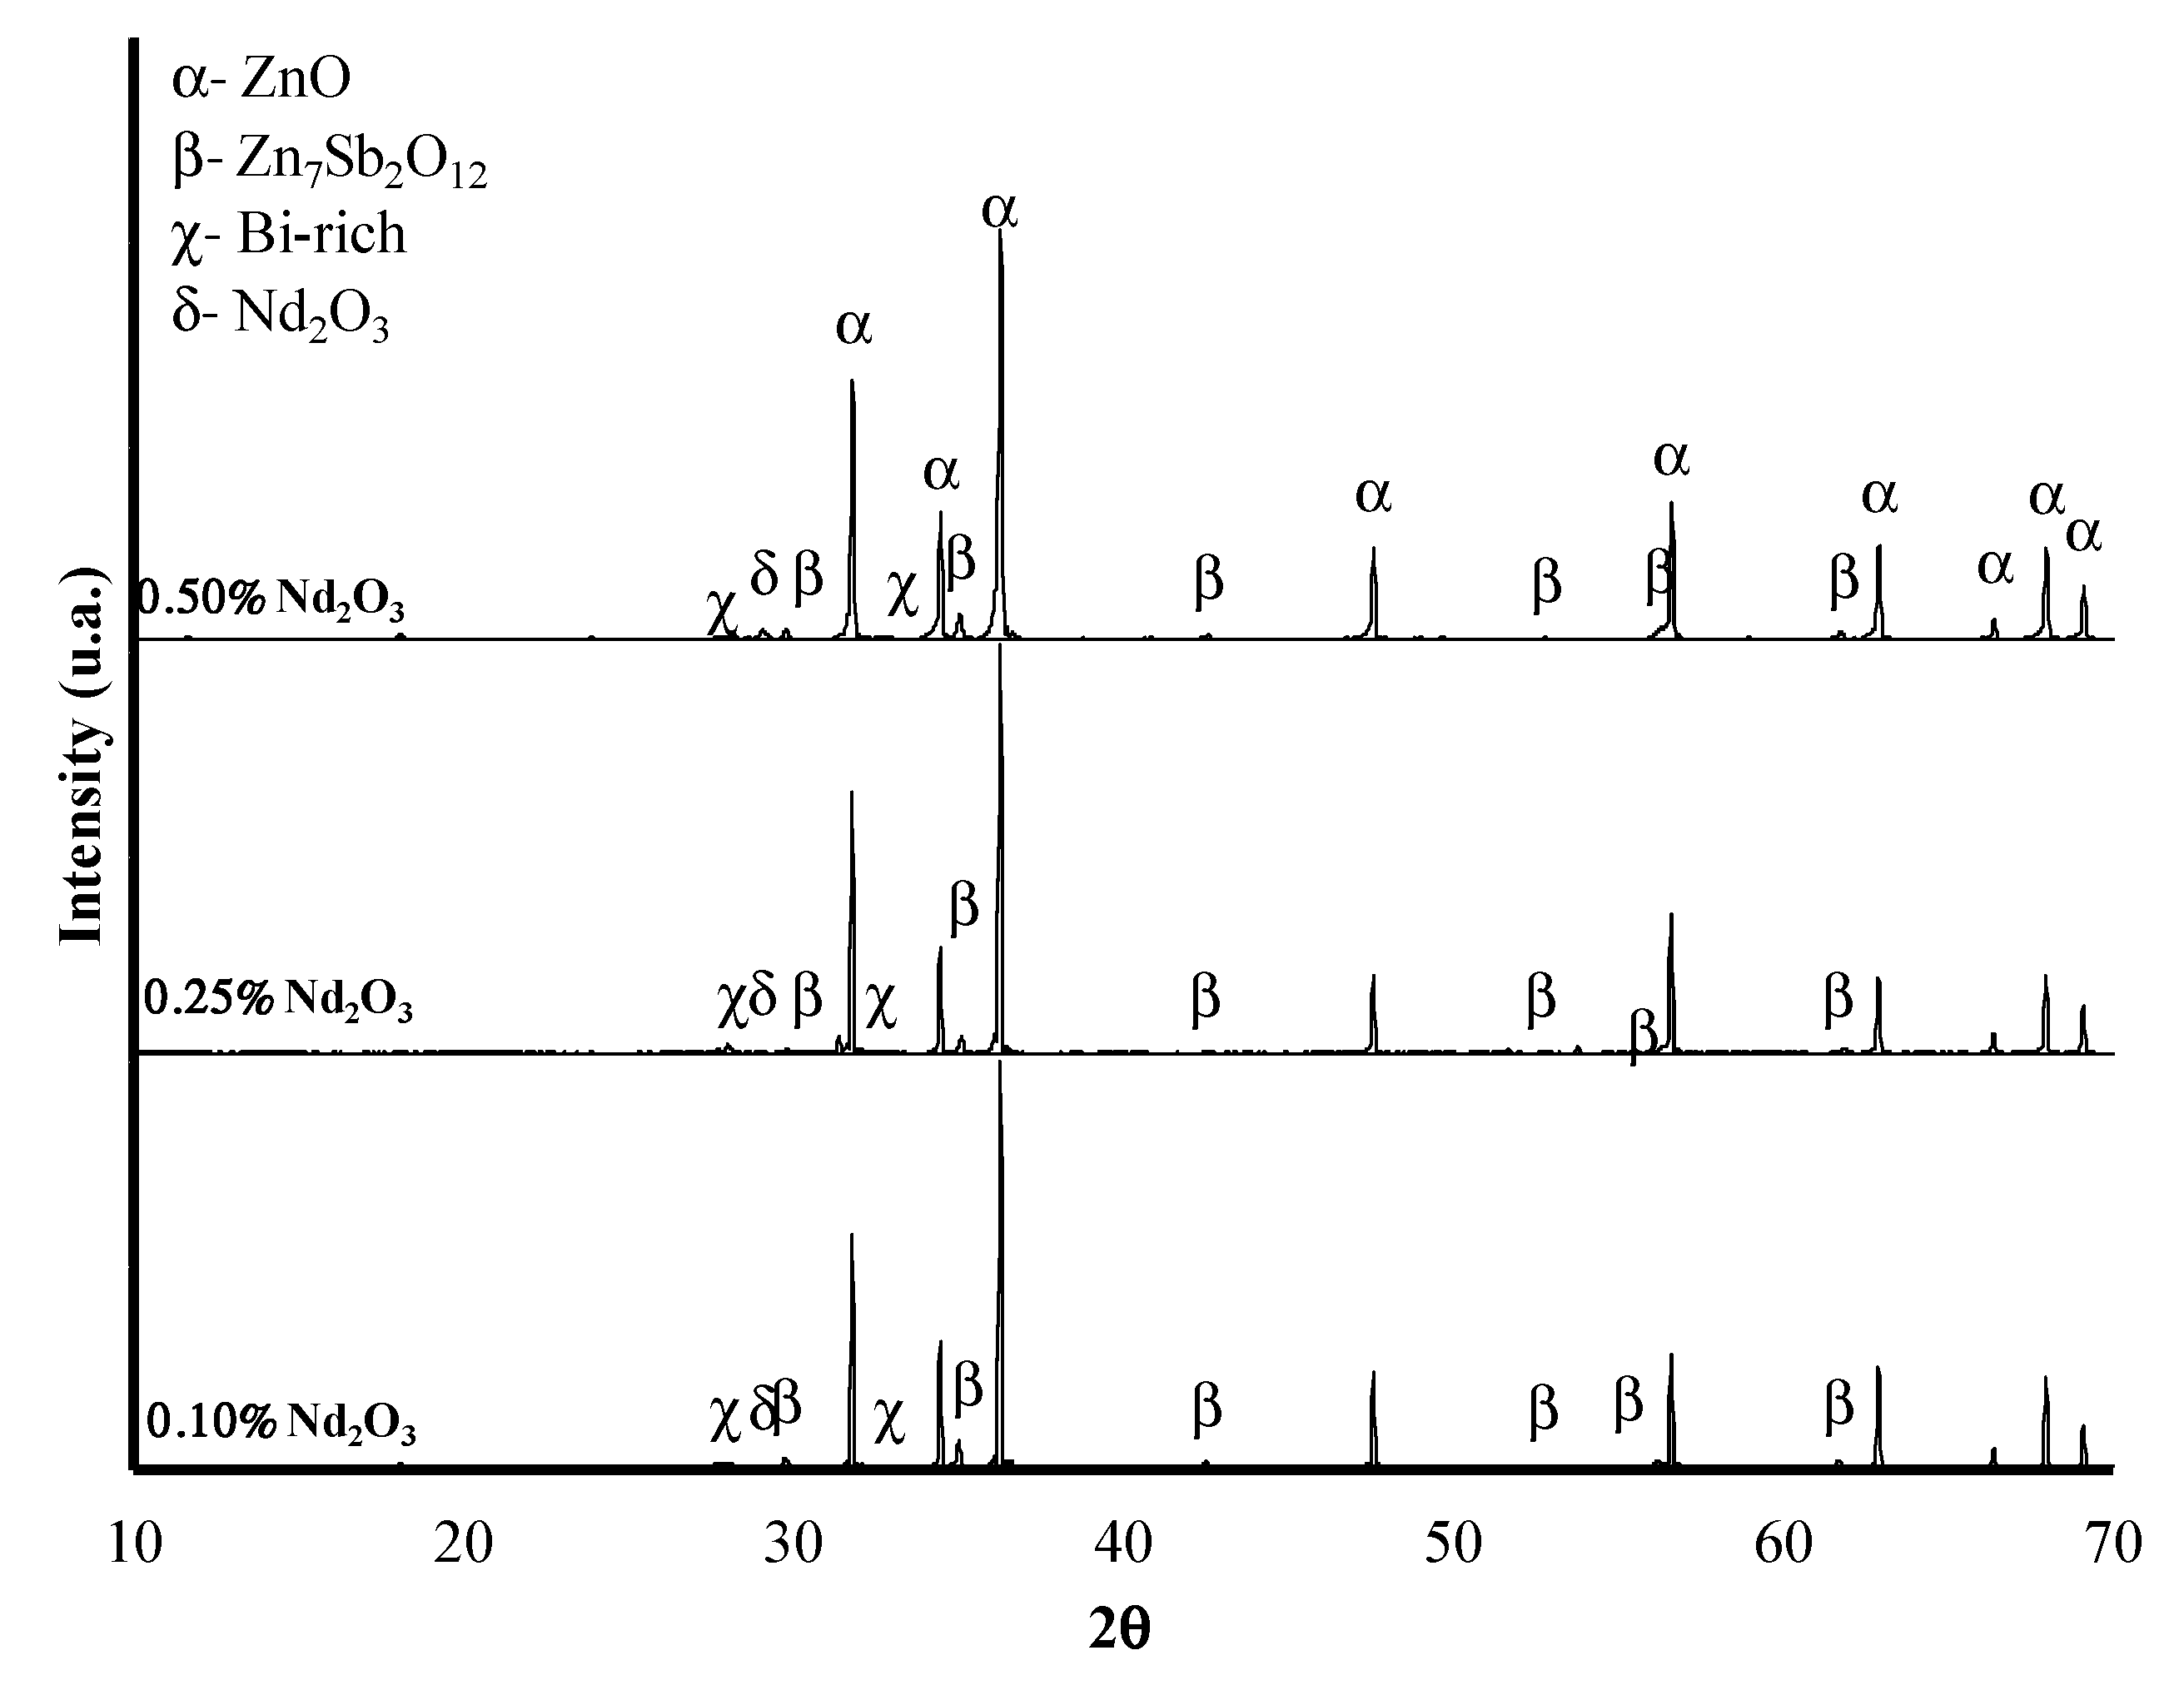
Figure 2, Figure 3 and Figure 4 show the diffractograms of the base ceramic varistor doped with La2O3, CeO2 and Nd2O3, respectively. In them the presence of the same phases identified for the base ceramic varistor is identified (Figure 1), and additionally the presence of the peaks corresponding to each REO whose intensity is directly proportional to its concentration is observed. The above shows that the main phase and its structure, ZnO, are not affected by the REOs addition [14]. Other additional peaks were observed with the addition of La2O3 and Nd2O3 at concentrations greater than 0.1 mol%. This suggests the formation of a new phase of the Bi1-xLnxO1.5 type, as previously reported [30]. It has been reported that the REOs addition promotes the development of REO-rich phases which can act as moderators of the grain growth of ZnO due to its precipitation at grain boundaries and nodal points, which prevents the transfer of ions [3,7,8,19]. However, the REOs addition decreases the intensity of the peaks corresponding to the spinel (Zn7Sb2O12) [15,31].

3.2. Microstructural Analysis

After the sintering process, the surface characteristics of the ceramic varistors were observed. The figures below show the backscattered electron SEM micrographs. Figure 5 shows the surface characteristics of the base ceramic varistor. A homogeneous distribution of equiaxed ZnO grains is observed, this is an important characteristic associated with the useful life of ceramic varistors [22]. Similarly, the presence of precipitates, associated with the spinel phase (Zn7Sb2O12), is observed along the grain boundaries. It is evident that the formation of these precipitates occurred before the formation of the ZnO grains. This can be assumed by observing the deformation of the ZnO grains around the precipitates.
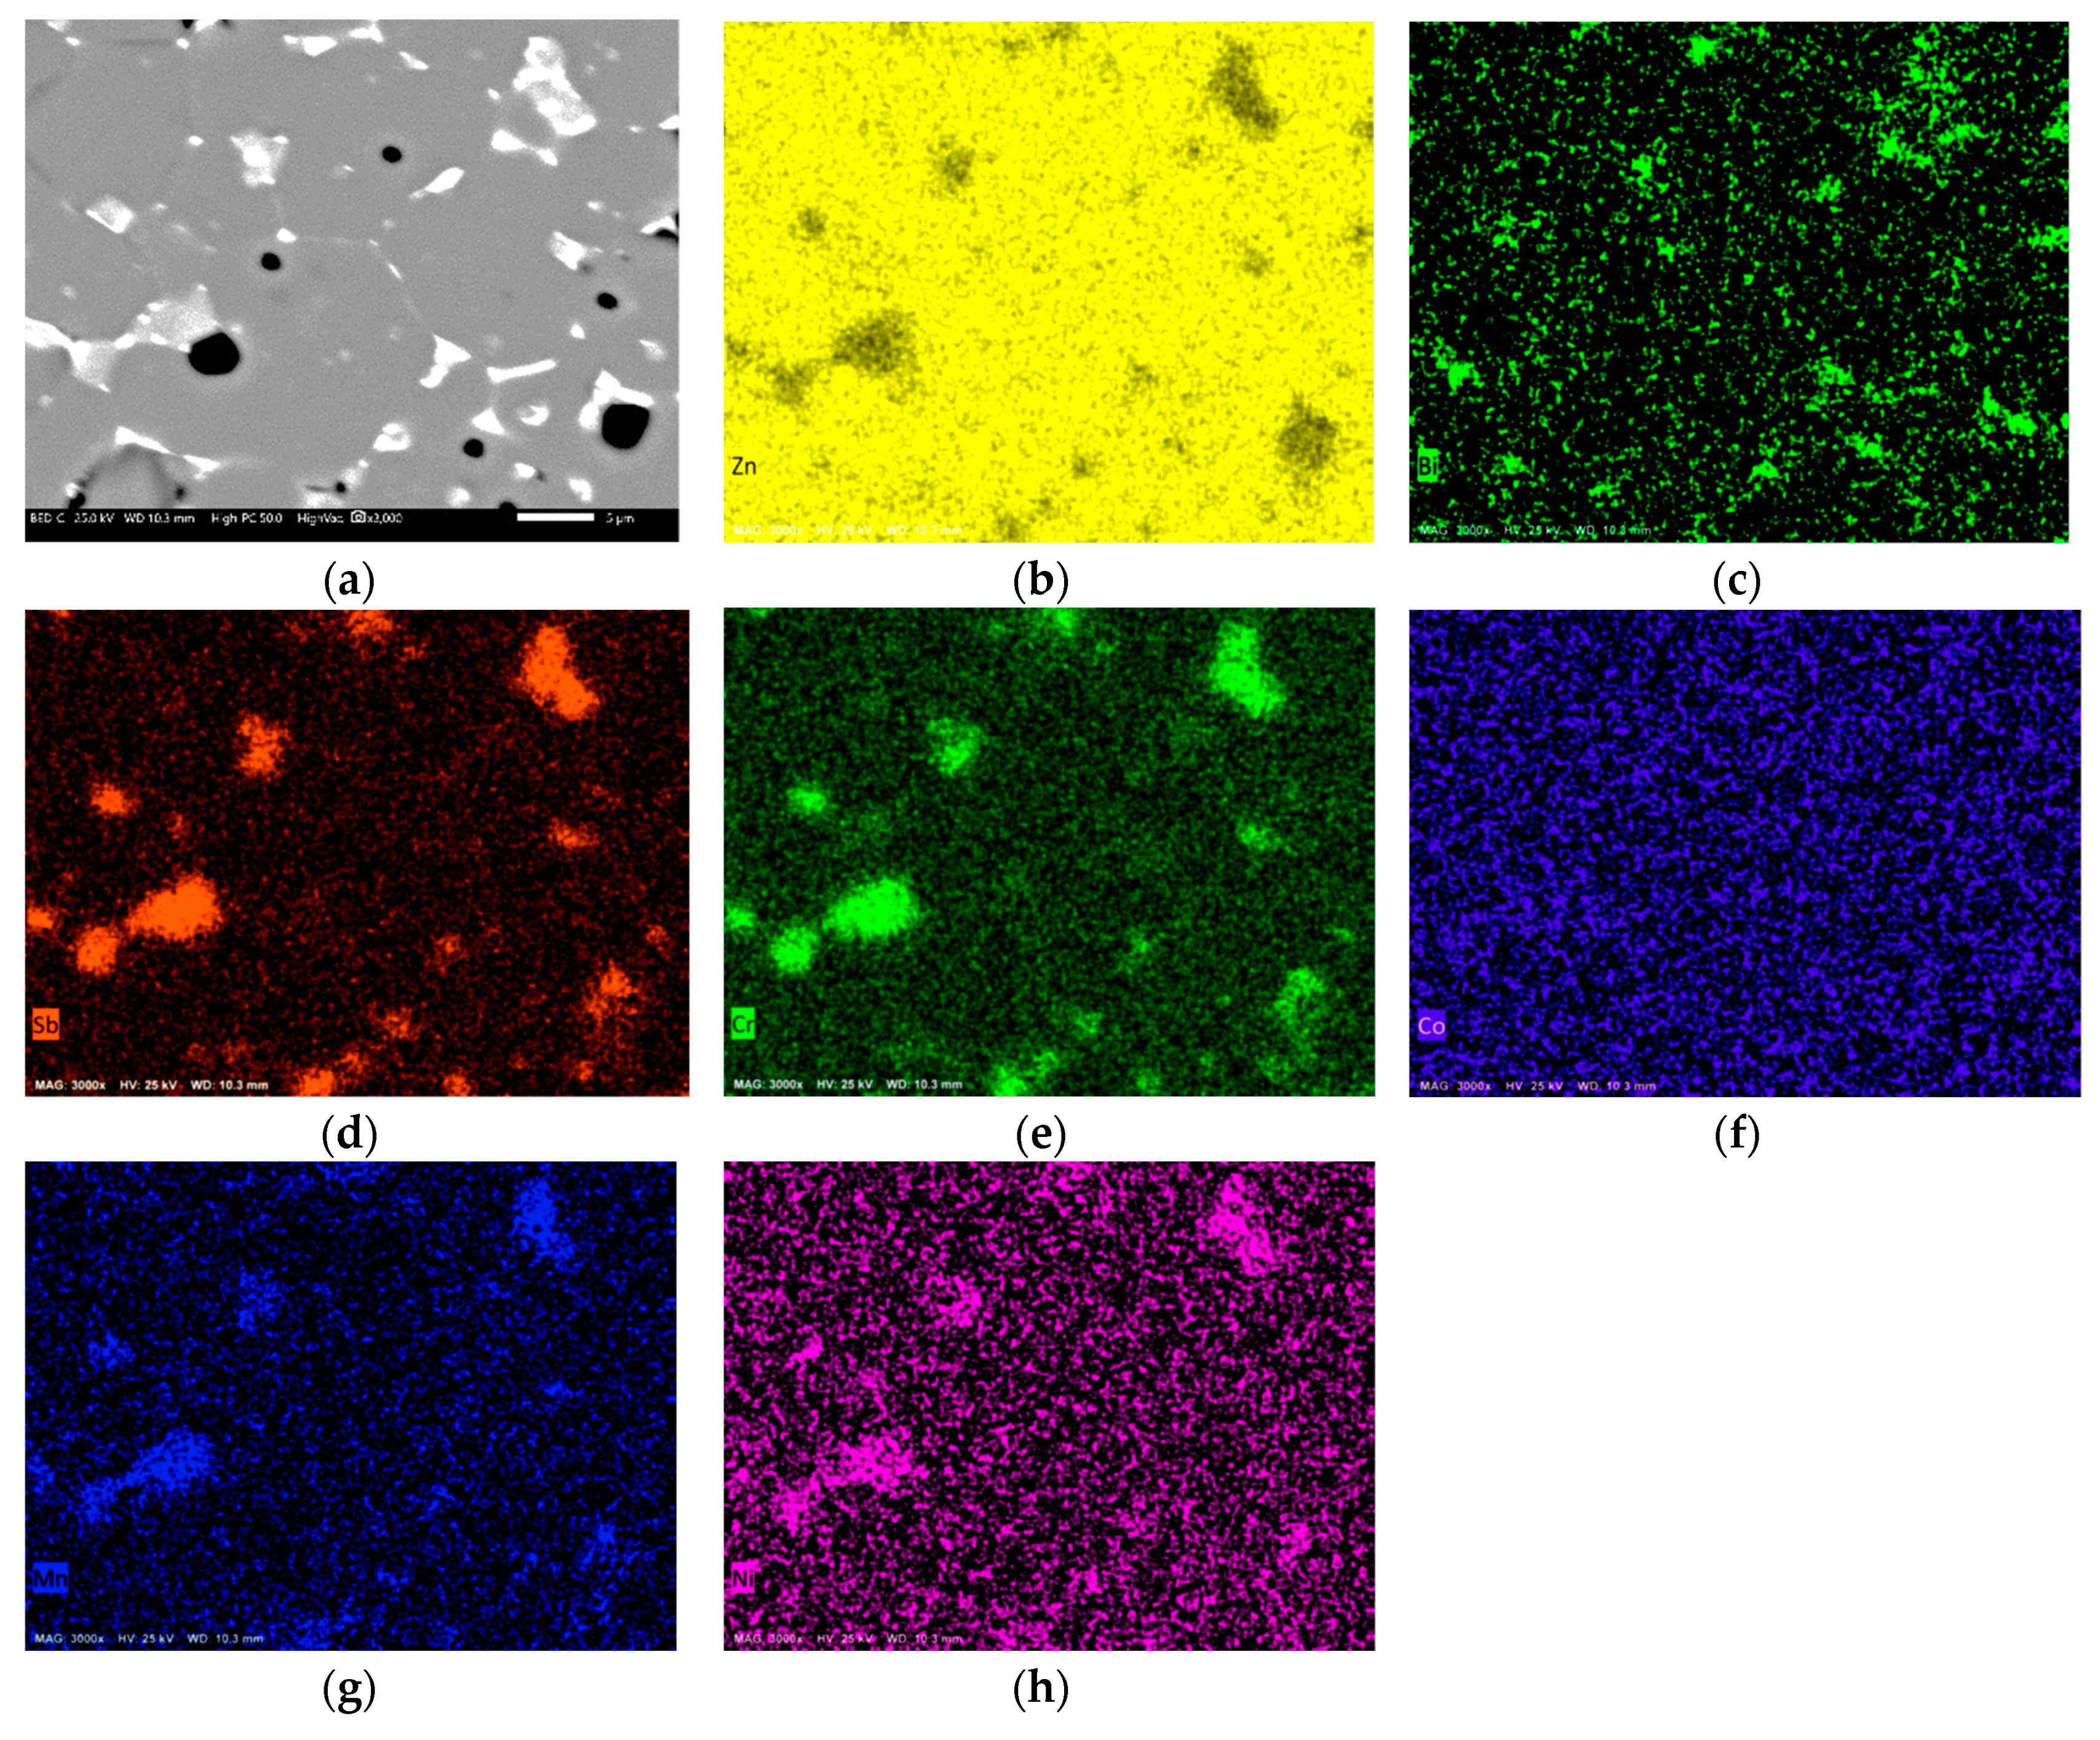
Figure 6 shows the cross-sectional appearance and element mapping of the base ceramic varistor. According to the mapping of elements, it is observed that both the spinel phase (Zn7Sb2O12) and the Bi-rich phase are segregated in the grain boundaries, and that Cr, Mn and Ni are mainly associated with the spinel phase, while Co is observed associated with both grains and grain boundaries. It has been indicated that the determining oxides in the high temperature reactions are ZnO, Bi2O3 and Sb2O3, and that the rest of the dopants only act as secondary elements that dissolve and are incorporated into different phases formed [32].
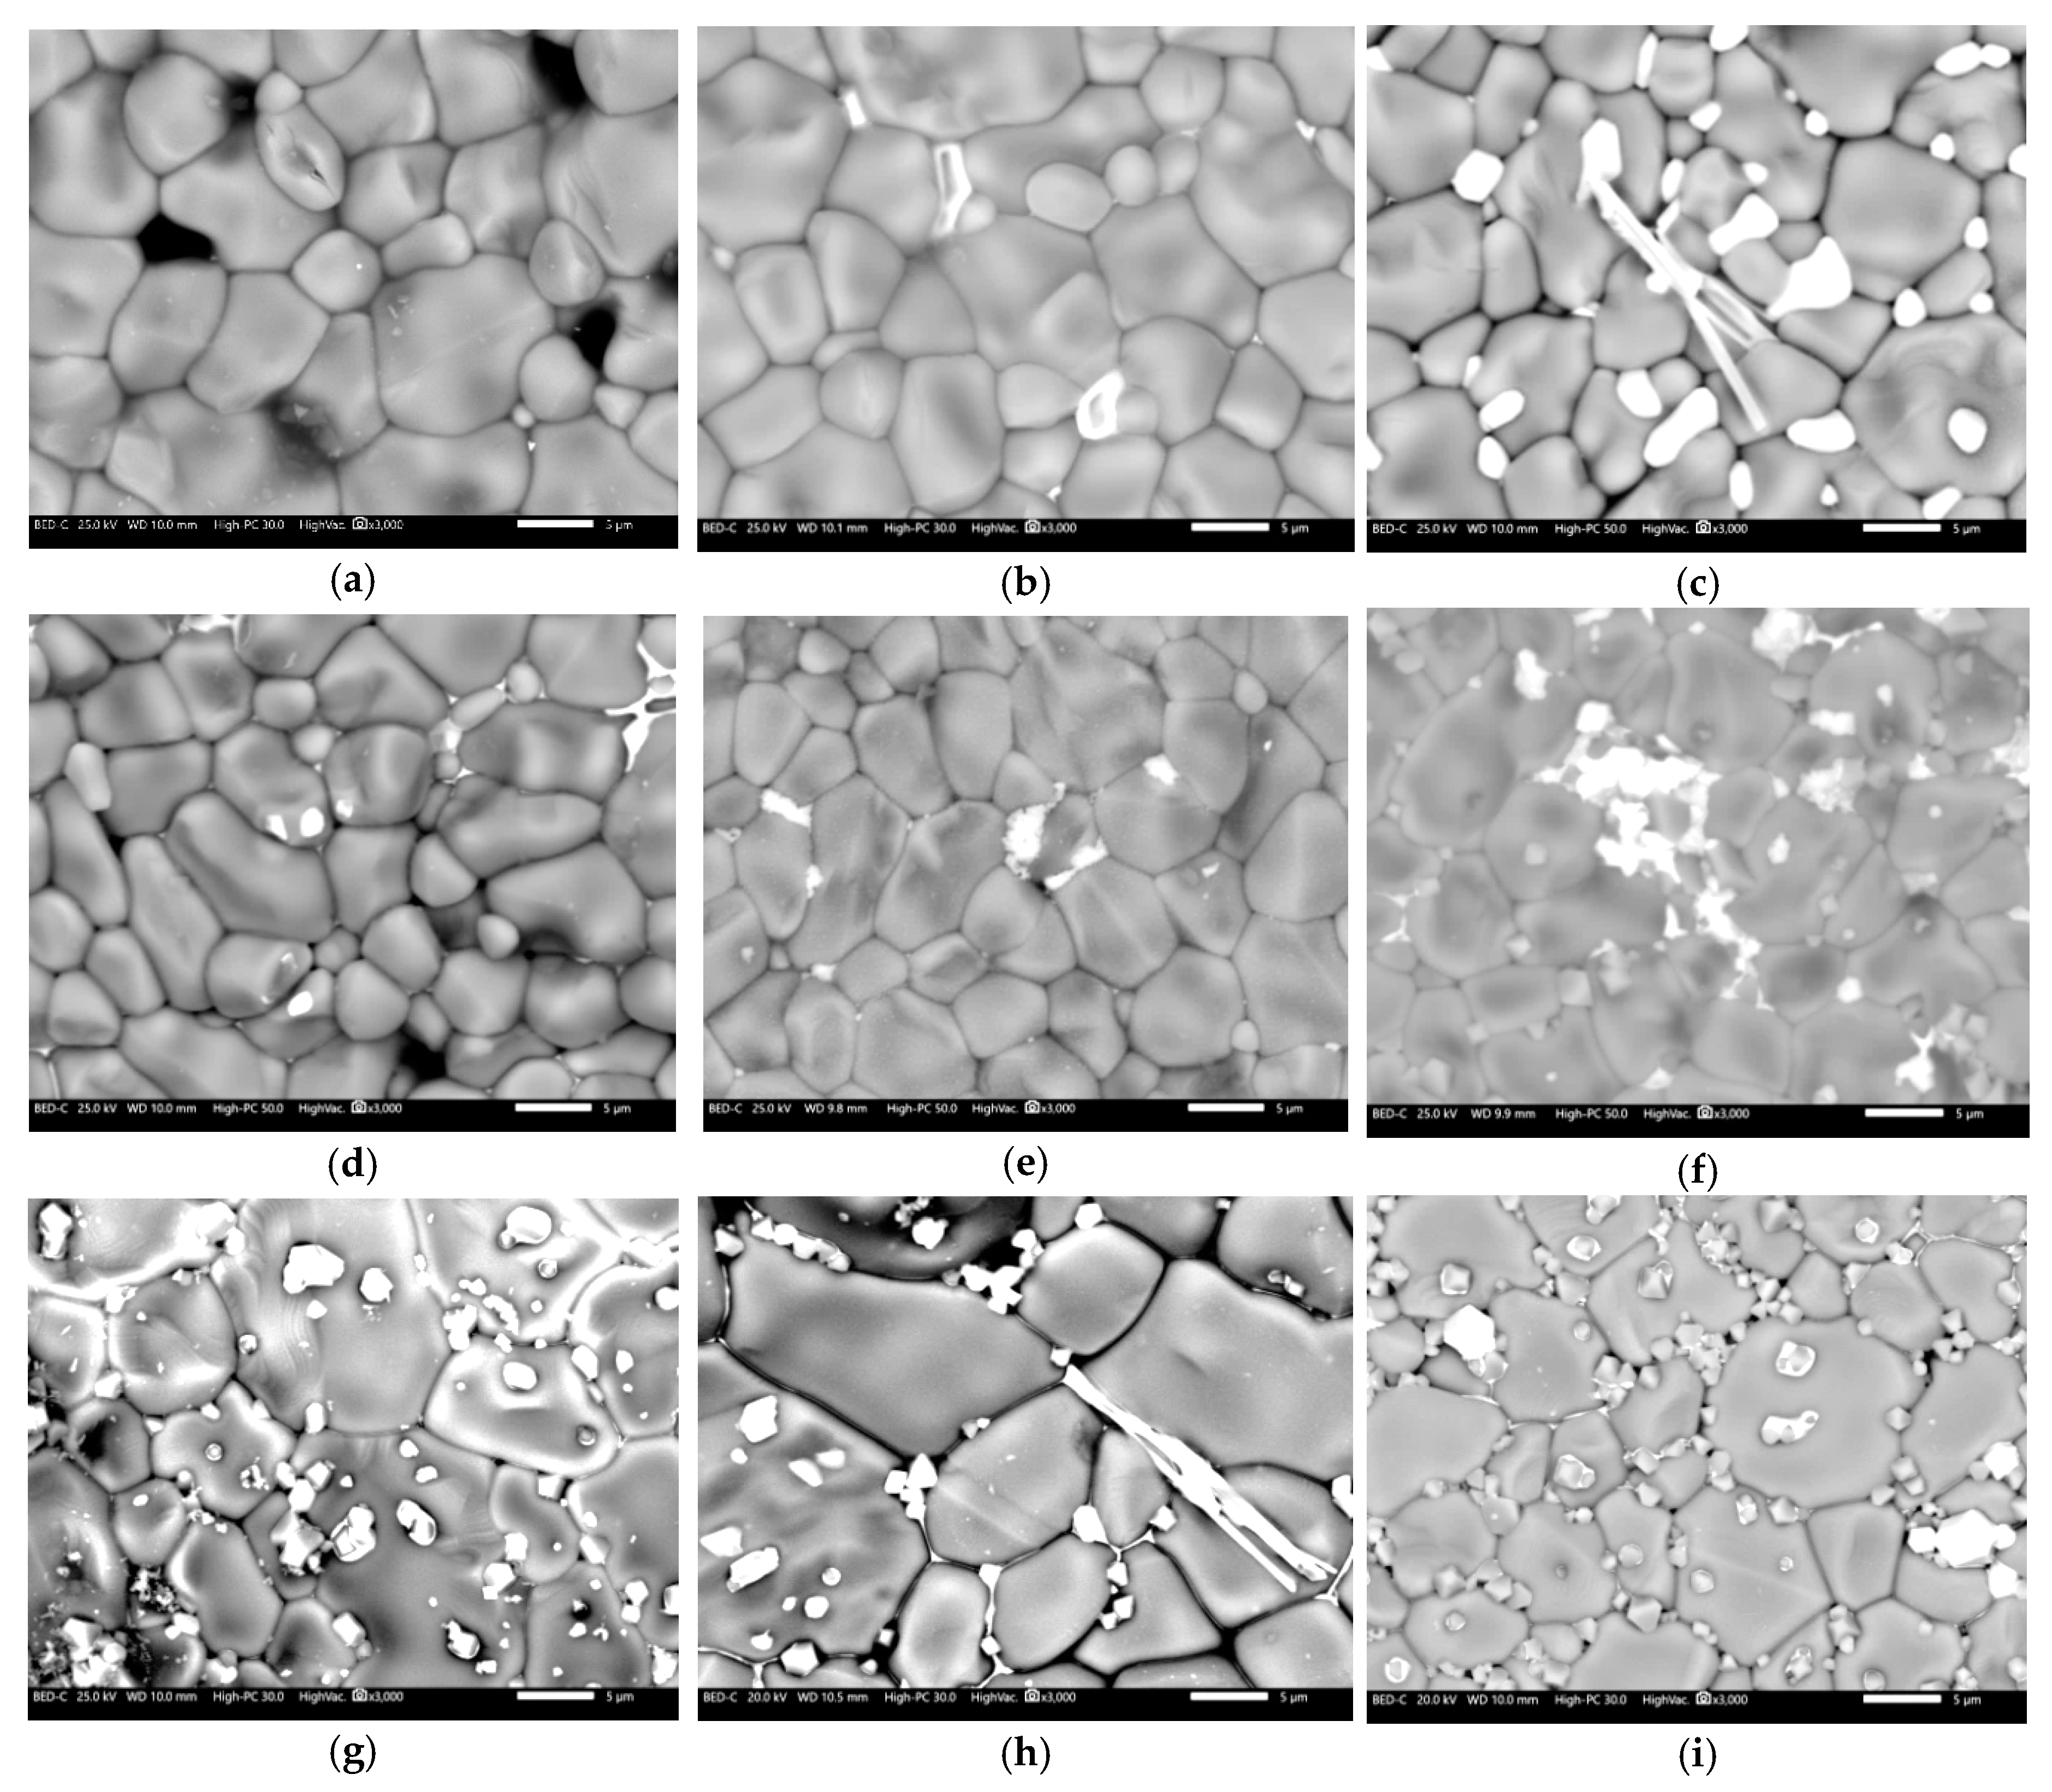
Figure 7 shows the surface characteristics of the REO-doped base ceramic varistor. In general, it can be seen that all doped ceramic varistors show a smaller grain size than that observed in the base ceramic varistor. In the case of ceramic varistors doped with La2O3 and CeO2, it is important to observe the absence of surface precipitates associated with the spinel phase (Zn7Sb2O12), only on the ceramic varistor doped with 0.5% Nd2O3 is it possible to observe the presence of the spinel phase but smaller than that observed in the base ceramic varistor. Other studies have also reported a decrease in the amount of spinel phase due to the addition of Nd2O3 [33]. The observed brilliant white precipitates correspond to the phases rich in REOs and these are mainly observed in the nodal points. The absence of precipitates on the surface, associated with the spinel phase, may be due to the fact that the addition of REOs alters the formation and decomposition temperature of the pyrochlorine phase and the morphology of the spinel phase (Zn7Sb2O12) and also decreases the growth rate of the ZnO grains [27].
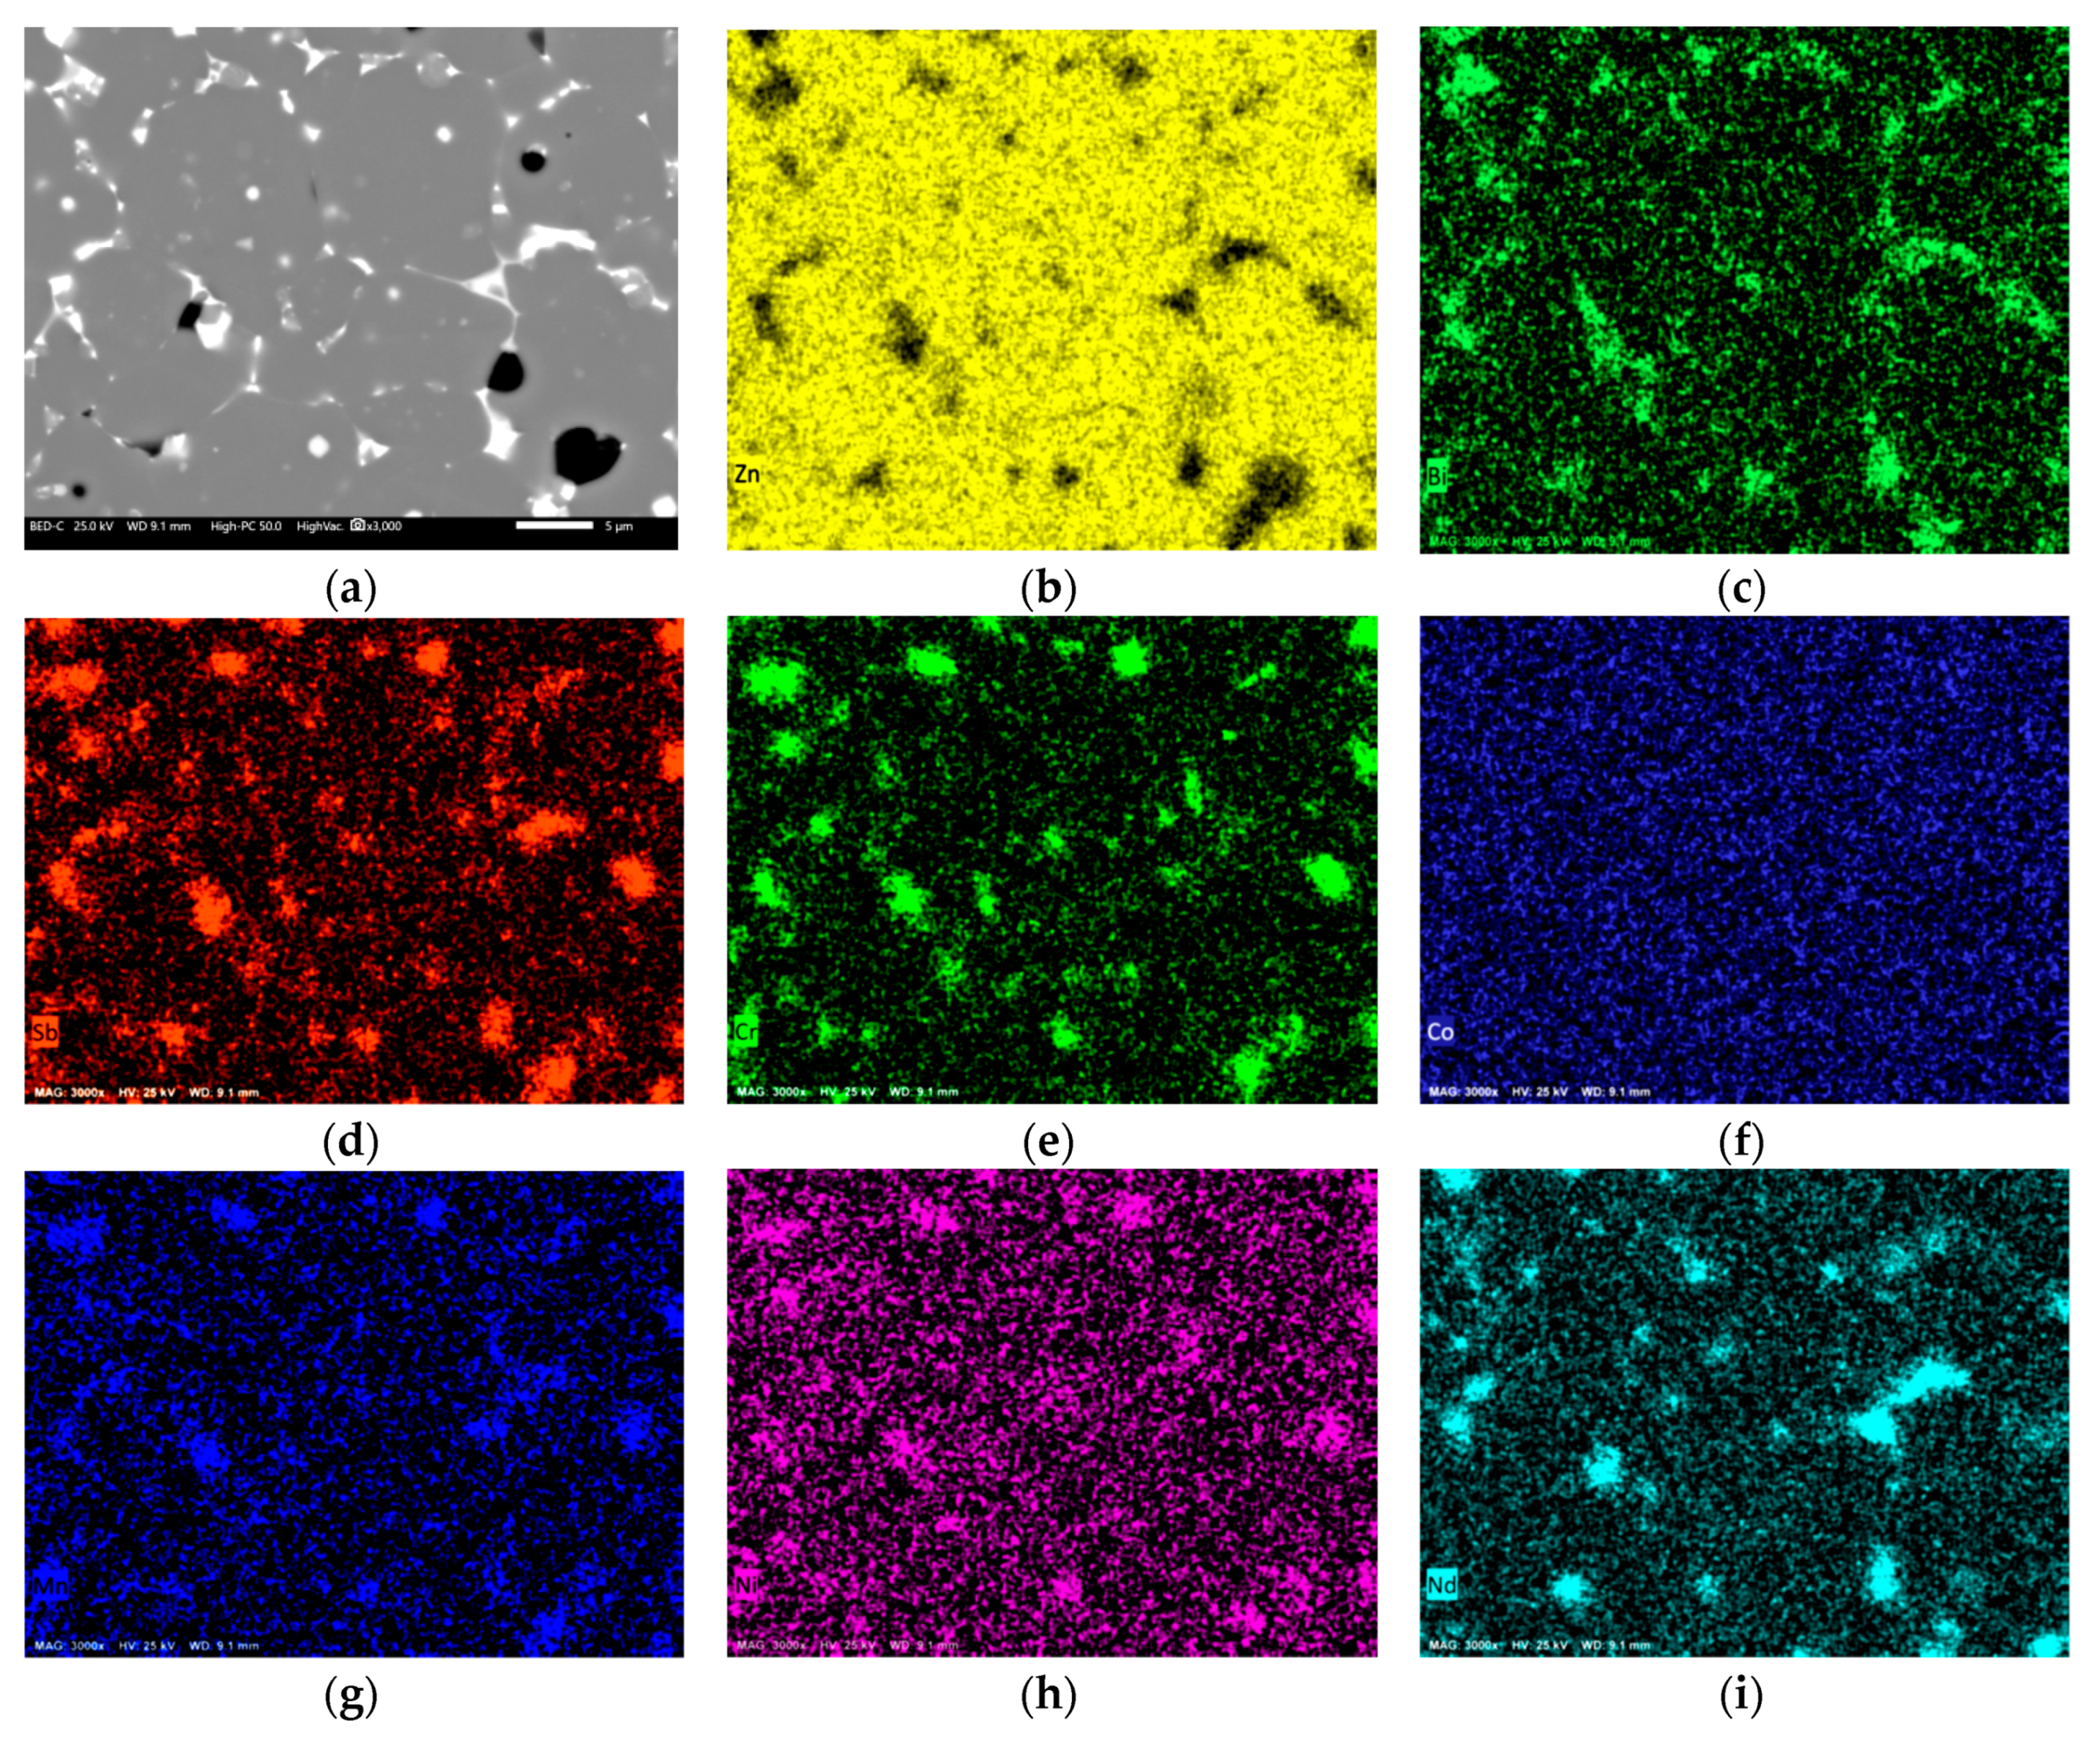
Figure 8 shows an example of the cross-sectional aspect and element mapping of the base ceramic varistor doped with 0.5% Nd2O3, similar aspects were observed in the other ceramic varistors doped with REOs. According to the mapping of elements, it is possible to observe the same characteristics observed with the base ceramic varistor (Figure 6), however, the main difference is the presence of the phases rich in REOs. According to the distribution of the bright white phases and the Nd mapping, it is observed that the phases rich in REOs are mainly found in the nodal points and to a lesser extent in the grade limits. Similar observations have been reported in other studies [3,7,14,15,17]. In general, the segregation of the phases rich in REOs in these regions inhibits the growth of the ZnO grains. [3,15,19,31]. The segregation of REOs has been attributed to the great ionic radius difference that exists between Zn2+ ions and rare earth ions [3,7,14,15,31].
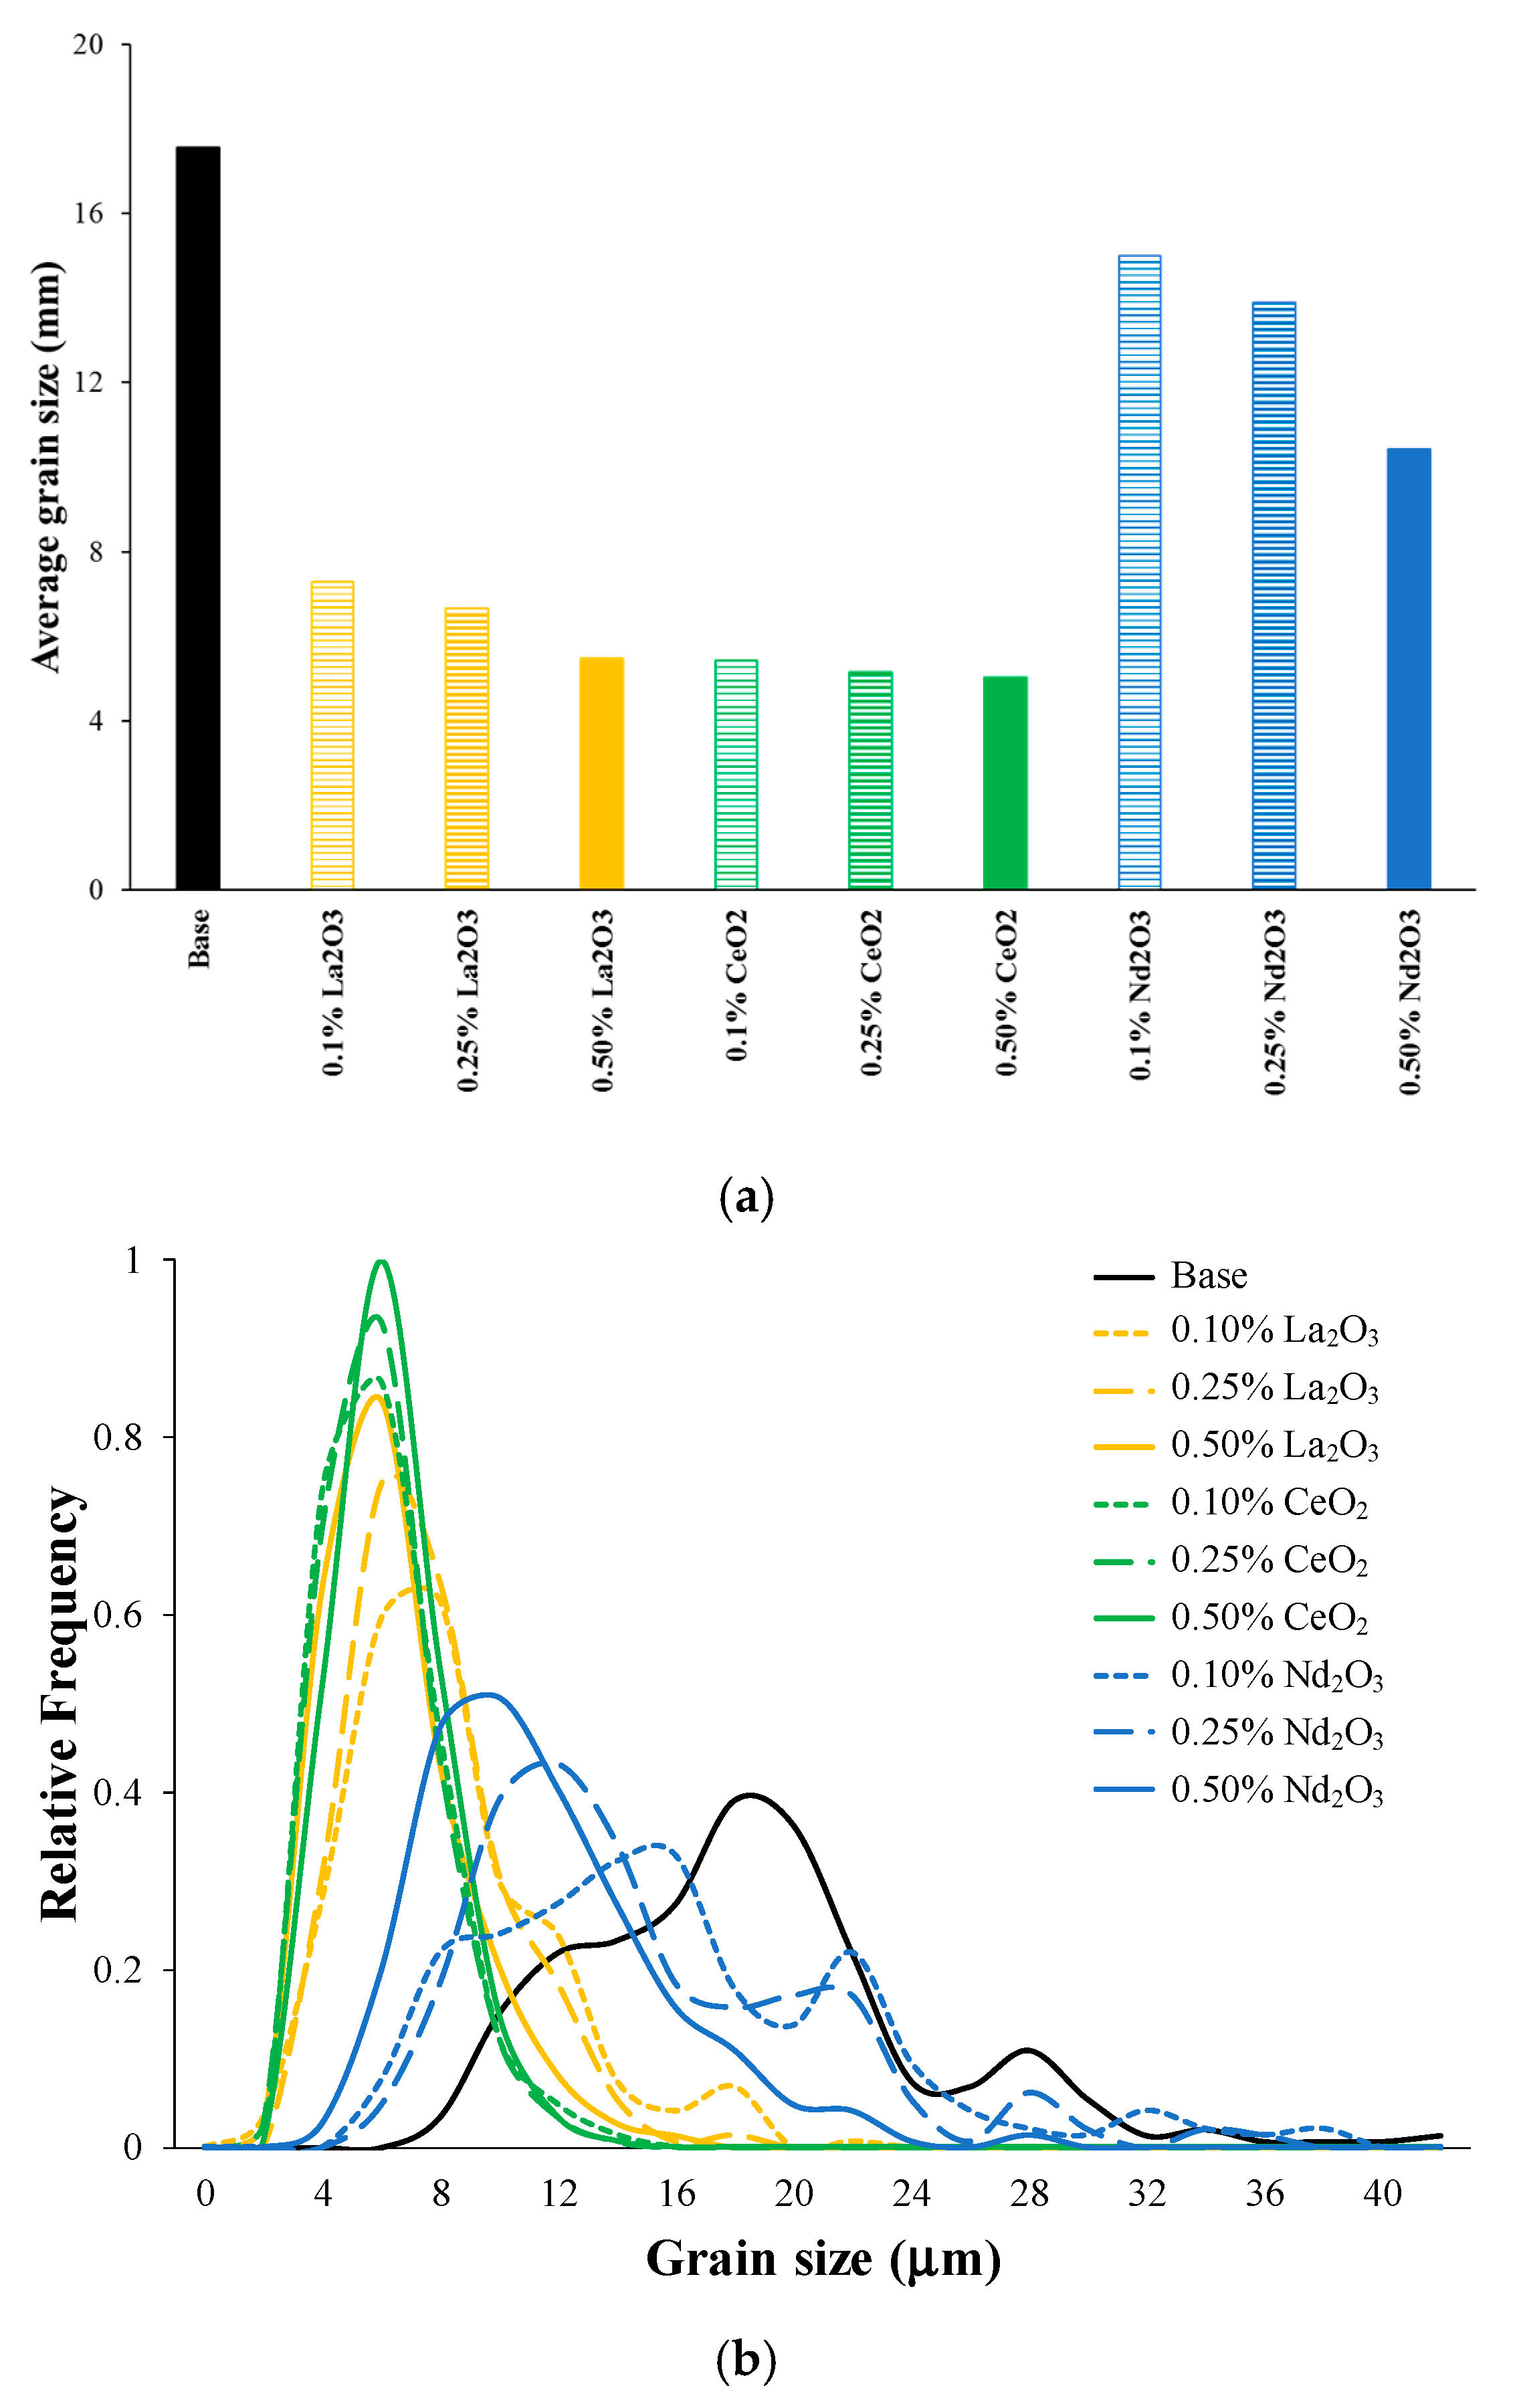
Figure 9 shows the average grain size (Figure 9a) and the grain size distribution (Figure 9b) of the ceramic varistors. The base ceramic varistor presented an average grain size of 17.54 µm and an inhomogeneous grain size distribution, the grain size of 20 µm being the one with the highest relative frequency, followed by 12 and 28 µm. In the case of ceramic varistors doped with La2O3, it was observed that the average grain size decreased as the concentration of added La2O3 increased (7.27 → 5.48 µm). Its grain size distribution shows a higher frequency of small grains (4 → 8 µm) and a decrease in the frequency of larger grains (12–18 µm) by increasing the La2O3 concentration. Ceramic varistors doped with CeO2 showed the smallest average grain size and a lower variation when increasing the concentration of CeO2 added (5.4 → 5.0 µm). They also showed a homogeneous grain size distribution (4.0 → 6.0 µm). On the other hand, with the addition of Nd2O3, the smallest decrease in the average grain size was observed (15.0 → 10.43 µm), and a non-homogeneous grain size distribution similar to that observed in the base ceramic varistor.
Based on the above, it can be observed that the addition of REOs contributes to a decrease in the grain size of the base ceramic varistor, and this is dependent on the concentration and type of REO added. Taking into account that in all cases for the same concentration of REOs, the atomic concentration of Ce is lower, then it can be said that at a lower concentration of lanthanide ions added, the grain size is smaller and its size distribution is grain is more homogeneous. Likewise, the higher the ionic radius and concentration, the grain size is smaller and its grain size distribution is more homogeneous.

3.3. Impedance Spectroscopy Analysis

By means of impedance spectroscopy it is possible to determine the electrical properties of ceramic varistors in relation to their microstructural characteristics [3]. The microstructural characteristics of ceramic varistors are reflected by their frequency dependent resistive and capacitive components in the impedance spectra.
Generally, analyzes based on the complex impedance plane diagram (Z´´ versus Z´) only show the presence of a semicircle (or arc) with its center displaced below the real axis due to the presence of distributed elements and relaxation processes [3]. However, an analysis based on both impedance modulus, |Z|, and phase angle, as a function of frequency, allows to clearly define the individual contribution of the grains and the grain boundaries on the observed impedance response. The relaxation constant observed in the high-frequency region will correspond to the resistive-capacitive response of the ZnO grains and the relaxation constant observed in the low-frequency region will correspond to the resistive-capacitive response of the grain boundaries and insulating phases (very thin insulating intergranular layers). Since the impedance response of a ceramic varistor is the result of series and parallel connections [3], and then the resistive-capacitive contributions of the present phases (grains and grain boundaries) can be obtained by modeling equivalent circuits. This allows associating the effect of the different variables of the synthesis and sintering process of the ceramic varistors on their contribution to the resistive-capacitive characteristics of the grain or grain boundary.
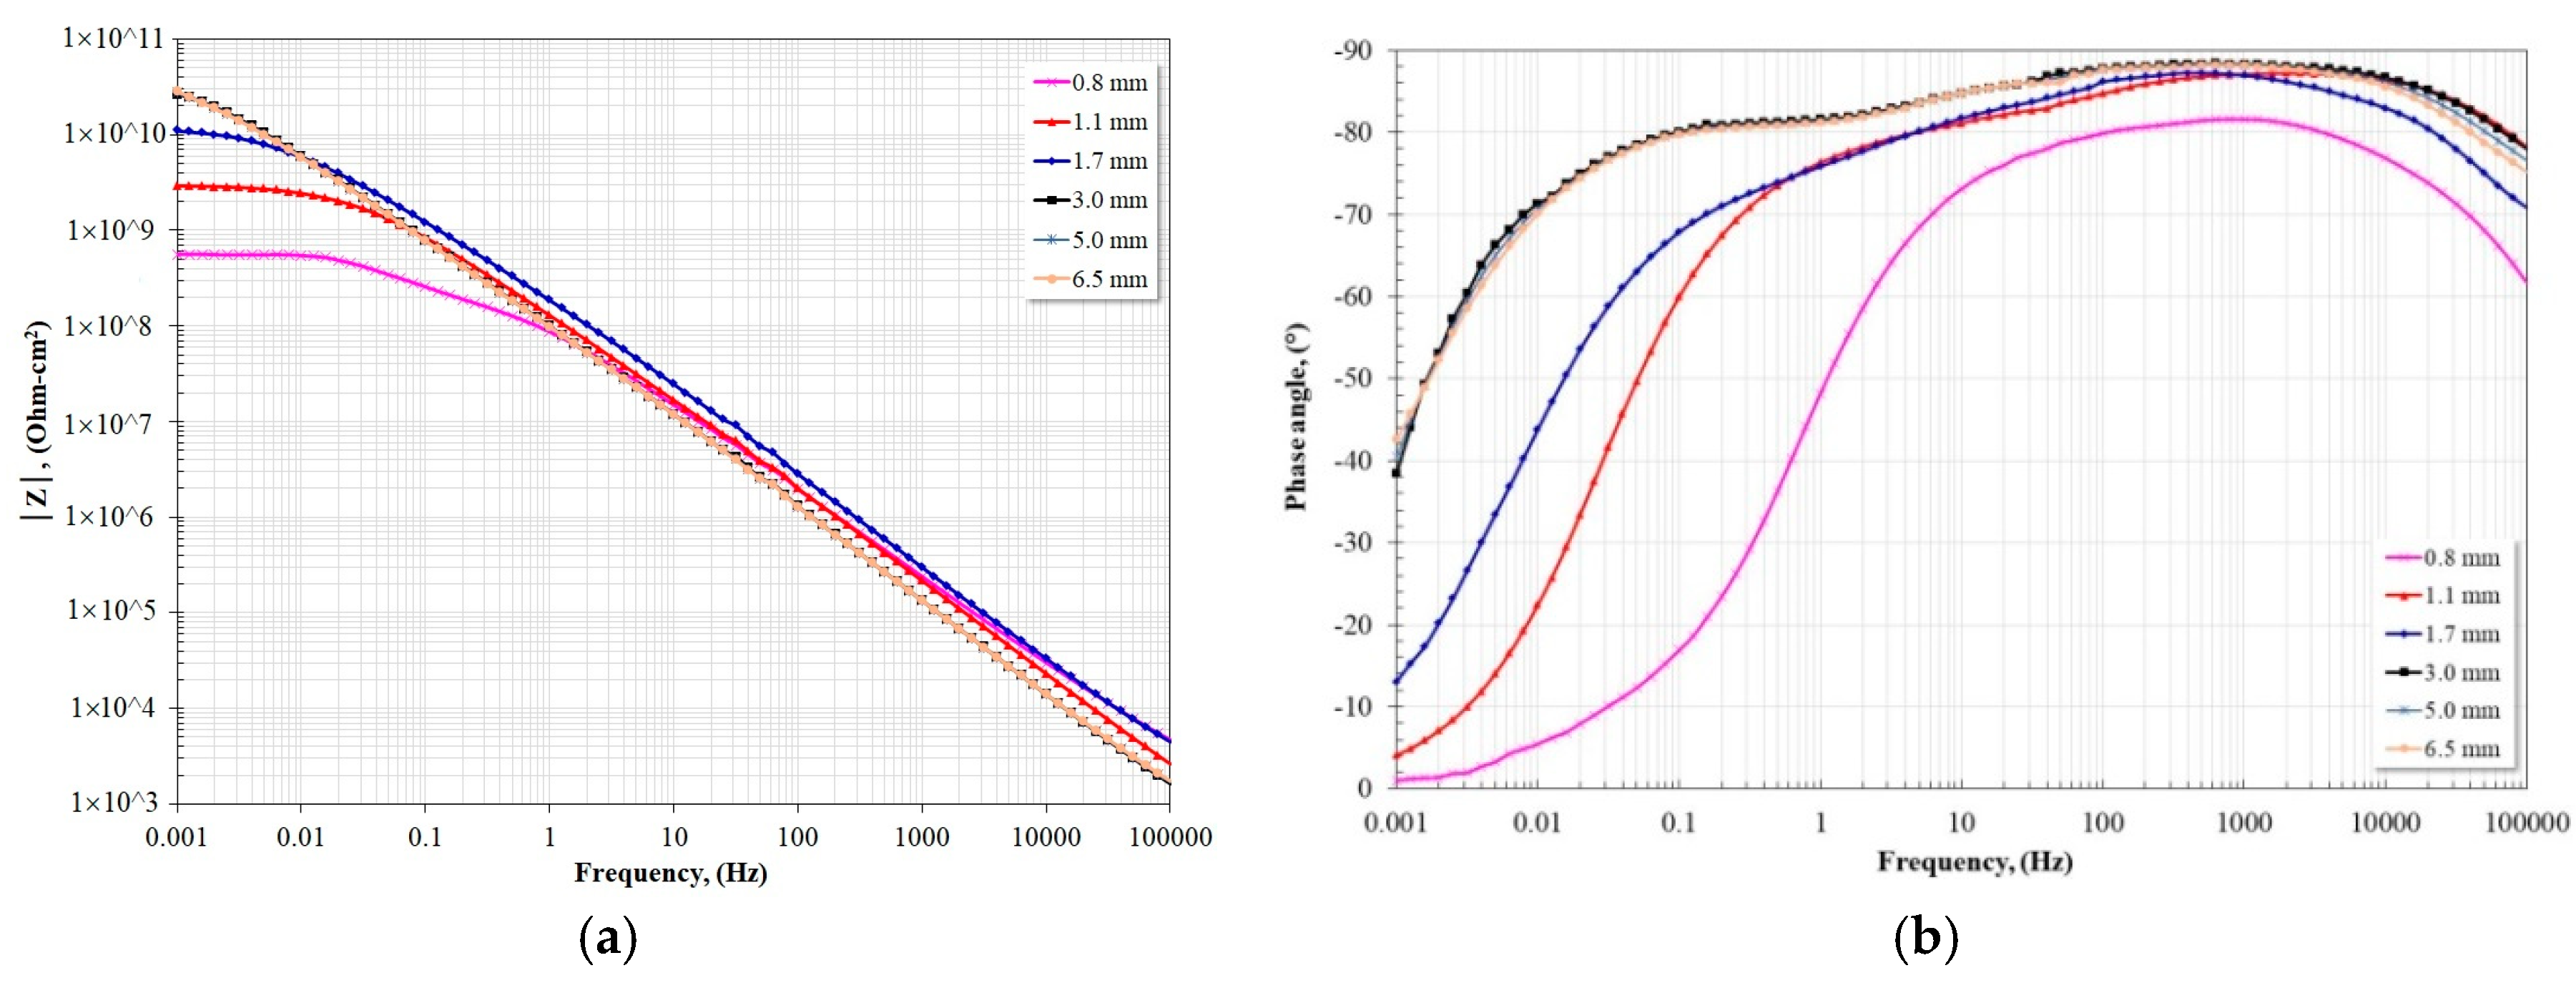
Since a ceramic varistor can be considered as a multiple junction device formed by many series and parallel connections (grains and grain boundary) [3], it was decided to determine the effect of the thickness of the ceramic varistors on the impedance spectroscopy response to be able to define the minimum thickness to be used in subsequent tests. This will allow impedance measurements to be made with samples of ceramic varistors that represent their global properties. Figure 10 shows the impedance spectroscopy spectra with different thicknesses of the base ceramic varistor. The spectra are normalized per unit area (cm2) and thickness (mm).
Spectra show that reproducible results are obtained with ceramic varistors at least 3-millimeters thick. Lower thicknesses do not represent the bulk properties of the ceramic varistor. This is associated with the density of grain boundaries and existing grains in each sample of different thickness. This is important because the breakdown voltage, E1mA, is directly related to the grain boundary breakdown voltage, Vgb, and inversely related to the grain size, D, according to the expression [3,13]:
E1mA = Vgb/D,
Therefore, the evaluation of the electrical properties of the ceramic varistors must be carried out with samples that represent the bulk properties of the ceramic. Furthermore, some authors suggest that when the impedance and dielectric response do not change significantly when thickness is varied, it is indicative that external contact between the metal electrode and the ceramic varistor will not induce a high dielectric constant [4]. Based on these results, it was decided to carry out the following studies with ceramic varistors with a thickness of 3 mm.
Figure 11 shows the effect of the addition of the different REOs and their concentration on the impedance spectroscopy spectra of the ceramic varistors. In all cases, from the maximum value of the impedance modulus, |Z|, it is observed that its values decrease with the addition of REOs, as well as with increasing its concentration. This suggests a decrease in the resistivity of ceramic varistors due to an increase in the electrical conductivity of the grain boundaries [1]. Similarly, in all cases the existence of two relaxation constants at different relaxation times is observed. The first one is located in the high frequency region and is associated with the ZnO grains and the second one in the low frequency region associated with the grain boundaries. The presence in the high frequency region of the relaxation constant associated with ZnO grains indicates the predominance of the contribution of grain boundaries in the conductivity of ceramic varistors [1].
In this sense, the relationship between the imaginary impedance (-Z´´) as a function of frequency (Figure 12) shows the contribution of the grains and grain limits on the electrical properties of the ceramic varistor, and may reflect the effect of the incorporation of the REOs [28]. From the graphs it can be seen that the main contribution to the resistance of the ceramic varistor is defined exclusively by the resistance of the grain boundaries. Symmetrical peaks are observed around the maximum frequency; in addition it is important to note that the relaxation occurs in a narrow frequency range (≈ two decades), which suggests a very narrow distribution of relaxation times. In all cases, −Z´´max decreases with the addition of REOs and their concentration, also at frequencies greater than 1 Hz the curves are practically horizontal. The decrease in −Z´´max values is associated with a decrease in Rgb values [4].
The grain boundary resistance can be obtained according to the following expression [4]:
-Z´´max = Rgb/2,
Furthermore, the capacitance of the grain boundary can be estimated by considering the following relaxation time definitions (τ) [34]:
τ = 1/ω,
Cgb = τ/Rgb,
Where ω is the angular frequency of relaxation (2πf). Then, based on the above, the estimated values of Rgb and Cgb are those shown in Table 1.
The estimated values of Rgb and Cgb should be higher and lower, respectively, for the base ceramic varistor and with the addition of 0.10 M of La2O3 because the maximum of -Z´´ is located at lower frequencies. In all cases, it is observed that the -Z´´max values decrease by increasing the concentration of the REOs, in addition their position shifts slightly at higher frequencies. This suggests a dielectric relaxation process due to the addition of REOs [1].
The previous estimates are valid if the electrical response follows an ideal behavior where a semicircle is the result of a single phenomenon with a single relaxation, however in reality each relaxation phenomenon is the result of a distribution of relaxation times, and this is observed by the decentralization of the semicircle towards the real axis (Z´). This non-ideal behavior has been attributed to effects such as grain size distribution, orientation, grain boundaries, and the presence of atomic defects [34].
In this study, all complex Z´-Z´´ planes (not shown) showed the presence of a large semicircle in the low frequency region and a small semicircle (not detectable, very weak) in the high frequency region. The above is common when the relaxation times are similar, it has been suggested that a good resolution of the semicircles can be observed when the relaxation times differ by at least three orders of magnitude [34] or when the heterogeneity of the material decreases [1].
However, the existence of both semicircles is confirmed by the two maximums of the phase angle observed in the spectra shown in Figure 11. Since the electrical properties of each structure (grain, grain boundary) is electrically equivalent to a RC unit connected in parallel [35], the above suggests that both electrical and dielectric properties of ceramic varistors can be modeled by two RC equivalent circuits. Different equivalent circuit models have been cited in the literature in order to fit the impedance spectroscopy spectra [1,3,4,14,34,36,37]. In many of these studies, in order to explain the non-ideal behavior, the concept of the constant phase element (CPE) has been used:
ZCPE = [Ao(jω)n]−1,
Where A0 is a constant equivalent to capacitance, j = √−1, and n is a frequency independent parameter with values between 0–1. When n = 1, ZCPE is the impedance of an ideal capacitor, and if n = 0, ZCPE is the impedance of a frequency independent ohmic resistance [1]. From these values the capacitance can be calculated according to the following Equation [34]:
C = R[(1-n)/n] Ao(1/n),
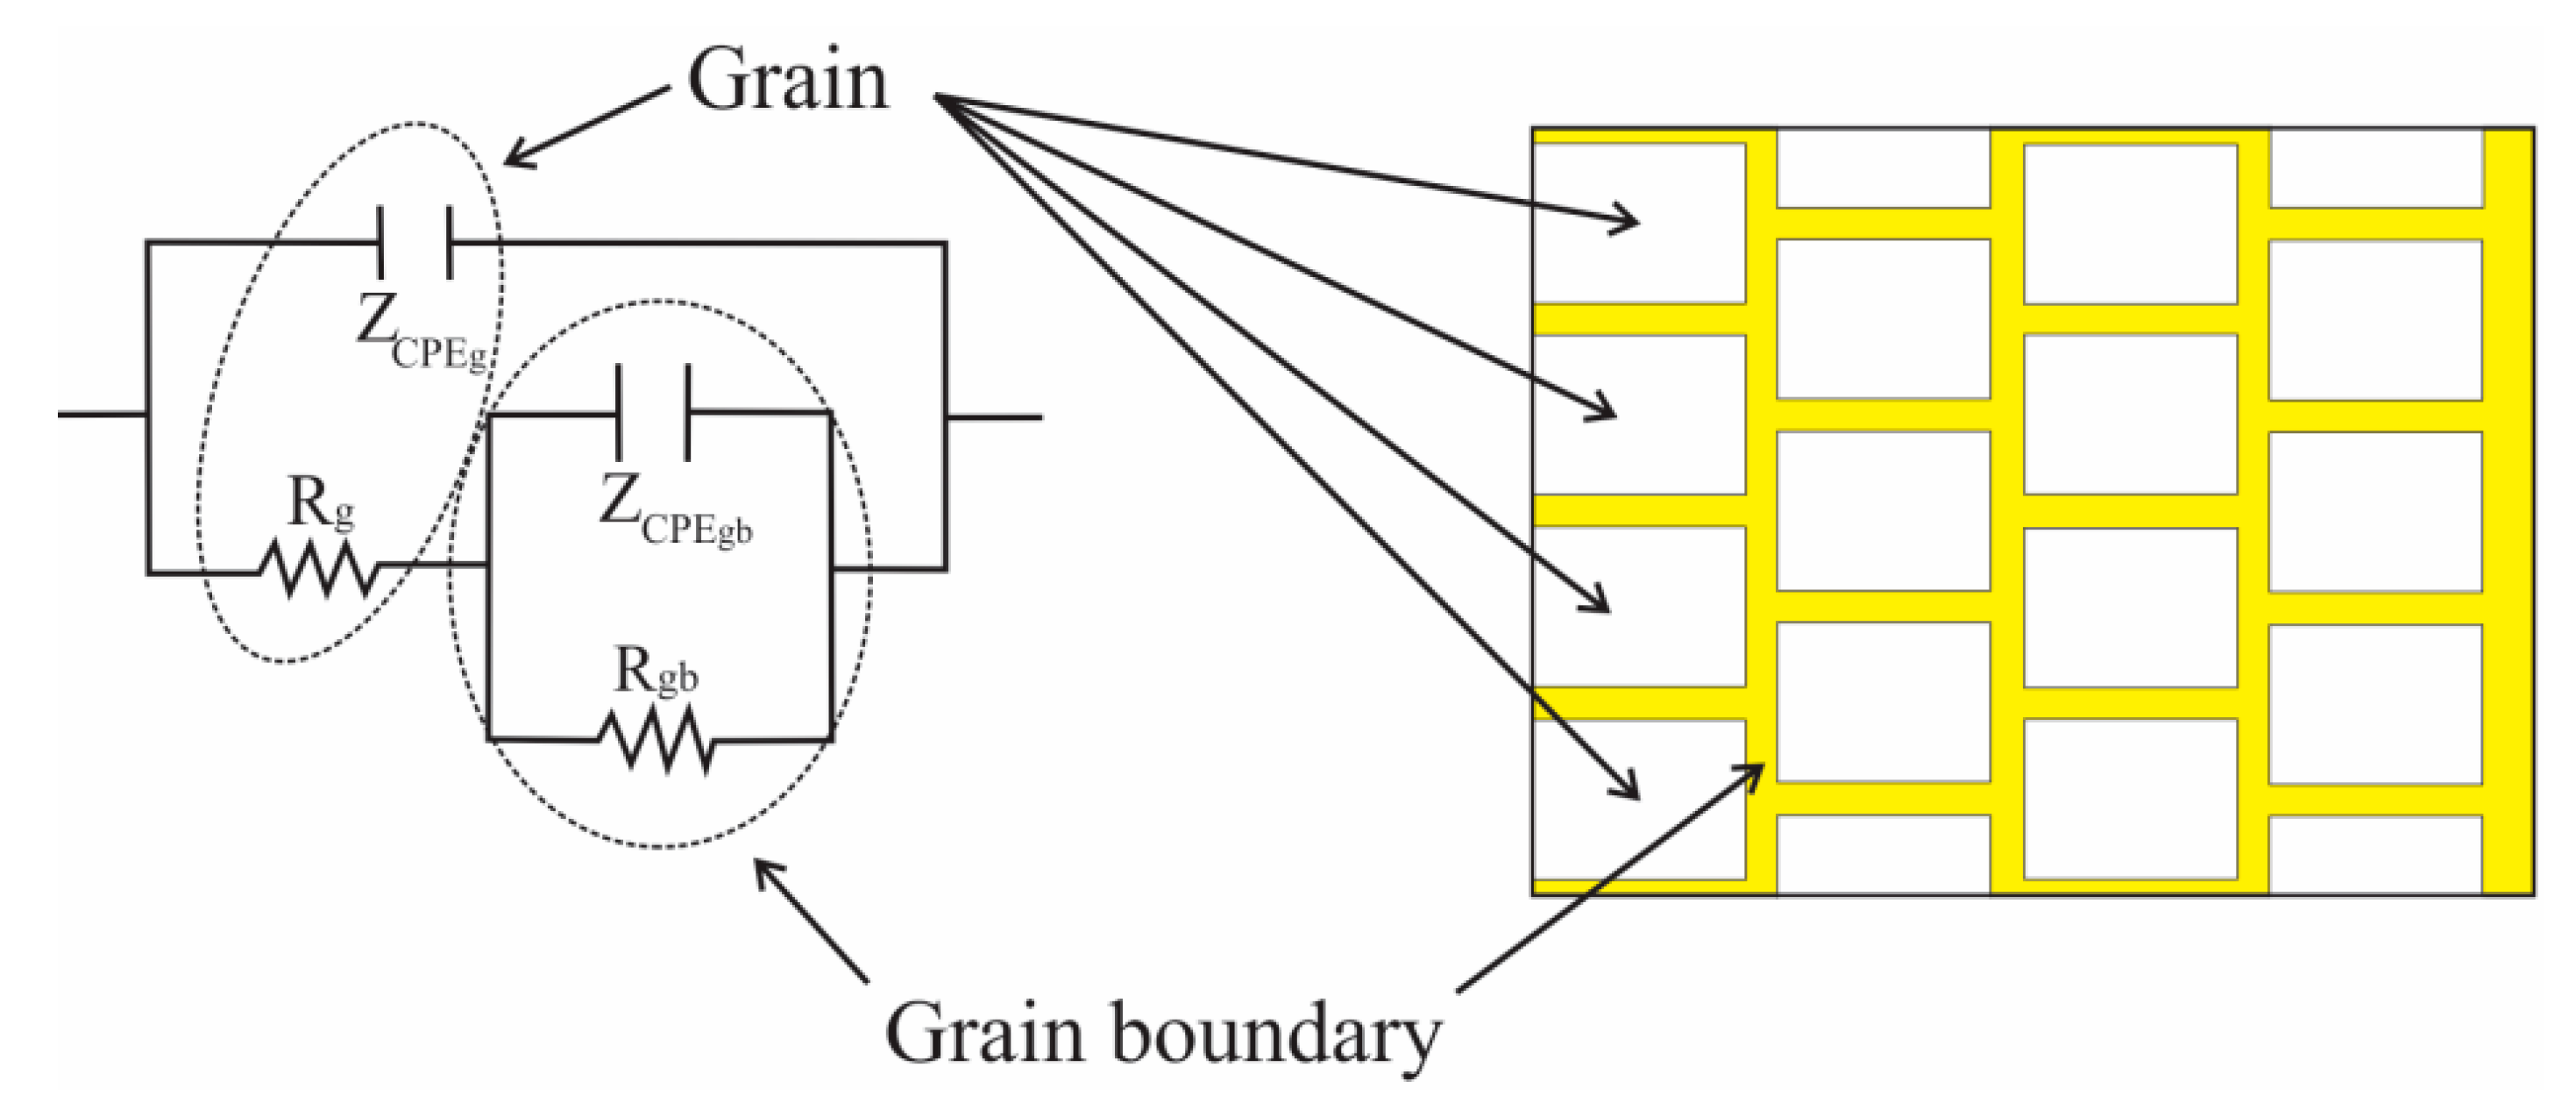
Based on the above, an attempt was made to simulate the impedance spectra with the main equivalent circuits proposed in the literature. However, none of them obtained an adjustment to the impedance spectra of this study. Due to the above, different configurations of equivalent circuits were evaluated and Figure 13 shows the proposed model with which the best fit to the experimental data was obtained.
Figure 14 shows the calculated resistance and capacitance values for grains and grain boundaries from the proposed equivalent circuit. Regarding the properties of the grain, Rg and Cg, it is observed that the resistance of the grain showed some dependence with the concentration and type of REOs added. In particular, with the addition of CeO2, no significant variation is observed in the Rg values, and with the addition of La2O3 and Nd2O3, a slight increase is observed by increasing their concentration. Regarding the Cg values, it is observed that the calculated values show little variation and these are within the same order of magnitude. On the other hand, the Rgb values show a clear dependency with the concentration and type of REOs added. In general, Rgb values decrease by increasing the REOs concentration, this effect being greater by increasing the ionic radius of the rare earth. Regarding the Cgb values as well as the Cg values, it is observed that these do not vary significantly.
Due to the diversity of experimental conditions reported in the literature to evaluate the properties of ceramic varistors (including the synthesis process, chemical composition and sintering temperature, among others), it is difficult to carry out a reliable comparison of the values determined here. However, the calculated values of Rg and Cg are similar to those reported by Belgacem et al. [1], the Rgb values similar to those reported by Pillai et al. [36] and the Cgb values to those reported by Belgacem et al. [1] and Guo-hua Chen et al. [3]. It is interesting to note that the Rgb values calculated by equivalent circuit modeling are very similar to those determined from the Z´´-f relationship shown in Figure 12 and reported in Table 1. However, the Cgb values are different by up to two orders of magnitude; this is due to the non-ideal behavior of the ceramic varistors (the center of the semicircles of the complex plane lie below the real axis).
The results obtained show that the properties of ceramic varistors depend fundamentally on the resistance of the grain boundaries and that the addition of REO affects the microstructural characteristics due to their precipitation at the grain boundaries, mainly at the nodal points.

4. Conclusions

The analyzes and results presented show that the manufacture of ceramic varistors through the mixing of their oxides by means of a hydrothermal treatment produces ceramic varistors with characteristics and properties similar to those reported in the literature through other processing routes. According to the microstructural characterization and by X-ray diffraction, it was observed that the addition of rare earth oxides forms phases rich in rare earth oxides which precipitate at grain boundaries and mainly at nodal points. Its presence and density causes a reduction in the grain size of ZnO and in the proportion of the spinel phase formed (Zn7Sb2O12). By means of impedance spectroscopy, the microstructural characteristics of the ceramic varistors and their electrical response were correlated. The impedance spectra indicated the existence of two-time constants associated with grains and grain boundaries respectively. In general, the addition of REOs had little effect on the properties of the grains, but a marked effect on the properties of the grain boundaries, mainly on the Rgb values. The Rgb values tended to decrease with increasing REO concentration, and this effect was greater when increasing the ionic radius of the rare earths. Furthermore, with the addition of REOs, the –Z’’max values tended to decrease due to a dielectric relaxation process of the grain boundaries. The observed changes are attributed to the precipitation of the REOs at the grain boundaries and the nodal points.

Author Contributions

Data curation, M.S.-C. and J.P.F.-D.l.R.; formal analysis, J.J.R.-H., C.D.A.-G., J.G.C.-N., E.P.-P., M.S.-C. and J.P.F.-D.l.R.; funding acquisition, L.M.-G.; investigation, J.P.-C., J.J.R.-H., C.D.A.-G., J.G.G.-R., M.S.-C. and J.P.F.-D.l.R.; Methodology, J.P.-C., J.J.R.-H., C.D.A.-G., J.G.C.-N., J.G.G.-R., M.S.-C. and J.P.F.-D.l.R.; project administration, J.P.-C. and L.M.-G.; resources, L.M.-G.; Software, E.P.-P.; Supervision, J.P.-C., J.G.G.-R. and L.M.-G.; Validation, E.P.-P.; writing—original draft, J.P.-C., J.J.R.-H., C.D.A.-G., J.G.C.-N., J.G.G.-R. and E.P.-P.; writing—review and editing, J.P.-C., J.J.R.-H., C.D.A.-G. and J.G.C.-N. All authors have read and agreed to the published version of the manuscript.

Funding

There was no funding involved in the research.

Acknowledgments

Financial support from the Consejo Nacional de Ciencia y Tecnología (CONACYT, México) (Project 232611 “Laboratorio Nacional de Materias Primas, Metalurgia y Aleaciones Estratégicas Basadas en Tierras Raras Orientadas a Fortalecer la Sustentabilidad de los Sectores Energía, Transporte y Comunicaciones”) is gratefully acknowledged. The authors are grateful for the support provided by Jorge Tacuba and Jesus Tacuba during their social service residency.

Conflicts of Interest

The authors declare no conflict of interest.

References

  1. Ben Belgacem, R.; Chaari, M.; Braña, A.F.; Garcia, B.J.; Matoussi, A. Structural, electric modulus and complex impedance analysis of ZnO/TiO2 composite ceramics. J. Am. Ceram. Soc. 2017, 100, 2045–2058. [Google Scholar] [CrossRef]
  2. Levinson, L.M.; Philipp, H.R. The physics of metal oxide varistors. J. Appl. Phys. 1975, 46, 1332–1341. [Google Scholar] [CrossRef]
  3. Chen, G.; Li, J.-L.; Chen, X.; Kang, X.-L.; Yuan, C.-L. Sintering temperature dependence of varistor properties and impedance spectroscopy behavior in ZnO based varistor ceramics. J. Mater. Sci. Mater. Electron. 2015, 26, 2389–2396. [Google Scholar] [CrossRef]
  4. Guo, M.; Wu, T.; Liu, T.; Wang, S.-X.; Zhao, X. Characterization of CaCu3Ti4O12 varistor-capacitor ceramics by impedance spectroscopy. J. Appl. Phys. 2006, 99, 124113. [Google Scholar] [CrossRef]
  5. Lustosa, G.M.; Jacomaci, N.; Costa, J.P.; Gasparotto, G.; Perazolli, L.A.; Zaghete, M.A. New Approaches to Preparation of SnO2-Based Varistors—Chemical Synthesis, Dopants, and Microwave Sintering. In Advanced Ceramic Processing; Mohamed, A., Ed.; IntechOpen: Rijeka, Croatia, 2015; p. 25. [Google Scholar] [CrossRef]
  6. West, A.; Andres-Verges, M. Impedance and Modulus Spectroscopy of ZnO Varistors. J. Electroceramics 1997, 1, 125–132. [Google Scholar] [CrossRef]
  7. Nahm, C.W. Effect of La2O3 addition on microstructure and electrical properties of ZnO-Pr6O11-based varistor ceramics. J. Mater. Sci. Mater. Electron. 2005, 16, 345–349. [Google Scholar] [CrossRef]
  8. Nahm, C.-W. Effect of sintering temperature on nonlinear electrical properties and stability against DC accelerated aging stress of (CoO, Cr2O3, La2O3)-doped ZnO–Pr6O11-based varistors. Mater. Lett. 2006, 60, 3311–3314. [Google Scholar] [CrossRef]
  9. Al-Abdullah, K. Elaboration of ZnO Based Varistors and the Effect of the Rare-Earths on their Electrical Behaviour. Energy Procedia 2012, 19, 116–127. [Google Scholar] [CrossRef] [Green Version]
  10. Houabes, M.; Metz, R. Rare earth oxides effects on both the threshold voltage and energy absorption capability of ZnO varistors. Ceram. Int. 2007, 33, 1191–1197. [Google Scholar] [CrossRef]
  11. Gupta, T.K. Application of Zinc Oxide Varistors. J. Am. Ceram. Soc. 1990, 73, 1817–1840. [Google Scholar] [CrossRef]
  12. Shen, J.; Zhang, Y.; Li, M.-Y.; Bao, R.; Shen, M.; Huang, C.; Zhang, G.; Ke, Y.; Li, H.; Jiang, S. Effects of Fe and Al co-doping on the leakage current density and clamp voltage ratio of ZnO varistor. J. Alloys Compd. 2018, 747, 1018–1026. [Google Scholar] [CrossRef]
  13. Nahm, C.W. Sintering effect on ageing behavior of rare earths (Pr6O11-Er2O3-Y2O3)-doped ZnO varistor ceramics. J. Rare Earths 2012, 30, 1028–1033. [Google Scholar] [CrossRef]
  14. Cai, J.; Lin, Y.; Li, M.; Nan, C.-W.; He, J.; Yuan, F. Sintering Temperature Dependence of Grain Boundary Resistivity in a Rare-Earth-Doped ZnO Varistor. J. Am. Ceram. Soc. 2007, 90, 291–294. [Google Scholar] [CrossRef]
  15. Li, J.L.; Chen, G.-H.; Yuan, C.-L. Microstructure and electrical properties of rare earth doped ZnO-based varistor ceramics. Ceram. Int. 2013, 39, 2231–2237. [Google Scholar] [CrossRef]
  16. Xu, N.; Xu, D.; Zhao, G.; Yang, J.; Shi, L. Microstructure and electrical properties of Sc2O3-doped ZnO–Bi2O3-based varistor ceramics. Ceram. Int. 2011, 37, 701–706. [Google Scholar] [CrossRef]
  17. Nahm, C.-W. Microstructure and electrical properties of Tb-doped zinc oxide-based ceramics. J. Non-Cryst. Solids 2007, 353, 2954–2957. [Google Scholar] [CrossRef]
  18. Bernik, S.; Maček, S.; Ai, B. Microstructural and electrical characteristics of Y2O3-doped ZnO–Bi2O3-based varistor ceramics. J. Eur. Ceram. Soc. 2001, 21, 1875–1878. [Google Scholar] [CrossRef]
  19. Nahm, C.-W.; Shin, B.-C.; Min, B.-H. Microstructure and electrical properties of Y2O3-doped ZnO–Pr6O11-based varistor ceramics. Mater. Chem. Phys. 2003, 82, 157–164. [Google Scholar] [CrossRef]
  20. Keil, P.; Gehringer, M.; Frömling, T.; Novak, N.; Rödel, J. ZnO-based single crystal-polycrystal structures for piezotronic applications. J. Am. Ceram. Soc. 2019, 102, 2640–2647. [Google Scholar] [CrossRef]
  21. Cavenaghi, J.M.; Molisani, A.L.; Yoshimura, H.N.; De Sousa, V.C. Influence of compaction manufacturing process on the physical and electrical characteristics of high-voltage varistor. J. Mater. Sci. Mater. Electron. 2007, 18, 957–962. [Google Scholar] [CrossRef]
  22. Lee, W.; Chen, W.; Lee, Y.; Yang, T.; Su, C.; Hu, C. Influence of sintering on microstructure and electrical properties of ZnO-based multilayer varistor (MLV). Ceram. Int. 2007, 33, 1001–1005. [Google Scholar] [CrossRef]
  23. Xia, W.-S.; Zhang, G.-Y.; Shi, L.; Zhang, M.-M. Enhanced microwave dielectric properties of ZnTa2O6 ceramics with Sb5+ ion substitution. Mater. Lett. 2014, 124, 64–66. [Google Scholar] [CrossRef]
  24. Schneider, C.A.; Rasband, W.S.; Eliceiri, K.W. NIH Image to ImageJ: 25 years of image analysis. Nat. Methods 2012, 9, 671–675. [Google Scholar] [CrossRef] [PubMed]
  25. Sendi, R. A comparative study on degradation characteristics of ZnO nanoparticles-Bi2O3-Mn2O3varistors at various ambient sintering processes. Chin. J. Phys. 2017, 55, 2605–2613. [Google Scholar] [CrossRef]
  26. Nahm, C.W. Varistor characteristics of ZnO/V2O5/MnO2/Nb2O5 semiconducting ceramics with Tb4O7 addition. J. Mater. Sci. Mater. Electron. 2015, 26, 4144–4151. [Google Scholar] [CrossRef]
  27. Leite, E.R.; Nobre, M.A.L.; Longo, E.; Varela, J.A. Microstructural development of ZnO varistor during reactive liquid phase sintering. J. Mater. Sci. 1996, 31, 5391–5398. [Google Scholar] [CrossRef]
  28. Lin, W.; Xu, Z.; Wang, Z.; Yang, J.; Zhu, C.; Chu, R. Influence of Bi3Zn2Sb3O14 pre-synthesis phase on electrical properties of the ZnO-Bi2O3 based varistor ceramics. J. Alloy. Compd. 2020, 834, 155070. [Google Scholar] [CrossRef]
  29. Gutknecht, T.; Gustafsson, A.; Forsgren, C.; Ekberg, C.; Steenari, B.M. Investigations into recycling zinc from used metal oxide varistors via pH selective leaching: Characterization, leaching, and residue analysis. Sci. World J. 2015, 2015, 653219. [Google Scholar] [CrossRef] [Green Version]
  30. Drache, M.; Roussel, P.; Wignacourt, J.-P. Structures and Oxide Mobility in Bi−Ln−O Materials: Heritage of Bi2O3. Chem. Rev. 2007, 107, 80–96. [Google Scholar] [CrossRef]
  31. Xu, D.; Cheng, X.; Yuan, H.; Yang, J.; Lin, Y. Microstructure and electrical properties of Y(NO3)3·6H2O-doped ZnO–Bi2O3-based varistor ceramics. J. Alloys Compd. 2011, 509, 9312–9317. [Google Scholar] [CrossRef]
  32. Peiteado, M. Varistores cerámicos basados en óxido de cinc. Bol. Soc. Esp. Ceram. Vidr. 2005, 44, 77–87. [Google Scholar] [CrossRef]
  33. Hung, N.T.; Quang, N.D.; Bernik, S. Electrical and microstructural characteristics of ZnO–Bi2O3-based varistors doped with rare-earth oxides. J. Mater. Res. 2001, 16, 2817–2823. [Google Scholar] [CrossRef]
  34. Nobre, M.A.L.; Lanfredi, S. New evidence of grain boundary phenomenon in Zn7Sb2O12 ceramic: An analysis by impedance spectroscopy. Mater. Lett. 2001, 50, 322–327. [Google Scholar] [CrossRef]
  35. Huang, Y.; Wu, K.; Xing, Z.; Zhang, C.; Hu, X.; Guo, P.; Zhang, J.; Li, J. Understanding the validity of impedance and modulus spectroscopy on exploring electrical heterogeneity in dielectric ceramics. J. Appl. Phys. 2019, 125, 084103. [Google Scholar] [CrossRef]
  36. Pillai, S.C.; Kelly, J.M.; Ramesh, R.; McCormack, D.E. Advances in the synthesis of ZnO nanomaterials for varistor devices. J. Mater. Chem. C 2013, 1, 3268–3281. [Google Scholar] [CrossRef] [Green Version]
  37. Al Abdullah, K.; Bui, A.; Loubière, A. Low frequency and low temperature behavior of ZnO-based varistor by ac impedance measurements. J. Appl. Phys. 1991, 69, 4046–4052. [Google Scholar] [CrossRef]
Figure 1. X-ray diffraction pattern of the base ceramic varistor.
Crystals 10 01134 g001
Figure 2. X-ray diffraction pattern of the base ceramic varistor doped with La2O3.
Crystals 10 01134 g002
Figure 3. X-ray diffraction pattern of the base ceramic varistor doped with CeO2.
Crystals 10 01134 g003
Figure 4. X-ray diffraction pattern of the base ceramic varistor doped with Nd2O3.
Crystals 10 01134 g004
Figure 5. Surface aspect of the base ceramic varistor.
Crystals 10 01134 g005
Figure 6. Surface appearance of the ceramic varistor (a), and element mapping; (b) Zn, (c) Bi, (d) Sb, (e) Cr, (f) Co, (g) Mn, (h) Ni.
Crystals 10 01134 g006
Figure 7. Surface aspect of doped base ceramic varistor: (a) 0.1% La2O3, (b) 0.25% La2O3, (c) 0.5% La2O3, (d) 0.1% CeO2, (e) 0.25% CeO2, (f) 0.5% CeO2, (g) 0.1% Nd2O3, (h) 0.25% Nd2O3, (i) 0.5% Nd2O3.
Crystals 10 01134 g007
Figure 8. Surface appearance of the 0.5% Nd2O3-doped ceramic varistor (a), and element mapping; (b) Zn, (c) Bi, (d) Sb, (e) Cr, (f) Co, (g) Mn, (h) Ni, (i) Nd.
Crystals 10 01134 g008
Figure 9. Grain size of ceramic varistors. (a) histogram of average grain size, (b) grain size distribution.
Crystals 10 01134 g009
Figure 10. Impedance spectroscopy spectra of the base ceramic varistor at different thicknesses. Data normalized to a unit of thickness (1 mm) and area (cm2). (a) Frequency-impedance module graph, (b) Frequency-phase angle graph.
Crystals 10 01134 g010
Figure 11. Effect of the addition of La2O3 (a,b), CeO2 (c,d) and Nd2O3 (e,f) on the impedances spectroscopy spectra of the base ceramic varistor.
Crystals 10 01134 g011
Figure 12. Effect of the addition of La2O3 (a), CeO2 (b) and Nd2O3 (c) on the -Z´´-f relationship.
Crystals 10 01134 g012
Figure 13. Equivalent circuit proposed to adjust the resistive-capacitive response of the grains and grain boundaries of ceramic varistors (schematic representation of the ceramic varistor in cross section).
Crystals 10 01134 g013
Figure 14. Effect of the addition of rare earth oxides (REOs) on the resistance (a,b) and capacitance (c,d) of both grains and grain boundaries, respectively.
Crystals 10 01134 g014
Table 1. Rgb and Cgb values estimated from the -Z´´-f relationship.
[REO]La2O3CeO2Nd2O3
Rgb [Ω-cm2]Cgb [F-cm2]Rgb [Ω-cm2]Cgb [F-cm2]Rgb [Ω-cm2]Cgb [F-cm2]
0.001.79 × 10113.51 × 10−141.79 × 10113.51 × 10−141.79 × 10113.51 × 10−14
0.101.43 × 10114.40 × 10−147.62 × 10101.04 × 10−133.96 × 10105.02 × 10−13
0.254.77 × 10101.66 × 10−135.06 × 10102.47 × 10−131.49 × 10103.34 × 10−12
0.501.50 × 10103.33 × 10−122.12 × 10101.48 × 10−127.88 × 10091.26 × 10−11
Publisher’s Note: MDPI stays neutral with regard to jurisdictional claims in published maps and institutional affiliations.