1. Introduction
Linear complexions are thermodynamically-stable nanoscale phases recently discovered at dislocations in the Fe-9 at.% Mn alloy [
1]. Similar to interfacial complexions confined to grain boundary regions [
2,
3,
4], linear complexions are defined by a structure and chemistry that are different from the matrix, but can only exist in the presence of crystalline defects, with dislocations serving that role for linear complexions. Using atomistic simulations, the authors of this work recently predicted a wide variety of linear complexions in body centered cubic (BCC) and face centered cubic (FCC) metals [
5,
6,
7]. One interesting feature of linear complexions in BCC Fe-based alloys is the presence of a metastable phase in the dislocation segregation zone, which maintains coherent interfaces with the matrix phase. These metastable phases have been reported for the Fe-Ni system with simulations [
5] and for the Fe-Mn system with experiments [
8]. Other interesting features have been predicted for FCC alloys, such as the formation of 2D platelet phases that can form platelet arrays along partial dislocations or replace the dislocation stacking fault [
7]. While some of these complexion types still require experimental validation, it is clear that linear complexions at dislocations represent a new exciting materials research area for crystalline solids, since this topic has the potential to enable new materials with unique properties.
While the effects of grain boundary complexions on various material properties have been studied extensively [
9,
10,
11,
12], similar research on the influence of linear complexions is limited. One example of existing work in this area is the study of Kwiatkovski de Silva et al. [
13], who demonstrated a static strain aging effect in single crystal Fe-Mn samples containing linear complexions. Specifically, the atomic-scale details of dislocation-linear complexion interactions and the associated mechanical behavior are not known. Atomistic simulations are proven to be a powerful tool for investigating the nanoscale mechanics involving dislocation interactions with alloying elements [
14], grain boundaries and grain boundary complexions [
15,
16], nanoscale precipitates [
17,
18], ceramic nanoparticles [
19], Guinier-Preston zones [
20,
21], and vacancy clusters [
22]. Atomistic simulations act in these situations as a digital microscope, providing a great level of detail on structural and chemical transitions as well as deformation mechanisms at the nanoscale. For example, multi-principal element alloys have intriguing mechanical properties. However, their deformation physics are complicated by the compositional complexity of the lattice. Jian et al. [
23] reported on the roles of lattice distortion and chemical short range order on dislocation behavior, finding that these factors can result in enhanced glide resistance. Xu et al. [
24] explored the local slip resistances in a BCC multi-principal element alloy on a variety of slip planes and with a variety of Burgers vectors, observing that these alloys could deform by a multiplicity of slip modes. The work of Wang et al. [
14] provided experimental validation of such a plasticity mechanism and connected this behavior to the observation of a strength plateau at intermediate temperatures rather than the rapidly decreasing strength of traditional BCC alloys with an increasing testing temperature.
Due to the recent discovery of linear complexions, a comprehensive investigation of their effect on dislocation propagation and pinning is missing in the literature. In this paper, we provide the first mechanistic insight into the effect of nanoparticle array linear complexions in a BCC Fe-Ni alloy on mechanical behavior, with a solid solution of the same composition providing a point for comparison. The atomistic mechanisms associated with dislocation pinning and unpinning events during the shear deformation are investigated in detail, and connected to the shape of the stress-strain curve. Finally, the structure of the linear complexion is found to change as the dislocation and its local stress field moves away, resulting in an interdependence of dislocation behavior and complexion structure. The results shown here highlight that linear complexions are defect states that both alter and react to the dislocation environment, providing a pathway for the direct manipulation of mechanical behavior.
2. Materials and Methods
Atomistic simulations, including molecular statics, molecular dynamics (MD), and hybrid Monte Carlo (MC)/MD, were performed using the Large-scale Atomic/Molecular Massively Parallel Simulator (LAMMPS) software (Sandia National Laboratories, Albuquerque, NM, USA) [
25] with an embedded-atom method (EAM) potential parametrized to reproduce the binary Fe-Ni system used to model atomic interactions [
26]. All MD simulations used a 1 fs integration timestep. Atomic snapshots were analyzed and visualized using the OVITO software (OVITO GmbH, Darmstadt, Germany) [
27]. The crystalline structure and chemical ordering were analyzed using the Polyhedral Template Matching method [
28], while the positions of dislocation lines were identified using the Dislocation Extraction Algorithm [
29].
The Fe-Ni system and the given potential were chosen for several reasons. First, the Fe-Ni phase diagram is similar to the phase diagram of the Fe-Mn system in which linear complexions were first discovered experimentally. This is important because only two Fe-Mn potentials currently can be found in the literature, but neither is appropriate for the goals of this study. Bonny et al. [
30] developed an Fe-Mn EAM potential while Kim et al. [
31] developed an Fe-Mn modified embedded atom method (MEAM) potential but neither was rigorously fitted to reproduce the bulk phase diagram. Moreover, MEAM potentials are not currently compatible with the hybrid MC/MD code used here. Since it is critical to reproduce the relevant phases for the alloy system, the Fe-Ni potential from Bonny et al. [
26] was chosen for this work since it was fitted based on the experimental phase diagram for Fe-Ni and was found to reproduce the stable intermetallic phases (L1
0-FeNi and L1
2-FeNi
3). The main weakness of the potential is that the solubility limit of Ni in BCC Fe is overestimated, meaning that exact composition values for complexion transitions should not be compared with experiments. In addition, Domain and Becquart [
32] performed density functional theory (DFT) calculations of segregation to self-interstitial atom clusters, finding that Ni may be able to segregate to sites under both local compressive and tensile stresses, while the EAM potential only predicted segregation to the tensile regions. This suggests that some segregation of Ni dopants to both sides of the dislocation may occur during the initial segregation stages. However, the final linear complexion structure is not expected to be affected by this, and, in fact, the simulated linear complexions resemble those observed experimentally in Fe-Mn [
5,
6]. Strong variations of Ni composition along the dislocation line were observed at the compression side in the dislocation segregation zone with the composition near precipitates approaching ~50 at.% Ni while, in between precipitates, the composition was near the global composition in the system. Based on these observations, we conclude that the final form of the complexion and solute distribution around the dislocation core is controlled by the second-phase precipitation and growth, and not by the initial solute segregation. Next, we provide the simulation details for a representative computational cell containing linear complexions, prepared for mechanical testing.
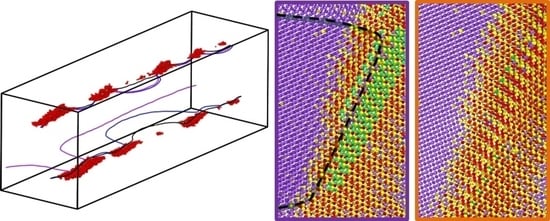
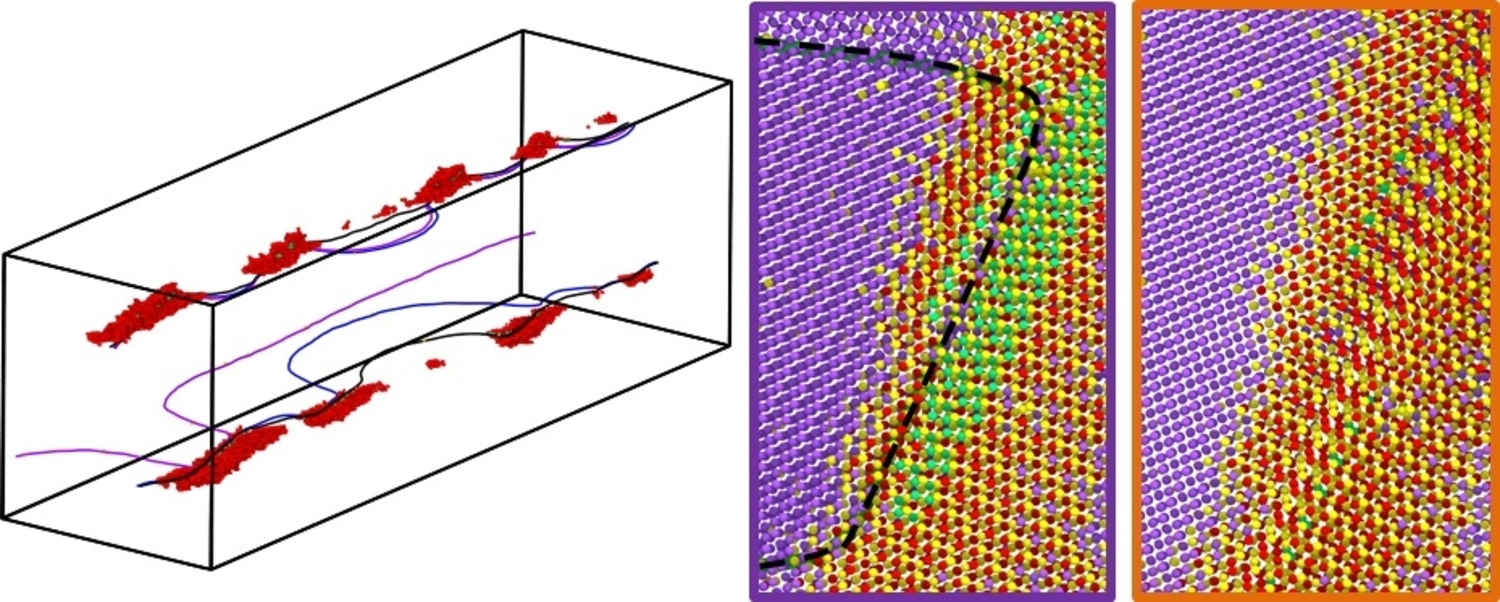
First, an initial simulation cell with two edge dislocations was prepared, as shown in
Figure 1a. The dislocations were inserted by removing one-half of the atomic plane in the middle of the sample and relaxing the atomic structure using the conjugate gradient descent method implemented in LAMMPS. Next, 2 at.% Ni atoms were randomly distributed within the sample by replacing Fe atoms, which was followed by MD equilibration with an NPT ensemble (constant number of atoms, constant pressure, and constant temperature) at zero pressure and 300 K temperature for 20 ps. Three thermodynamically-equivalent initial solid solution configurations with different random distributions of solutes were prepared with this procedure, providing a baseline for comparison against samples containing linear complexions. To induce linear complexion formation, the alloy samples were equilibrated at 500 K using the hybrid MC/MD method, which allows for both chemical segregation as well as local structural relaxations. The MC steps were performed after every 0.1 ps of MD relaxation time, using a variance-constrained semi-grand canonical ensemble that can stabilize alloy systems with coexisting phases [
33,
34]. This method has been used in a number of recent modeling studies to capture complexion transitions in metallic alloys [
35,
36,
37]. The MC/MD procedure led to Ni segregation to the compressive side of the dislocations and then formation of linear complexions in the form of nanoscale precipitate arrays composed of metastable B2-FeNi and stable L1
0-FeNi phases, as shown in
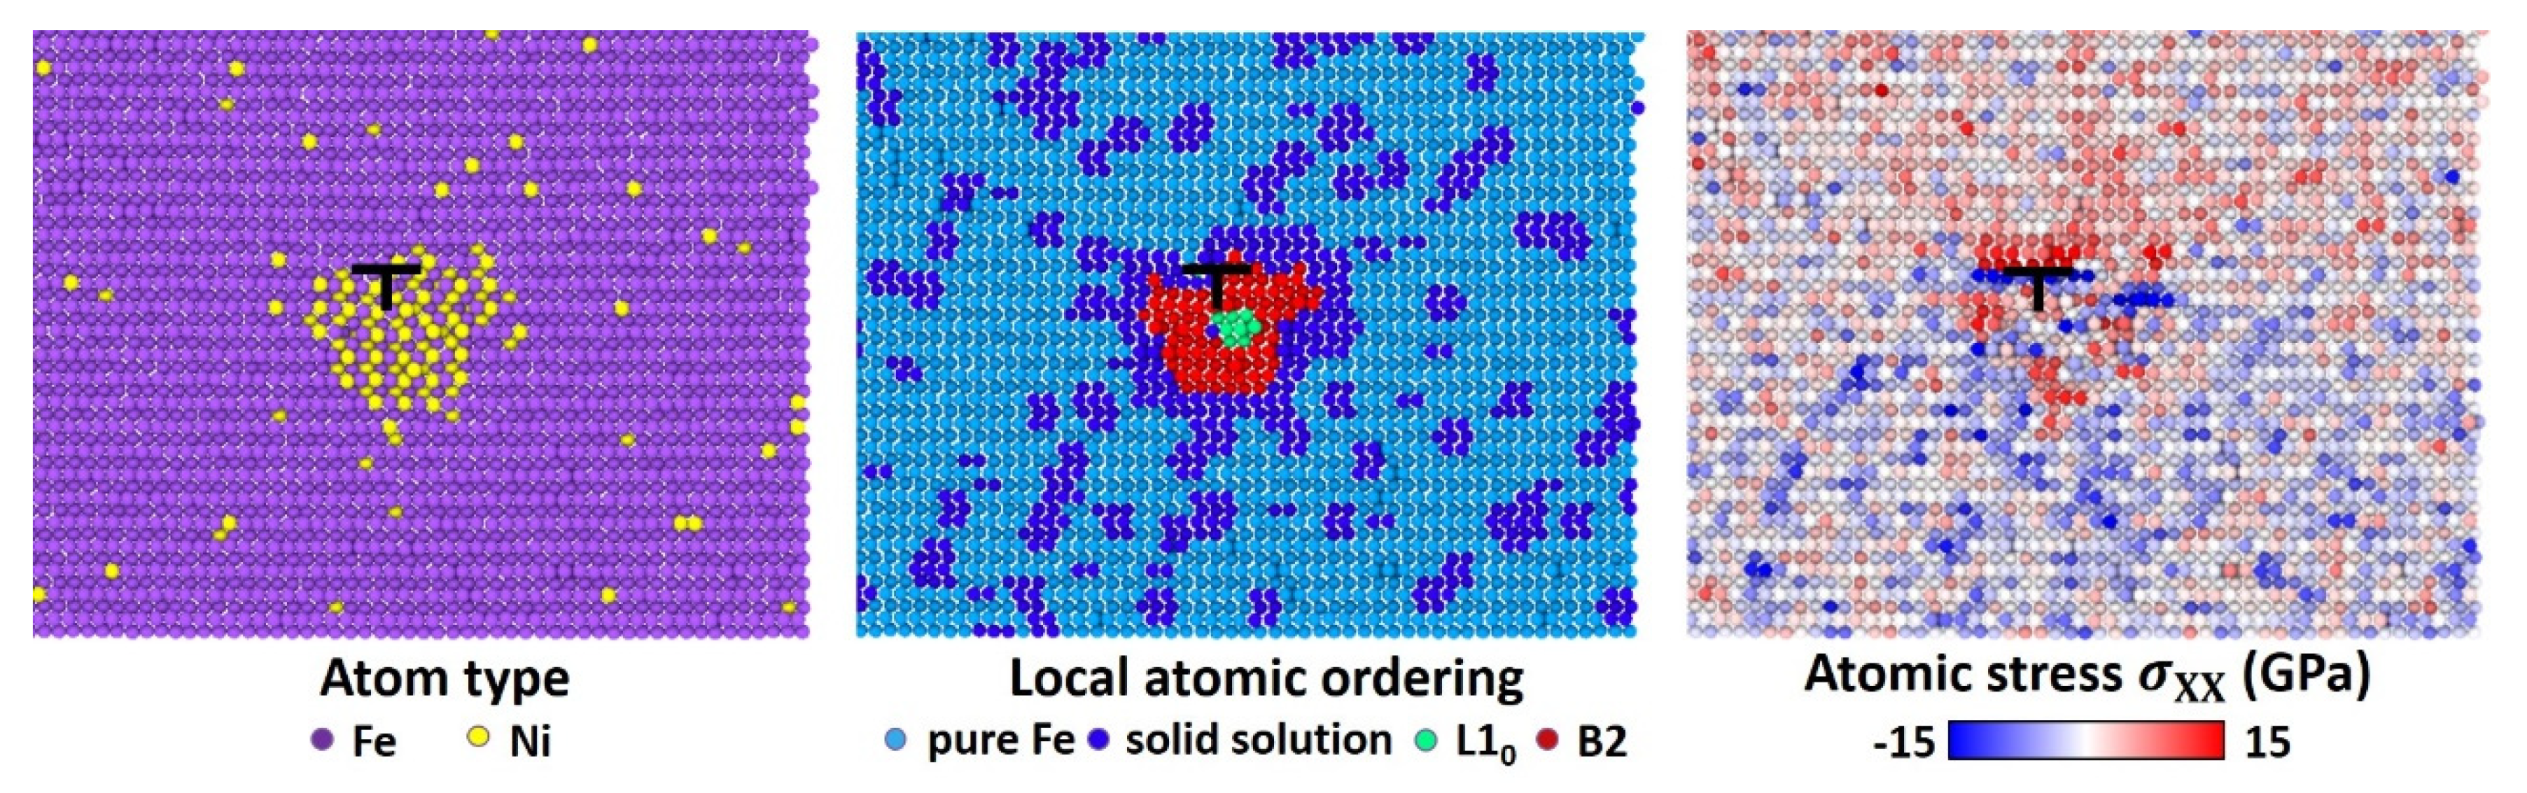
Figure 1. The presence of nanoscale precipitates reduces the compressive stresses on the side of the dislocation with the extra half-plane of atoms (see the zoomed view of the bottom dislocation in
Figure 2). More details about the MC/MD procedure for linear complexions in the Fe-Ni system can be found in our previous studies of equilibrium complexion states [
5,
6]. The MC/MD simulations were determined to be in equilibrium once the rate of evolution of total simulation cell energy fell below 1 eV/ns, even though the procedure was continued for additional time to sample three distinct yet thermodynamically equivalent samples. These samples were then cooled to 300 K over 20 ps with MD for subsequent mechanical testing.
The solid solution specimens and the samples containing linear complexions were then deformed to promote dislocation slip by applying the XY shear deformation to the simulation cell. The deformation of the cell was performed with the non-equilibrium MD method [
38,
39], using an engineering strain rate of 10
8 s
−1 at 300 K. To test the effect of deformation rate, an additional simulation was performed at an engineering strain rate of 10
7 s
−1. The deformation of the cell was stopped after 10% applied shear strain, and the stress-strain curves were extracted and analyzed in the context of atomic-scale deformation mechanisms and the local structure of the linear complexions.
3. Results and Discussion
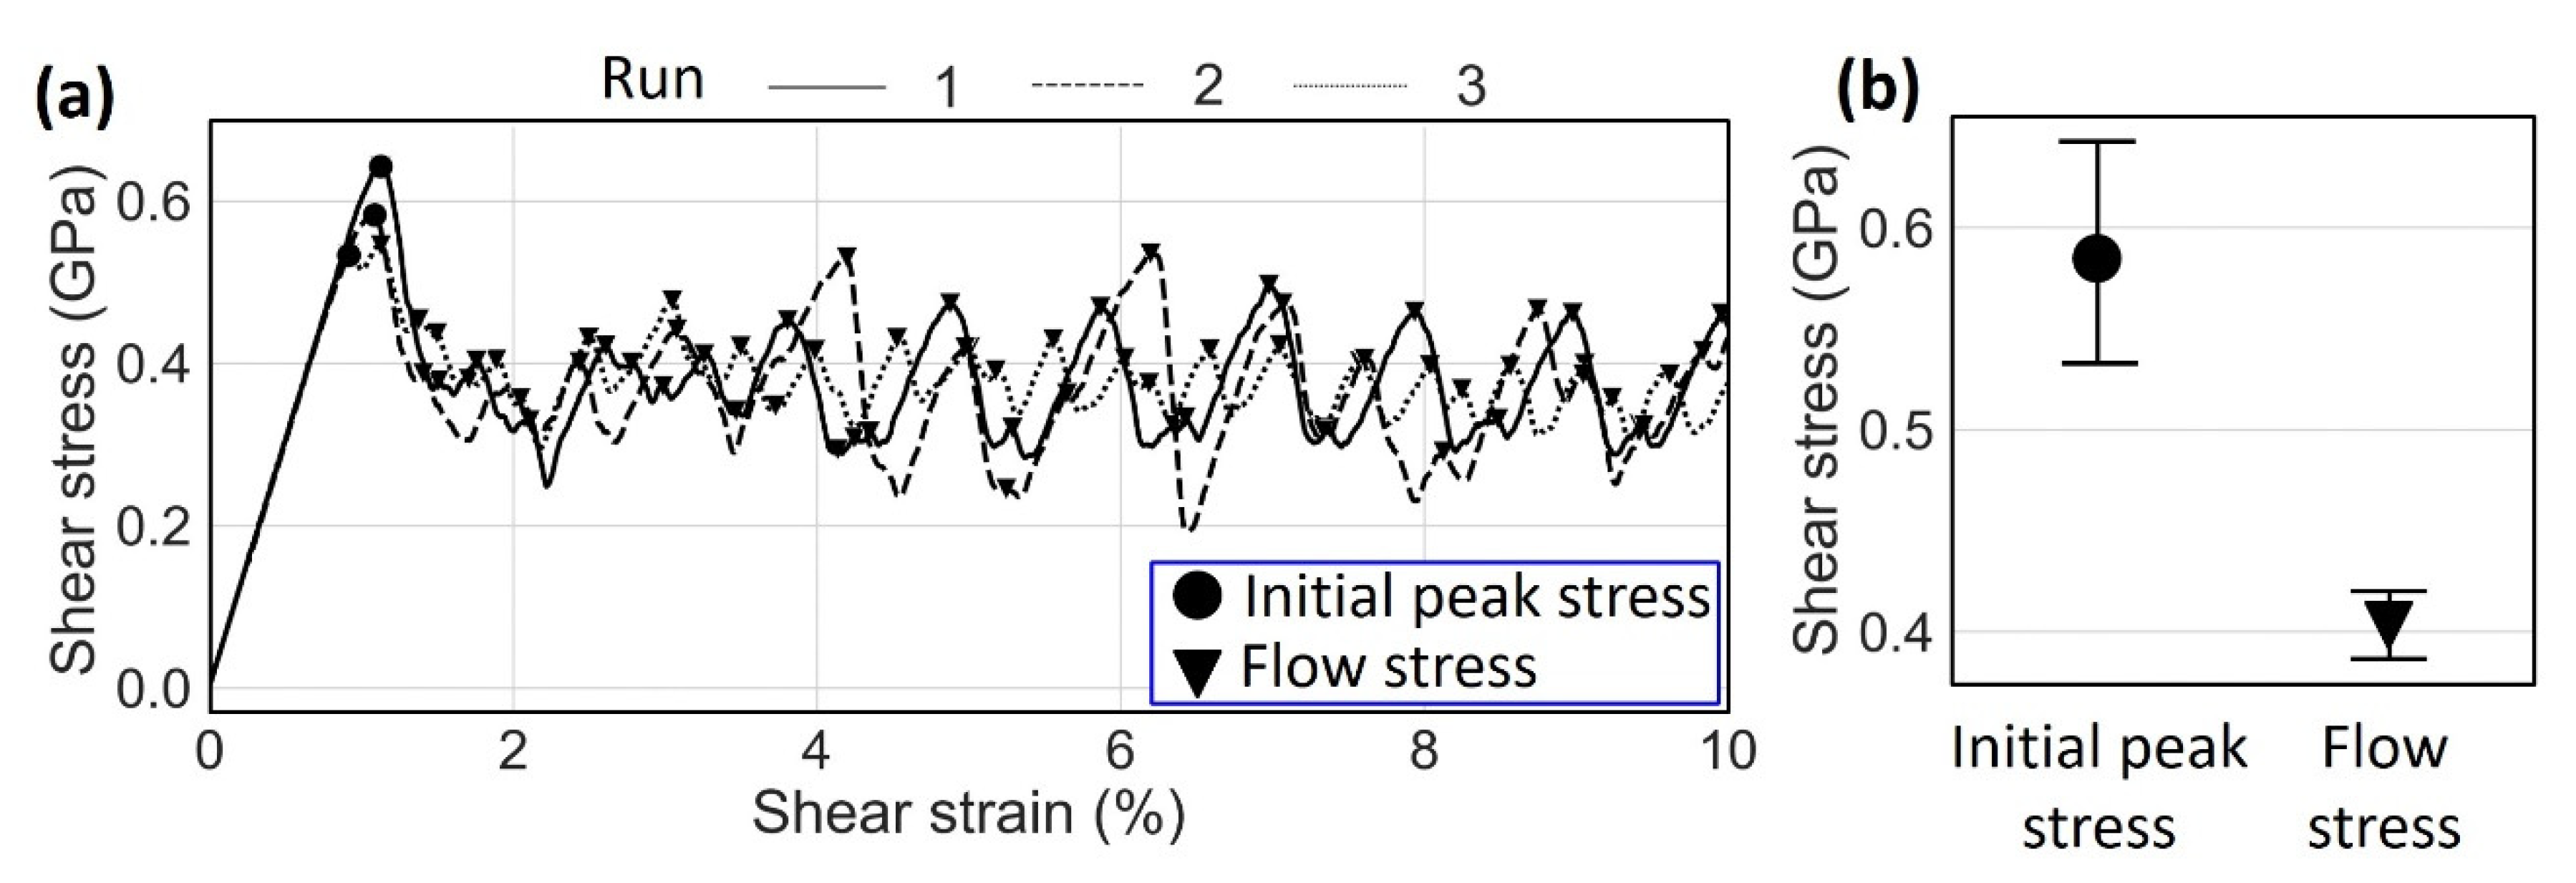
Figure 3a shows the obtained stress-strain curves for the samples with linear complexions. We observe profound initial stress peaks for all the samples, indicated by black circles. The initial plastic events are followed by smaller peaks, indicated by black triangles, that represent the flow stress of the dislocations passing by the linear complexions. Similar stress-strain curves with a profound first peak have been previously reported in experimental work on linear complexions in an Fe-9 at. % Mn alloy [
13]. The substantial strain aging is observed in both experimental Fe-Mn and modeled Fe-Ni systems with linear complexions. The average values for both the initial break-away stress and the flow stress for the simulated Fe-Ni samples with linear complexions are presented in
Figure 3b. The mean initial break-away stress of 586 MPa is 45% higher than the mean flow stress of 404 MPa. We note that these values should not be directly compared to experimental measurements, as other aspects of alloy strengthening from defects, such as grain boundaries, are not present in the simulation cell, which isolates the dislocation pair.
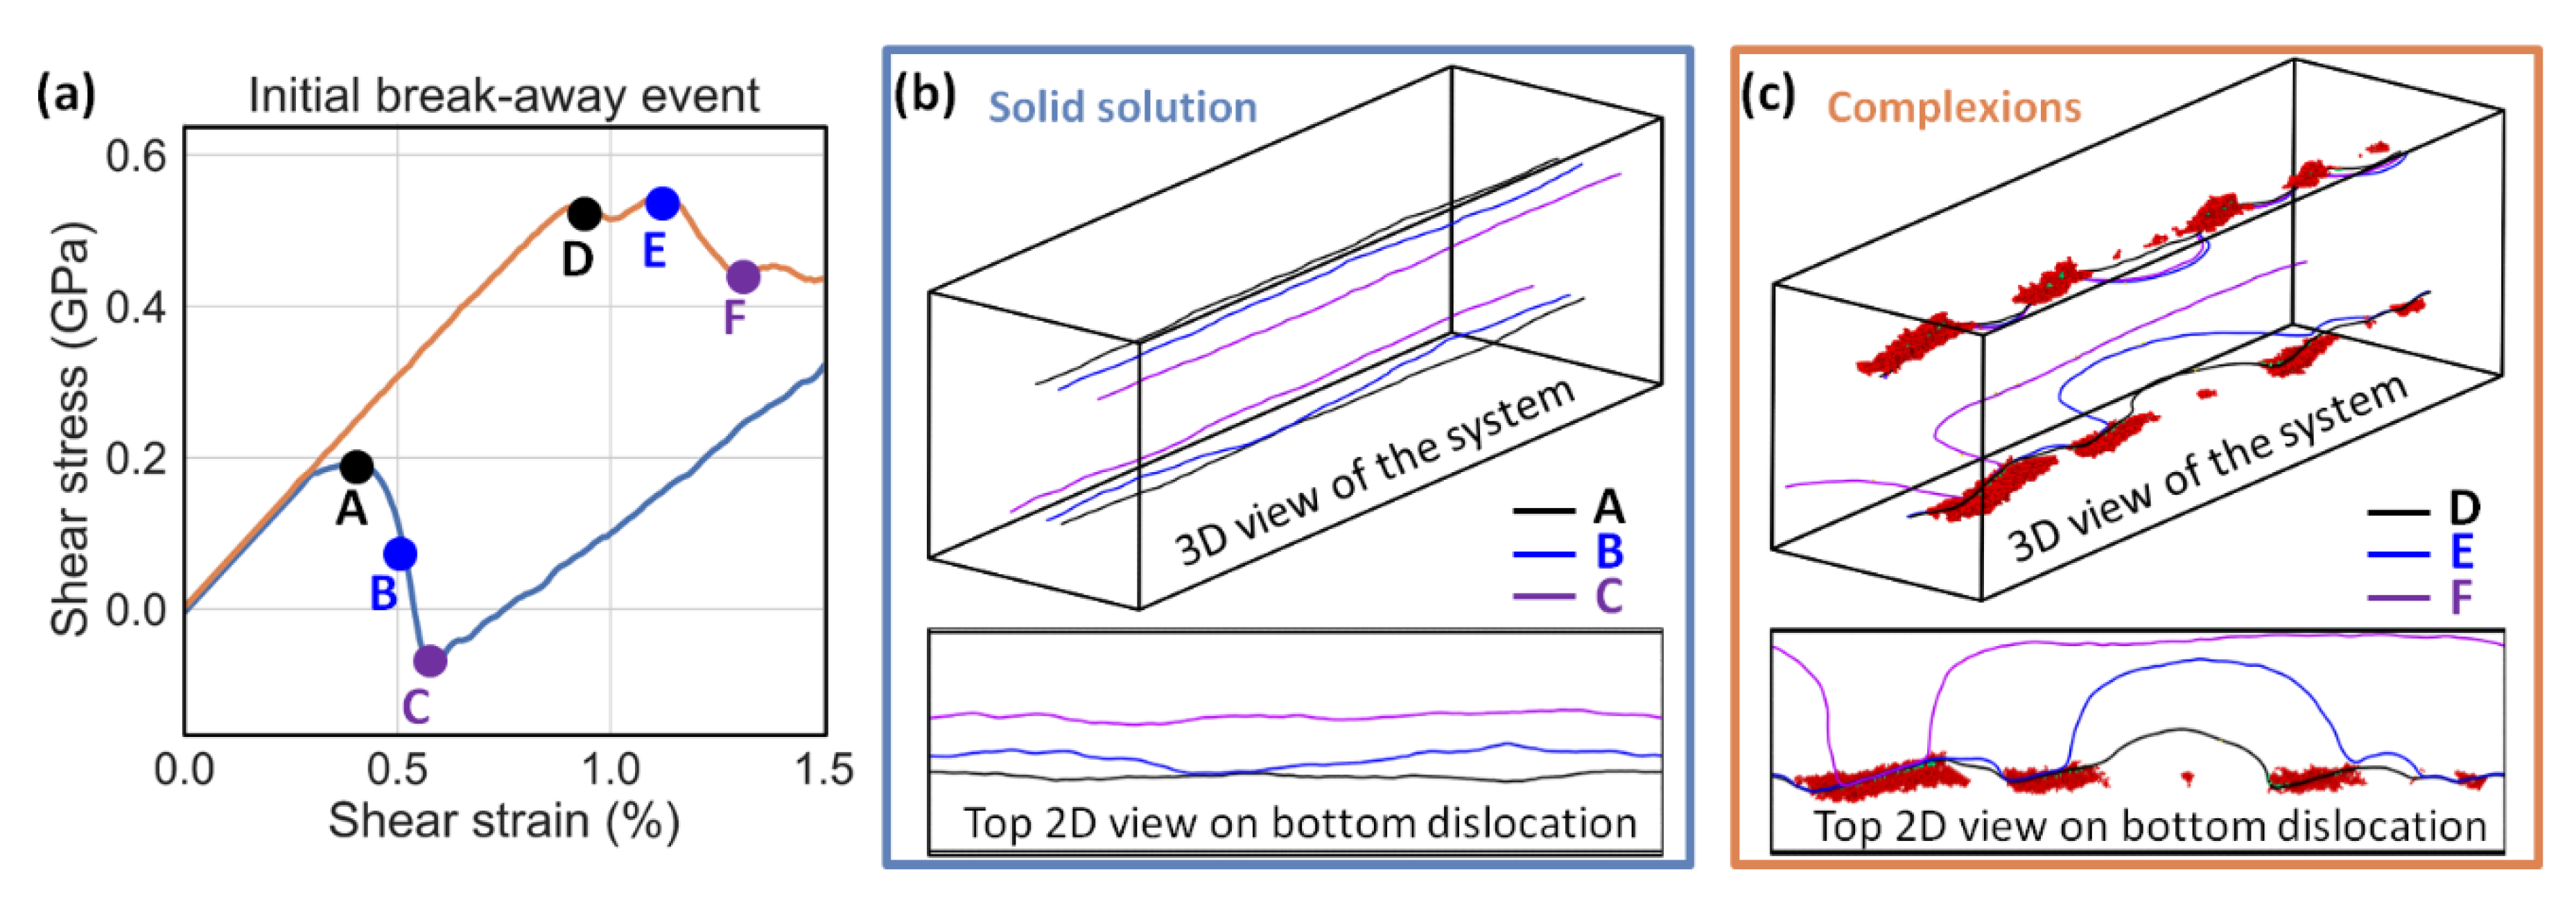
To understand how deformation differs between the solid solution and linear complexion states,
Figure 4 presents the initial flow events for representative examples of each of the two sample types.
Figure 4a shows the elastic loading and initial flow event, where it is clearly observed that the dislocation can move much more easily in the solid solution sample.
Figure 4b shows the dislocation pair at three different simulation times (or, equivalently, applied strains since the strain rate is controlled). The two dislocations in the solid solution remain relatively straight during the motion, with the top dislocation shifting to the right and the bottom dislocation moving to the left. The solutes in the solution act as obstacles that must be locally overcome, leading to very little change in the dislocation shape. The bottom dislocation is shown from a top view in the lower half of
Figure 4b, demonstrating the progressive migration that leads to a temporary stress drop as a set of local, solute obstacles are overcome. The local obstacles are easily overcome, which is why the initial peak stress for the solid solution specimens is relatively low. In general, the dislocation in the solid solution sample behaves in a “textbook” fashion, with few features of interest.
The mechanism of the dislocation motion is drastically different for the specimen with linear complexions with dislocation bowing and unpinning from the nanoscale precipitates one by one, starting in the region with the largest distance between particles, controlling the yield event shown in
Figure 4c. It is important to note that only one dislocation, which is the defect at the bottom of the cell, is moving in the linear complexion sample. The other dislocation at the top of the cell bows under increasing stress but remains pinned by the nanoparticle array linear complexion. One dislocation is favored to move over the other because the nanoparticle arrays, while similar, are not exactly identical. A bowing mechanism is easiest in the location where there is the largest spacing between obstacles, which occurs near the middle of the lower dislocation. While dislocation bowing is a common mechanism for overcoming precipitates in conventional alloys, an important distinction is found for the linear complexion state. The obstacle is not in the dislocation’s slip plane. Traditional Orowan bowing occurs when an impenetrable obstacle (e.g., a precipitate with a different crystal structure than the matrix) impedes the dislocation’s slip path, requiring bowing to move past the obstacle in a way that leaves dislocation loops around the obstacle. However, in the case of linear complexions, the nanoparticles are primarily above or below the dislocation slip plane (depending on whether one is looking at the top or bottom dislocation). Even the small portion of the B2-FeNi intermetallic phase that crosses the slip plane in
Figure 1 has the same BCC crystal structure as the matrix phase and a lattice parameter that is similar. The linear complexion is not an impenetrable obstacle and, in fact, no new dislocation loops or segments are formed as the dislocation pulls away. The strong initial pinning can be explained from the same energetic perspective that is used to describe the complexion nucleation. Segregation of Ni occurs to the compressed region near the edge dislocation until the local composition is enriched enough that a complexion transition can occur [
5,
6]. Although the Gibbs free energy of the L1
0 phase is lower, which is why this structure appears on the bulk phase diagram, the restriction to a nanoscale region and the large energy cost for an incoherent BCC-L1
0 interface results in the formation of a “shell” of a metastable B2 phase surrounding the L1
0 core [
6]. Fundamentally, the local stress field near the dislocation is relaxed by this transformation and the driving force for motion under shear stress (i.e., the Peach-Koehler force [
40,
41]) is, therefore, reduced. We do note that segregation of Ni to the dislocation is needed to create the linear complexion states, lowering the solute composition in the matrix solid solution and removing some weak obstacles. However, the net effect is still a notable strengthening increment, as the strong linear complexion obstacles more than make up for losing some amount of solid solution strengthening.
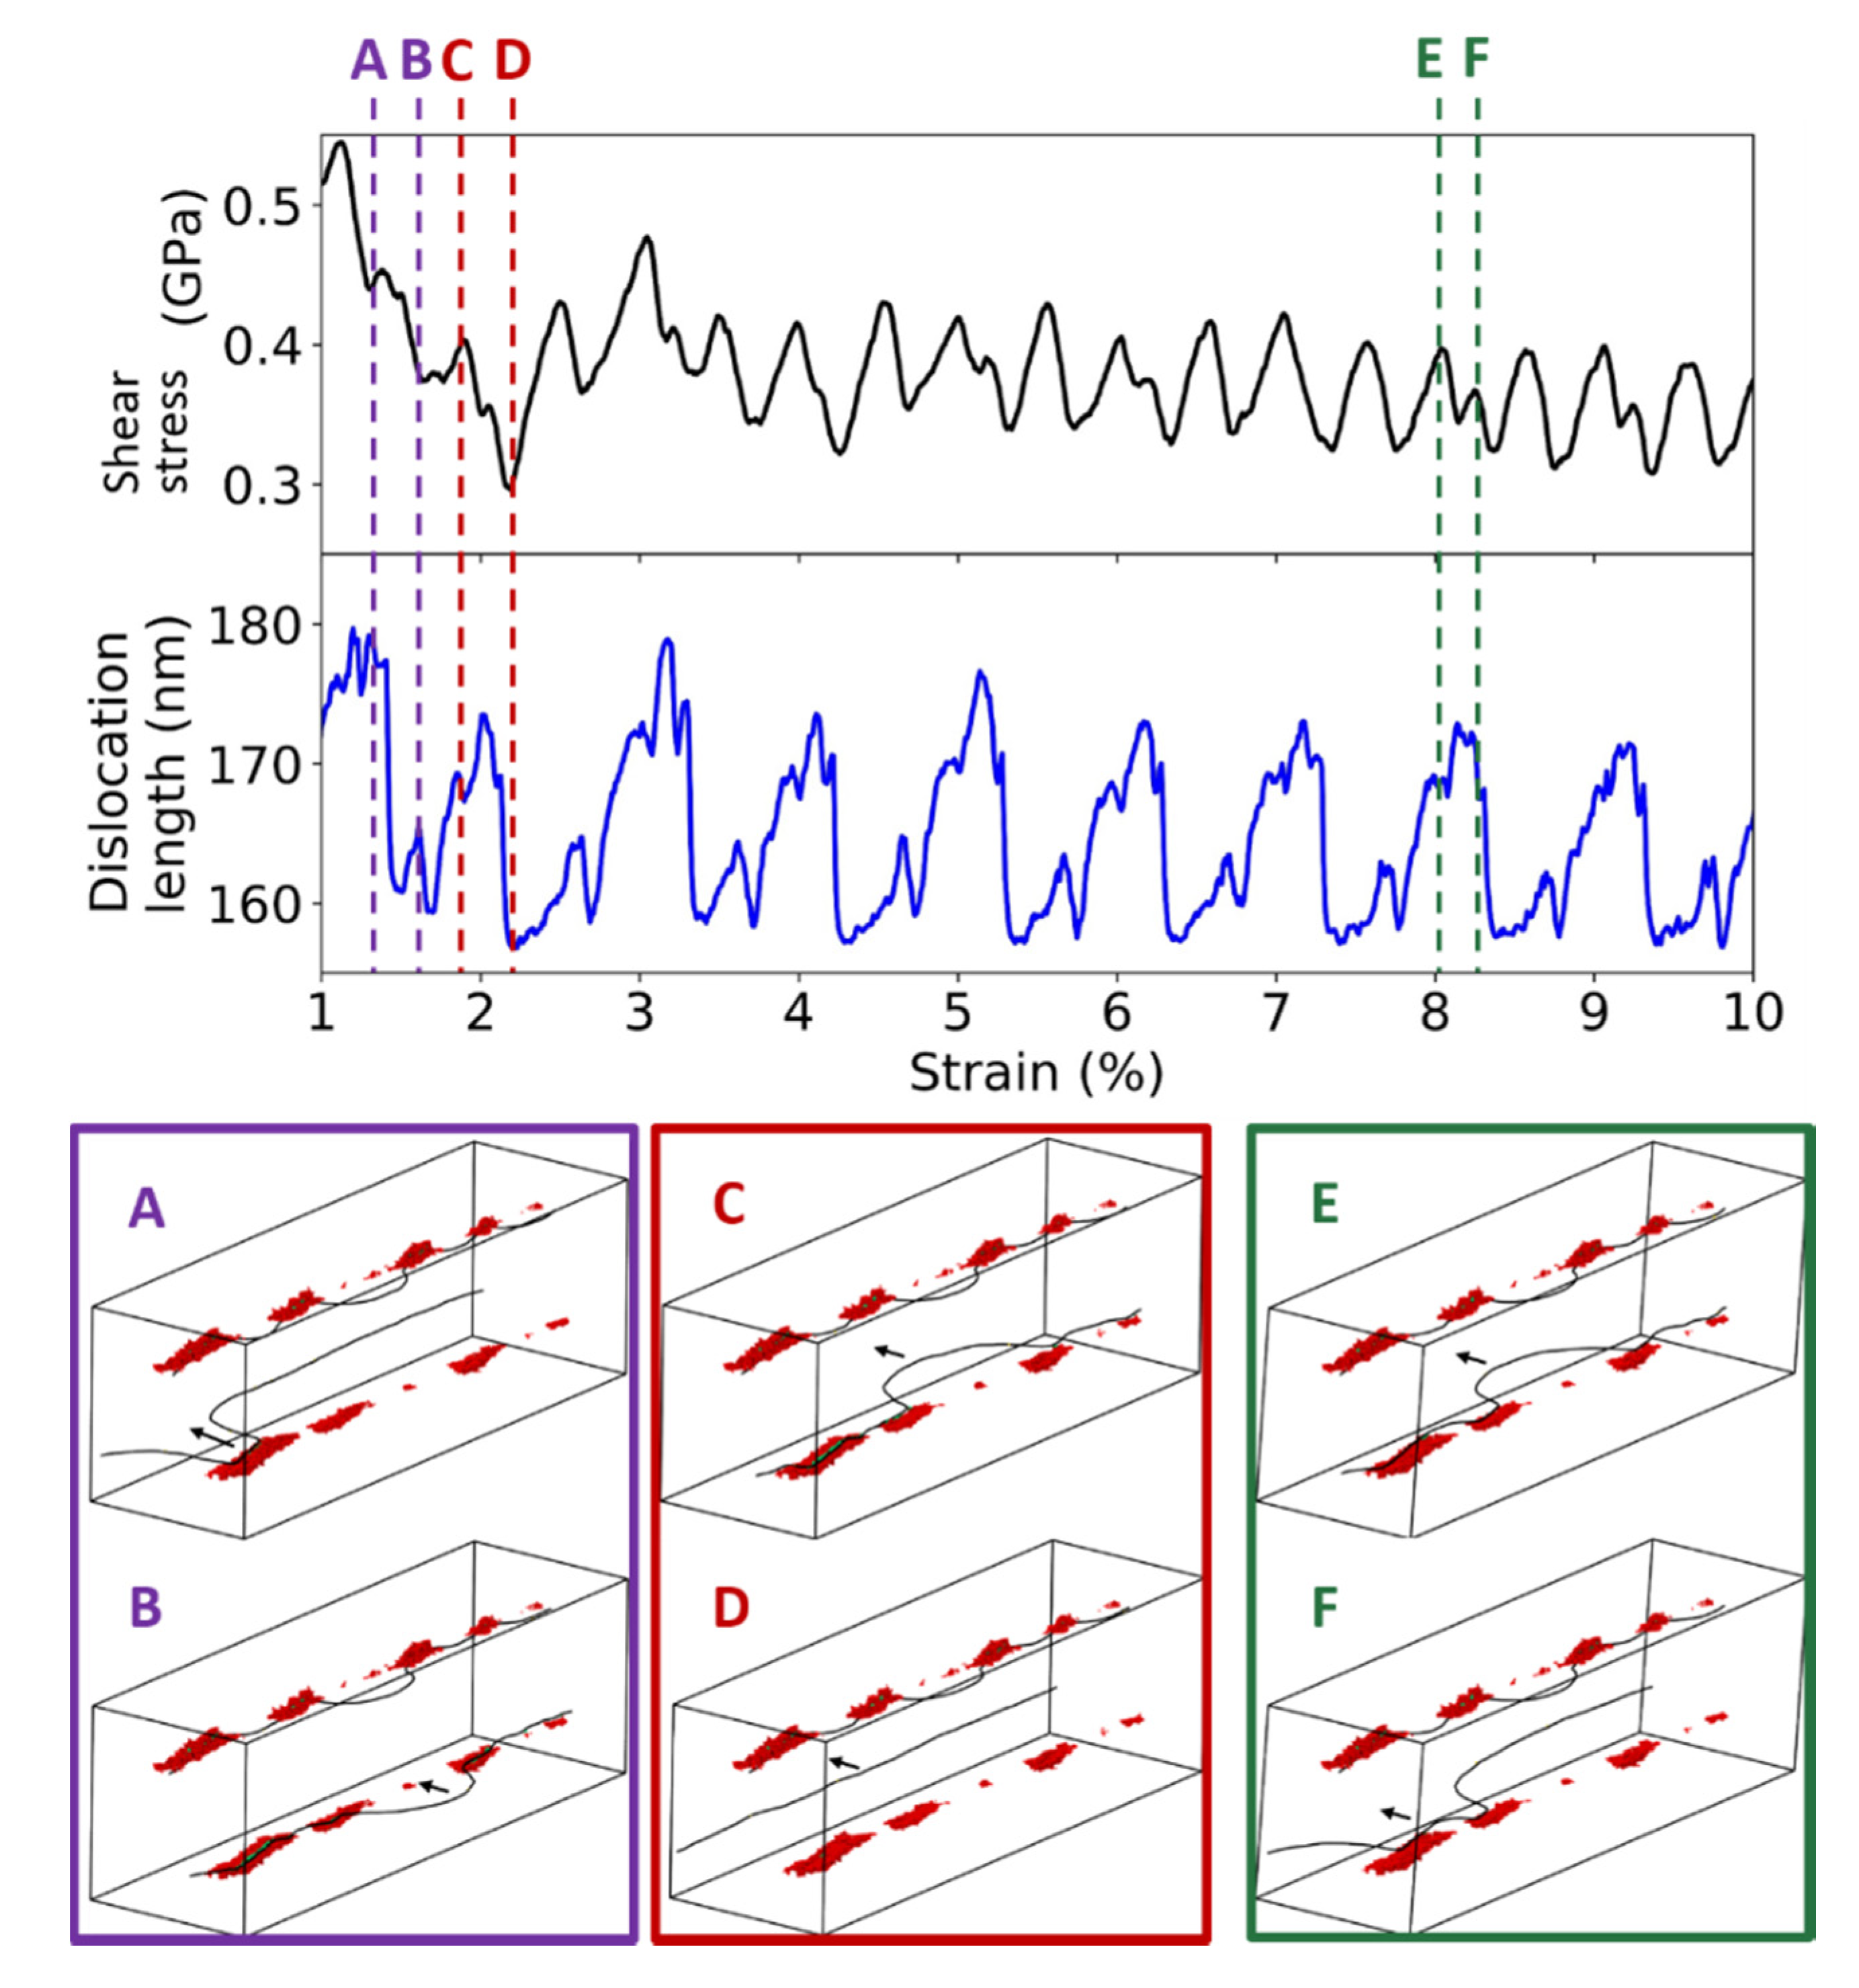
Since periodic boundary conditions are used here, the dislocation exits the cell after it breaks away from the linear complexion and then re-enters on the other side, where it eventually interacts with the complexion again. Therefore, subsequent dislocation-complexions can be observed by continuing the simulation and investigating the flow events at larger strains. A detailed look at multiple flow events is shown in
Figure 5 for one of the linear complexion samples. In addition to the stress-strain curve shown in black, measurements of the dislocation length at any given time are also extracted and presented as the blue curve. Three separate events are labeled A-B, C-D, and E-F and isolated into separate parts of the figure. Similar to the initial yield event in
Figure 4, only one dislocation (bottom) is moving while the other (top) remains pinned by the nanoscale precipitates.
Figure 5 shows that there are cyclic undulations in the shear stress, which correlate with the observation of repeated bursts in the dislocation density associated with dislocation bowing. Furthermore, the shapes of the dislocation length bursts are extremely similar for each cycle, suggesting that the physical events are similar as well. Snapshots A-B show the final pinned segment of the dislocation, breaking away from a large particle in the complexion array, and then entering from the other side and actually being attracted to the particles, as shown by the fact that the dislocation is pulled closer to the precipitates first in frame B. Snapshots C-D show the first bowing event in a new cycle, which occurs at the location with the largest spacing between particles and is reminiscent of the events presented in
Figure 4c. We do remind the reader that this bowing does occur at lower stresses than the initial yield event, suggesting that something about the complexion has evolved. Finally, snapshots E-F show an intermediate bowing event, neither the first nor the last in a cycle.
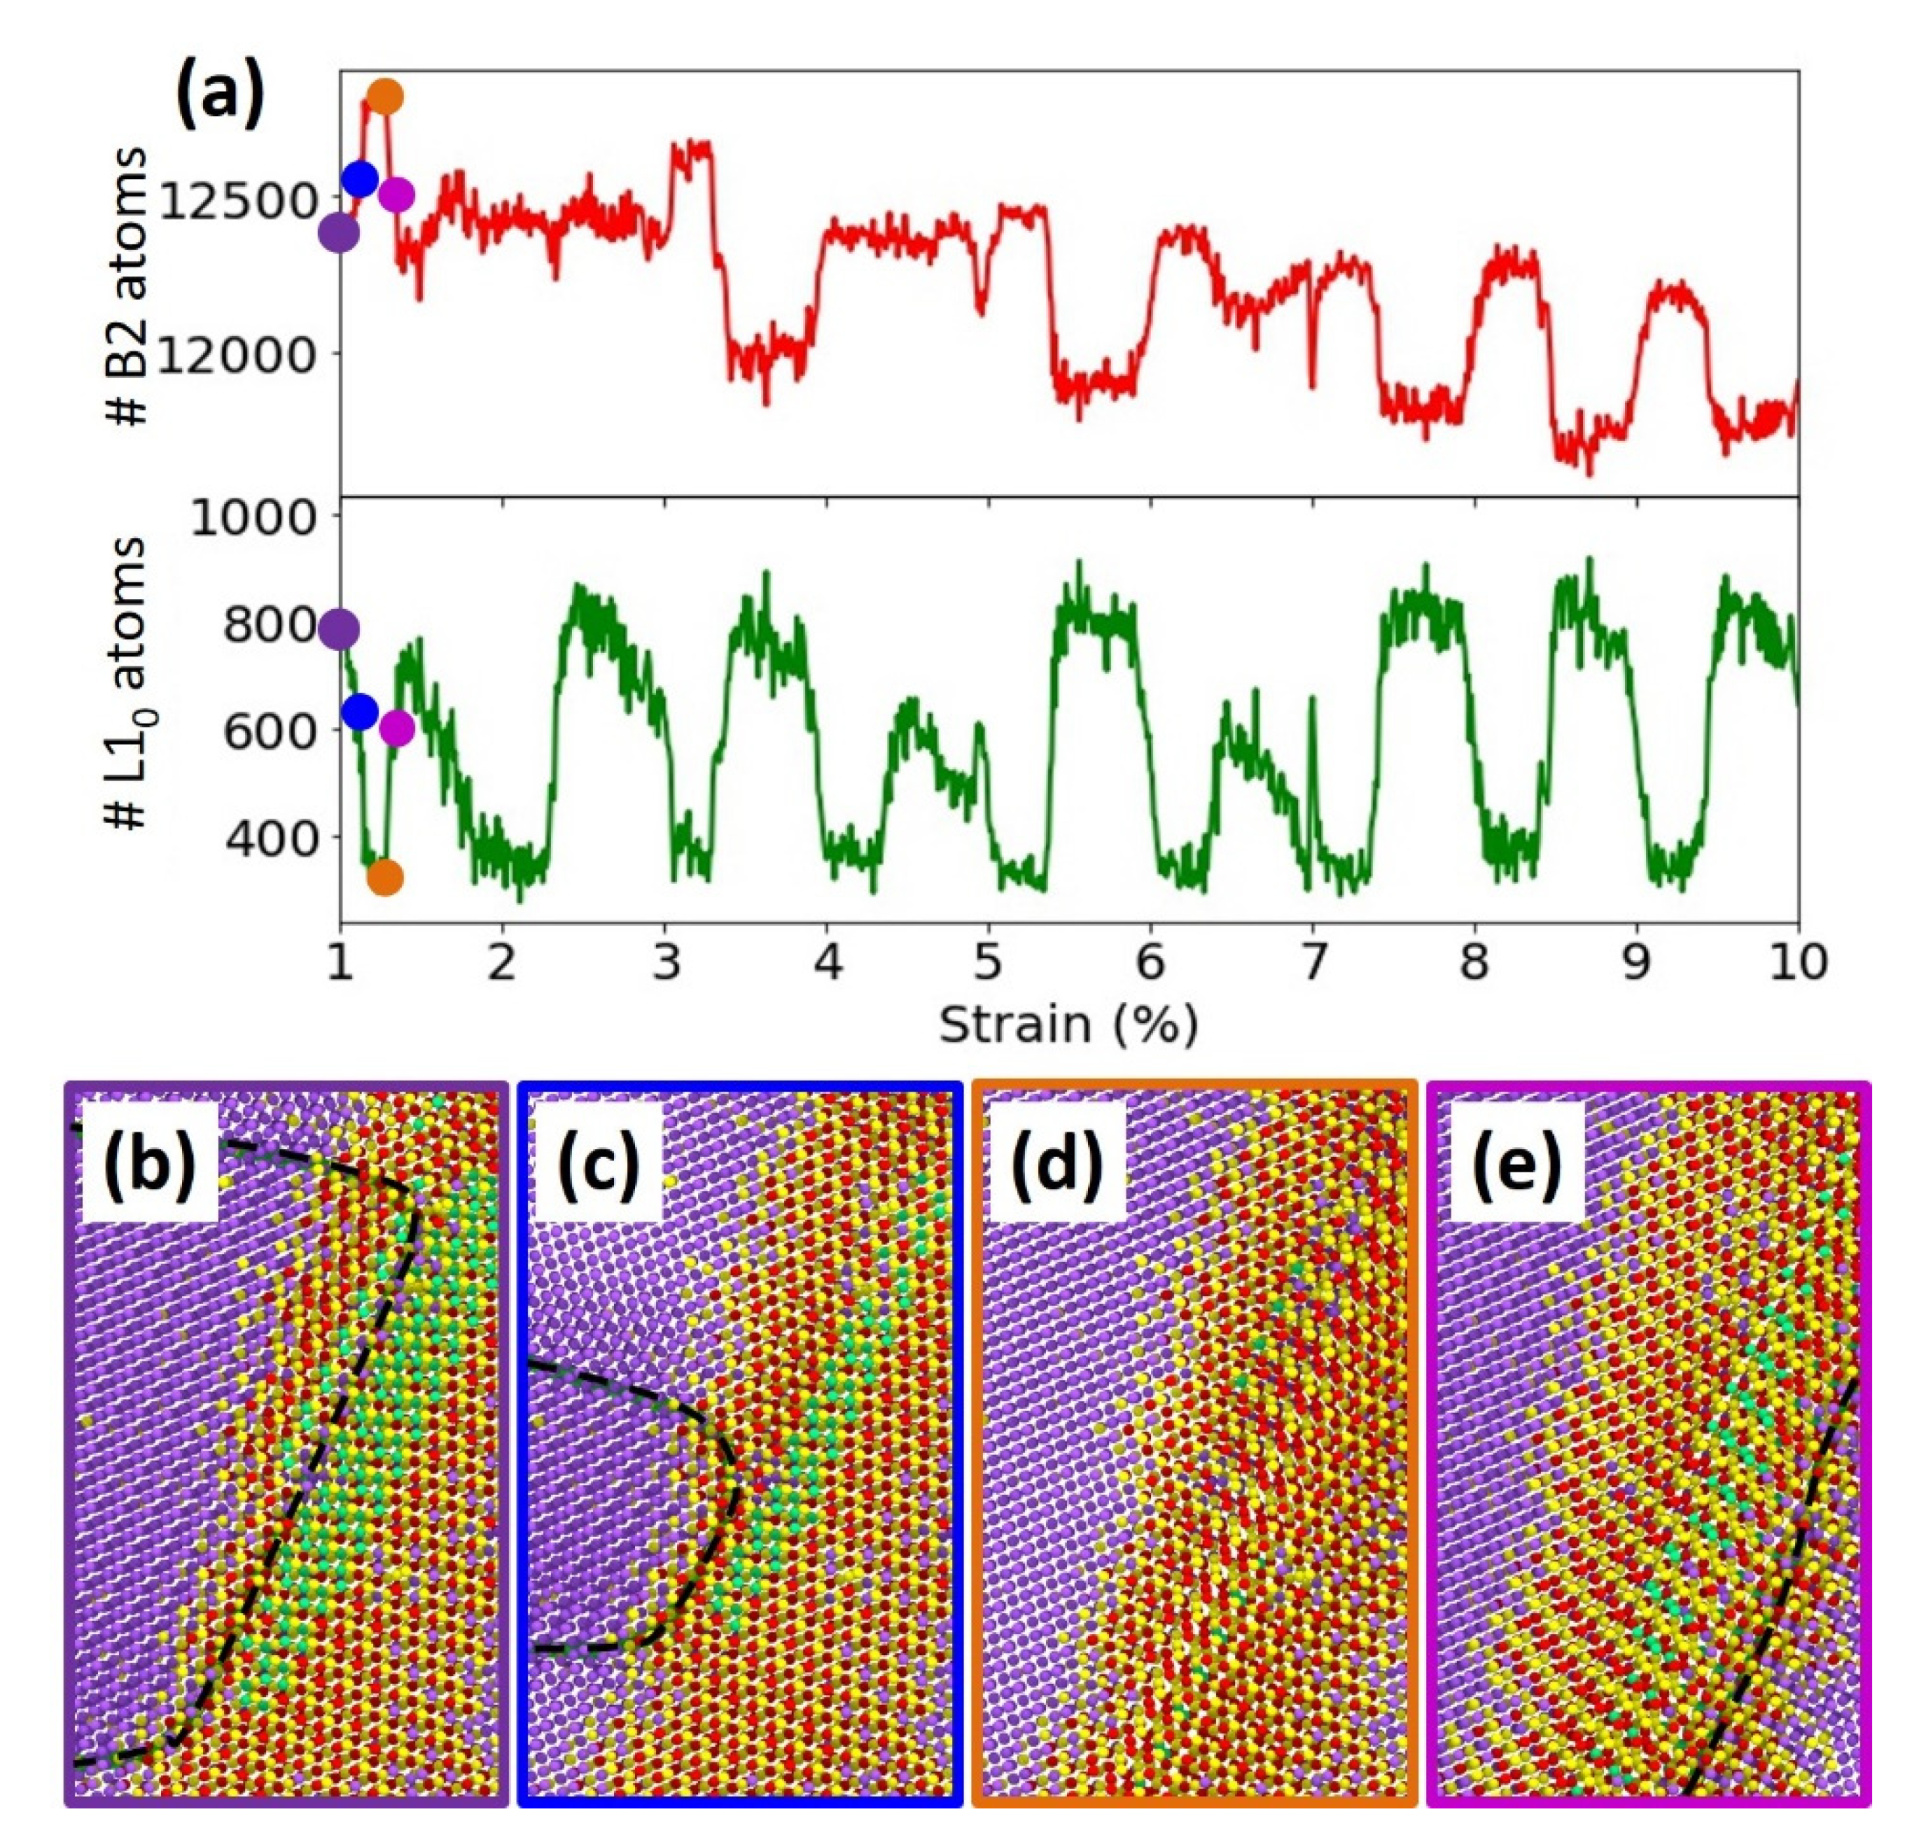
To investigate the complexion structure during the deformation simulation, the number of B2 and L1
0 atoms in the simulation cell were tracked and are shown in
Figure 6a. A cyclic pattern is again observed, suggesting a connection to the repetitive dislocation motion through the cell. Most notable is that reductions in L1
0 atoms are generally aligned with increases in the number of B2 atoms (and vice versa).
Figure 6b–e show atomistic snapshots of important dislocation interactions with a linear complexion particle in an effort to understand this cyclic behavior. In
Figure 6b, the dislocation is still pinned next to the L1
0 precipitate, so the complexion contains the expected L1
0 core and B2 shell. The dislocation started to pull away from the particle in
Figure 6c, and close inspection of the complexion particle shows a reduction in the size of the green L1
0 region. However, the transition to the B2 structure does not happen immediately, as some time is apparently needed, although short, since it is captured on MD time scales.
Figure 6d shows a later time when the dislocation has moved fully away from the particle, and the linear complexion is almost entirely composed of the B2 structure in this frame (a very small number of green L1
0 atoms remain, but the number is dramatically reduced). This observation provides further support for the concept that the two-phase complexion structure is caused by the dislocation’s hydrostatic stress field. When that stress field is no longer present, a diffusion-less and lattice distortive transformation from an FCC-like structure (L1
0) to a BCC-like structure (B2) occurs.
Figure 6e shows that the L1
0 region of the precipitate starts to be recovered as the dislocation, and its stress field, arrives at the other side. We note that, while a cyclic behavior is observed in
Figure 6a, the number of B2 atoms trend downward as the process continues. This could be a sign that the linear complexion particles are becoming smaller in subsequent cycles (or at least during the transitions from the first few cycles to the steady-state cycling), which would provide an explanation for why the initial yield event is more difficult than later dislocation flow.
Figure 6 generally highlights the close connection between the structure of the linear complexion and its interactions with the dislocation. The complexions restrict the dislocation and make it harder to move, while the structure of the complexion relies on the local stress field from the dislocation to find a local equilibrium state. There is, hence, an interdependence of these two defect structures, which truly sets linear complexions apart from traditional obstacles to dislocation motion.
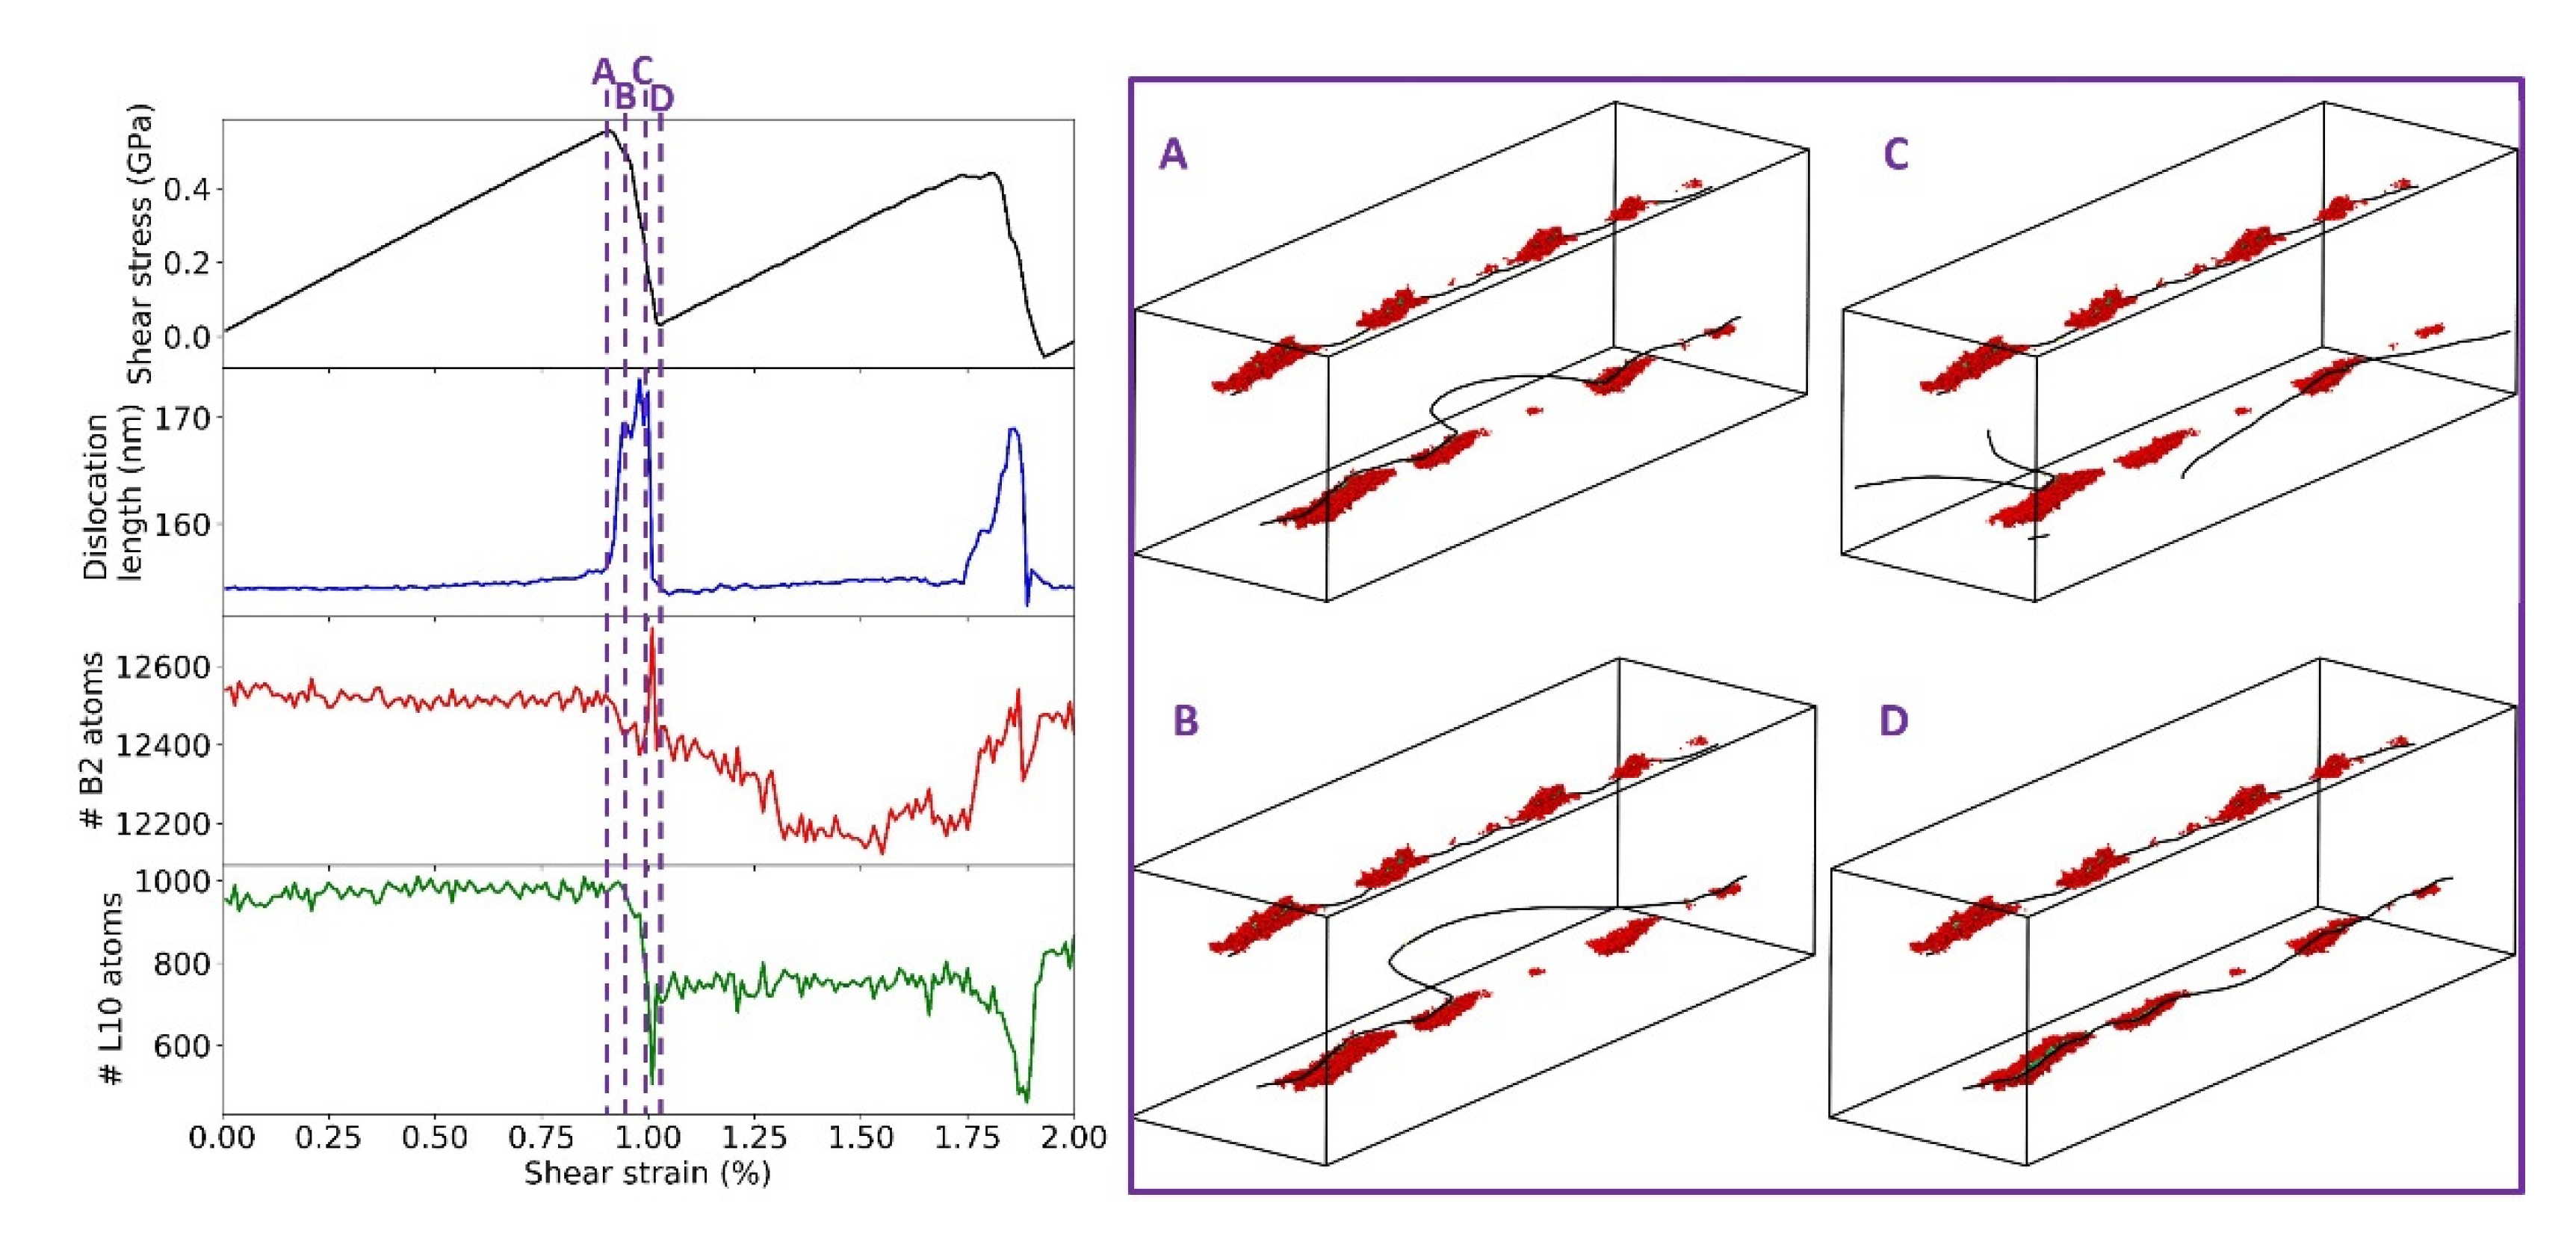
Finally, to show that this local transition within the complexion is not dependent on the deformation rate used here, an additional deformation simulation was run at one order of magnitude slower strain rate (10
7 s
−1). The results of this simulation are presented in
Figure 7, capturing all of the same important features described above. Loading is initially elastic until a high stress is reached, when the dislocation is able to bow out at the region with the largest spacing between linear complexion particles. The dislocation re-enters the simulation cell and becomes pinned, and subsequent dislocation unpinning and motion follows the same mechanism. A reduction of the number of L1
0 atoms in the system and a corresponding increase in the number of B2 atoms is observed each time the dislocation is able to break away. These trends agree with the L1
0-to-B2 lattice distortive transformation shown in
Figure 6.


