Article

Anatomy of Magnetic Anisotropy and Voltage-Controlled Magnetic Anisotropy in Metal Oxide Heterostructure from First Principles

1
Institute of Science and Engineering, Kanazawa University, Kanazawa 920-1192, Japan
2
Department of Physics, Institut Teknologi Sumatera (ITERA), Lampung Selatan 35365, Indonesia
3
Graduate School of Natural Science and Technology, Kanazawa University, Kanazawa 920-1192, Japan
4
School of Computing, Telkom University, Bandung 40257, Indonesia
*
Authors to whom correspondence should be addressed.
Crystals 2020, 10(12), 1118; https://doi.org/10.3390/cryst10121118
Submission received: 30 June 2020 / Revised: 30 November 2020 / Accepted: 2 December 2020 / Published: 8 December 2020
(This article belongs to the Special Issue Magnetism in Low Dimensional Structures)

Abstract

:
Voltage control of magnetic anisotropy (VCMA) is one of the promising approaches for magnetoelectric control of magnetic tunnel junction (MTJ). Here, we systematically calculated the magnetic anisotropy (MA) and the VCMA energies in the well-known MTJ structure consisting of Fe/MgO interface with Cr buffer layer. In this calculation, we investigated an alloying between Fe and Cr and a strain effect. We used a spin density functional approach which includes both contributions from magnetocrystalline anisotropy energy (MCAE) originating from spin–orbit coupling and shape magnetic anisotropy energy from spin dipole–dipole interaction. In the present approach, the MCAE part, in addition to a common scheme of total energy, was evaluated using a grand canonical force theorem scheme. In the latter scheme, atom-resolved and k -resolved analyses for MA and VCMA can be performed. At first, we found that, as the alloying is introduced, the perpendicular MCAE increases by a factor of two. Next, as the strain is introduced, we found that the MCAE increases with increasing compressive strain with the maximum value of 2.2 mJ/m 2 . For the VCMA coefficient, as the compressive strain increases, the sign becomes negative and the absolute value becomes enhanced to the number of 170 fJ/Vm. By using the atom-resolved and k -resolved analyses, we clarified that these enhancements of MCAE and VCMA mainly originates from the Fe interface with MgO (Fe 1 ) and are located at certain lines in the two dimensional Brillouin zone. The findings on MCAE and VCMA are fully explained by the spin-orbit couplings between the certain d-orbital states in the second-order perturbation theory.

1. Introduction

Magnetic random access memory (MRAM) is one type of random access memory, and has some advantages such as relatively fast read/write accessibility and unlimited endurance, compared to the other memories such as static and dynamic access memories and the storages such as NAND (not and)-type flash memory and hard disk drive. In principle, the MRAM uses magnetoresistance effect for reading process. The commercialized MRAM has employed a tunnel magnetoresistance (TMR) effect in a magnetic tunnel junction (MTJ). The MTJ consists of two magnetic metal layers and an insulating layer sandwiched by them. The different configuration of magnetization in the magnetic layers changes the resistance across the insulating layer. The resistance becomes high (low) when the magnetizations of both magnetic layers are in antiparallel (parallel). Assigned to these configurations, the binary information, 0 or 1, is recorded [1,2,3].
The MRAM, at first, employed magnetic fields produced by the current for the writing process. The energy consumption by high threshold current is a problem. One of the memory candidates that overcome this difficulty employs the magnetization control by a direct transfer of spin angular momentum from a spin-polarized current, so-called spin-transfer torque (STT-MRAM). However, the writing current is still too high and it becomes a crucial issue for the high density STT-MRAM [2,4,5,6,7]. Furthermore, spin-orbit torque MRAM (SOT-MRAM) was proposed. The switching of the magnetization is realized based on spin Hall effect [8,9]. Since both the SOT- and STT-MRAMs work based on the flow of charge, the energy loss due to the ohmic dissipation cannot be avoided and becomes a problem in much smaller and more complex devices.
A new route to overcome this problem is to use electric field (EF) instead of the current. The new type of MRAM controlled by EF is called magnetoelectric random access memory (Me-RAM). In the Me-RAM, the EF controlling the magnetization can be generated by a pulse voltage. Therefore, a large amount of unwanted energy consumption due to the ohmic dissipation by the persistent electric-current can be reduced. First observations of the EF-controlled magnetic properties (magnetization saturation and Curie temperature) have been made in a ferromagnetic semiconductor ((In,Mn)As) [10,11]. Later, the voltage control of magnetic anisotropy (VCMA) in a magnetic metal was reported for the first time by Wesheit et al. [12]. The VCMA with a whole solid state structure was soon reported [13], and extended to full MTJ structure [14,15,16,17,18,19].
In the report of Maruyama et al. [13], the mechanism of VCMA was explained by the doping-induced charges. Furthermore, for the 3d/5d-ordered alloy, for example, L 1 0 -FePt, the discussion on the possible origins of VCMA was extended to a modification of electric quadrupole mechanism [20]. Several early theoretical results also proposed possible microscopic origins such as the EF-induced charge density change on the surface of the film [21], the EF-induced change in the band structure (p-orbitals coupled to the d-orbital) [22], and the modification in the electron filling of each 3d orbital by EF, resulting in the accumulated charge at the magnetic layer [23]. Later, other theoretical groups also proposed possible origins that include a modulation of the Rasbha parameter [24,25] and an EF-induced orbital hybridization [26].
The VCMA coefficient (the change of magnetic anisotropy (MA) energy with respect to the applied EF) is one of the most important parameters in the design of Me-RAM. For example, in order to achieve the perpendicular MA in the range of 1 mJ / m 2 to 2 mJ / m 2 , the required VCMA coefficient must be in the range of 1000 fJ/Vm to 2000 fJ/Vm. Due to this request, many efforts have been devoted in both experiment and theory. Due to high TMR ratios and large perpendicular MA, the Fe/MgO/Fe and CoFeB/MgO/CoFeB metal oxide heterostructures have become the most used materials to build MTJ devices [27,28,29,30] and large perpendicular MA [31,32,33,34,35,36,37,38,39]. The most effective way to enhance the VCMA coefficient is to engineer the metal/oxide interface by introducing some atomic layer [40,41]. Yet, in the same time, there may be some disadvantages, such as reductions in both TMR ratio and perpendicular MA, due to structural atomic-scale breakes at the interface between metal and oxide layers. Another choice is to use alloying effect [42], underlayer effect [43,44], or strain effect [45,46]. For example, in the case of alloying effect, Kozioł-Rachwał et al. [47] observed large perpendicular MA and VCMA (370 fJ/Vm for VCMA coefficient) in ultra-thin Fe layer between Cr and MgO. By using the electron energy loss spectroscopy [48] and the conversion electron Mössbauer spectroscopy [47] measurements, they suggested that the possible origin comes from the intermixing of Fe and Cr layers due to annealing treatment. This intermixing may change the edge termination of the Fe layer and at the same time may also introduce strain.
As reviewed in the previous paragraph, the phenomena of large VCMA observed in the Fe/MgO interface with Cr layer are interesting in both magnetism and spintronics application. The system may keep the atomic-scale structure of the interface. In the application, it is important to uncover the mechanism of the enhancement of the VCMA coefficient preserving the high perpendicular MA. However, there is no systematic analysis from the first-principles calculation to explain the mechanism. It may be useful to provide results of the magnetic MA and VCMA from a systematic calculation on the effects of alloying and strain.
In this work, we performed a theoretical study of magnetic anisotropy and voltage-controlled magnetic anisotropy based on spin density functional theory for the Fe/MgO interface with Cr buffer layer. In the calculation of MA energy, we included both magnetocrystalline anisotropy energy (MCAE) and shape magnetic anisotropy energy (SMAE). This allows us to make a direct comparison with available experimental measurements. To the interface, we introduced two kinds of perturbation, namely alloying and strain. These perturbations can effectively modify the electronic structure and eventually enhance the MA energy and VCMA coefficient. We systematically elucidate the possible origin of such enhancement by connecting the electronic structure near the Fermi level with the atom-resolved or k -resolved contributions.

2. Computational Models and Methods

We investigated electronic structures in the metal oxide heterostructure of Fe/MgO interface with Cr buffer layer by means of the approach based on spin density functional theory (SDFT) [49]. We considered two kinds of heterostructure without and with alloying, called structure-I and structure-II. As shown in Figure 1, the structure-I consists of vacuum (0.79 nm)/Cr (6 ML)/Fe (4 ML)/MgO (5 ML)/vacuum (0.79 nm) (ML: Monolayer), while structure-II consists of vacuum (0.79 nm)/Cr (6 ML)/ Fe (1 ML)/Cr (1 ML)/Fe (3 ML)/MgO (5 ML)/vacuum (0.79 nm).
In the SDFT approach, the total energy of system was evaluated by solving the Kohn-Sham (KS) equation self-consistently with the densities and wavefunctions for electrons. The density for electron is presented by ρ ( r ) = n ( r ) σ 0 + α x , y , z m α ( r ) σ α , where n ( r ) and m α ( r ) are electron and spin densities, respectively, and σ α and σ 0 are Pauli’s spin matrix and unit matrix, respectively. Our SDFT calculation employs fully relativistic and scalar relativistic ultrasoft pseudopotentials (USPPs) [50] and a plane wave basis [51] in the generalized gradient approximation (GGA) for the exchange-correlation energy [52]. With the fully relativistic USPP, one can take into account the spin-orbit coupling (SOC). The energy cut-offs of plane wave basis for the wave function and density are 30 Ryd and 300 Ryd, respectively [53].
In this work, the MA energy (MAE) is defined by the relative energy of [100] magnetization direction (in-plane) with respect to the energy of [001] magnetization direction (perpendicular to the plane). It was evaluated by considering MCAE and SMAE (MAE = MCAE + SMAE). In the evaluation of MCAE, we used two schemes; direct total energy (TE) difference and grand canonical force theorem (GCFT). In the GCFT scheme, the calculation of the KS equation requires two steps. At the first step, a density ρ ( r ) was generated in a self-consistent field calculation without including the SOC (using scalar relativistic USPP). In the second step, we fixed the density ρ ( r ) and performed two calculations including the SOC for the magnetization directions along the in-plane and perpendicular to the plane, respectively. As a result, a set of eigenvalues for nth band and wave vector k ( ε n k ) was obtained and used to evaluate the MCAE. This GCFT scheme enables us to obtain the anisotropy energy of atom-resolved or k -resolved contributions. The details of the GCFT scheme can be found in the previous report [54]. The SMAE was calculated using discrete approach (DA) and spin density approach (SDA). In the SDA approach, we investigated the components from atomic multipole spin-density, such as the quadrupole component [55].
For the structure-II, we calculated the effect of strain ( η ) on the MA energy and VCMA coefficient. We considered the variation of strain in the range of η = −8.0% to 3.8% for the ratio with respect to Fe lattice constant ( a Fe = 2.87Å) ( η = ( a a Fe ) / a Fe ). For each in-plane lattice constant, we optimized the atomic structure using the scalar-relativistic level computation with a 24 × 24 × 1 k -mesh and fixing the atomic coordinates of O(3). We used a 32 × 32 × 1 k -mesh for the MAE calculations. In order to apply an EF, we used the effective screening medium (ESM) method [56], and to estimate the EF inside the MgO layer, the dielectric constant ε r (9.8 for MgO) was used [57].

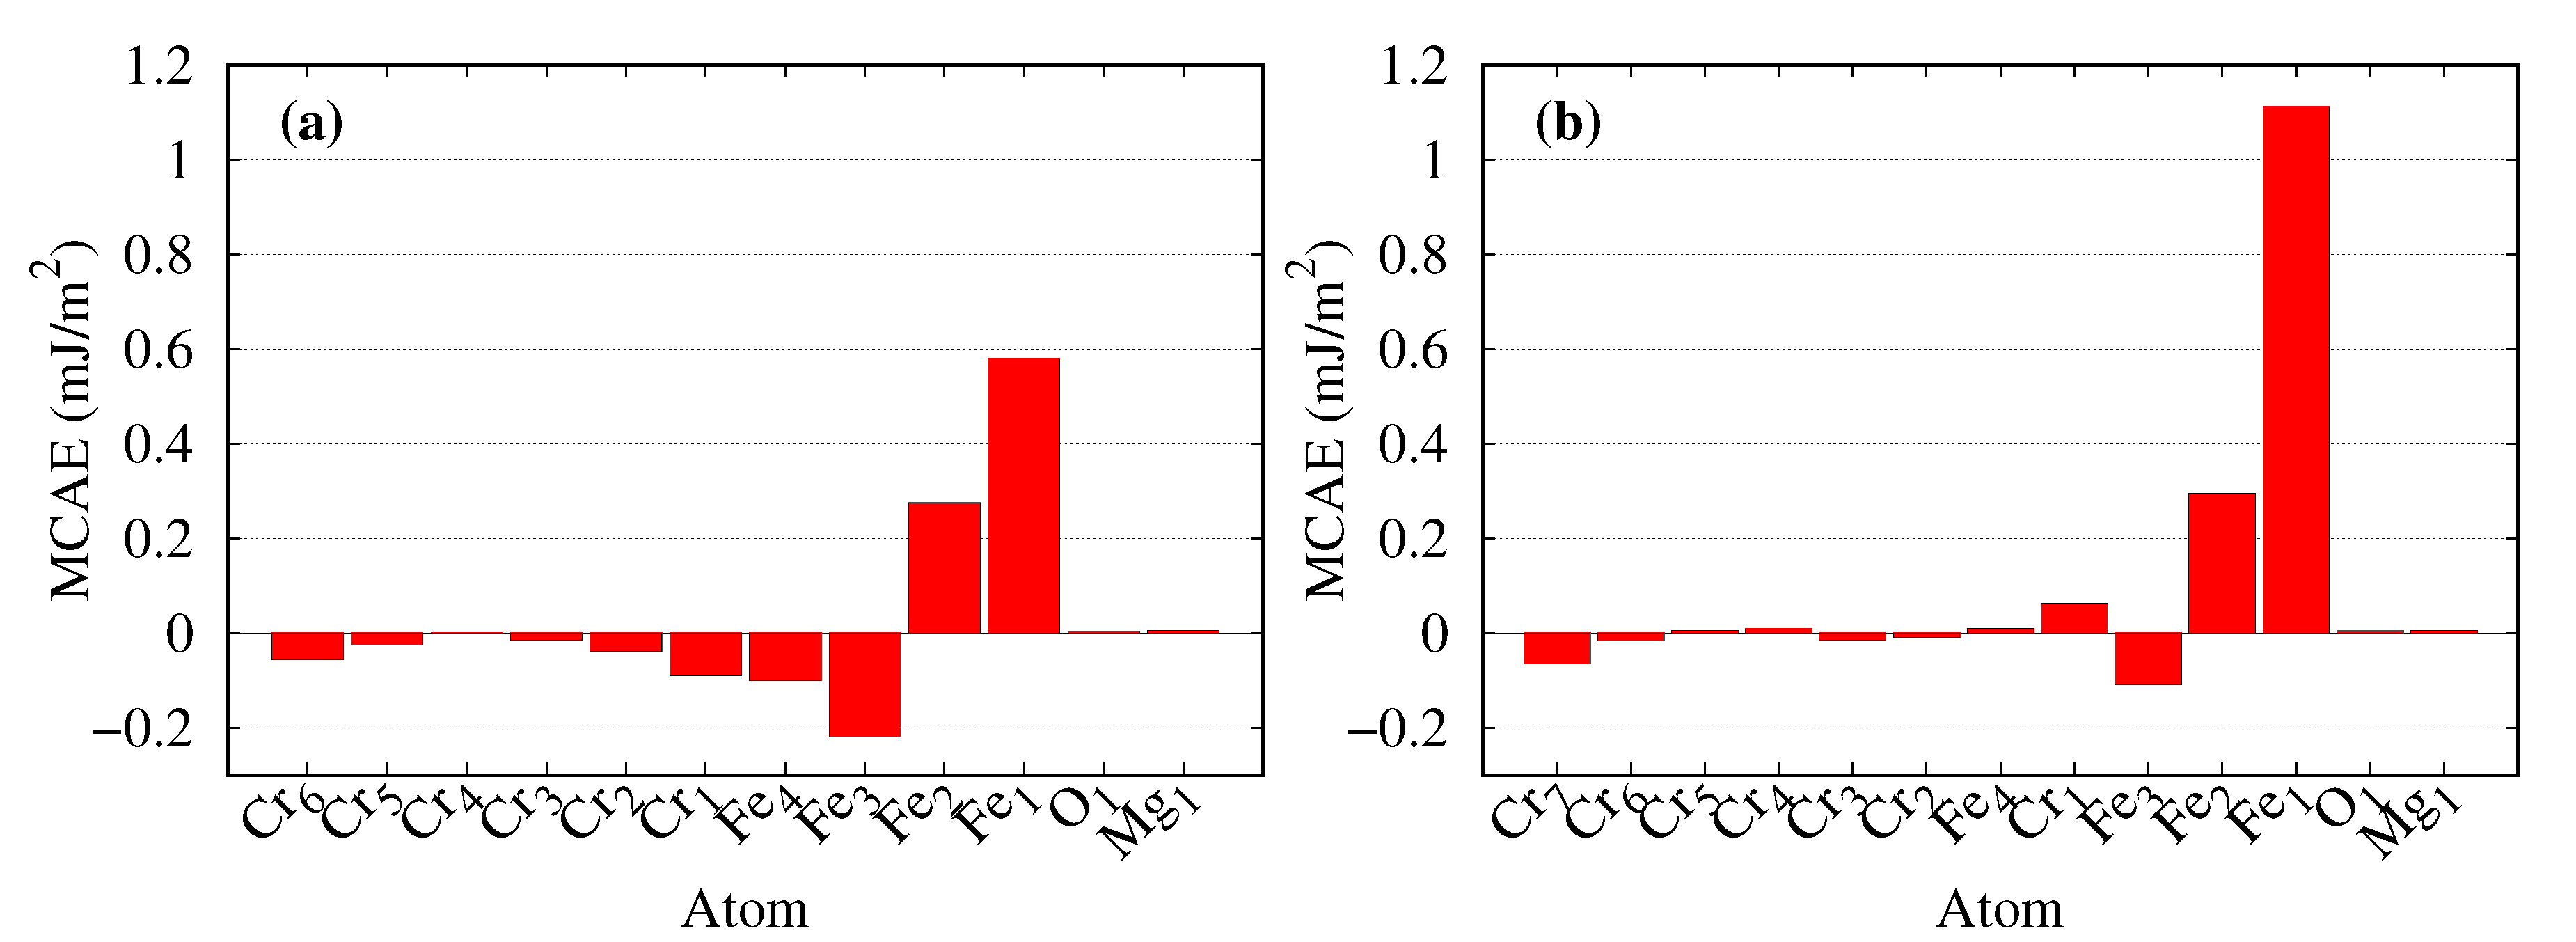
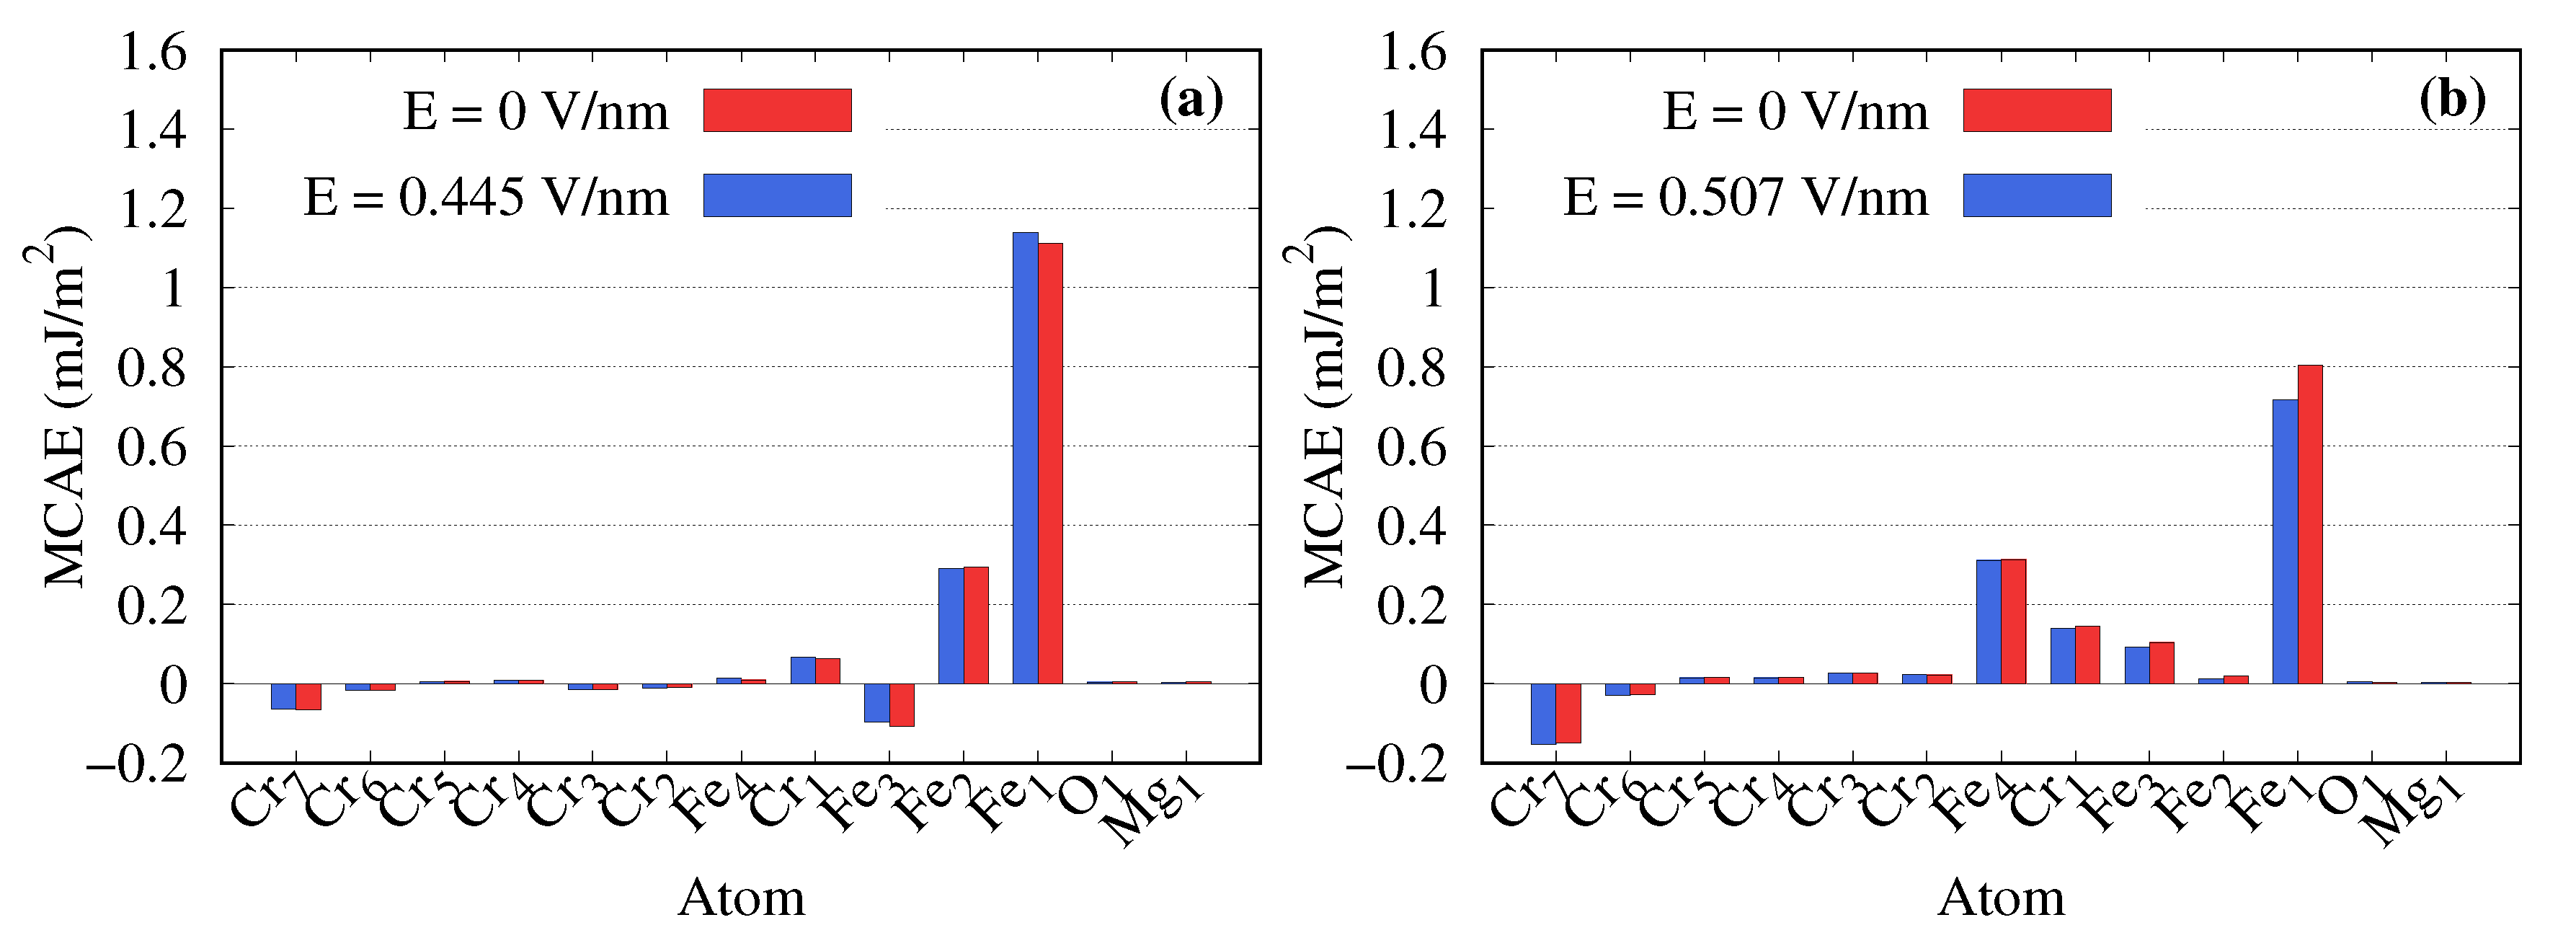
3. Results and Discussion

3.1. Alloying Effect of Magnetic Anisotropy
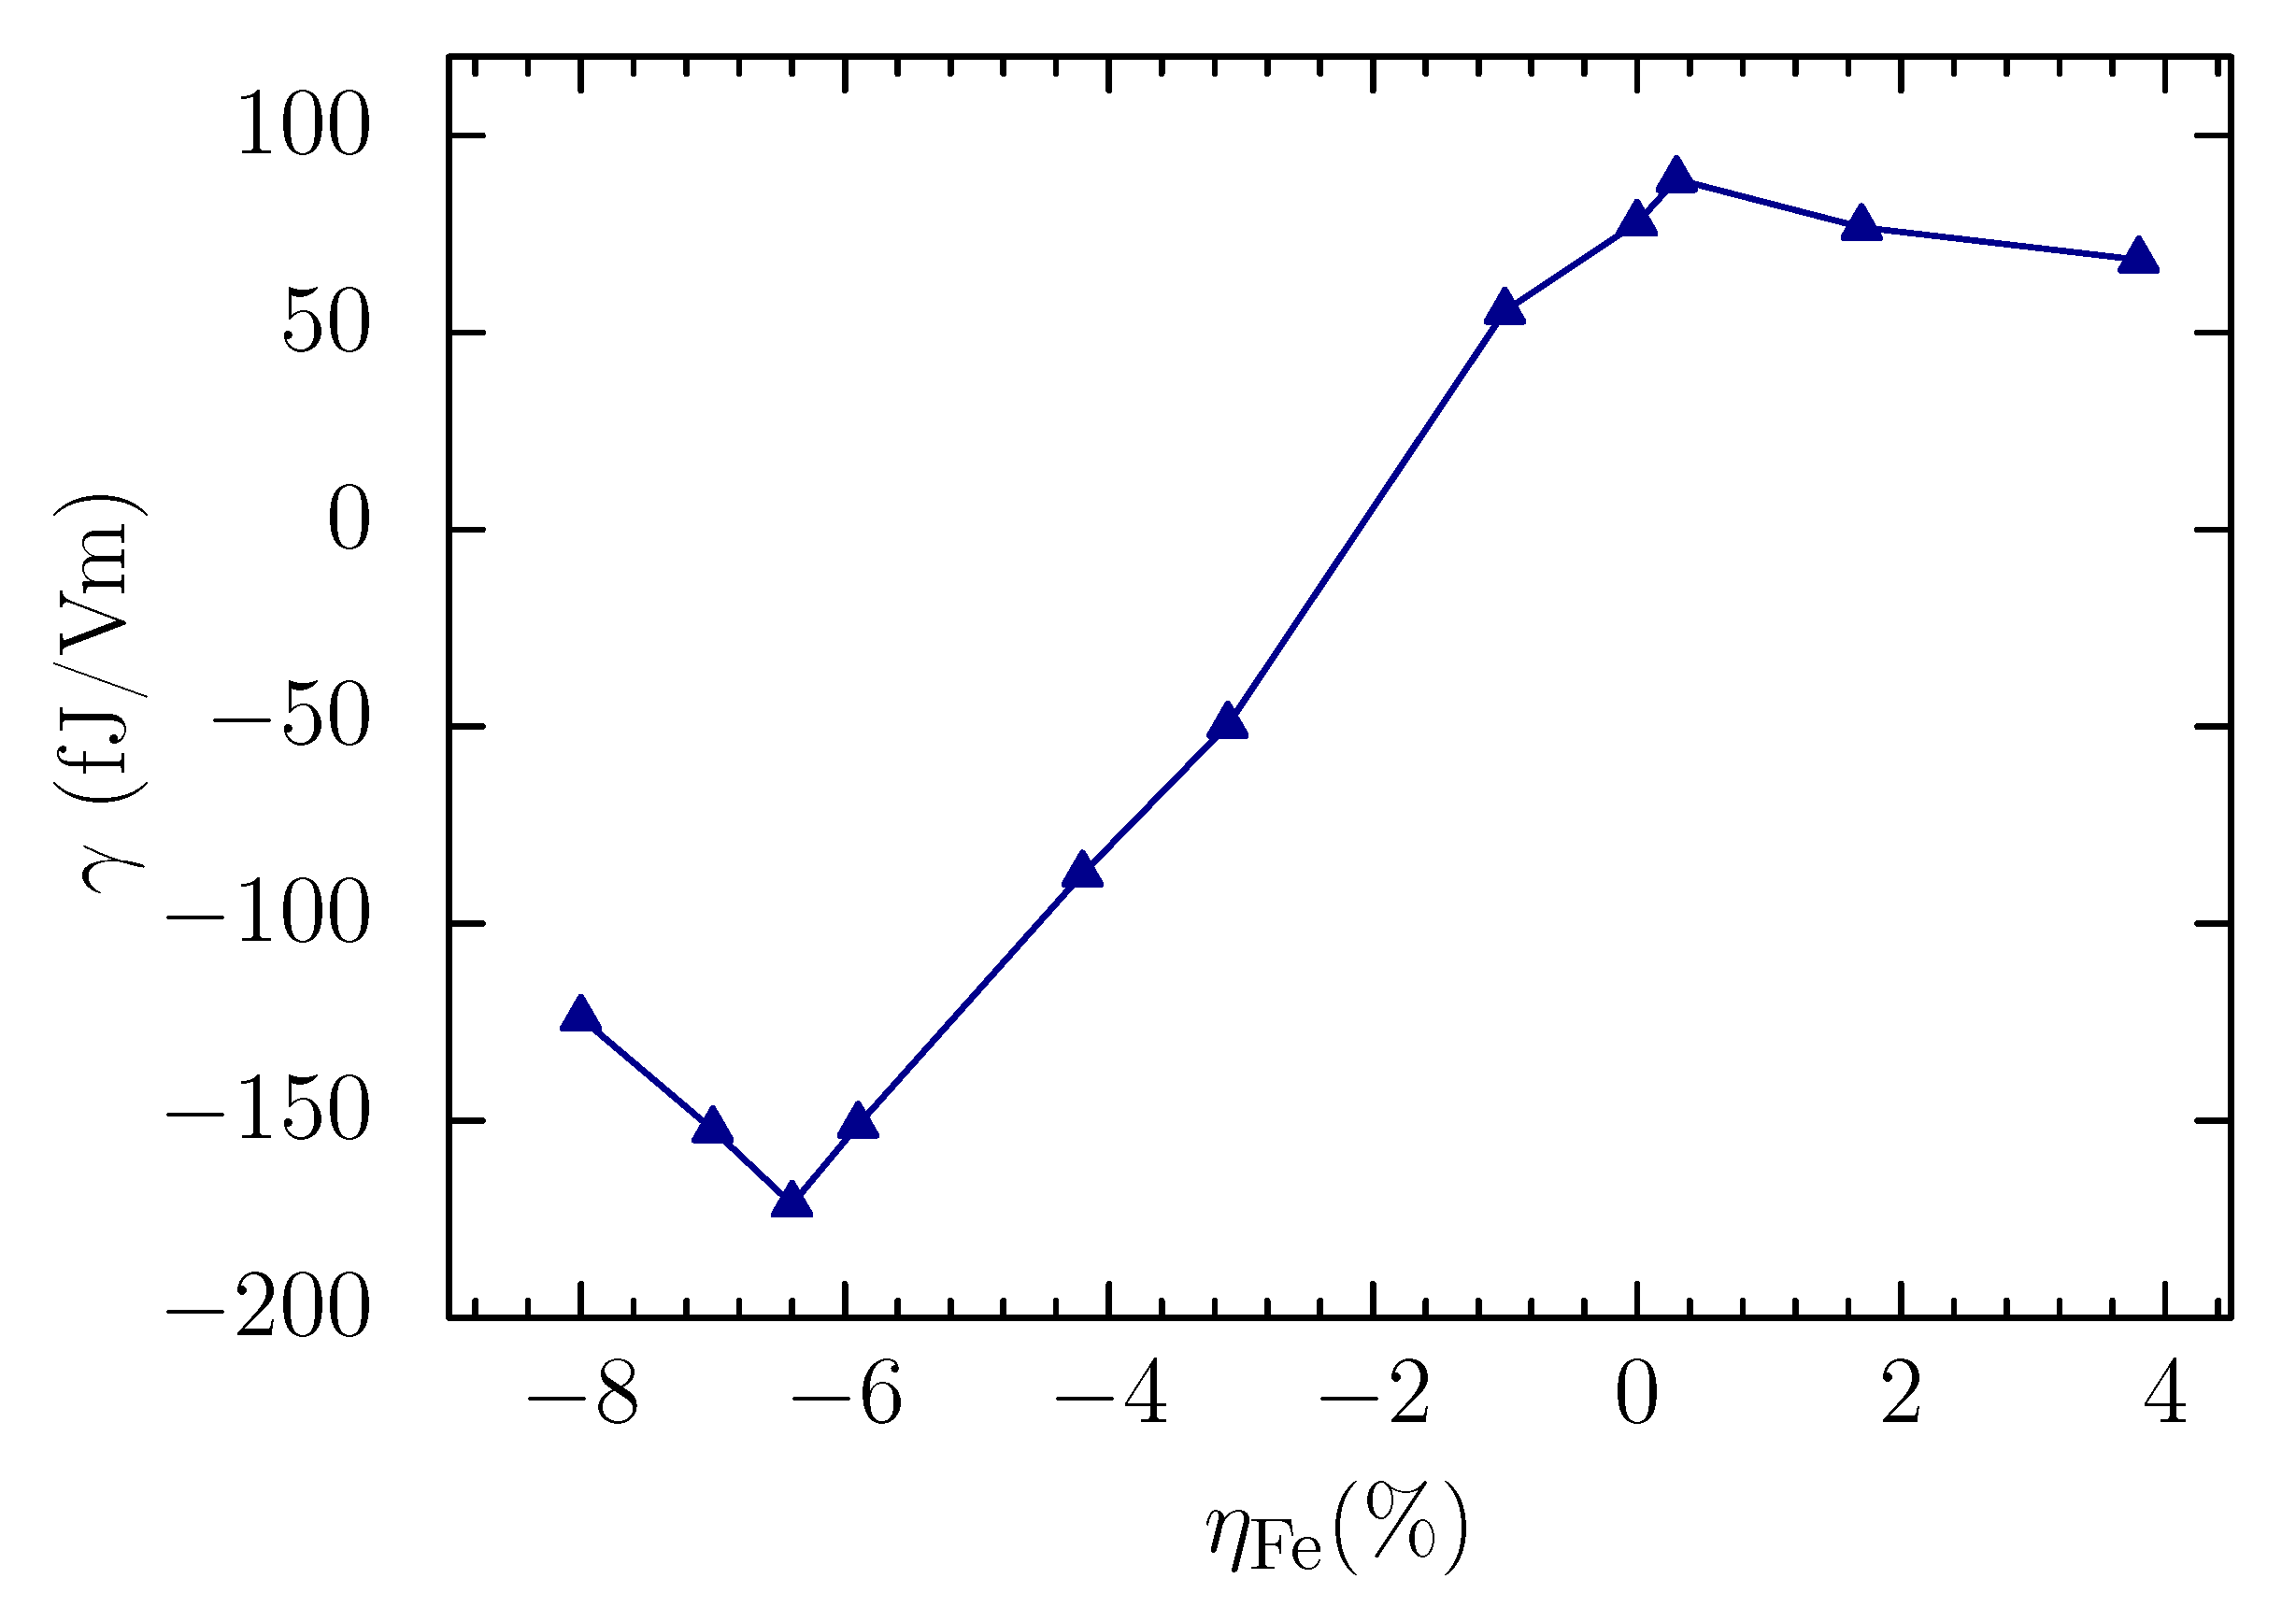
The MAEs for structure-I and structure-II are summarized in Table 1, including the MCAE and SMAE contributions. In both structures, the MCAEs are positive and contribute a perpendicular MA. Interestingly, in structure-II where the alloying of Fe and Cr are introduced, the MCAE increases by a factor of two. The SMAEs are negative and contribute an in-plane MA. In structure-II, the absolute of SMAE becomes smaller due to the alloying effect. The situation that an effective thickness of Fe layer becomes smaller is in accordance with an existence of magnetic dead layer found in the measurement [39]. The absolute of SDA is slightly lower than the absolute of DA. This reduction can be explained from a positive sign of quadrupole component in the atomic spin density. The spin density m α ( r ) is projected to a set of radial spin densities, as follows: [55]
μ I l m α ( r I ) = Y l m * ( r ^ I ) m α ( r ) d r ^ I ,
where r I = | r R I | is the distance from the Ith atomic site R I , r ^ I specifies the angular variable of r I = r R I , and Y l m ( r ^ I ) is the spherical harmonic function. Figure 2 shows the radial spin densities μ I l m α ( r I ) for the spherical component (l = 0, m = 0) and the quadrupole component (l = 2, m = 0) on each Fe atoms. All the other components are negligible. A negative sign indicates an oblate ellipsoid of spin density distribution while a positive sign indicates a prolate ellipsoid. The oblate (prolate) shape in atomic spin density leads to an increase (decrease) of the in-plane shape magnetic anisotropy [55]. In both Figure 2a,b, the large positive quadrupole component at Fe 1 is observed, giving a slight decrease of SMAE. After combining the MCAE and SMAE, the MAE in structure-I becomes negative, while in structure-II it remains positive. The MAE of structure-II has the same sign as the experimental measurement with similar structure [39]. As a result, the enhancement of MCAE in structure-II plays a crucial role for realizing the perpendicular anisotropy. The reduction in SMAE may also support such anisotropy.
In order to elucidate the possible origin of the enhancement in MCAE, we calculated the atom-resolved and k -resolved MCAEs using the GCFT scheme. The total MCAE agrees well with that obtained by the TE scheme, as shown in Table 1. The atom-resolved MCAEs for structure-I and structure-II are shown in Figure 3a,b, respectively. The positive and negative values indicate the contributions to perpendicular and in-plane MA, respectively. In both structures, Fe 1 and Fe 2 provide the main contribution to their perpendicular MA. This agrees with the previous theoretical investigation [36,58,59]. Furthermore, we can clearly see that the main origin of the enhanced MCAE in structure-II comes from Fe 1 (see Figure 3). This drastic enhancement on the interface atom may be a useful element for a design of magnetic anisotropy. In addition, in structure-I, the Fe atoms inside the layer (Fe 3 and Fe 4 ) contribute to in-plane MA. As a result, the MCAE in structure-I becomes suppressed. We also calculated the orbital-resolved MCAE. Its result shows that the main contribution to the MCAE originates from d-orbital states, as shown in Table 2 and Table 3.
Next, we show the atomic k -resolved MCAE for Fe 1 in structure-I and structure-II by combining the band dispersion curves at the Fermi level in Figure 4. The atomic k -resolved MCAE for the other Fe atoms are presented in Appendix A. On the band dispersion curves, we show only d-orbital states for the minority-spin states, since the majority-spin states are fully occupied and located at the energy lower than −1 eV on Fe 1 component. In the contour maps, the energy ranges from blue to red indicate the negative to positive contributions to the MCAE. From both of Figure 4b,d, we notice that the origin of the enhancement mentioned above originates from the enhancement of positive contribution and the reduction of negative contribution located at certain regions in the two-dimensional Brillouin zone (2DBZ).
In order to understand the mechanism/origin of positive and negative contributions in the k -resolved MCAE, we use a second-order perturbation theory. The formula can be written as [60]
MCAE I ξ I 2 k , o , u | φ o k 0 | L I z | φ u k 0 | 2 | φ o k 0 | L I x | φ u k 0 | 2 ε u k 0 ε o k 0 ,
where φ o k 0 and φ u k 0 represent the occupied and unoccupied minority-spin state and ε u k 0 and ε o k 0 indicate the corresponding energy, respectively. L I z , L I x are the atomic angular momentum operators and ξ I is the SOC constant. Here, we consider only the coupling between d-orbital minority-spin states, since the majority-spin 3 d -orbital states are fully occupied and are located far from the Fermi level.
From Equation (2), the MCAE is strongly related to the states near the Fermi level. the MCAE becomes large when the difference between the energies of occupied and unoccupied states is small. Another important property from Equation (2) is the angular momentum matrix element between d-orbital states. For examples, the couplings between ( d x z , d y z ) and ( d x 2 y 2 , d x y ) through L I z provide the positive energies of e and 4 e ( e > 0 ) , respectively, to the MCAE, when assuming the same pair of atomic radial wavefunctions for the given pair of ε u k 0 and ε o k 0 . In these couplings, the latter is larger by 4 than the former. Similary, the couplings between ( d 3 z 2 r 2 , d y z ), ( d x y , d x z ), and ( d x 2 y 2 , d y z ) through L I x provide the negative enegies of −3e, e , and e , respectively [60].
Based on the discussion above, for the structure-I, we conclude that there are three main positive contributions labeled by 1, 2, and 3 in the contour map (see Figure 4b), while one negative contribution labeled by 4. By connecting with the detail of electronic structures in structure-I, as shown in Figure 4a, we notice that the label 1 (the positive contribution) is addressed to the SOCs of o ( u ) , x z | L I z | u ( o ) , y z , the label 2 is addressed to the SOCs of o , y z | L I z | u , x z , and the label 3 is addressed to the SOCs of o , x y | L I z | u , x 2 y 2 . On the other hand, the negative contribution, namely, the label 4 is addressed to the SOCs of o ( u ) , 3 z 2 r 2 | L I x | u ( o ) , y z .
By introducing the alloying of Fe and Cr (for structure-I), there are some significant changes in band dispersion curves, as shown in Figure 4c. In Figure 4c, some of d-orbital states become splitted and shifted to the lower energy. For examples, it is clearly observed at Γ ¯ and X ¯ points. As a result, in structure-II, the positive contribution becomes enhanced and slightly shifted from Γ ¯ point at region 1 and 2 in the contour map (see Figure 4c). We checked carefully the electronic structure and identified that the label 1 belongs to the SOCs of o , x y | L I z | u , x 2 y 2 and label 2 belongs to the SOCs of o , y z | L I z | u , x z and o , x y | L I z | u , x 2 y 2 . In addition, for the reduction of negative contribution the label 4 is caused by the shift of the states d 3 z 2 r 2 and d y z . As a result, the denominator in Equation (2) becomes larger, and hence the negative contribution to the MCAE becomes reduced.

3.2. Strain Effect

We performed the calculations of VCMA for structure-II, as the strain dependence in the range of −8% to 3.8%. The SMAE was found not to contribute to the VCMA because the change of magnetization by EF does not appear. Thus, we considered the contribution of MCAE only. The results for the MCAE is shown in Figure 5. The MCAEs from the TE and GCFT schemes are in good agreement. The results show that by increasing tensile strain (increase in lattice constant), the MCAE decreases, while increasing compressive strain (decrease in lattice constant), the MCAE increases with the maximum value of 2.2 mJ/m 2 . This value is increased by a factor of two, compared to the zero strain.
To clarify the mechanism of the enhancement of MCAE by compressive strain, we calculated the k -resolved MCAE as the strain dependence, as shown in Figure 6. The atomic k -resolved MCAE is presented in Appendix B for one strain value as a reference. From the sequence of k -resolved MCAE, we can see that there are three main changes of MCAE. These are at Γ ¯ point, Y ¯ point, and along the X ¯ - Y ¯ line. Furthermore, the atomic k -resolved MCAE shows that the enhancement at X ¯ - Y ¯ line originating from Fe 1 , while the enhancement at Γ ¯ point and Y ¯ point originating from the Fe atoms inside the layer (Fe 2 , Fe 3 , and Fe 4 ) (see Figure A2 in Appendix B).
In order to explain such enhancement, especially at X ¯ - Y ¯ line, we show the band dispersion curves as the strain dependence with the orbital angular components of Fe 1 in Figure 7. From Figure 7a–c, we found that the most significant orbital reconstruction appears at X ¯ - Y ¯ line. Initially, at η Fe = 3.8% [Figure 7a], the states of d x y , d x 2 y 2 , d y z , and d x z are unoccupied at 0.2 eV. By increasing the compressive strain, the states of d x 2 y 2 , d y z , and d x z are gradually shifted down [Figure 7b], and finally become occupied at −0.1 eV [Figure 7c]. Based on Equation (2), due to this orbital reconstruction, the SOCs of u , x y | L I z | o , x 2 y 2 and o ( u ) , y z | L I z | u ( o ) , x z increase. As a result, the MCAE is enhanced.
Next, we show the result of the VCMA coefficient ( γ ) for structure-II as the strain dependence. The γ was calculated as follows. At first, the magnitude of EF is estimated from the slope of the electrostatic potential at the front of ESM, as seen in Figure 8a. The effective EF in the MgO layer (E) was determined by dividing the above EF with the dielectric constant ( ε r = 9.8). As an example, Figure 8b shows the MCAE as a function of EF for η Fe = −5.9%. The VCMA coefficient was eventually assigned from the slope under the positive EF. The summary of γ is shown as the strain dependence in Figure 9. From this result, we can see that at zero strain the sign of γ is positive. By increasing the compressive strain larger than 2%, the sign becomes negative and the absolute value is enhanced to the number of 170 fJ/Vm. To analyze γ , we calculated the atom-resolved MCAE at zero EF and a finite EF. Figure 10a,b are the results for η Fe = 0.3% and η Fe = −5.9%, respectively. It is clear that the main change of MCAE induced by EF appears at the interface Fe (Fe 1 ). This is due to the screening effect of the metal layer and this result agrees with the previous theoretical reports [21,23,61].
Figure 11a–c are the difference between the atomic k -resolved MCAEs of Fe 1 for η Fe = 0.3%, and Figure 11d–f for η Fe = −5.9% at some positive and negative EFs. From Figure 11, we can see that the EF induces MCAE only in certain regions in 2DBZ. In the case of η Fe = 0.3%, positive EF increases the MCAE, while negative EF decreases the MCAE. The reduction and increase in MCAE are located at (4/8) M ¯ X ¯ -line. The origin of such change can be explained as follows. In zero EF, there is a large negative contribution as mentioned in the previous discussion (see Figure 6) due to the SOCs of o ( u ) , 3 z 2 r 2 | L I x | u ( o ) , y z . By applying a positive EF, corresponding to the reduction of the number of electrons, the Fermi level shifts down. As a result, the SOCs of o ( u ) , 3 z 2 r 2 | L I x | u ( o ) , y z (negative contribution to MCAE) decrease and hence the MCAE increases. For the negative EF is vice versa.
On the other hand, in the case of η Fe = −5.9% [see Figure 11d–f], positive EF reduces the MCAE, while negative EF increases the MCAE. Those behaviors located at X ¯ Y ¯ -line were observed and a large γ was obtained. The explanations of such behavior and large γ are as follows. As shown in Figure 7b, at zero EF, d x 2 y 2 and part of d x z and d y z are occupied and form states on the Fermi level. As a positive EF is applied, those states are shifted to higher energy and become unoccupied. This modification may reduce the SOCs of u , x y | L I z | o , x 2 y 2 and u ( o ) , x z | L I z | o ( u ) , y z . Due to this reduction, the MCAE may reduce significantly. For the negative EF is vice versa.
We confirmed the change of occupation number from the partial density of states (PDOS) under EF. Figure 12 shows the PDOSs of minority-spin states on Fe 1 for η Fe = −5.9% at zero field (shade area), positive EF (solid red line), and negative EF (solid blue line). Under the positive EF, there is a clear change of states near the Fermi level. However, under the negative EF, only a small change is observed. This may be the reason for a small change of MCAE under negative EF. Similar to this work, the enhancements in MCAE and γ were also observed in metal/oxide interfaces as strain effect [45,46].

4. Conclusions

We systematically calculated the MA energy and VCMA coefficient in the Fe/MgO interface with the Cr buffer layer. We introduced two kinds of perturbation, namely, the alloying and strain effects. In the calculation of MA energy, we included both contributions from the MCAE originating from SOC and the SMAE originating from spin dipole-dipole interaction. Using the GCFT scheme, we evaluated the atom- and k -resolved MCAEs. We found the MCAE values from the GCFT scheme are well reproduced by those from the TE scheme. Both structure-I and structure-II showed the perpendicular MCAE. As the alloying is introduced, the MCAE increased by a factor of two. After combining with the SMAE, the MA energy in structure-I becomes negative while in structure-II it remains positive. The latter value has the same sign (perpendicular anisotropy) as the experimental measurement with the same structure. From the atom-resolved data, the enhancement of MCAE mainly originates from the Fe interface with MgO (Fe 1 ). Moreover, the atomic k -resolved MCAE showed that the enhancement is a result of enhancements and reductions at the positive and negative MCAE contributions located at Γ ¯ - Y ¯ and M ¯ - X ¯ lines in 2DBZ, respectively. As the strain is introduced in structure-II, the MCAE increased with increasing the compressive strain and becomes the maximum value of 2.2 mJ/m 2 . For the VCMA coefficients, as the compressive strain increases, the sign changes to negative and the absolute value becomes enhanced to 170 fJ/Vm. The atomic k -resolved VCMA showed that the enhancement appears at the certain region/specific regions in 2DBZ which correspond to a large amount of certain d-orbital states near the Fermi level. We believe that our present results can give shed light on the design of material for Me-RAM.

Author Contributions

Conceptualization, M.O. and T.O.; performed the calculation, I.P., with help by T.K., M.O., D.Y. and N.I.; writing–original draft preparation, I.P.; writing—review and editing, T.O., M.O. and D.Y.; supervision, T.O. All authors have read and agreed to the published version of the manuscript.

Funding

This work was partly supported by Grant-in-Aid for Scientific Research from JSPS/MEXT (Grant No. 18K04923) and partly supported by the ImPACT Program of Council for Science, Technology and Innovation (Cabinet Office, Japan Government).

Acknowledgments

The first-principles calculations were performed using the facilities of the Supercomputer Center, Institute for Solid State Physics, University of Tokyo, Japan. The authors (M.O. and T.O.) acknowledge the support from the Creation of new functional Devices and high-performances Materials to Support next-generation Industries (CDMSI), Japan. The authors (I.P. and N.I.) acknowledge Japanese Government (MEXT) Scholarship in the Program for the Development of Global Human Resources for Kanazawa University.

Conflicts of Interest

The authors declare no conflict of interest.

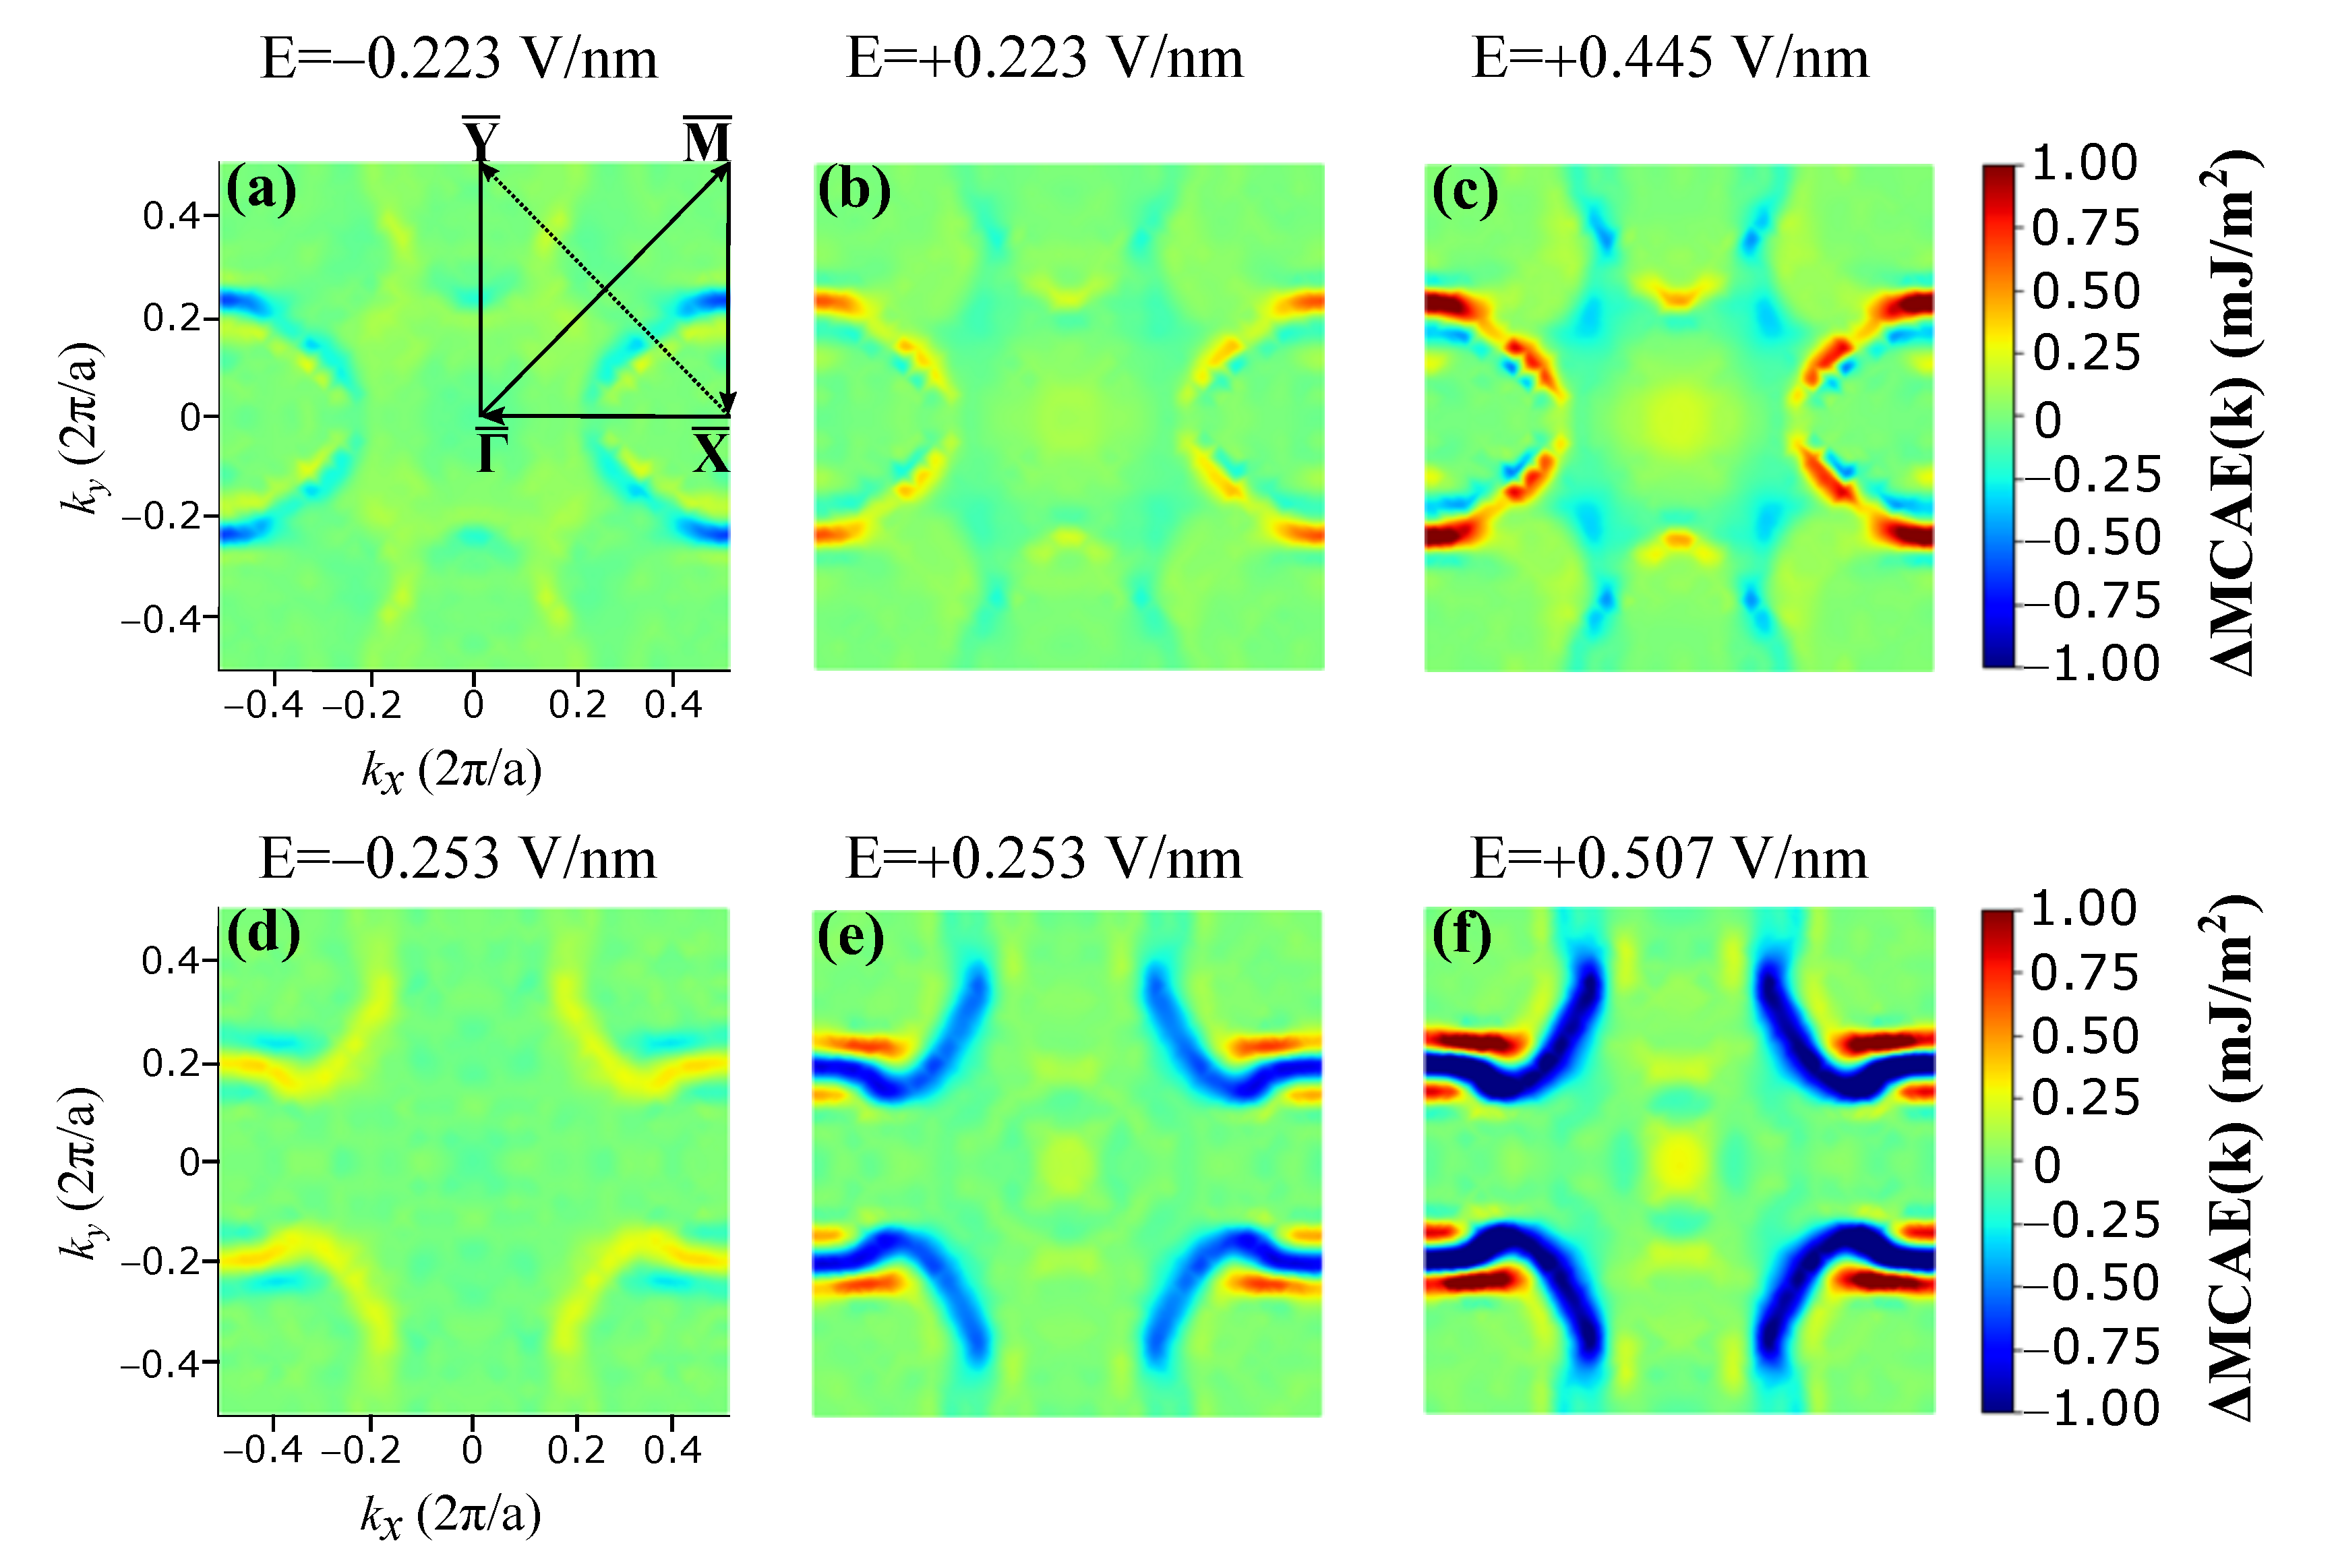
Appendix A. Atomic k-Resolved MCAE of Structure-I

In the GCFT scheme, we calculated the atomic k -resolved MCAE for each Fe atom. The results for structure-I are shown in Figure A1. In the figure, the bare data of no symmetrization and asymmetrized component are also included as well as the symmetrized component discussed in Section 3. The set of eigenvalues determined by the GCFT scheme contains the effect of odd parity in k-space. After summing over the k-space (2DBZ), eventually, such effect does not contribute to MCAE. However, as shown at Fe 1 in Figure A1, the odd parity part (asymmetrized component) is dominant over a wide region of 2DBZ in the bare data. Such contribution may be discussed with the Rashba effect at the atomic layer of Fe 1 and the effective electric field imposed on the layer.
Figure A1. Atomic k-resolved MCAE for structure-I, evaluated with the magnetization directions along [100] and [001]. The 1st, 2nd, and 3rd columns specify the bare data of no symmetrization, symmetrized component, and asymmetrized component, respectively.
Crystals 10 01118 g0a1

Appendix B. Atom k-Resolved MCAE of Structure-II

The results of atomic k -resolved MCAE for the structure-II of η Fe = −5.9% are shown in Figure A2.
Figure A2. Atomic k-resolved MCAE for structure-II with η Fe = −5.9%, evaluated with the magnetization directions along [100] and [001]. The 1st, 2nd, and 3rd columns specify the bare data of no symmetrization, symmetrized component, and asymmetrized component, respectively.
Crystals 10 01118 g0a2

References

  1. Chappert, C.; Fert, A.; Van Dau, F.N. The emergence of spin electronics in data storage. Nat. Mater. 2007, 6, 813–823. [Google Scholar] [CrossRef] [PubMed]
  2. Meena, J.S.; Sze, S.M.; Chand, U.; Tseng, T.Y. Emerging nonvolatile memory technologies, Flash memory technologies. Nanoscale Res. Lett. 2014, 9, 1–33. [Google Scholar] [CrossRef] [PubMed] [Green Version]
  3. Dieny, B.; Chshiev, M. Perpendicular magnetic anisotropy at transition metal/oxide interfaces and applications. Rev. Mod. Phys. 2017, 89, 025008. [Google Scholar] [CrossRef]
  4. Slonczewski, J. Current-driven excitation of magnetic multilayers. J. Magn. Magn. Mater. 1996, 159, L1. [Google Scholar] [CrossRef]
  5. Berger, L. Emission of spin waves by a magnetic multilayer traversed by a current. Phys. Rev. B 1996, 54, 9353. [Google Scholar] [CrossRef] [PubMed] [Green Version]
  6. Mangin, S.; Ravelosona, D.; Katine, J.A.; Carey, M.J.; Terris, B.D.; Fullerton, E.E. Current-induced magnetization reversal in nanopillars with perpendicular anisotropy. Nat. Mater. 2006, 5, 210. [Google Scholar] [CrossRef]
  7. Brataas, A.; Kent, D.; Ohno, H. Current-induced torques in magnetic materials. Nat. Mater. 2012, 11, 372–381. [Google Scholar] [CrossRef]
  8. Fukami, S.; Zhang, C.; Duttagupta, S.; Kurenkov, A.; Ohno, H. Magnetization switching by spin-orbit torque in an antiferromagnet-ferromagnet bilayer system. Nat. Mater. 2016, 15, 535–541. [Google Scholar] [CrossRef]
  9. Fukami, S.; Anekawa, T.; Zhang, C.; Ohno, H. A spin-orbit torque switching scheme with collinear magnetic easy axis and current configuration. Nat. Nanotechnol. 2016, 11, 621–625. [Google Scholar] [CrossRef]
  10. Ohno, H.; Chiba, D.; Matsukura, F.; Omiya, T.; Abe, E.; Dietl, T.; Ohno, Y.; Ohtani, K. Electric-field control of ferromagnetism. Nature 2000, 408, 944–946. [Google Scholar] [CrossRef]
  11. Chiba, D.; Yamanouchi, M.; Matsukura, F.; Ohno, H. Electrical manipulation of magnetization reversal in a ferromagnetic semiconductor. Science 2003, 301, 943–945. [Google Scholar] [CrossRef] [PubMed] [Green Version]
  12. Weisheit, M.; Fähler, S.; Marty, A.; Souche, Y.; Poinsignon, C.; Givord, D. Electric field-induced modification of magnetism in thin-film ferromagnets. Science 2007, 315, 349–351. [Google Scholar] [CrossRef] [PubMed]
  13. Maruyama, T.; Shiota, Y.; Nozaki, T.; Ohta, K.; Toda, N.; Mizuguchi, M.; Tulapurkar, A.A.; Shinjo, T.; Shiraishi, M.; Mizukami, S.; et al. Electric-field control of ferromagnetism. Nat. Nanotechnol. 2009, 4, 158–161. [Google Scholar] [CrossRef] [PubMed]
  14. Nozaki, T.; Shiota, Y.; Shiraishi, M.; Shinjo, T.; Suzuki, Y. Voltage-induced perpendicular magnetic anisotropy change in magnetic tunnel junctions. Appl. Phys. Lett. 2010, 96, 022506. [Google Scholar] [CrossRef]
  15. Shiota, Y.; Murakami, S.; Bonell, F.; Nozaki, T.; Shinjo, T.; Suzuki, Y. Quantitative evaluation of voltage-induced magnetic anisotropy change by magnetoresistance measurement. Appl. Phys. Express 2011, 4, 2–5. [Google Scholar] [CrossRef]
  16. Shiota, Y.; Nozaki, T.; Bonell, F.; Murakami, S.; Shinjo, T.; Suzuki, Y. Induction of coherent magnetization switching in a few atomic layers of FeCo using voltage pulses. Nat. Mater. 2012, 11, 39–43. [Google Scholar] [CrossRef] [PubMed]
  17. Nozaki, T.; Shiota, Y.; Miwa, S.; Murakami, S.; Bonell, F.; Ishibashi, S.; Kubota, H.; Yakushiji, K.; Saruya, T.; Fukushima, A.; et al. Electric-field-induced ferromagnetic resonance excitation in an ultrathin ferromagnetic metal layer. Nat. Phys. 2012, 11, 491–496. [Google Scholar] [CrossRef]
  18. Wang, W.G.; Li, M.; Hageman, S.; Chien, C.L. Electric-field-assisted switching in magnetic tunneljunctions. Nat. Mater. 2012, 11, 64–68. [Google Scholar] [CrossRef] [PubMed]
  19. Kanai, S.; Yamanouchi, M.; Ikeda, S.; Nakatani, Y.; Matsukura, F.; Ohno, H. Electric field-induced magnetization reversal in a perpendicular-anisotropy CoFeB-MgO magnetic tunnel junction. Appl. Phys. Lett. 2012, 101, 2010–2013. [Google Scholar] [CrossRef]
  20. Miwa, S.; Suzuki, M.; Tsujikawa, M.; Matsuda, K.; Nozaki, T.; Tanaka, K.; Tsukahara, T.; Nawaoka, K.; Goto, M.; Kotani, Y.; et al. Voltage controlled interfacial magnetism through platinum orbits. Nat. Commu. 2017, 8, 15848. [Google Scholar] [CrossRef] [Green Version]
  21. Duan, C.; Velev, J.P.; Sabirianov, R.F.; Zhu, Z.; Chu, J.; Jaswal, S.S.; Tsymbal, E.Y. Surface magnetoelectric effect in ferromagnetic metal films. Phys. Rev. Lett. 2008, 101, 137201. [Google Scholar] [CrossRef] [PubMed] [Green Version]
  22. Nakamura, K.; Shimabukuro, R.; Fujiwara, Y.; Akiyama, T.; Ito, T.; Freeman, A.J. Giant modification of the magnetocrystalline anisotropy in transition-metal monolayers by an external electric field. Phys. Rev. Lett. 2009, 102, 187201. [Google Scholar] [CrossRef] [PubMed]
  23. Tsujikawa, M.; Oda, T. Finite electric field effects in the large perpendicular magnetic anisotropy surface Pt/Fe/Pt(001): A first-principles study. Phys. Rev. Lett. 2009, 102, 247203. [Google Scholar] [CrossRef] [PubMed] [Green Version]
  24. Xu, L.; Zhang, S. Electric field control of interface magnetic anisotropy. J. Appl. Phys. J. Appl. Phys. 2012, 111, 2012–2015. [Google Scholar] [CrossRef]
  25. Barnes, S.E.; Ieda, J.; Maekawa, S. Rashba spin-orbit anisotropy and the electric field control of magnetism. Sci. Rep. 2014, 4, 1–5. [Google Scholar] [CrossRef] [Green Version]
  26. Ibrahim, F.; Yang, H.X.; Hallal, A.; Dieny, B.; Chshiev, M. Anatomy of electric field control of perpendicular magnetic anisotropy of Fe/MgO interfaces. Phys. Rev. B 2016, 93, 014429. [Google Scholar] [CrossRef]
  27. Butler, W.H.; Zhang, X.-G.; Schulthess, T.C.; MacLaren, J.M. Spin-dependent tunneling conductance of Fe|MgO|Fe sandwiches. Phys. Rev. B 2001, 63, 054416. [Google Scholar] [CrossRef] [Green Version]
  28. Mathon, J.; Umerski, A. Theory of tunneling magnetoresistance of an epitaxial Fe/MgO/Fe(001) junction. Phys. Rev. B 2001, 63, 220403. [Google Scholar] [CrossRef] [Green Version]
  29. Parkin, S.S.P.; Kaiser, C.; Panchula, A.; Rice, P.M.; Hughes, B.; Samant, M.; Yang, S.H. Giant tunnelling magnetoresistance at room temperature with MgO (100) tunnel barriers. Nat. Mater. 2004, 3, 862–867. [Google Scholar] [CrossRef]
  30. Yuasa, S.; Nagahama, T.; Fukushima, A.; Suzuki, Y.; Ando, K. Giant room-temperature magnetoresistance in single-crystal Fe/MgO/Fe magnetic tunnel junctions. Nat. Mater. 2004, 3, 868–871. [Google Scholar] [CrossRef]
  31. Ikeda, S.; Miura, K.; Yamamoto, H.; Mizunuma, K.; Gan, H.D.; Endo, M.; Kanai, S.; Hayakawa, J.; Matsukura, F.; Ohno, H. A perpendicular-anisotropy CoFeB–MgO magnetic tunnel junction. Nat. Mater. 2010, 9, 721–724. [Google Scholar] [CrossRef] [PubMed]
  32. Koo, J.W.; Mitani, S.; Sasaki, T.T.; Sukegawa, H.; Wen, Z.C.; Ohkubo, T.; Niizeki, T.; Inomata, K.; Hono, K. Large perpendicular magnetic anisotropy at Fe/MgO interface. Appl. Phys. Lett. 2013, 103, 192401. [Google Scholar] [CrossRef]
  33. Xiang, Q.; Wen, Z.; Sukegawa, H.; Kasai, S.; Seki, T.; Kubota, T.; Takanashi, K.; Mitani, S. Nonlinear electric field effect on perpendicular magnetic anisotropy in Fe/MgO interfaces. J. Phys. D Appl. Phys. 2017, 50, 40LT04. [Google Scholar] [CrossRef]
  34. Yang, H.X.; Chshiev, M.; Dieny, B.; Lee, J.H.; Manchon, A.; Shin, K.H. First-principles investigation of the very large perpendicular magnetic anisotropy at Fe|MgO and Co|MgO interfaces. Phys. Rev. B 2011, 84, 054401. [Google Scholar] [CrossRef] [Green Version]
  35. Zhang, J.; Franz, C.; Czerner, M.; Heiliger, C. Perpendicular magnetic anisotropy in CoFe/MgO/CoFe magnetic tunnel junctions by first-principles calculations. Phys. Rev. B 2014, 90, 184409. [Google Scholar] [CrossRef]
  36. Masuda, K.; Miura, Y. Perpendicular magnetic anisotropy at the Fe/MgAl2O4 interface: Comparative first-principles study with Fe/MgO. Phys. Rev. B 2018, 98, 224421. [Google Scholar] [CrossRef] [Green Version]
  37. Ikhsan, N.; Kanagawa, T.; Pardede, I.; Yoshikawa, D.; Obata, M.; Oda, T. Perpendicular and in-plane magnetic anisotropies in Cr-buffered Fe(x)/MgO interface from first-principles approach. Sci. Rep. Kanazawa Univ. 2018, 62, 23–35. [Google Scholar]
  38. Pardede, I.; Kanagawa, K.; Ikhsan, N.; Murata, I.; Yoshikawa, D.; Obata, M.; Oda, T. A comprehensive study of sign change in electric field control perpendicular magnetic anisotropy energy at Fe/MgO Interface: First principles calculation. IEEE Trans. Magn. 2019, 55, 1–4. [Google Scholar] [CrossRef]
  39. Nozaki, T.; Kozioł-Rachwał, A.; Skowroński, W.; Zayets, V.; Shiota, Y.; Tamaru, S.; Kubota, H.; Fukushima, A.; Yuasa, S.; Suzuki, Y. Large voltage-induced changes in the perpendicular magnetic anisotropy of an MgO-based tunnel junction with an ultrathin Fe layer. Phys. Rev. Appl. 2016, 5, 044006. [Google Scholar] [CrossRef] [Green Version]
  40. Suwardy, J.; Nawaoka, K.; Cho, J.; Goto, M.; Suzuki, Y.; Miwa, S. Voltage-controlled magnetic anisotropy and voltage-induced Dzyaloshinskii-Moriya interaction change at the epitaxial Fe(001)/MgO(001) interface engineered by Co and Pd atomic-layer insertion. Phys. Rev. B 2018, 98, 144432. [Google Scholar] [CrossRef]
  41. Nakamura, K.; Nomura, T.; Pradipto, A.-M.; Nawa, K.; Akiyama, T.; Ito, T. Effect of heavy-metal insertions at Fe/MgO interfaces on electric-fieldinduced modification of magnetocrystalline anisotropy. J. Magn. Magn. Mater. 2017, 429, 214–220. [Google Scholar] [CrossRef]
  42. Nozaki, T.; Kozioł-Rachwał, A.; Tsujikawa, M.; Shiota, Y.; Xu, X.; Ohkubo, T.; Tsukahara, T.; Miwa, S.; Suzuki, M.; Tamaru, S.; et al. Highly efficient voltage control of spin and enhanced interfacial perpendicular magnetic anisotropy in iridium-doped Fe/MgO magnetic tunnel junctions. Npg Asia Mater. 2017, 4, e451. [Google Scholar] [CrossRef] [Green Version]
  43. Skowroński, W.; Nozaki, T.; Lam, D.D.; Shiota, Y.; Yakushiji, K.; Kubota, H.; Fukushima, A.; Yuasa, S.; Suzuki, Y. Underlayer material influence on electric-field controlled perpendicular magnetic anisotropy in CoFeB/MgO magnetic tunnel junctions. Phys. Rev. B Cond. Matter Mater. Phys. 2015, 91, 1–6. [Google Scholar] [CrossRef]
  44. Miwa, S.; Fujimoto, J.; Risius, P.; Nawaoka, K.; Goto, M.; Suzuki, Y. Strong bias effect on Voltage-driven torque at epitaxial Fe-MgO interface. Phys. Rev. X 2017, 7, 1–9. [Google Scholar] [CrossRef]
  45. Ong, P.V.; Kioussis, N.; Odkhuu, D.; Khalili Amiri, P.; Wang, K.L.; Carman, G.P. Giant voltage modulation of magnetic anisotropy in strained heavy metal/magnet/insulator heterostructures. Phys. Rev. B 2015, 92, 020407. [Google Scholar] [CrossRef] [Green Version]
  46. Kato, Y.; Yoda, H.; Saito, Y.; Okawa, S.; Fuji, K.; Yoshiki, M.; Koi, K.; Sugiyama, H.; Ishikawa, M.; Inokuchi, T.; et al. Giant voltage-controlled magnetic anisotropy effect in a crystallographically strained CoFe system. Appl. Phys. Express 2018, 11, 053007. [Google Scholar] [CrossRef]
  47. Kozioł-Rachwał, A.; Nozaki, T.; Freindl, K.; Korecki, J.; Yuasa, S.; Suzuki, Y. Enhancement of perpendicular magnetic anisotropy and its electric field-induced change through interface engineering in Cr/Fe/MgO. Sci. Rep. 2017, 7, 5993. [Google Scholar] [CrossRef] [PubMed]
  48. Kozioł-Rachwał, A.; Nozaki, T.; Zayets, V.; Kubota, H.; Fukushima, A.; Yuasa, S.; Suzuki, Y. The effect of the MgO buffer layer thickness on magnetic anisotropy in MgO/Fe/Cr/MgO buffer/MgO(001). J. Appl. Phys. 2016, 120, 085303. [Google Scholar] [CrossRef]
  49. Von Barth, U.; Hedin, L. A local exchange-correlation potential for the spin polarized case. J. Phys. C 1972, 5, 1629. [Google Scholar] [CrossRef]
  50. Oda, T.; Hosokawa, A. Fully relativistic two-component-spinor approach in the ultrasoft-pseudopotential plane-wave method. Phys. Rev. B 2005, 72, 224428. [Google Scholar] [CrossRef] [Green Version]
  51. Oda, T.; Pasquarello, A.; Car, R. Fully unconstrained approach to noncollinear magnetism: Application to small Fe clusters. Phys. Rev. Lett. 1998, 80, 3622. [Google Scholar] [CrossRef]
  52. Perdew, J.P.; Chevary, J.A.; Vosko, S.H.; Jackson, K.A.; Pederson, M.R.; Singh, D.J.; Fiolhais, C. Atoms, molecules, solids, and surfaces: Applications of the generalized gradient approximation for exchange and correlation. Phys. Rev. B 1992, 11, 6671. [Google Scholar] [CrossRef] [PubMed]
  53. Laasonen, K.; Pasquarello, A.; Car, R.; Lee, C.; Vanderbilt, D. Car-Parrinello molecular dynamics with Vanderbilt ultrasoft pseudopotentials. Phys. Rev. B 1993, 47, 10142–10153. [Google Scholar] [CrossRef] [PubMed]
  54. Pardede, I.; Yoshikawa, D.; Kanagawa, T.; Ikhsan, N.; Murata, I.; Obata, M.; Oda, T. Anatomy of large perpendicular magnetic anisotropy in free-standing Co/Ni (1 1 1) multilayer. J. Magn. Magn. Mater. 2020, 500, 166357. [Google Scholar] [CrossRef]
  55. Oda, T.; Obata, M. Implementation of Magnetic Dipole Interaction in the Planewave-Basis Approach for Slab Systems. J. Phys. Soc. Jpn. 2018, 87, 064803. [Google Scholar] [CrossRef]
  56. Otani, M.; Sugino, O. First-principles calculations of charged surfaces and interfaces: A plane-wave non repeated slab approach. Phys. Rev. B 2006, 73, 115407. [Google Scholar] [CrossRef]
  57. Yoshikawa, D.; Obata, M.; Taguchi, T.; Haraguchi, S.; Oda, T. Possible origin of nonlinear magnetic anisotropy variation in electric field effect in a double interface system. Appl. Phys. Express 2014, 7, 113005. [Google Scholar] [CrossRef] [Green Version]
  58. Hallal, A.; Yang, H.X.; Dieny, B.; Chshiev, M. Anatomy of perpendicular magnetic anisotropy in Fe/MgO magnetic tunnel junctions: First-principles insight. Phys. Rev. B 2013, 88, 184423. [Google Scholar] [CrossRef] [Green Version]
  59. Chen, W.Z.; Jiang, L.N.; Yan, Z.R.; Zhu, Y.; Wan, C.H.; Han, X.F. Origin of the large voltage-controlled magnetic anisotropy in a Cr/Fe/MgO junction with an ultrathin Fe layer: First-principles investigation. Phys. Rev. B 2020, 101, 144434. [Google Scholar] [CrossRef]
  60. Wang, D.S.; Wu, R.; Freeman, A.J. First-principles theory of surface magnetocrystalline anisotropy and the diatomic-pair model. Phys. Rev. B 1993, 47, 14932. [Google Scholar] [CrossRef]
  61. Zhang, J.; Lukashev, P.V.; Jaswal, S.S.; Tysmbal, E.Y. Model of populations for voltage-controlled magnetic anisotropy in transition-metal thin films. Phys. Rev. B 2017, 96, 014435. [Google Scholar] [CrossRef] [Green Version]
Figure 1. Computational model for structure-I (without alloying) and structure- II (with alloying).
Crystals 10 01118 g001
Figure 2. Radial atomic spin density distribution [in (Bohr) 3 ] for (a) structure-I and (b) structure-II. All quadrupole components are magnified 20 times.
Crystals 10 01118 g002
Figure 3. Atom resolved MCAE for (a) structure-I and (b) structure-II.
Crystals 10 01118 g003
Figure 4. (a,b) Band dispersion curves of Fe 1 for d-orbitals minority-spin states (results without SOC) and atomic k -resolved MCAE of Fe 1 for structure-I. (c,d) Same as (a) and (b) for the structure-II. The labels of 1, 2, 3, 4, 1’, 2’, and 4’ on (b) and (d) are explained in text. The three panels in (a) and (c) indicate the projected component of d-orbitals ( d x z , d y z ), ( d x y , d x 2 y 2 ), and ( d 3 z 2 r 2 ) for the same band structure and its magnitude of symbols indicates the corresponding weights of the d-orbitals.
Crystals 10 01118 g004
Figure 5. MCAE in structure-II as a function of strain. The square and plus symbols specify the data from the total energy (TE) and GCFT schemes, respectively.
Crystals 10 01118 g005
Figure 6. k -resolved MCAE in structure-II for (a) η Fe = 3.8%, (b) η Fe = 0.3%, (c) η Fe = −3.1%, (d) η Fe = −5.9%, (e) η Fe = −7%, and (f) η Fe = −8%.
Crystals 10 01118 g006
Figure 7. Band dispersion curves of Fe 1 for minority-spin states (results without SOC) in structure-II. (a) η Fe = 3.8%, (b) η Fe = −5.9%, and (c) η Fe = −8%. The three panels and the magnitude of symbols in (a)–(c) indicate the same meanings as in Figure 4.
Crystals 10 01118 g007
Figure 8. (a) Electrostatic potential in structure-II for η Fe = −5.9% and (b) MCAE as electric field (EF) dependence in structure-II for η Fe = −5.9%.
Crystals 10 01118 g008
Figure 9. Voltage control of magnetic anisotropy (VCMA) coefficient ( γ ) as a function of strain in structure-II.
Crystals 10 01118 g009
Figure 10. Atom-resolved MCAE at E = 0 V/nm and E = 0.445 V/nm for (a) η Fe = +0.3% and E = 0.507 V/nm for (b) η Fe = −5.9%
Crystals 10 01118 g010
Figure 11. Atomic k -resolved MCAE on Fe 1 induced by EFs for η Fe = +0.3% (top panels) and η Fe = −5.9% (down panels). (a) E = −0.223 V/nm, (b) E = +0.223 V/nm, (c) E = +0.445 V/nm, (d) E = −0.253 V/nm, (e) E = +0.253 V/nm, and (f) E = +0.507 V/nm.
Crystals 10 01118 g011
Figure 12. Projected density of states (PDOS) of minority-spin states Fe 1 for η Fe = −5.9% under the EFs of E = 0 (shaded area), E = +0.507 V/nm (solid red line), and E = −0.253 V/nm (solid blue line), respectively.
Crystals 10 01118 g012
Table 1. The magnetic anisotropy energy (MAE) from magnetocrystalline anisotropy energy (MCAE) and shape magnetic anisotropy energy (SMAE) for structure-I and structure-II and the comparison with the available experimental data. The MCAE is calculated based on TE and grand canonical force theorem (GCFT). The SMAE is evaluated from discrete approach (DA) and spin density approach (SDA).
StructureMCAE (mJ/m 2 )SMAE (mJ/m 2 )MAE (MCAE+SMAE) (mJ/m 2 )
TEGCFTDASDATE + DATE + SDA
I0.5860.584−1.353−1.336−0.767−0.750
II1.2801.261−1.097−1.0530.1830.227
Exp. [39]-----∼ 0.5
Table 2. Orbital-resolved MCAE for the structure-I.
AtomMCAE (mJ/ m 2 )
spdTotal
Fe 1 0.0025−0.02180.59870.5794
Fe 2 0.00480.00330.26670.2748
Fe 3 −0.0031−0.0040−0.2126−0.2197
Fe 4 −0.0085−0.0025−0.0950−0.1010
Table 3. Orbital-resolved MCAE for the structure-II.
AtomMCAE (mJ/ m 2 )
spdTotal
Fe 1 0.00144−0.01451.11191.1118
Fe 2 0.00510.01500.27420.2943
Fe 3 −0.0050−0.0051−0.1085−0.1086
Fe 4 −0.0016−0.0171−0.0281−0.0094
Publisher’s Note: MDPI stays neutral with regard to jurisdictional claims in published maps and institutional affiliations.

