Article

Hidden Solvates and Transient Forms of Trimesic Acid

Strathclyde Institute of Pharmacy & Biomedical Sciences (SIPBS), University of Strathclyde, 161 Cathedral Street, Glasgow G4 0RE, UK
*
Author to whom correspondence should be addressed.
Crystals 2020, 10(12), 1098; https://doi.org/10.3390/cryst10121098
Submission received: 9 November 2020 / Revised: 25 November 2020 / Accepted: 27 November 2020 / Published: 30 November 2020
(This article belongs to the Special Issue Co-Crystals: From Discovery to Manufacture)

Abstract

:
This article discusses the formation of trimesic acid (TMA) solvates with ethanol, isopropyl alcohol and dimethylformamide via liquid-assisted grinding and slurry experiments. Through the use of X-ray diffraction methods, we highlight the formation of a new ethanol solvate of TMA that completes the series of alcohol solvates observed, a temperature-induced phase transition in the isopropyl alcohol solvate between 233 K and 243 K, and a transient 1:3 solvate with dimethylformamide that mimics a previously identified dimethylsulfoxide solvate. The alcohol structures possess a TMA framework that is geometrically similar where the intermolecular energies between TMA molecules are equivalent. We have observed that increasing the length of the alcohol induces an increase in the distortion of the TMA framework to accommodate the longer alkyl tails.

Graphical Abstract

1. Introduction

Trimesic acid is a common acid that is used in crystal engineering studies. The ability to form strong intermolecular interactions through the use of its three carboxylic acid groups gives scientists a great tool to work with for both organic and metal organic framework studies [1,2,3,4,5]. To date there are 148 entries for “organic” structures in the Cambridge Structural Database [6] for TMA in its neutral form. Due to the potential for its open pore structure, there are many instances of solvate formation or ternary structures where one of the components is a solvent molecule. Its role in structure directing was investigated by Nath et al. [7] who used TMA as a template for nanopatterning onto graphite surfaces. The authors used scanning tunnelling microscopy to visualize the arrangement of TMA onto the surface. They were limited to alcohols greater than 1-heptanol due to the low adsorption energies of the lower alcohol molecules. From these images, they were not only able to see the hydrogen-bonded TMA molecules but also the structure of the alcohols in which the TMA was originally dissolved. For those alcohols greater than 1-heptanol, the authors observed regular periodic arrays whose periodicity alters as a function of the number of carbons with differences being observed for odd and even alcohols. Despite the focus on the adsorption processes, the authors also reported the formation of new butanol, pentanol and hexanol solvates of TMA that showed contrasting packing arrangements. The butanol tail group was arranged perpendicularly to the plane of the TMA hydrogen-bonded network whilst the pentanol and hexanol tail groups adopt a position that is more parallel to the layers, 12 and 5°, respectively.
TMA has recently been a focus for a combined crystal structure prediction and solvent screen study where the authors confirmed theoretical predictions of a new low-energy porous structure of TMA [8]. The crystal structure predictions of TMA showed that there were two spikes in the density/Lattice Energy plot that were low in energy but lower in density than the known alpha and gamma-forms of TMA. The new low-energy structure was predicted to be a truly open pore structure whose pores run through the crystal structure rather than the networks being intertwined or offset from one another. Via a high-throughput screen of TMA with a range of solvents, they were able to identify this new form from the crystallization from 1,4-dioxane/1,3-dimethoxybenzene, 1-butanol/1,3-dimethoxybenzene, and finally with THF/n-butylbenzene. The formation of a solid from the latter conditions followed by solvent exchange with n-pentane provided the starting material for a single-crystal phase transformation, on vacuum, to the new unsolvated δ-form. It was found to be stable to 110 °C before converting to α-TMA. Pertinent to our study, during their high-throughput screen, Cui et al. identified a new solvated form using isopropyl alcohol, and n-propanol. Along with the studies of Nath et al. [7] and Dale and Elsegood [9], these observations provide systematic information on how TMA interacts with alcohol groups.
In this paper, we describe the formation of three new solid forms of TMA, two of which are either a polymorph or new stoichiometric ratio for which a solvate is already known. Firstly, we have identified a new ethanol solvate of TMA and put its structure into the context of known alcohol solvates of TMA. Then, we describe the phase transition that occurs in the isopropyl alcohol solvate of TMA on cooling to 100 K and finally, describe the formation of a new dimethylformamide solvate that possesses a different stoichiometric ratio (1:3) than the known form.

2. Materials and Methods

2.1. Slurrying

Slurries of TMA (500 mg) in each solvent (1 mL) and heated from 20 °C to 55 °C over 4 h (0.15 °C/min) before cooling to 20 °C over 2 h (0.3 °C/min). The heating was performed to accelerate the process.

2.2. Liquid Assisted Grinding (LAG)

LAG experiments were conducted on sample weights of approximately 300 mg of TMA. A mortar and pestle were used to lightly grind up the material in 75 µL of the chosen solvent was added in 25 µL aliquots over 15 min with continuous grinding throughout.

2.3. Single Crystal Preparation

Single crystals used for single crystal X-ray diffraction studies were obtained by slow evaporation from a saturated solution. For all evaporations, the supernatant present in slurried samples (once returned to room temperature, 20 °C) was removed and filtered in to clean vials. Vial caps were loosely placed on the vials to prevent dust ingress, and the vials stored in a fumehood until crystals suitable for diffraction studies were obtained.

2.4. Single Crystal Diffraction

For the ethanol solvate, X-ray diffraction intensities were collected using a Bruker D8 Venture diffractometer equipped with a copper Incoatec IμS microsource (λ = 1.54043 Å) and Photon 100 detector. The samples were cooled using an Oxford Cryosystems low temperature device [10] with data collected at 100 K. The data were reduced using the APEX3 [11] software that incorporates SAINT. An absorption correction was applied using SADABS [12] as implemented in APEX3.
For the isopropyl alcohol solvates, X-ray diffraction data were collected by the National Crystallography Service [13] using a Rigaku FR-E+ ultra-high flux diffractometer equipped with a Molybdenum X-ray source, (Mo-Kα, λ = 0.71075 Å), and HyPix-600E detector. Temperature control was provided by use of an Oxford Cryosystems Cobra low temperature device with data collected at temperatures of 100, 173, 223, 233, 243, 263 and 293 K. Data reduction was performed with Rigaku CrysAlisPro software [14]. The crystal used in the experiment was face indexed at each experimental temperature and an absorption correction applied based on a gaussian integration over a multifaceted crystal model and implemented in the CrysAlisPro software.
For the DMF solvate X-ray, diffraction intensities were collected on a Bruker Apex II diffractometer with an Incotec IμS microsource, Mo-Kα radiation (λ = 0.71073 Å) and equipped with an Oxford Cryosystems low temperature device [10] operating at 100 K.
For all datasets, structure solution was achieved using intrinsic phasing (SHELXT [15]) and refined using Olex2 [16] software (F2). All heavy atoms were anisotropically refined. All hydrogen atoms attached to carbon atoms were placed in calculated positions and constrained to ride their parent atom. The acidic protons on oxygen atoms were observed in the difference map, where possible, otherwise were placed using an AFIX147 restraint (IPA temperatures 223 K and above). The numbering schemes follow those of the literature. There were no particular refinement strategies for the ethanol solvate nor the datasets of the IPA in the low temperature phase as these were ordered structures. For the high-temperature phase of IPA solvate, the IPA molecule was disordered over the mirror plane. The occupancy of the solvent was set to 0.5, and a distance restraint applied between the central carbon and one of the methyl carbons. The hydrogen atoms that were involved in hydrogen bonding were all set to have 0.5 occupancy due to the disorder created by the mirror. For the DMF solvate, all atoms of one DMF molecule were set to 0.5 occupancy with distance restraint between the C7 and O4 to facilitate the modelling due to C7 being close to a site on the mirror plane.

2.5. X-ray Powder Diffraction

During testing of samples prepared during screening experiments, 2 different configurations were used for XRPD data collection. Initial testing of samples was performed in flat plate transmission geometry using a Bruker AXS D8 Advance II diffractometer. Samples of further interest were collected in capillary using a Bruker AXS D8 Advance diffractometer in transmission geometry.
Samples collected in flat-plate geometry were placed in a 28-well sample plate with a Kapton film (7.5 um thickness) applied to the base to contain the samples. To avoid any undesired changes to sample composition as a result of grinding, samples were lightly ground against the side of the vial with a spatula before transferring to the sample plate. Diffraction was recorded between 4–35° 2θ with 0.017° per step and 1 s exposure per step.
For capillary samples, material was ground using an agate pestle and mortar before transfer to a 0.7 mm diameter borosilicate glass capillary for data collection. Data were typically collected 3–40° 2 Theta using step size of 0.017° per step. The exposure time per step was varied between samples. Capillary geometry was also used to test slurried samples; these samples were transferred to a 1.0 mm diameter capillary by syringe before data collection. Data were monitored for change using repeated short collections (3–40° 2θ, 0.017 ° per step, 1 s per step) and also subject to longer collections at the end of monitoring (2–45° 2θ, 0.014° per step, 4 s per step).

3. Results and Discussion

3.1. Solid Form Screen

At the time of investigation Cui et al. published an extensive solid-form screen of TMA in the search for novel polymorphs of TMA as indicated by a crystal structure prediction study. Figure 1 shows the results we obtained in the present work for the slurry and LAG experiments for the ethanol, isopropyl alcohol (IPA) and dimethylformamide (DMF) solvates as these are pertinent to this investigation. The results from the additional slurry and liquid assisted grinding experiments in other solvents can be found in the ESI (see Supplementary Materials, Figures S1 and S2). In each of the graphs, the dimethylformamide sample shows a very different PXRD to the raw material which supports previous investigations that isolated the DMF solvate [17]. The pattern from the slurry indicates that the majority of the solid has converted to the known solvate phase however the additional peak at 8° (doublet vs. a single peak from known solvate) warranted further investigations into this phase. The isopropyl alcohol shows no conversion during grinding but there is partial transformation in the slurried sample occurring at 11° that indicates the potential change to the IPA solvate. The powder from ethanol looks to be largely unchanged via these experiments; however, there is a peak at 8.7° that does not fit with the known form of TMA but does potentially correspond to the TMA dihydrate that was formed under failed hydrothermal synthesis with 2-2′-bipyridine and lanthanum sulfate nonahydrate [18]. A direct route to its formation is informative especially as Cui et al. observed another polymorph in addition to the non-stoichiometric (5/6ths) hydrate identified by Herbstein and Marsh [19]. For the majority of the other solvents, the known α-form of TMA was observed. The solvents in which there were differences were those known solvated forms of TMA, e.g., DMSO [20,21,22] and pentanol [7] (for LAG) and water [18,19], methanol [9], butanol (for the slurry) [7] (Figures S1 and S2). We found that the technique used was a factor in our observation of the phases, for example, the butanol solvate and hydrate were not observed after LAG, but we did begin to observe these phases forming under slurry. However, we observed the pentanol under LAG conditions, which indicates that the volatility, and hence quantity of the solvent present during the preparation or subsequent transfer to powder diffractometer, is a factor in the solvate formation or in the retention/isolation of the formed phase. The impact of solvent addition has been observed in other studies [23].
In addition to the slurry and grinding experiments we also performed solution-based crystallization of TMA from the selected solvents. Again, we were able to isolate the known solvated forms of TMA, e.g., methanol, hydrate and dimethylsulfoxide, but we also observed new phases that had not been observed before during the collection of single crystal diffraction data.

3.2. TMA:EtOH Solid

The crystals from ethanol evaporative crystallization (Figure 2b) were of high quality and we were able to identify a new triclinic unit cell from the diffraction data. The ethanol solvate crystallizes in space group P-1 with one molecule of TMA and one molecule of ethanol in the asymmetric unit. Like many of the other alcohol structures the TMA molecules hydrogen bond to each other using the acid dimer hydrogen bonding motif (R22(8)). The TMA molecules that associate through the dimer then connect to other dimers through a single hydrogen bond to another dimer on each side. These secondary interactions form large rings R44(32) that extend into a tape motif with the solvent molecules positioned at the edges of the tape. The solvent molecules interact with the free carbonyl that is unused in the TMA interactions (Figure 2). This motif is similar to those of the alcohols that have been studied previously (methanol, propanol-hexanol) and examples of these are shown in Figure 2c,d.
The difference in the structures lies in the way in which the tapes interact with one another. In the ethanol solvate, the tapes are offset from one another along the length of the tape. Figure 3a shows the view perpendicular to the tape motif (that runs from left to right) and how the neighbouring tapes interact in a stepped motif. The large ring structure (R44(32)) is an important region as this is where neighbouring motifs interact through the interaction with ethanol molecules. The ethanol molecules from the neighbouring tapes above (blue molecule) and below (red molecule) fill this void with their ethyl groups (Figure 3b). It is curious that Cui et al. did not observe the ethanol solvate during their solvent screen of TMA but the preferential crystallization of diphenylether or cyclohexanone solvate from a mixture of the two solvents is likely attributed to the volatility of ethanol compared with those two solvents as they evaporated the “good” solvent (EtOH) before data collection [8].

3.3. TMA:IPA Solid

TMA:IPA solvate was investigated by Cui and co-workers, and they observed that two TMA molecules crystallized with two IPA molecules in C2/c symmetry at 100 K. This crystal forms the same hydrogen-bonded TMA motif that we have observed in other alcohol solvates. There is intercalation of the alcohol molecules into the large pockets created by the R44(32) motif. However, on warming, we observe a single-crystal to single-crystal phase transformation to a new disordered phase between 233 and 243 K that persists to ambient temperature. Inspection of the crystal during warming showed a gradual colour change; at 100 K, the sample crystal was a strong yellow colour, the intensity of which diminished gradually during warming through the transition and back to room temperature (Figure S3). Over the phase transition the translational component of the glide operation is lost leaving a C2/m symmetry. The asymmetric unit is composed of half a TMA molecule, and the propyl group of the IPA molecule is now disordered. The tape structure in the ambient temperature form is set so the TMA molecules are parallel to one another which enables the mirror symmetry to be defined through the molecule. On cooling, the tape is maintained but the neighbouring dimers have moved laterally, which breaks the mirror symmetry through the TMA molecules (Figure 4). As we cool into the LT phase, the relationships between the MA molecule skew, and the disorder is resolved due to the change in the geometry of the cavity. The tapes stack together in a similar manner to the ethanol solvate (Figure 4a) where the IPA solvent molecules from the tapes above and below fill the ring.

3.4. Comparison of Alcohol Structures
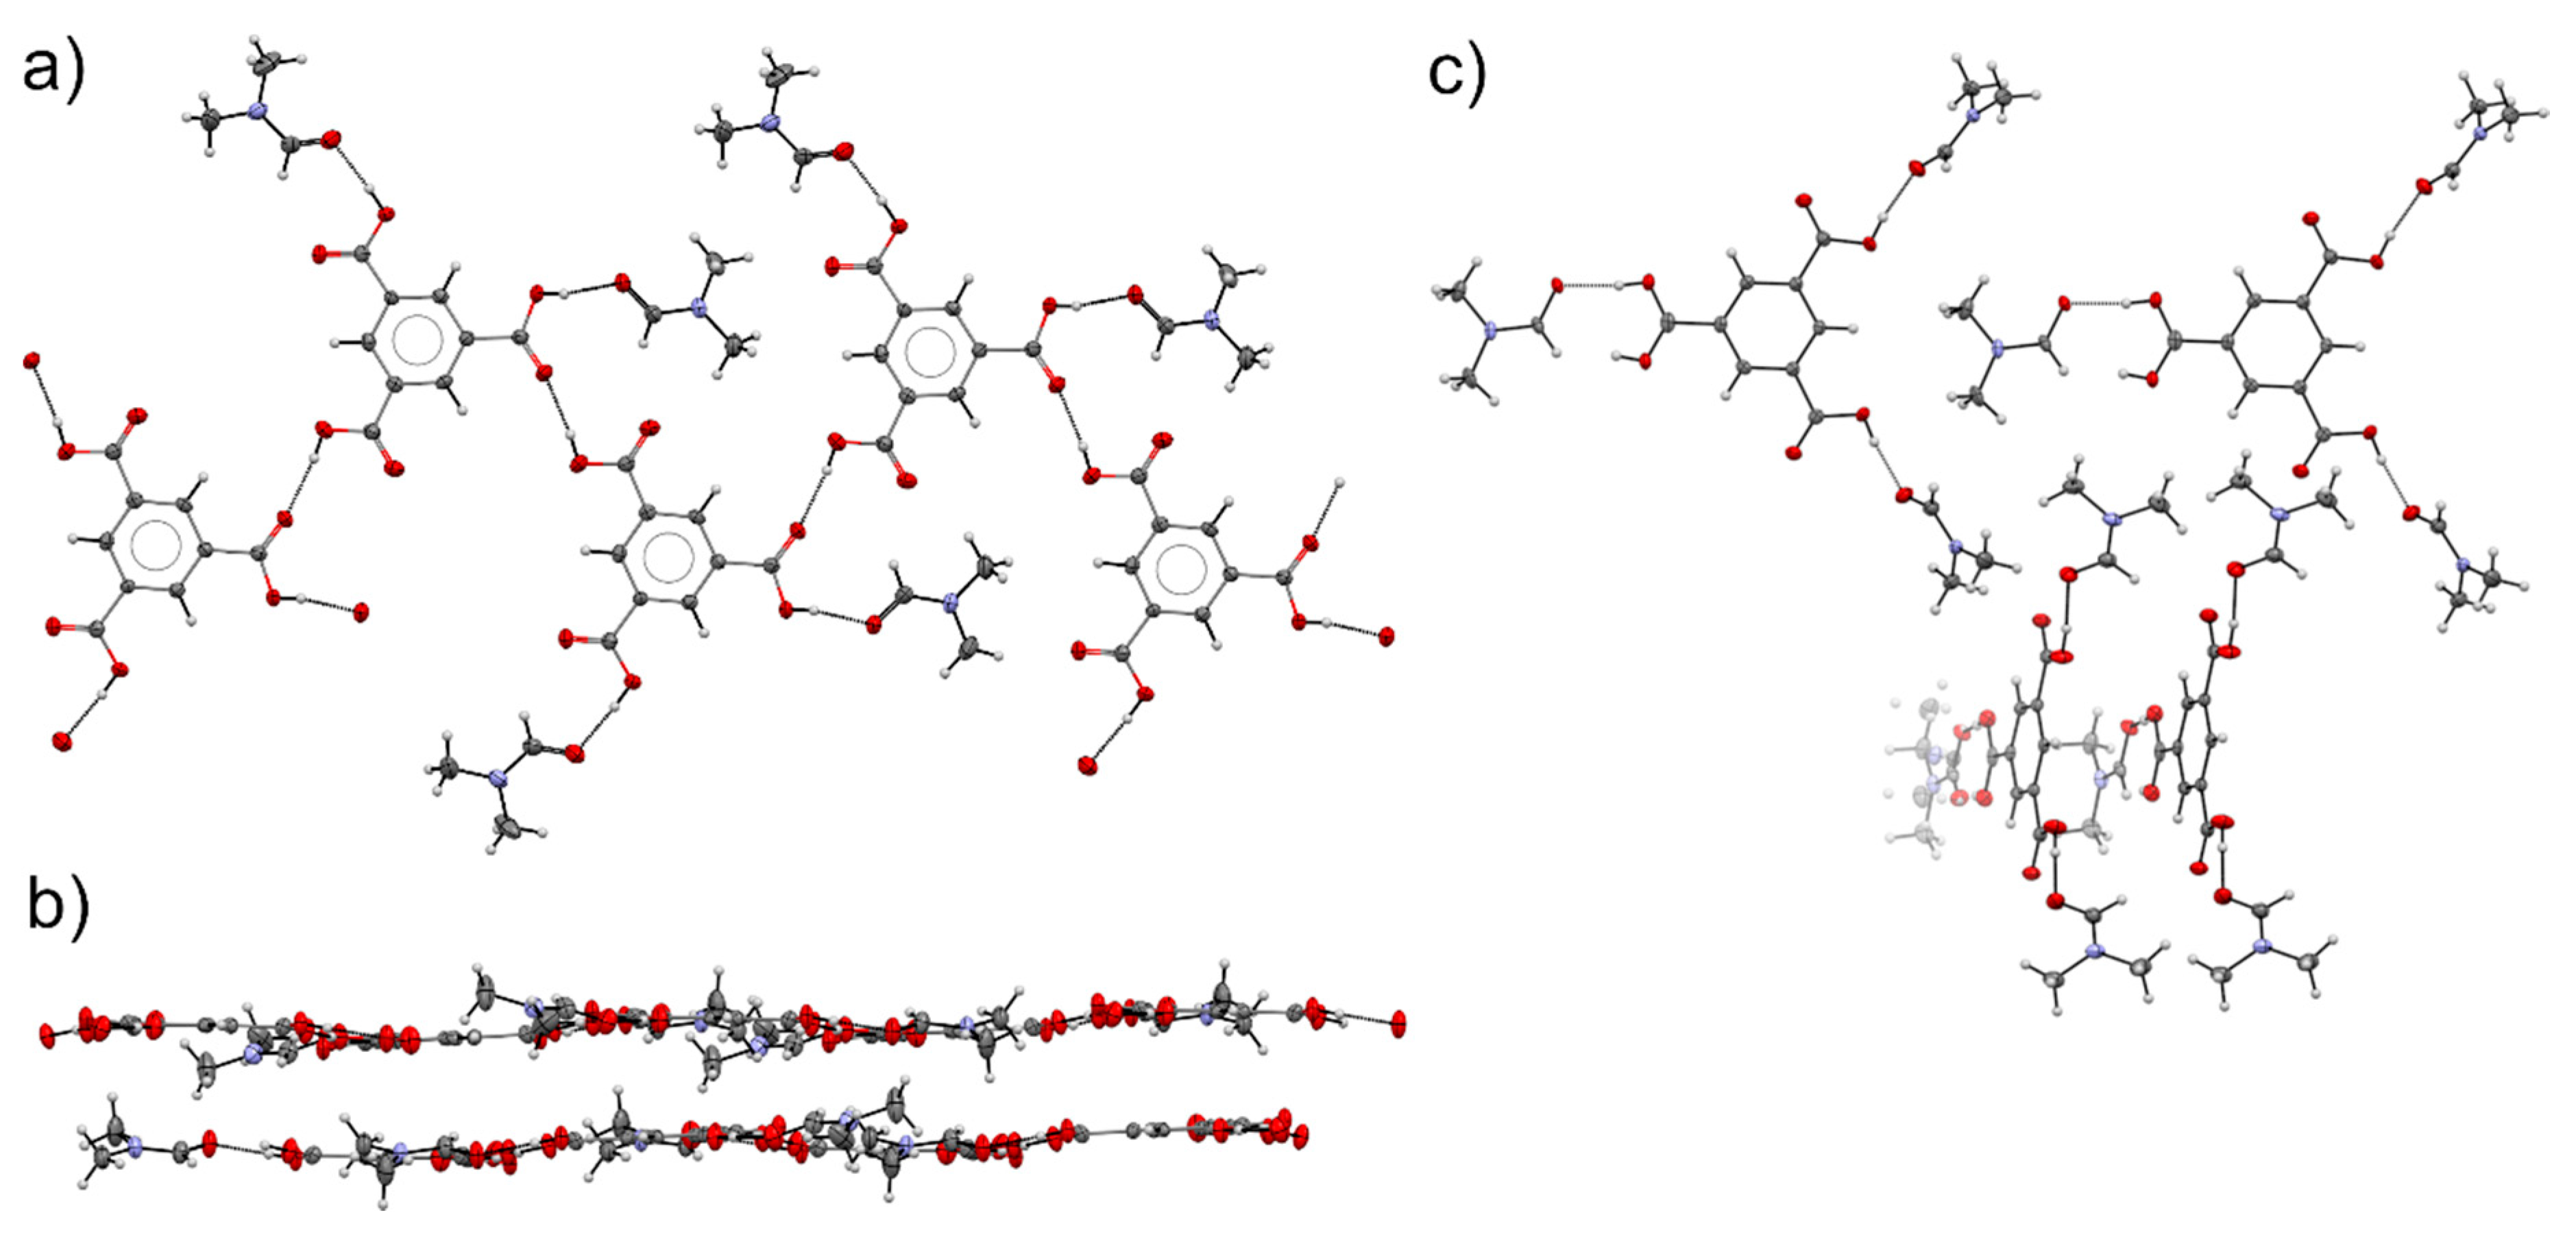
As we have noted in the previous section, the main TMA structures of the alcohols are very similar to one another with the R44(32) ring combining into the tape structure. The analysis of the ethanol and IPA solvate structures reveals a change to the geometry of the ring system as a function of the length of the solvent. An analysis of all the known alcohol solvates and the geometry of the framework reveals that there is a correlation between the length of the solvent and the degree to which the ring system is distorted; the longer the alcohol, the more distorted (Figure 4d). We have calculated the intermolecular energies for the series using PIXEL [24,25,26], and these are shown in Table 1 and Figure 5. Despite the distortions to the ring system, the energy of the TMA framework is reasonably consistent. For the hydrogen bonded framework, the dimer interaction is the most attractive interaction in the structures (~−70 kJ/mol) with the other TMA interactions with the neighbouring dimer (~−30 k/mol) and with the solvent molecules being equally attractive; we note the drop off in energy with the solvent-TMA interaction (interaction d) caused by the reduction in coulombic energy. Where we do observe a difference in the energies between solvates is between the TMA molecules in different layers. The interactions of the solvent molecule in the layer above and below necessitate a change in the way the layers interact with one another. There is a jump of 10 kJ/mol between the interlayer TMA interactions in MeOH, EtOH and ButOH and those in the PrOH, PenOH and HexOH structures. Calculating the change to the geometry of the interaction, we note that there is a significant lateral shift to the layers which is to accommodate the packing of the latter solvents in the ring structure of TMA molecules. For the MeOH-ButOH structures (except PrOH), the solvent molecules are orientated so that the alkyl tail group lies perpendicular to the layers with a slight increase in the interlayer separation (3.185–3.445 Å; planes calculated through the phenyl group). For the PrOH structure, the propanol has an end-on interaction, in the pocket, with a neighbouring solvent from the layer below, which leads to the increase in the lateral shift of the layers compared with lower alcohols (interlayer separation of 3.22 Å). This is observed to a greater extent in the PenOH structure where the solvent is linear, and they lie along the full length of the TMA pocket. The layers have to move laterally, and with this movement, the interlayer separation is reduced to 3.015 Å; the lateral shift of centroids in contact e) is ~1 Å. The hexanol follows with a similar lateral shift, but there is a change to the molecular geometry where the end methyl group twists so that it points into the ring mimicking the smaller solvates. As it is only the methyl group, the interlayer separation is equivalent to the pentanol structure (3.036 Å). These latter two observations were highlighted by Nath et al. in their study [7].

3.5. DMF Solvate

From the initial solvent screen of TMA, we noted two different patterns from the dimethylformamide experiments. TMA forms a solvate with DMF that has been characterized previously either from a mixture of DMF/benzene in a 1:10 ratio (XAVPOZ) [27] or through recrystallisation from pure DMF (XAVPOZ01) [17]. The structure of the DMF solvate has a 1:2 stoichiometric ratio of TMA to DMF. It forms a layered structure (parallel to the (1 0 −1) plane) where the TMA molecules hydrogen bond to two DMF molecules (2.517, 2.611 Å) and one neighbouring TMA molecule (2.747 Å). There is little interaction between the layers that are spaced by 3.225 Å with only methyl hydrogen atoms coming within a van der Waals radii (at 293 K). From our experimental patterns, we observe that this phase is produced via the Liquid-Assisted Grinding with a secondary component that can be identified as the raw TMA pattern (BTCOAC) (Figure 1a). The slurry experiment seems to be free from raw TMA, but there are peaks present that we cannot identify from the known forms in the literature (Figure 1b).
It was possible to transfer the wet slurry to a capillary for XRPD data collection, following which we collected data repeatedly over the period of 24 h and saw no change in the pattern (Figure 6a). However, at the end of XRPD data collections, we observed that crystals had annealed in to larger crystals that were visible within the capillary tube. We attempted to isolate these crystals for single-crystal XRD data collection, and interestingly, these crystals rapidly transformed when removed from the capillary tube (5–20 min). Images showing the change in appearance of the crystals that we managed to isolate are shown in the inset images in Figure 6a,b.
We performed a single-crystal X-ray diffraction study on this material and could identify a new unit cell; however, during the collection at ambient temperature (296 K) the diffraction pattern deteriorated significantly within a 2-h period (Figure 6c–e). This timescale is much longer than we observed for crystals fresh from the capillary which deteriorated within minutes of exposure to air. The mineral oil used to mount the crystal protected the crystal from the rapid transformation. The lifetime of the new structure is suitably extended at 100 K and allowed the collection of a dataset from which we solved the structure. The structure confirms a new solvate with three molecules of DMF to one TMA molecule in Pmn21 (Figure 7). One of these DMF molecules is disordered over two positions due to the mirror plane. This is in contrast to the stable form 1:2 solvate where the TMA molecules are hydrogen bonded to one another. This mimics the behaviour of the metastable tri-dmsolate where the TMA is hydrogen bonded to DMSO rather than other TMA molecules (XASFAA) [21]. The structural overlay feature in Mercury demonstrates that 5 out of the 15 neighbouring molecules are overlaid between XASFAA and our new DMF solvate indicating some similarity between the small hydrogen bonded group of 1:3 TMA:solvent. The two DMF molecules related by the mirror lie almost perpendicular to the TMA which enables a contact to be made between the aldehyde CH and carbonyl of the TMA in a neighbouring unit; the disordered DMF lies parallel with the TMA to which it is bonded. The molecular units, constructed of the 3 DMF and TMA, are offset (1.65 Å) and stack together at a separation of 3.25 Å between the planes calculated through the phenyl group which follows the DMSO solvate where the separation is 3.39 Å. The intercentroid distance between the phenyl group is 5.907 Å (5.277 Å for XASFAA). There is intercalation of DMF molecules with neighbouring stacks (along the c-direction) giving a structure that possesses regions of solvent molecules that may facilitate the loss of DMF to create the 1:2 solvate (Figure 7c). The phase transition between this 1:3 and 1:2 solvate is reconstructive, suggesting a complete disruption of the hydrogen bonded network. This mirrors the observations in the DMSO solvate that Davey et al. [21] made where the trisolvate possess disordered solvent molecules that give way to the hydrogen bonding between TMA molecules. Davey et al. showed that on movement from solution to the solid state, the environment of the carbonyl groups does not change, hence indicating that the TMA is fully solvated in solution. From the DMF trisolvate, we can assume that this is also the case without possessing IR data.

4. Conclusions

We have isolated three new solvated structures of TMA with ethanol, isopropyl alcohol and dimethylformamide. Two of these structures are phases with limited stability windows. In the case of TMA:IPA, we have identified that the previous structure obtained by Cui et al. undergoes a phase transition at ~240 K to a ambient temperature phase that is disordered. The transition is observed due to the movement of the TMA hydrogen-bonded network. We note that the extent of the skew observed in the alcohol series increases as a function of the alcohol length. The DMF solvate is a transitory phase that has three molecules of DMF that are hydrogen-bonded to the TMA molecule. This phase also possesses some disorder of one of the solvent molecules. We were able to identify this phase and observe its conversion to the stable 1:2 solvate over the course of 2 ½ h on the single crystal diffractometer. This behaviour mimics that of the previously known DMSO trisolvate that also transitions within a matter of minutes to a more stable 1:2 phase.

Supplementary Materials

The following are available online at https://www.mdpi.com/2073-4352/10/12/1098/s1. Figure S1: X-ray diffraction pattern of solids from liquid-assisted grinding using various solvents. The DMSO and 1-pentanol patterns show different patterns to the α-TMA and are the known solvates. Figure S2: X-ray diffraction pattern of solids slurry of TMA in various solvents. There are a few samples that indicate the potential for new solids in 2-butanone, acetonitrile and toluene. Figure S3: The evolution of the TMA:IPA crystal colour as a function of temperature. The phase transition from the ambient temperature form to the low temperature form occurs between 233 K and 243 K. Table S1: Experimental details for the TMA Ethanol solvate. Table S2: Experimental details for the TMA IPA solvate with variable temperature. Table S3: Experimental details for the TMA dimethylformamide solvate.

Author Contributions

Conceptualization and supervision, M.R.W. and I.D.H.O.; formal analysis, M.R.W. and I.D.H.O.; writing—original draft, M.R.W. and I.D.H.O.; writing—review and editing, M.R.W. and I.D.H.O.; methodology, M.R.W. and I.D.H.O.; software, M.R.W. and I.D.H.O.; data curation, M.R.W. and I.D.H.O.; project administration, I.D.H.O.; funding acquisition, I.D.H.O. All authors have read and agreed to the published version of the manuscript.

Funding

This research was funded by the Engineering and Physical Sciences Research Council (EP/N015401-1).

Acknowledgments

We thank Lewis Anderson for his help with setting up solvent screens. All data underpinning this publication are openly available from the University of Strathclyde Knowledge Base at https://doi.org/10.15129/9ef4e1e1-9eb9-4738-8ae9-165a7e80ebc2. The Cambridge Structural Database number are 2042918-2042926. We thank the EPSRC UK National Crystallography Service at the University of Southampton for the collection of the variable temperature SCXRD for the TMA:IPA solvate.

Conflicts of Interest

The authors declare no conflict of interest.

References

  1. Du, M.; Zhang, Z.H.; Zhao, X.J. Cocrystallization of trimesic acid and pyromellitic acid with bent dipyridines. Cryst. Growth Des. 2005, 5, 1247–1254. [Google Scholar] [CrossRef]
  2. Melendez, R.E.; Sharma, C.V.K.; Zaworotko, M.J.; Bauer, C.; Rogers, R.D. Toward the design of porous organic solids: Modular honeycomb grids sustained by anions of trimesic acid. Angew. Chem. 1996, 35, 2213–2215. [Google Scholar] [CrossRef]
  3. Tothadi, S.; Koner, K.; Dey, K.; Addicoat, M.; Banerjee, R. Morphological Evolution of Two-Dimensional Porous Hexagonal Trimesic Acid Framework. ACS Appl. Mater. Interfaces 2020, 12, 15588–15594. [Google Scholar] [CrossRef] [PubMed]
  4. Sel, K.; Demirci, S.; Meydan, E.; Yildiz, S.; Ozturk, O.F.; Al-Lohedan, H.; Sahiner, N. Benign preparation of metal-organic frameworks of trimesic acid and Cu, Co or Ni for potential sensor applications. J. Electron. Mater. 2015, 44, 136–143. [Google Scholar] [CrossRef]
  5. Sahiner, N.; Sel, K.; Ozturk, O.F.; Demirci, S.; Terzi, G. Facile synthesis and characterization of trimesic acid-Cu based metal organic frameworks. Appl. Surf. Sci. 2014, 314, 663–669. [Google Scholar] [CrossRef]
  6. Groom, C.R.; Bruno, I.J.; Lightfoot, M.P.; Ward, S.C. The Cambridge Structural Database. Acta Crystallogr. Sect. B Struct. Sci. Cryst. Eng. Mater. 2016, 72, 171–179. [Google Scholar] [CrossRef]
  7. Nath, K.G.; Ivasenko, O.; MacLeod, J.M.; Miwa, J.A.; Wuest, J.D.; Nanci, A.; Perepichka, D.F.; Rosei, F. Crystal engineering in two dimensions: An approach to molecular nanopatterning. J. Phys. Chem. C 2007, 111, 16996–17007. [Google Scholar] [CrossRef]
  8. Cui, P.; Mcmahon, D.P.; Spackman, P.R.; Alston, B.M.; Little, M.A.; Day, G.M.; Cooper, A.I. Mining predicted crystal structure landscapes with high throughput crystallisation: Old molecules, new insights. Chem. Sci. 2019, 10, 9988–9997. [Google Scholar] [CrossRef] [Green Version]
  9. Dale, S.H.; Elsegood, M.R.J.; Richards, S.J. Step-wise dis-assembly of trimesic acid: Mono- and bis(methanol) solvates. Chem. Commun. 2004, 11, 1278–1279. [Google Scholar] [CrossRef]
  10. Cosier, J.; Glazer, A.M. A nitrogen-gas-stream cryostat for general X-ray diffraction studies. J. Appl. Crystallogr. 1986, 19, 105–107. [Google Scholar] [CrossRef]
  11. Bruker APEX3, SAINT and SADABS; Bruker AXS Inc.: Madison, WI, USA, 2015.
  12. Sheldrick, G.M. SADABS; University of Gottingen: Gottingen, Germany; Bruker AXS: Madison, WI, USA, 2001. [Google Scholar]
  13. Coles, S.J.; Gale, P.A. Changing and challenging times for service crystallography. Chem. Sci. 2012, 3, 683–689. [Google Scholar] [CrossRef] [Green Version]
  14. Rigaku Oxford Diffraction CrysAlisPro. 2019. Available online: https://www.rigaku.com/products/smc/crysalis (accessed on 30 November 2020).
  15. Sheldrick, G.M. SHELXT—Integrated space-group and crystal-structure determination. Acta Crystallogr. Sect. A Found. Adv. 2015, 71, 3–8. [Google Scholar] [CrossRef] [PubMed] [Green Version]
  16. Dolomanov, O.V.; Bourhis, L.J.; Gildea, R.J.; Howard, J.A.K.; Puschmann, H. OLEX2: A complete structure solution, refinement and analysis program. J. Appl. Crystallogr. 2009, 42, 339–341. [Google Scholar] [CrossRef]
  17. Dale, S.H.; Elsegood, M.R.J. Trimesic acid bis(N,N-dimethylformamide) solvate at 150 K. Acta Crystallogr. Sect. E Struct. Rep. Online 2003, 59, o127–o128. [Google Scholar] [CrossRef]
  18. Fan, Z.-Z.; Li, X.-H.; Wang, G.-P. Trimesic acid dihydrate. Acta Crystallogr. Sect. E Struct. Rep. Online 2005, 61, o1607–o1608. [Google Scholar] [CrossRef]
  19. Herbstein, F.H.; Marsh, R.E. The crystal structures of trimesic acid, its hydrates and complexes. II. Trimesic acid monohydrate-2/9 picric acid and trimesic acid 5/6 hydrate. Acta Crystallogr. Sect. B Struct. Crystallogr. Cryst. Chem. 1977, 33, 2358–2367. [Google Scholar] [CrossRef]
  20. Herbstein, F.H.; Kapon, M.; Wasserman, S.; Herbstein, F.H.; Kapon, M. The Crystal Structures of Trimesic Acid, its Hydrates and Complexes. Acta Crystallogr. Sect. B 1978, 34, 1608–1612. [Google Scholar] [CrossRef]
  21. Davey, R.J.; Brychczynska, M.; Sadiq, G.; Dent, G.; Pritchard, R.G. Crystallising trimesic acid from DMSO solutions—Can crystallography teach us anything about the process of crystal nucleation? CrystEngComm 2013, 15, 856–859. [Google Scholar] [CrossRef]
  22. Bernè, S.; Hernández, G.; Portillo, R.; Gutiérrez, R. Trimesic acid dimethyl sulfoxide solvate: Space group revision. Acta Crystallogr. Sect. E Struct. Rep. Online 2008, 64, o1366. [Google Scholar] [CrossRef]
  23. Hasa, D.; Pastore, M.; Arhangelskis, M.; Gabriele, B.; Cruz-Cabeza, A.J.; Rauber, G.S.; Bond, A.D.; Jones, W. On the kinetics of solvate formation through mechanochemistry. CrystEngComm 2019, 21, 2097–2104. [Google Scholar] [CrossRef] [Green Version]
  24. Gavezzotti, A. Efficient computer modeling of organic materials. The atom-atom, Coulomb-London-Pauli (AA-CLP) model for intermolecular electrostatic-polarization, dispersion and repulsion energies. New J. Chem. 2011, 35, 1360–1368. [Google Scholar] [CrossRef]
  25. Gavezzotti, A. Non-Conventional Bonding between Organic Molecules. The “Halogen Bond” in Crystalline Systems. Mol. Phys. 2008, 106, 1473–1485. [Google Scholar] [CrossRef] [Green Version]
  26. Reeves, M.G.; Wood, P.A.; Parsons, S. MrPIXEL: Automated execution of Pixel calculations via the Mercury interface. J. Appl. Crystallogr. 2020, 53, 1154–1162. [Google Scholar] [CrossRef] [PubMed]
  27. Chatterjee, S.; Pedireddi, V.R.; Ranganathan, A.; Rao, C.N.R. Self-assembled four-membered networks of trimesic acid forming organic channel structures. J. Mol. Struct. 2000, 520, 107–115. [Google Scholar] [CrossRef]
Figure 1. The X-ray powder diffraction from the samples under liquid assisted grinding (a) and via slurry (b) for the new solid forms. The powder diffraction patterns for all the solvent under study can be found in ESI.
Crystals 10 01098 g001
Figure 2. (a) The hydrogen-bonded tape of TMA molecules forming through the acid dimer R22(8) dimer that couple together to form tapes with large R44(32) rings, (b) crystals of TMA:ethanol solvate showing the morphology of the crystals (scale bar is 200 µm), (c) the tape motif observed in the methanol solvate of TMA (CSD Refcode: IYUQIC) [9]; (d) hexanol solvate of TMA (CSD Refcode: GIRDIV) [7].
Crystals 10 01098 g002
Figure 3. (a) The stacked nature of the tape motif that runs from left to right. The position of the ethanol molecules in the hydrogen-bonded ring system require the tapes to be offset; (b) a view perpendicular to the tape motifs indicating the orientation of the ethanol molecules in the ring system; (c) a view from the top of the hydrogen-bonded ring, the ethanol molecules are from tapes above and below.
Crystals 10 01098 g003
Figure 4. (a) An overlay of the low-temperature (purple) and high-temperature (elemental colour) polymorphs of the TMA:IPA solvate indicating the increase in the disorder of solvent. The solvent molecules from layers above and below are shown in the ring; (b) the relationship between the centroids of the TMA molecules in the two phases where R44(32) rings become more skewed. The extent of the skew is defined using the lengths between centroids (L1 and L2) and the angle between them (α); (c) the parameters for the ethanol and two IPA polymorphs; (d) the distortion of the TMA framework as a function of carbon length in the alcohols. Greater skew of the TMA framework is observed for longer chain length. The n = 3 points are for isopropanol (filled squares) and propanol (unfilled squares). Pentanol shows greater distortion due to the new packing arrangement of the solvent in the pockets. References are: methanol [9], propanol (LT form) [8], butanol-hexanol [7].
Crystals 10 01098 g004
Figure 5. The strongest intermolecular interactions that are common to all the TMA alcohol solvates. The letters (ae) correspond to the interactions in Table 1.
Crystals 10 01098 g005
Figure 6. (a) XRPD pattern obtained from a “wet” TMA:DMF slurry. The pattern has been fitted (Pawley) using the unit cell parameters of the new Pmn21 polymorph of the DMF solvate. (b) XRPD pattern obtained from a “dried” sample of the TMA:DMF slurry. The pattern has been fitted (Rietveld) to the previously known polymorph (CSD: XAVPOZ) of the DMF solvate. For both plots, the experimental pattern is shown in black, calculated pattern in red, difference plot in blue and tick marks represent expected reflections for the fitted phases. The inset images show the transformation of (a) a single crystal of the Pmn21 phase isolated from the slurry to the (b) XAVPOZ phase within minutes of isolation (296 K, in air). The crystal is mounted on a Kapton microloop, and the scale bar shown in (a) represents a distance of 100 µm. The change in diffraction obtained from a crystal of the Pmn21 phase over the period of 2 h is shown in (ce), where the highlighted ring represents 1.0 angstrom resolution.
Crystals 10 01098 g006
Figure 7. (a) The hydrogen bonding pattern in the 1:2 TMA:DMF solvate (XAVPOZ) [17]; (b) the layered nature of the 1:2 solvate; (c) the hydrogen bonding pattern in the 1:3 TMA:DMF solvate showing the isolated units of TMA surrounded by three DMF molecules. These stacked groups interact in a herring bone motif with groups along the c-direction. The DMF molecules that are in-plane with the TMA are disordered over the mirror plane.
Crystals 10 01098 g007
Table 1. The intermolecular energies for each solvate calculated by PIXEL [24,25,26] and partitioned into different contributions of coulombic, polarization, dispersion and repulsion. An image of the particular interaction (a-e) is found in Figure 5. Reference structures are methanol [9], propanol (LT form) [8], butanol-hexanol [7].
SolvateDistanceCoulombicPolarisationDispersionRepulsionTotalInteraction
MeOH9.513−140.1−74.5−23.7169.4−68.9(a)
EtOH9.515−123.2−58.6−22.2136.4−67.6
PrOH9.527−136.8−69.6−23.1166.0−63.5
BuOH9.555−134.9−71.8−24.0156.4−74.2
PenOH9.517−143.5−81.1−24.3173.9−75.0
HexOH9.526−148.8−76.3−23.1174.3−73.8
MeOH9.631−55.5−25.1−10.664.0−27.2(b)
EtOH9.600−56.6−26.1−10.768.0−25.4
PrOH9.618−59.6−28.0−10.870.3−28.1
BuOH9.611−55.5−26.7−10.863.5−29.4
PenOH9.547−58.7−28.5−11.067.5−30.8
HexOH9.588−58.7−28.3−10.767.7−30.0
MeOH6.358−81.3−37.9−13.893.9−39.0(c)
EtOH6.849−85.7−42.3−14.1107.2−34.9
PrOH6.965−85.5−40.9−16.2104.5−38.1
BuOH6.961−84.3−41.9−15.4105.4−36.3
PenOH8.060−83.9−42.4−14.9101.3−40.0
HexOH8.481−82.7−40.4−14.7101.6−36.3
MeOH6.426−39.8−15.2−11.045.5−20.5(d)
EtOH6.889−41.8−15.1−10.045.5−21.3
PrOH7.823−35.5−12.9−9.337.7−20.0
BuOH7.399−41.6−16.0−11.346.7−22.1
PenOH8.909−39.1−14.7−9.542.8−20.5
HexOH9.423−39.0−14.1−9.342.9−19.5
MeOH3.465−15.3−4.5−48.437.2−31.0(e)
EtOH3.458−22.6−6.4−52.947.0−35.0
PrOH4.931−4.5−2.9−31.218.0−20.6
BuOH3.690−11.9−2.8−37.522.2−29.9
PenOH5.235−5.2−4.4−32.524.0−18.0
HexOH5.321−7.0−3.8−31.122.4−19.5
Publisher’s Note: MDPI stays neutral with regard to jurisdictional claims in published maps and institutional affiliations.

