Article

Effect of Temperature on Luminescence of LiNbO3 Crystals Single-Doped with Sm3+, Tb3+, or Dy3+ Ions

Division of Optical Spectroscopy, Institute of Low Temperature and Structure Research, Polish Academy of Sciences, Okólna 2, 50-422 Wrocław, Poland
*
Author to whom correspondence should be addressed.
Crystals 2020, 10(11), 1034; https://doi.org/10.3390/cryst10111034
Submission received: 8 October 2020 / Revised: 27 October 2020 / Accepted: 11 November 2020 / Published: 13 November 2020
(This article belongs to the Special Issue New Trends in Lithium Niobate: From Bulk to Nanocrystals)

Abstract

:
Crystals of LiNbO3 single-doped with Sm3+, Tb3+, or Dy3+ and crystal of LiTaO3 single-doped with Tb3+ were grown by the Czochralski method. Luminescence spectra and decay curves for LiNbO3 samples containing Sm3+ or Dy3+ ions were recorded at different temperatures between 295 and 775 K, whereas those for samples containing Tb3+ ions were recorded at different temperatures between 10 and 300 K. Optical absorption spectra at different temperatures were recorded within the UV-blue region relevant to optical pumping of the samples. It was found that the effect of temperature on experimental luminescence lifetimes consists of the initial temperature-independent stage followed by a steep decrease with the onset at about 700, 600, and 150 K for Sm3+, Dy3+, and Tb3+ ions, respectively. Additionally, comparison of temperature impact on luminescence properties of LiNbO3:Tb3+ and LiTaO3:Tb3+ crystals has been adequately described. Experimental results were interpreted in terms of temperature-dependent charge transfer (CT) transitions within the modified Temperature—Dependent Charge Transfer phenomenological model (TDCT). Disparity of the onset temperatures and their sequence were explained based on the location of familiar zigzag curves connecting the ground state levels of rare earth ions with respect to the band-gap of the host. It was concluded also that LiNbO3:Sm3+ is suitable as an optical sensor within the 500–750 K temperature region whereas LiNbO3:Dy3+ offers the highest sensitivity at lower temperatures between 300 and 400 K.

Graphical Abstract

1. Introduction

Originally proposed in 1964, LiNbO3 was soon applied in second harmonic generation, electro-optic modulation, acousto-optic, and piezoelectric device application [1]. Subsequent investigation has revealed that it is promising for holographic recording [2,3], optical parametric oscillation [4,5], waveguide lasers [6,7], or self-frequency doubled lasers [8].
However, despite the long-lasting technological success, some fundamental properties of LiNbO3 remain rather puzzling. One of encountered difficulties refers to the reliability of its band gap. Numerous reported band gap values, all inferred from optical absorption spectra, range from 3.28 [9] to 4.3 eV [10] with the most frequently cited value of 3.78 eV. This is due mainly to the fact that the LiNbO3 crystals, suitable for optical application, are fabricated commonly by the Czochralski method from a congruent, lithium deficient melt (Li/Nb = 0.94). Hence, they have a high density of point defects which affect the reliability of the measurement. Even with special care near where stoichiometric crystals have grown, recorded optical absorption spectra still suffered from remaining structural defects. Numerous attempts have been made to determine the band gap from ab initio calculations. The calculated band gap values depended markedly on the method applied, ranging from 3.47 to 6.53 eV [11]. Authors of a subsequent paper [12] entitled: “Do we know the band gap of lithium niobate?” have reported the calculated band gap value of 4.7 eV and more recently, the calculated band gap value of 4.9 eV has been reported in [13].
Much attention has been paid in the past to the nature of defects in crystal structures of isostructural LiNbO3 and LiTaO3 compounds. In the ideal, stoichiometric composition of the cations Nb5+, Li+, and free sites are located sequentially in distorted octahedra of oxygen ions. The distribution of cations among available sites in congruent LiNbO3 crystals is not easy, however. In the past it has been interpreted in the framework of the Nb-site vacancy model [14]. Later on, it has been concluded that the Nb split models in which the excess of Nb atoms are distributed among the Li and the vacant cation sites cannot be excluded [15]. The same difficulty relates to the location of incorporated luminescent rare earth ions. Investigation of Eu3+ sites in LiNbO3:Eu3+ and LiNbO3:MgO:Eu3+ crystals for different Li/Nb molar ratios has led to the conclusion that Eu3+ ions substitute the Li+ and Nb5+ ions [16]. The RBS/channeling spectra of Pr3+, Ho3+, Yb3+ ions in LiNbO3 revealed that they substitute Li+ ions but are slightly shifted from the regular Li+ position [17]. In a more recent paper dealing with structural and optical properties of powders of LiTaO3 doped with Eu3+ ions the authors have observed that the Eu3+ ions substitute preferentially the Ta5+ ions [18]. Moreover, it was found that this preference increases with increasing Eu3+ concentration (an occupation fraction above 60% for Eu3+ concentration of 1 at %). In the present work we deal with LiNbO3 crystal single-doped with Sm3+, Tb3+, or Dy3+ ions characteristic in that the relaxation of their metastable levels consists essentially of radiative transitions in virtually all inorganic hosts.
In fact, spectroscopic features of Sm3+-doped crystals and glasses stem from the energy level scheme of Sm3+ ions that consist of low-energy multiplets from the 7F and 7H terms and a higher-energy group of multiplets from quartet terms. The energy difference between the quartet and septet states is large as compared to the phonon energy encountered in inorganic matrices. Therefore, the relaxation of the 4G5/2 metastable level of Sm3+ consists essentially of radiative transitions providing an efficient visible emission. Its spectral distribution within the blue, yellow, and red regions is weakly affected by the change of a host [19,20,21,22,23,24]. Spectroscopic properties of Tb3+-doped hosts stem from the energy level scheme of Tb3+ ions involving low-energy multiplets from the 7F term and higher-energy multiplets from quintet terms. The metastable 5D4 level of Tb3+ is located higher than the next lower energy 7F0 level by about 14,000 cm−1. Therefore, its relaxation consists essentially of radiative transitions providing an efficient visible emission. Literature concerning spectroscopic features of Tb3+ doped luminescent materials is rather rich. The mechanism of the 5D35D4 cross-relaxation in Y3Al5O12:Tb3+ was considered in [25]. Several papers were devoted to preparation and spectroscopic features of terbium-doped garnet crystals [26,27,28,29]. Other visible phosphors containing Tb3+ ions that have been studied include Y2LuCaAl2SiO12:Ln (Ln = Ce3+, Eu3+, and Tb3+) [30], Tb3+ doped lithium lead alumino borate glasses [31], Tb3+-doped KLu(WO4)2 crystal [32], Tb3+-doped LiYF4 [33], Tb3+-doped K3YF6 [34]. Laser potential and laser performance of Tb3+-doped hosts have been considered, too [35]. Spectroscopic properties of Dy3+-doped materials stem from the energy level scheme of Dy3+ ions that consists of high-energy multiplets from quartet terms well separated from low-energy multiplets belonging to the 6H and 6F terms. The visible emission of Dy3+ results from radiative transitions that originate on the metastable 4F9/2 level and terminate on the lower-energy levels 6HJ (J = 9/2, 11/2, 13/2, and 15/2). Numerous recent papers have been devoted to Phosphor materials single-doped with Dy3+ [36], co-doped with Dy+Eu [37] or triple-doped with Dy+Eu+Tb [38] have been investigated and found promising for novel lighting devices. The potential of Dy3+-doped crystals as luminescent temperature sensors has been considered in numerous papers [39,40,41]. It has been demonstrated that YAG:Dy3+ crystal pumped at 447 nm with a GaN laser diode is able to show yellow laser operation with a slope efficiency of 12% [42]. Optical amplification in Dy3+-doped Gd2SiO5, Lu2SiO5, and YAl3(BO3)4 single crystals has been observed [43] as well. Intention of the present work is to get a closer insight into temperature-dependent processes which are relevant for excited state relaxation of incorporated rare earth ions and to assess the impact of these processes on the potential of system studied for luminescence temperature sensing.

2. Materials and Methods

Single-doped crystals of LiNbO3 containing nominally 0.65 wt% (1.2 × 10²⁰ ions/cm3) of Sm3+, 2.80 wt% (4.8 × 10²⁰ ions/cm3) of Tb3+, or 1.94 wt% (3.3 × 10²⁰ ions/cm3) of Dy 3+ were grown by the Czochralski method from the congruent melt (Li/Nb = 0.945). By the same method a 3 wt% Tb3-doped LiTaO3 crystal was grown creating thereby a reference material to help understand the LiNbO3:Tb3+ luminescence. The Czochralski growth of LiNbO3 and LiTaO3 crystals has been well known for decades and is described in detail elsewhere, e.g., in [44]. Concentrations given above stem from the trade-off between the intention to achieve required excitation efficiency, on one hand, and to prevent the excessive distortion of the host structure, on the other hand. A Varian 5E UV-VIS-NIR spectrophotometer with instrumental spectral bandwidths of 0.5 nm was employed to record optical absorption spectra in the UV-blue spectral region. To record excitation spectra and luminescence spectra a FLS980 fluorescence spectrophotometer from Edinburg Instruments equipped with a 450 W xenon lamp as an excitation source and a Hamamatsu 928 PMT detector was used. For these measurements, the samples were excited with unpolarized light propagating parallel to the optical axis of the crystal and the luminescence was observed perpendicular to the optical axis of the crystal. Recorded spectra were corrected for the sensitivity and wavelength of the experimental set-up. To record decay curves of luminescence an experimental set-up consisting of a tunable optical parametric oscillator (OPO) pumped by a third harmonic of a Nd:YAG laser, a double grating monochromator with a 1000 mm focal length, a photomultiplier, and a Tektronix MDO 4054B-3 Mixed Domain Oscilloscope was used. For spectroscopic measurement at low temperature the samples were placed in an Oxford Model CF 1204 continuous flow liquid helium cryostat equipped with a temperature controller. A chamber furnace was used for measurements at higher temperature within 295–800 K. The temperature of samples was detected by a copper-constant thermocouple with measurement error less than 1.5 K and controlled by a proportional-integral-derivative (PID) Omron E5CK controller.

3. Results

When interpreting our experimental data, we refer to energy level schemes for Sm3+, Tb3+, and Dy3+ ions gathered in Figure 1. The energy levels within respective 4f5, 4f8, and 4f9 configurations are labeled by symbols 2S+1LJ of corresponding multiplets.
It can be seen that there is a correspondence between term structures for Sm3+ and Dy3+ ions in agreement with the principle of electrons and holes in the 4fn configurations. Actually, each multiplet of rare earth ions incorporated in the crystal host is split by the crystal field into crystal field components. In depth analysis of the crystal field splitting of multiplets for Sm3+ and Dy3+ ions in LiNbO3 has been performed based on low temperature absorption and emission spectra and reported in [45,46], respectively. These results were used to construct corresponding energy level schemes shown in Figure 1. To our knowledge the information concerning the crystal field splitting of Tb3+ in LiNbO3 is not available. Therefore, we include in Figure 1 the data for Tb3+ in GAGG garnet reported in [29]. It should be noticed here that the agreement between theoretical and experimental crystal field splitting inferred from low temperature spectra of rare earth ions in LiNbO3 is poor owing to multi-site location of incorporated ions combined with a strong inhomogeneous line broadening of their optical spectra. Other consequences result from a strongly defective congruent composition of the hosts crystal. The LiNbO3 forms crystals that belong to trigonal/rhombohedral system, R3c space group, hence they are optically uniaxial. Incorporated rare earth ions enter sites with the C3 local symmetry in the stoichiometric composition but in congruent LiNbO3 they are located in several nonequivalent sites with strongly dissimilar local symmetries. As a consequence, the anisotropy of their transition intensities is no longer consistent with theoretical predictions preventing thereby the reliable interpretation of polarized optical spectra, as observed in [45,46]. To avoid the difficulties mentioned above and remembering that effect of temperature on integrated luminescence intensity is independent of polarization of optical spectra we infer our results from unpolarized luminescence spectra.
In the limit of low doping level, the population of an excited multiplet decays by competing radiative transitions and nonradiative multiphonon relaxation consisting of simultaneous emission of several phonons. The contribution of the latter process is commonly assessed from the phenomenological energy gap law which relates the rate of multiphonon relaxation to the order of the process defined as the ratio of energy separation between the excited level in question and a next lower level to the cut-off phonon energy available in the host. It follows from the Raman spectra analysis of LiNbO3 and LiTaO3 crystals that the highest energy stretching vibrations Nb-O are around 610 cm−1 (597 cm−1 for Ta-O) [47]. Thus, Sm3+, Tb3+, and Dy3+ ions in LiNbO3 have single metastable levels able to relax radiatively without multiphonon contribution providing thereby intense luminescence. Downward arrows in Figure 1 indicate radiative transitions observed in the visible region.

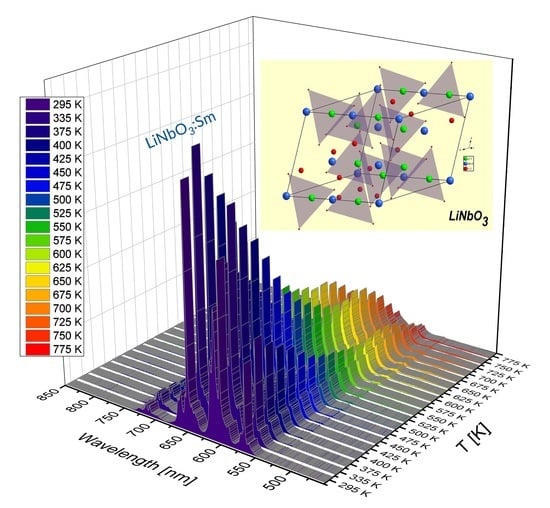
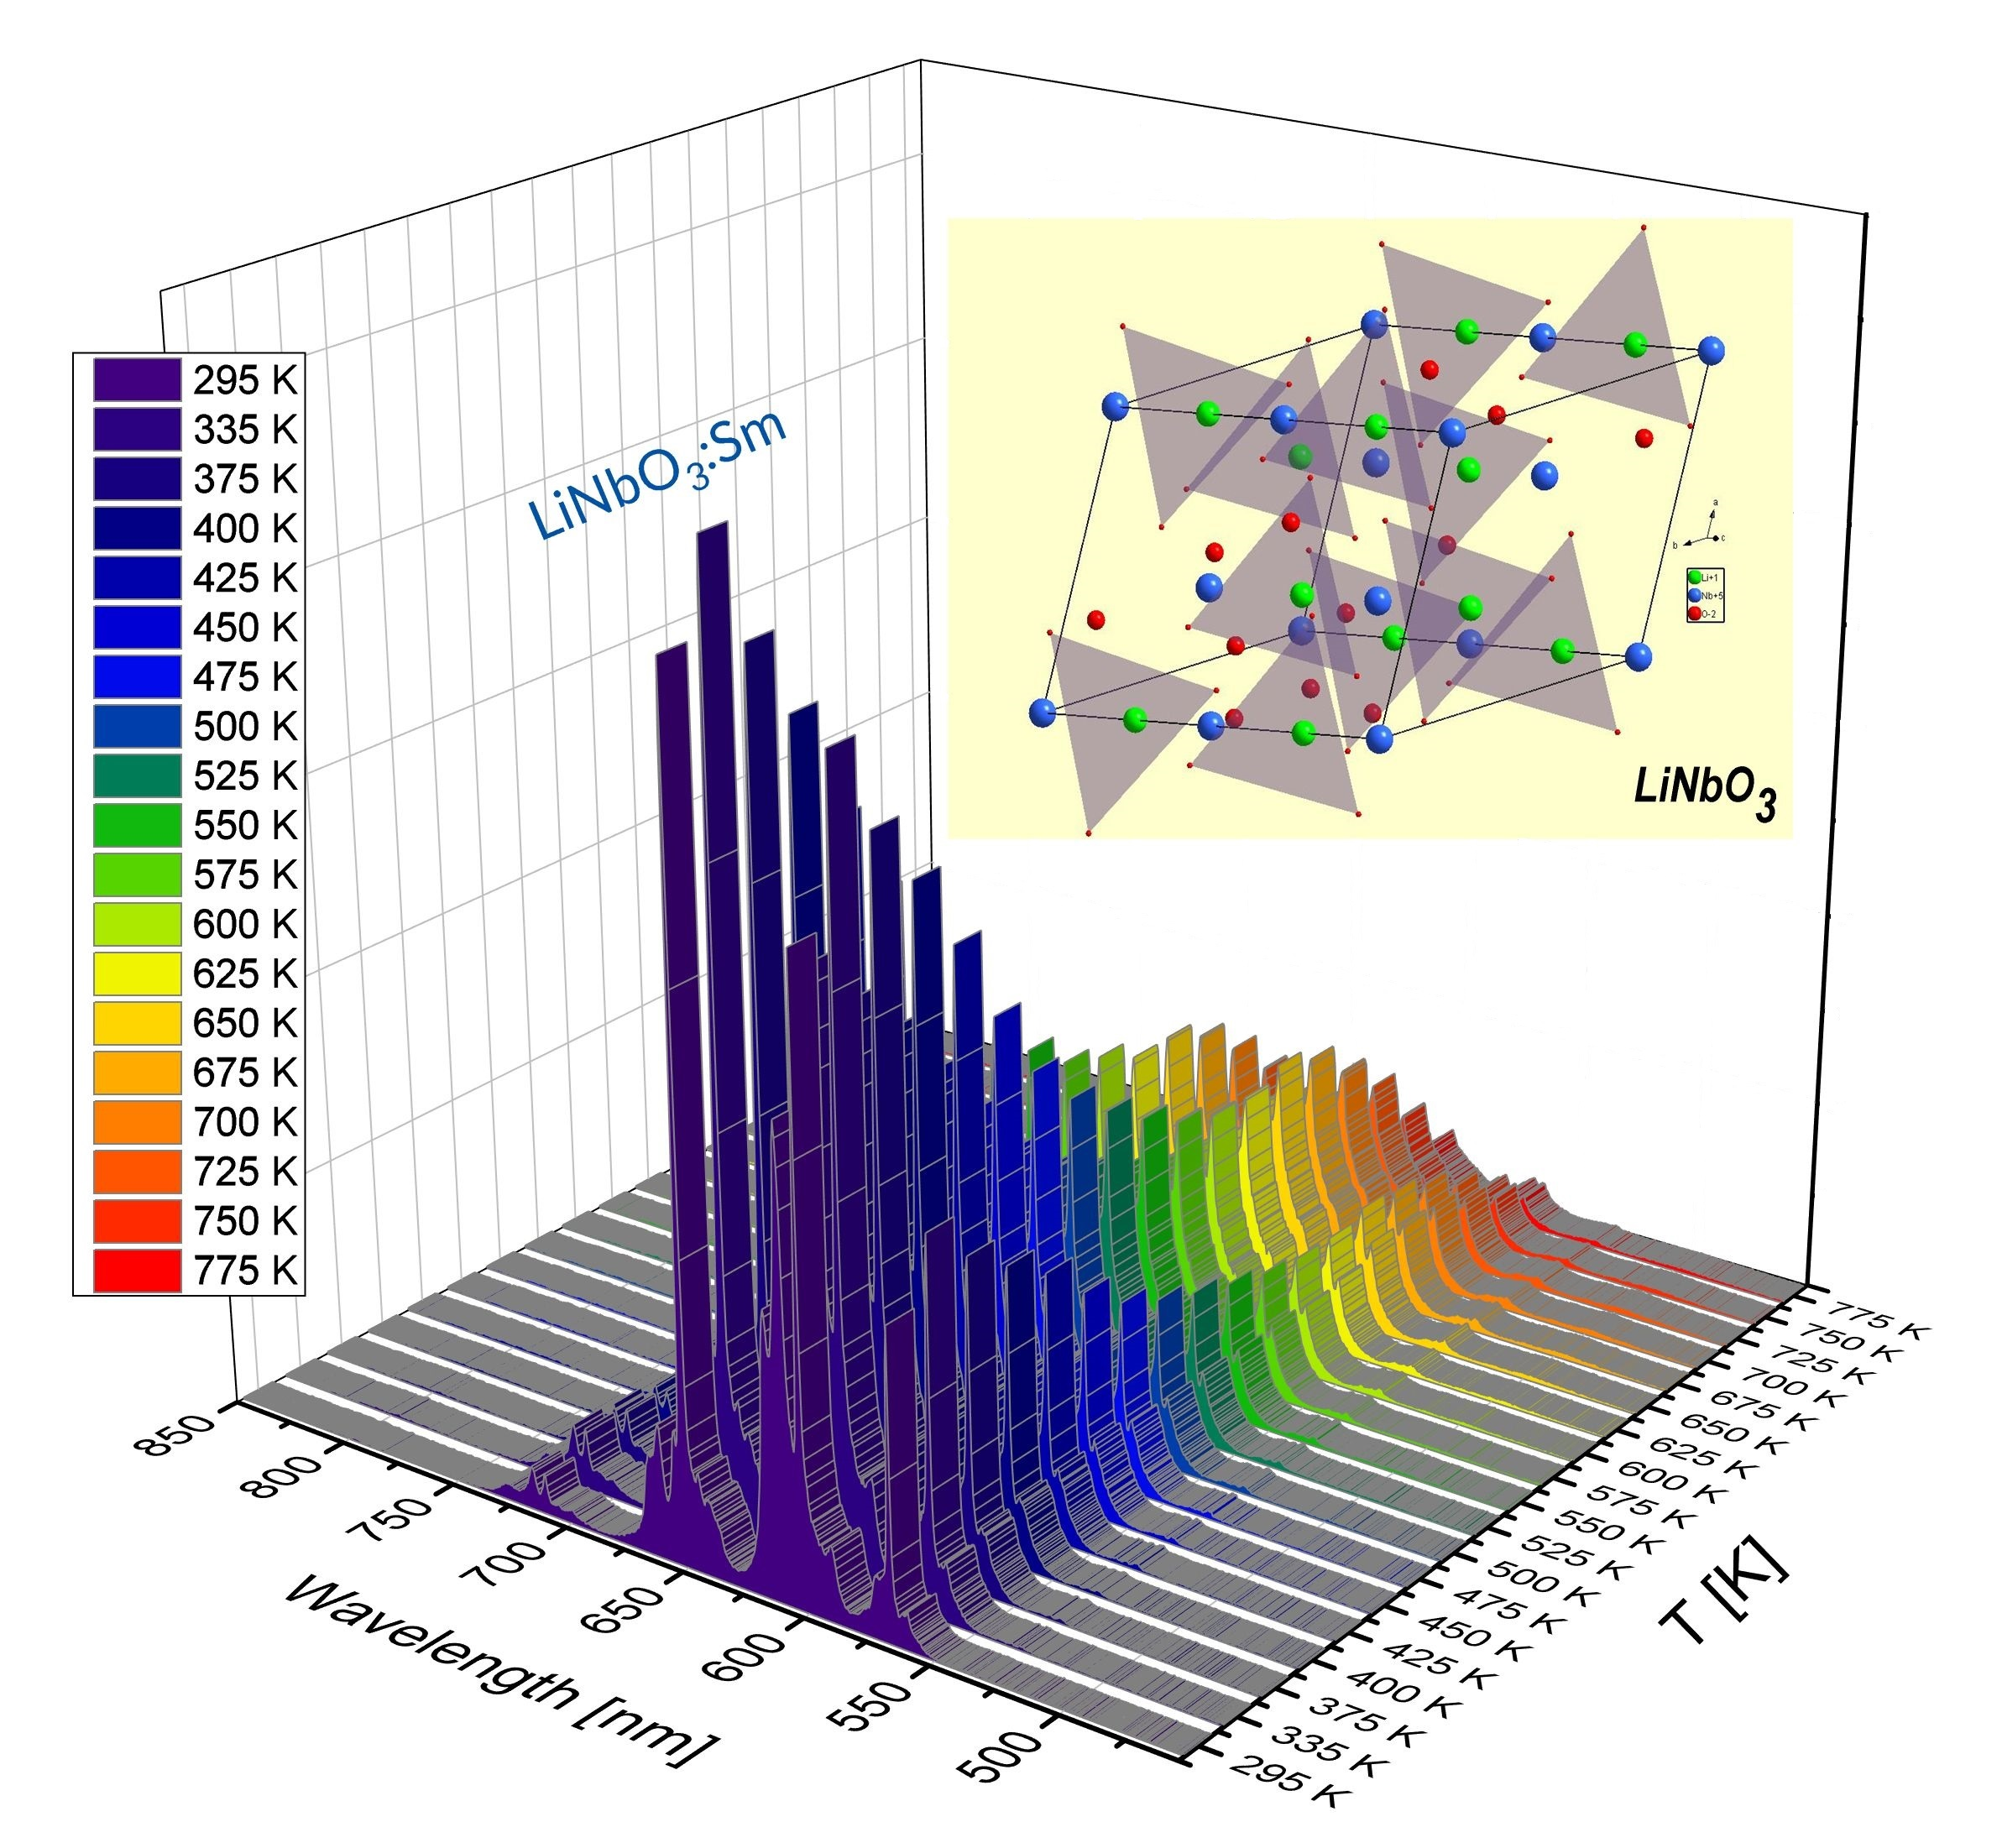
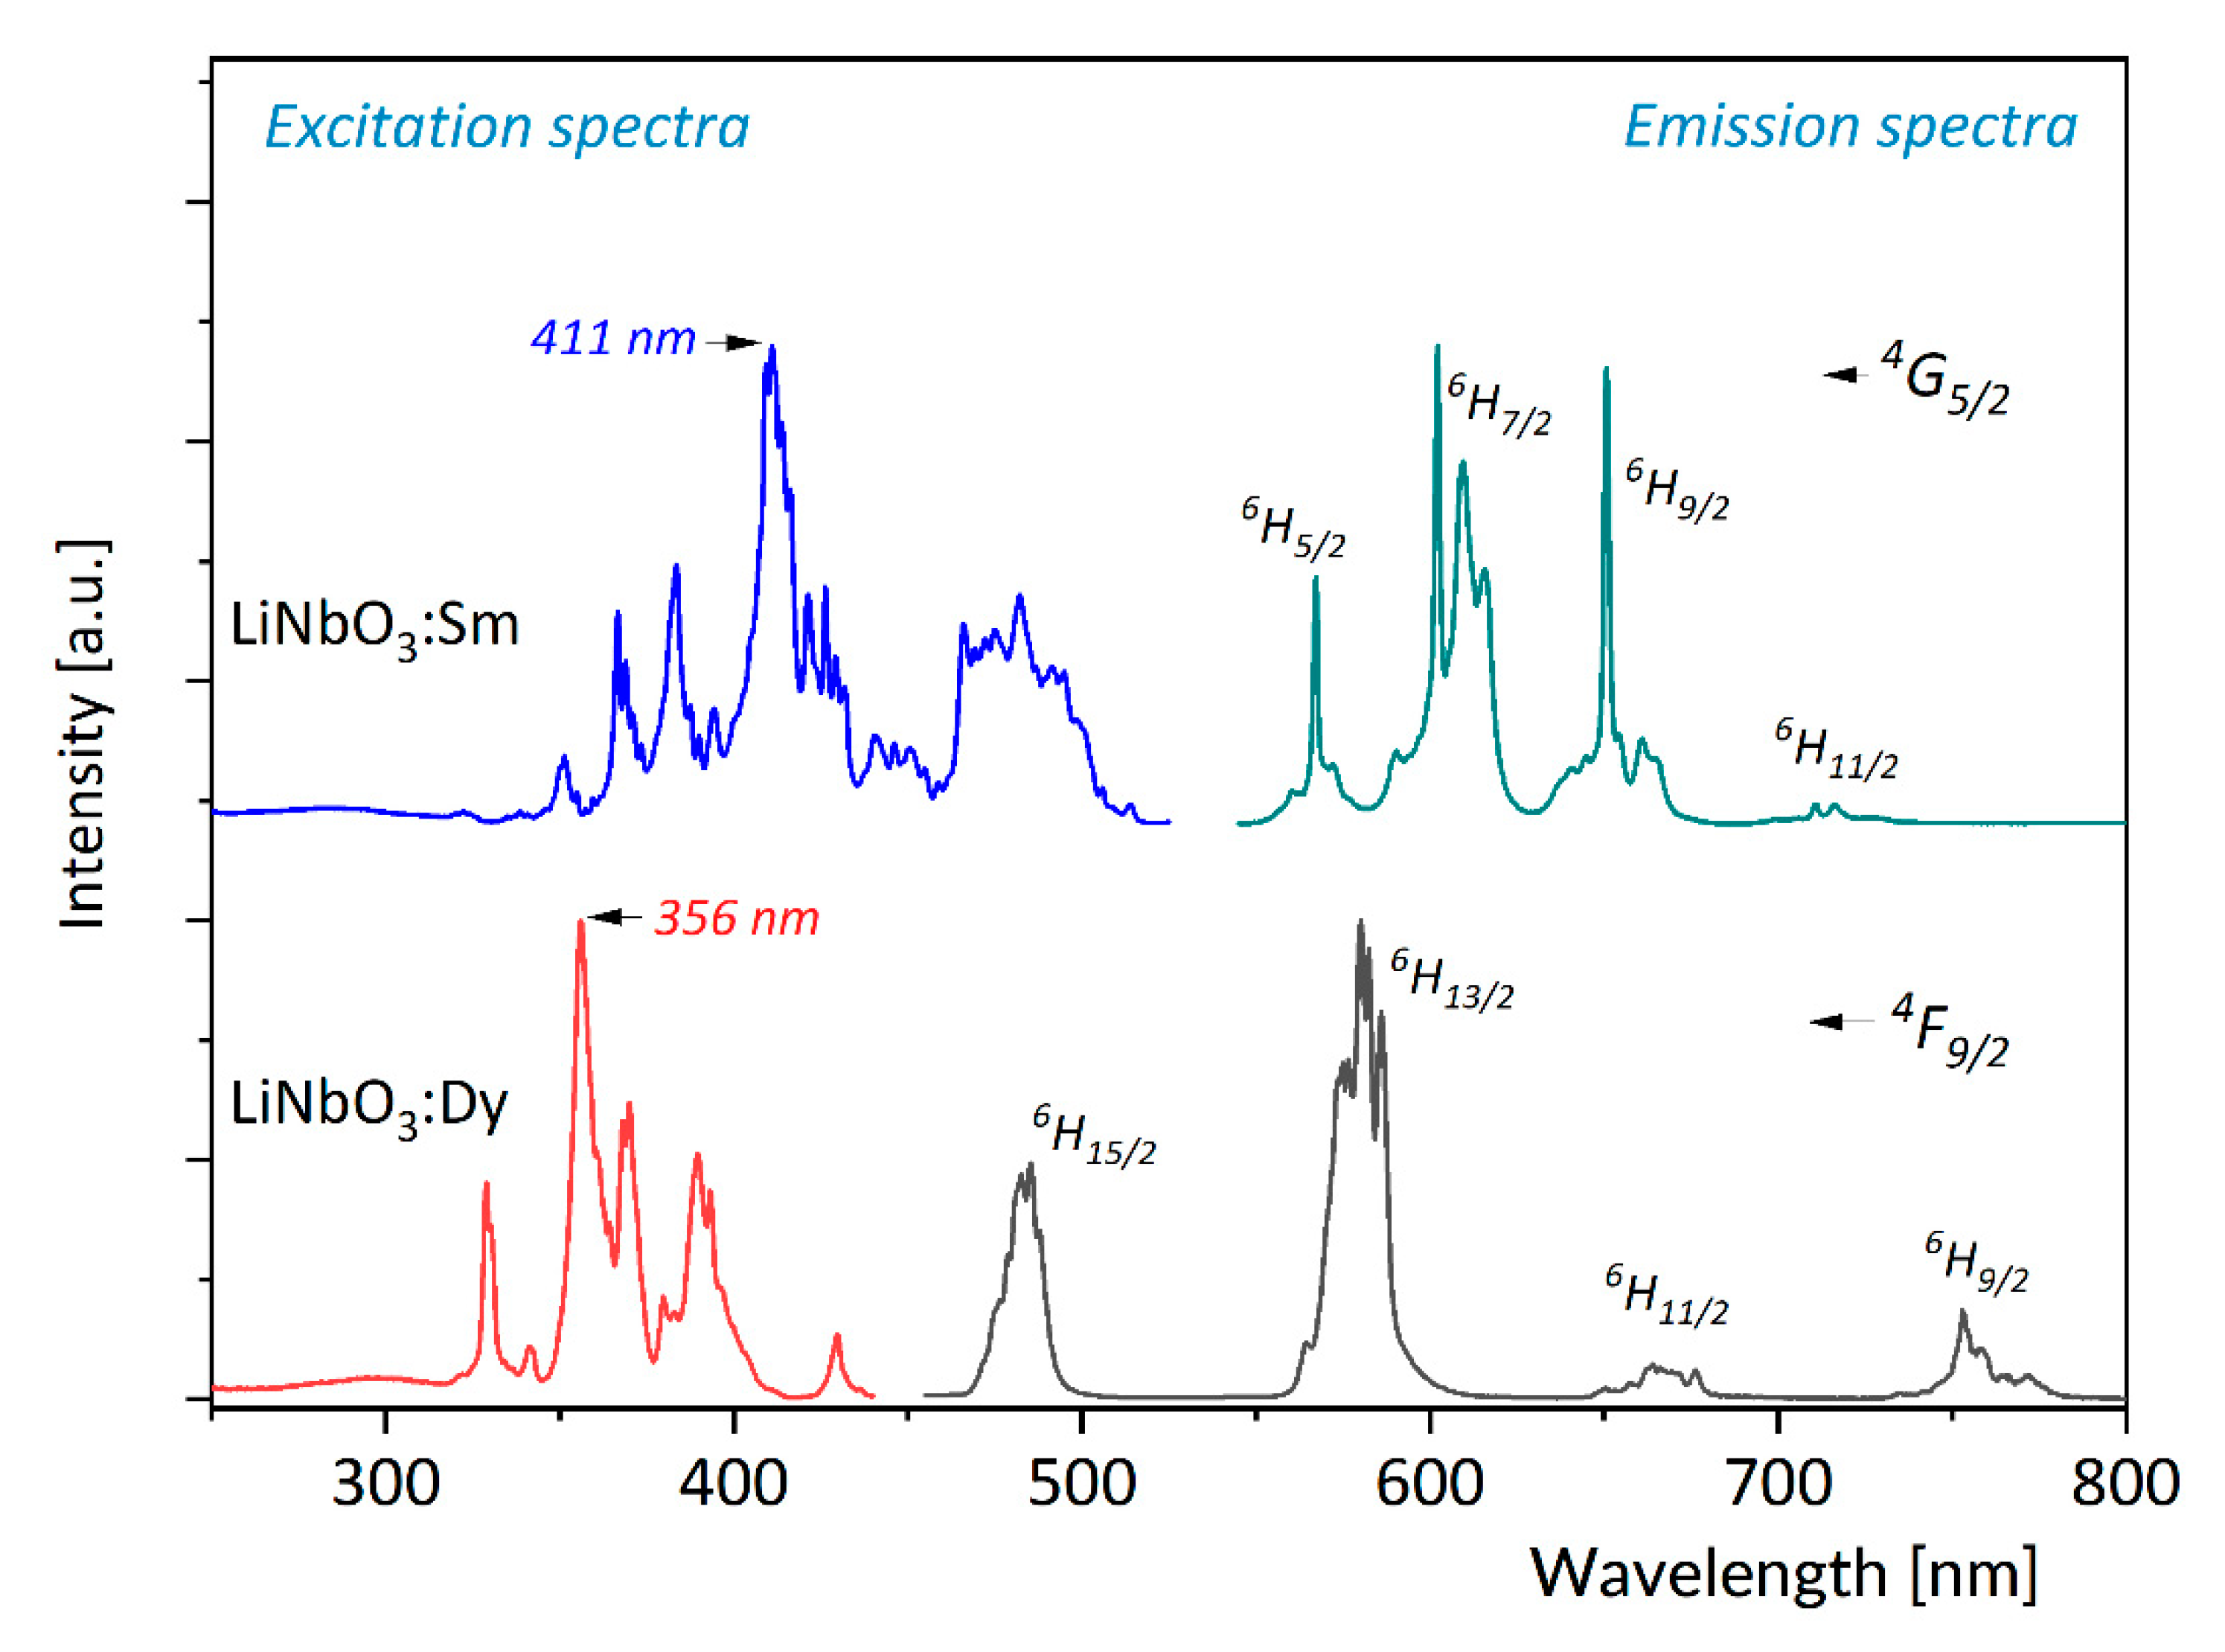
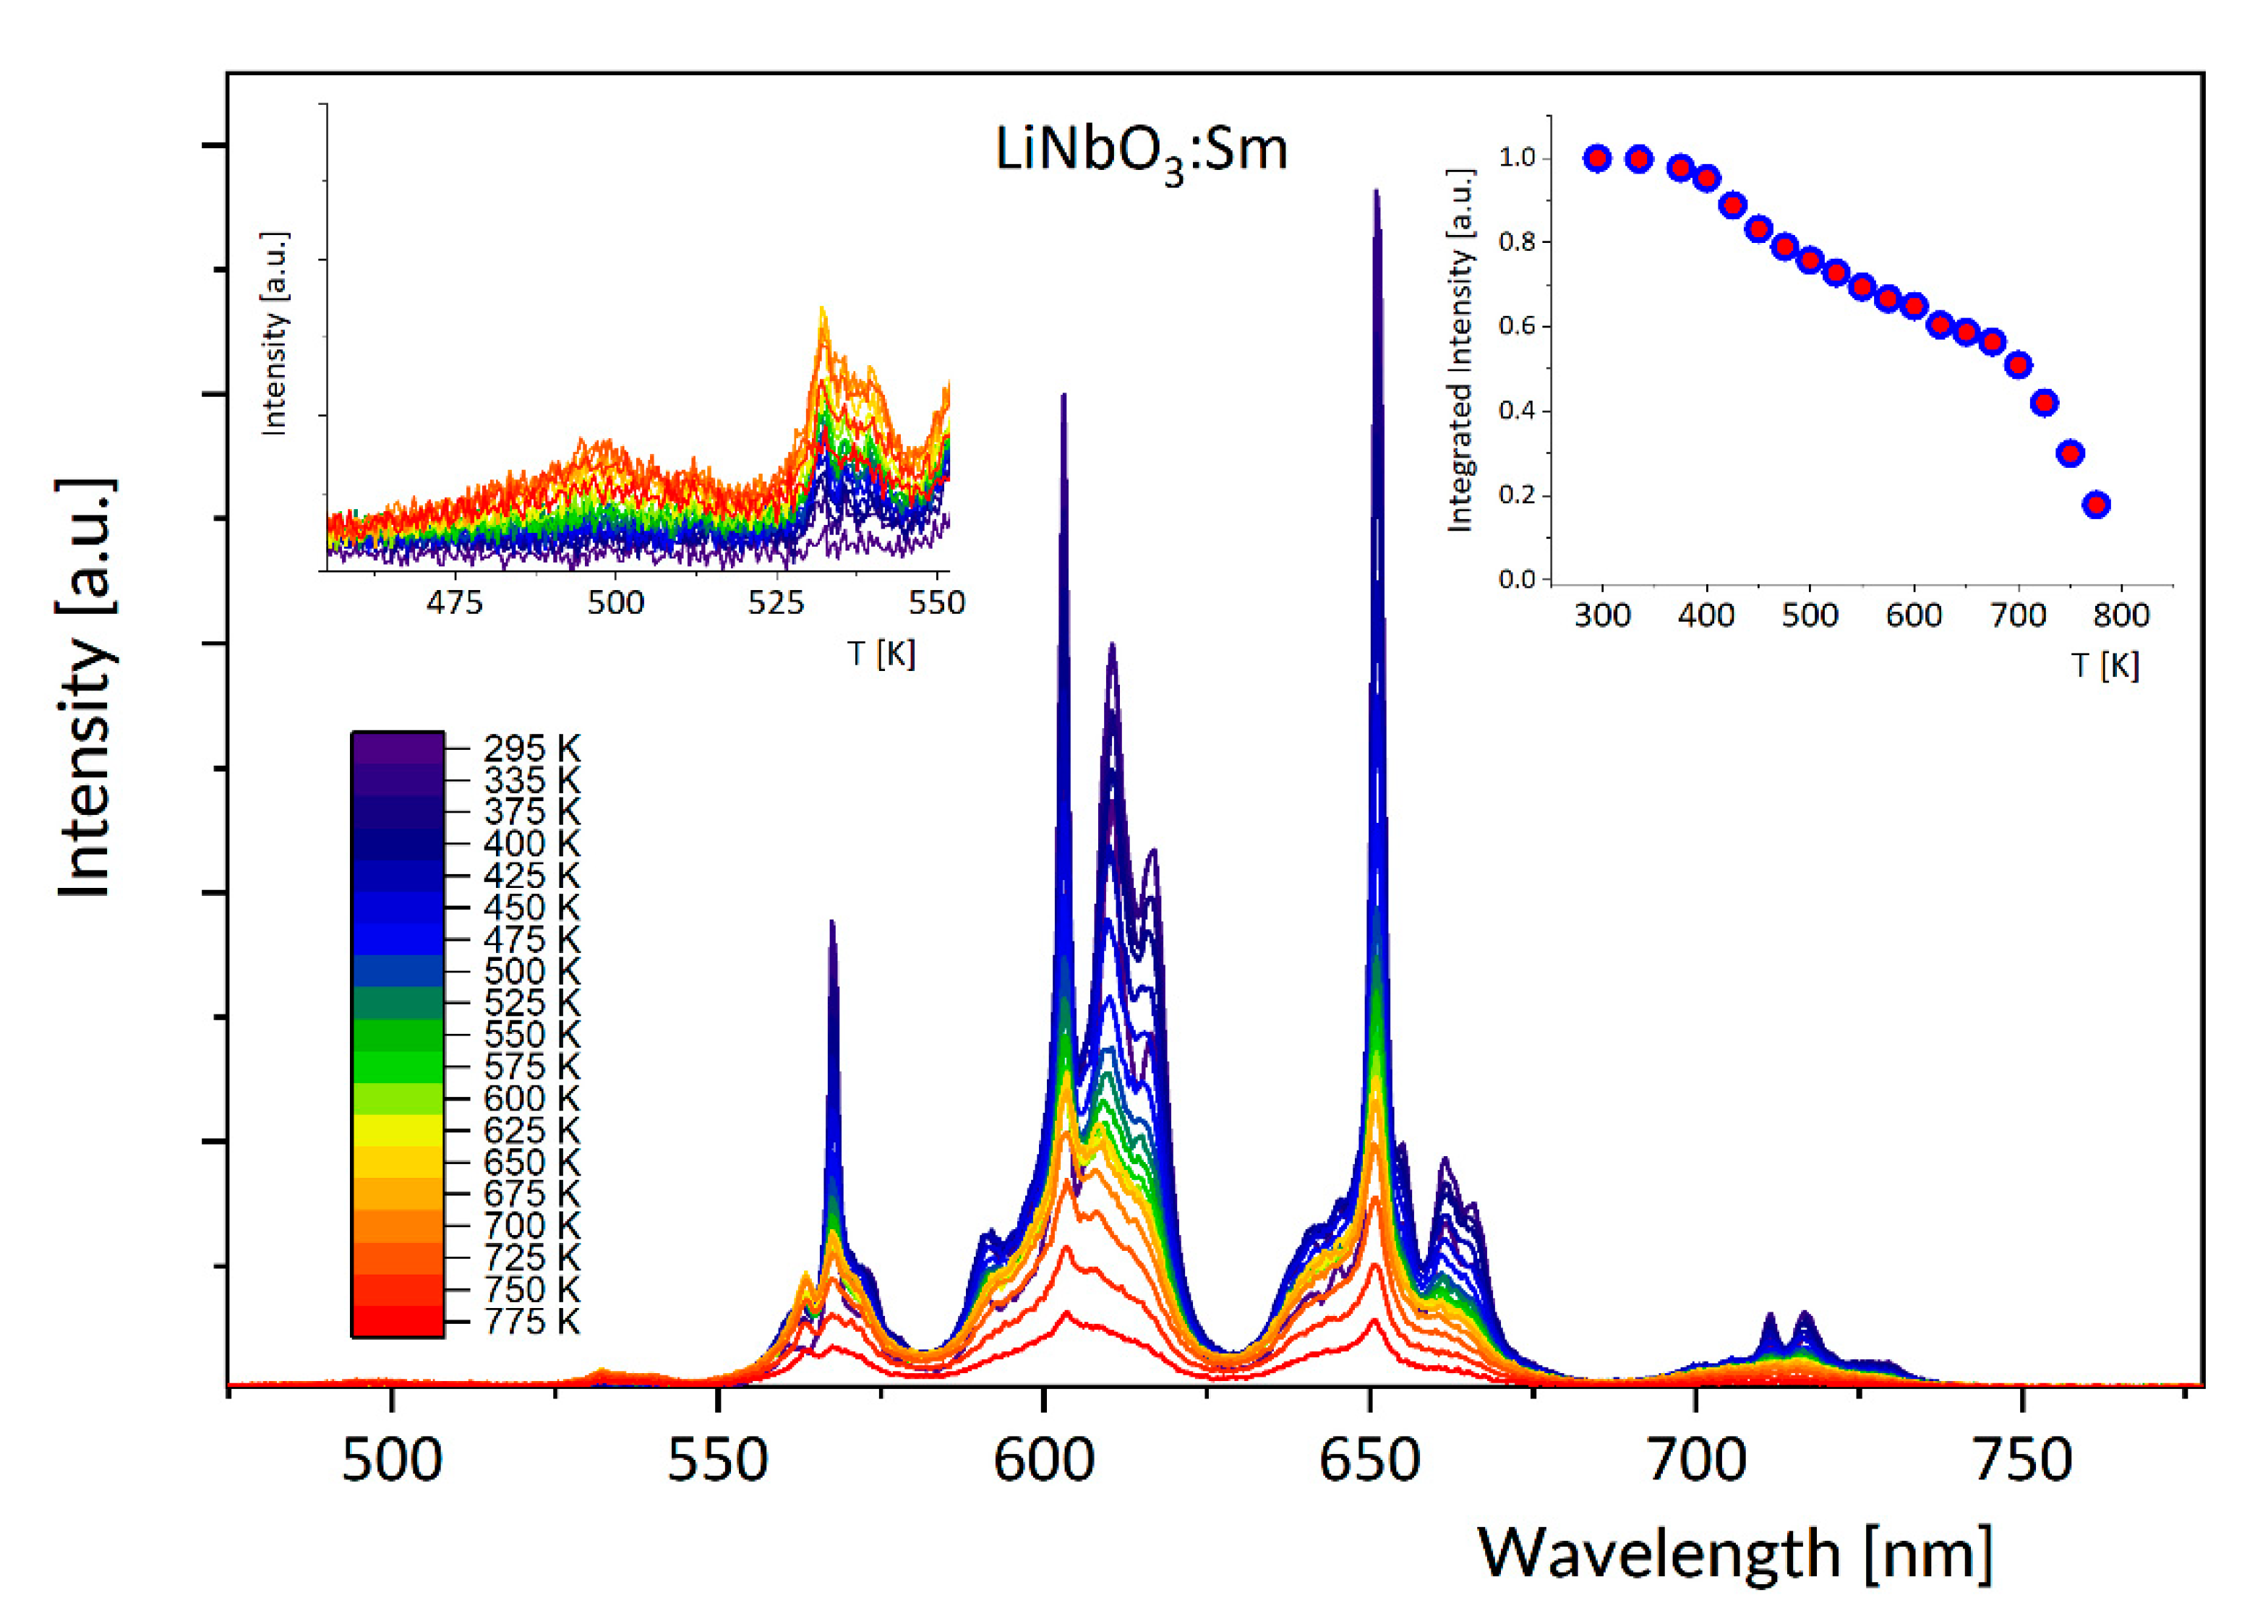
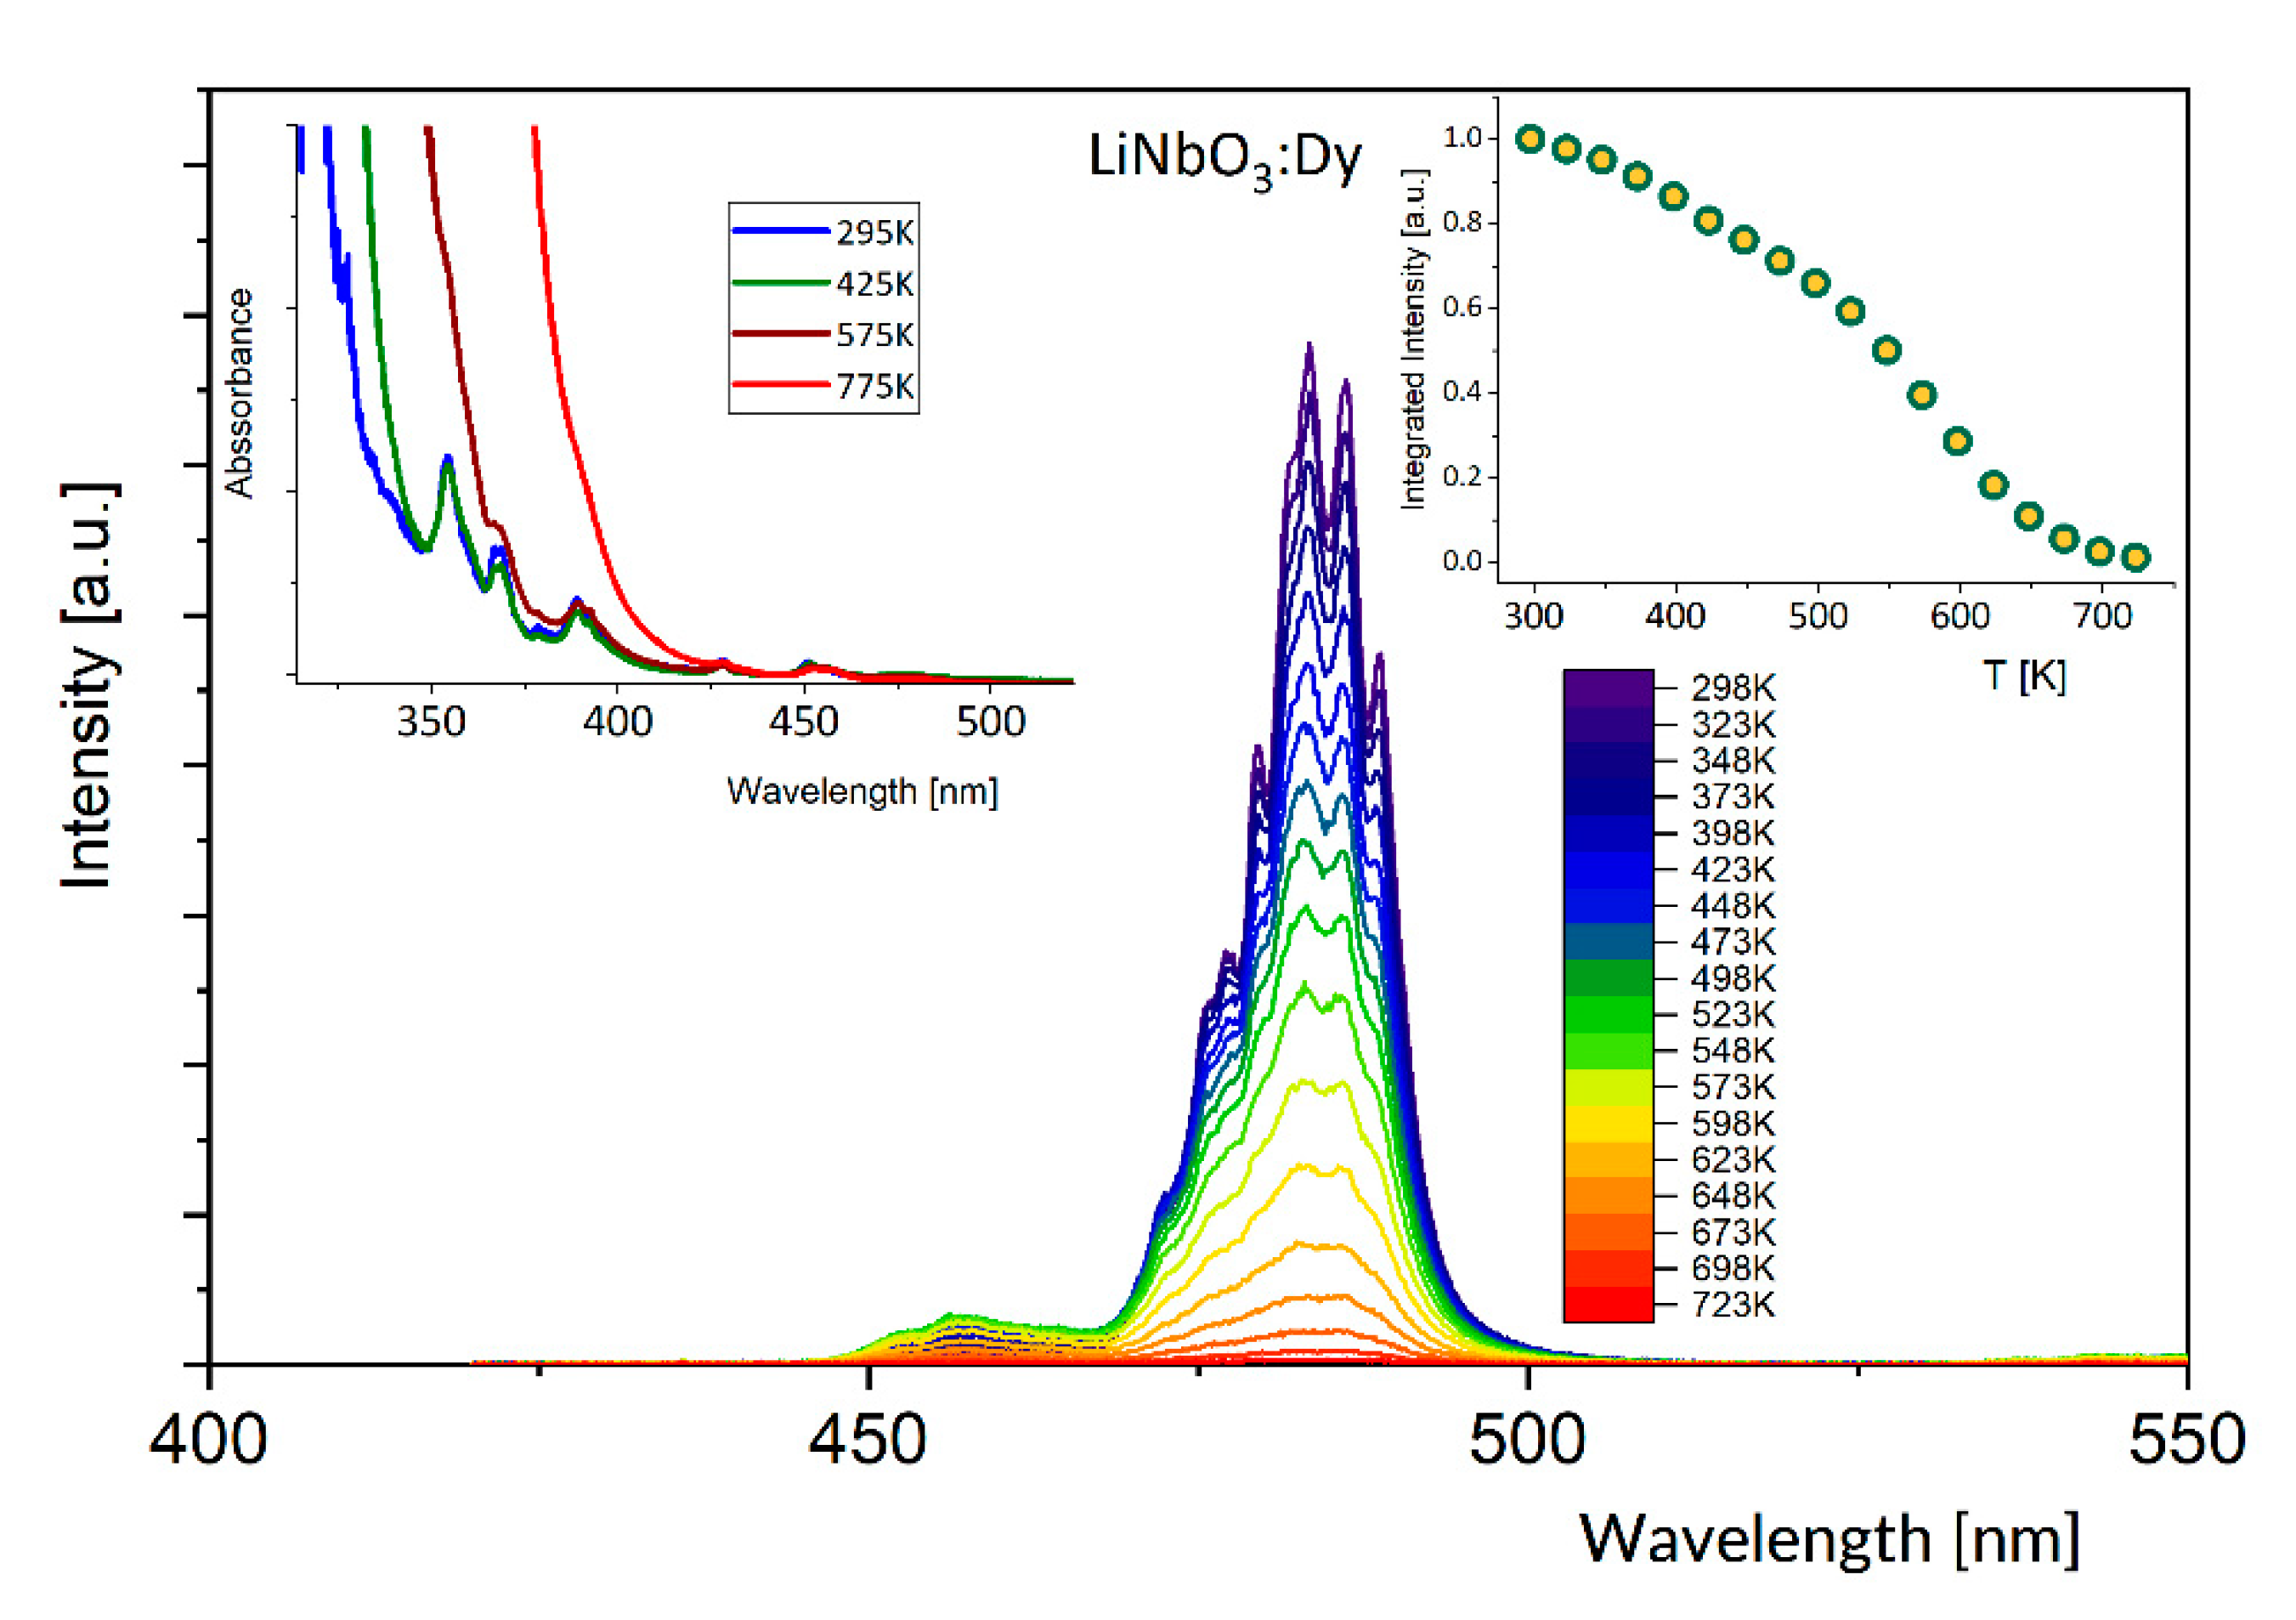
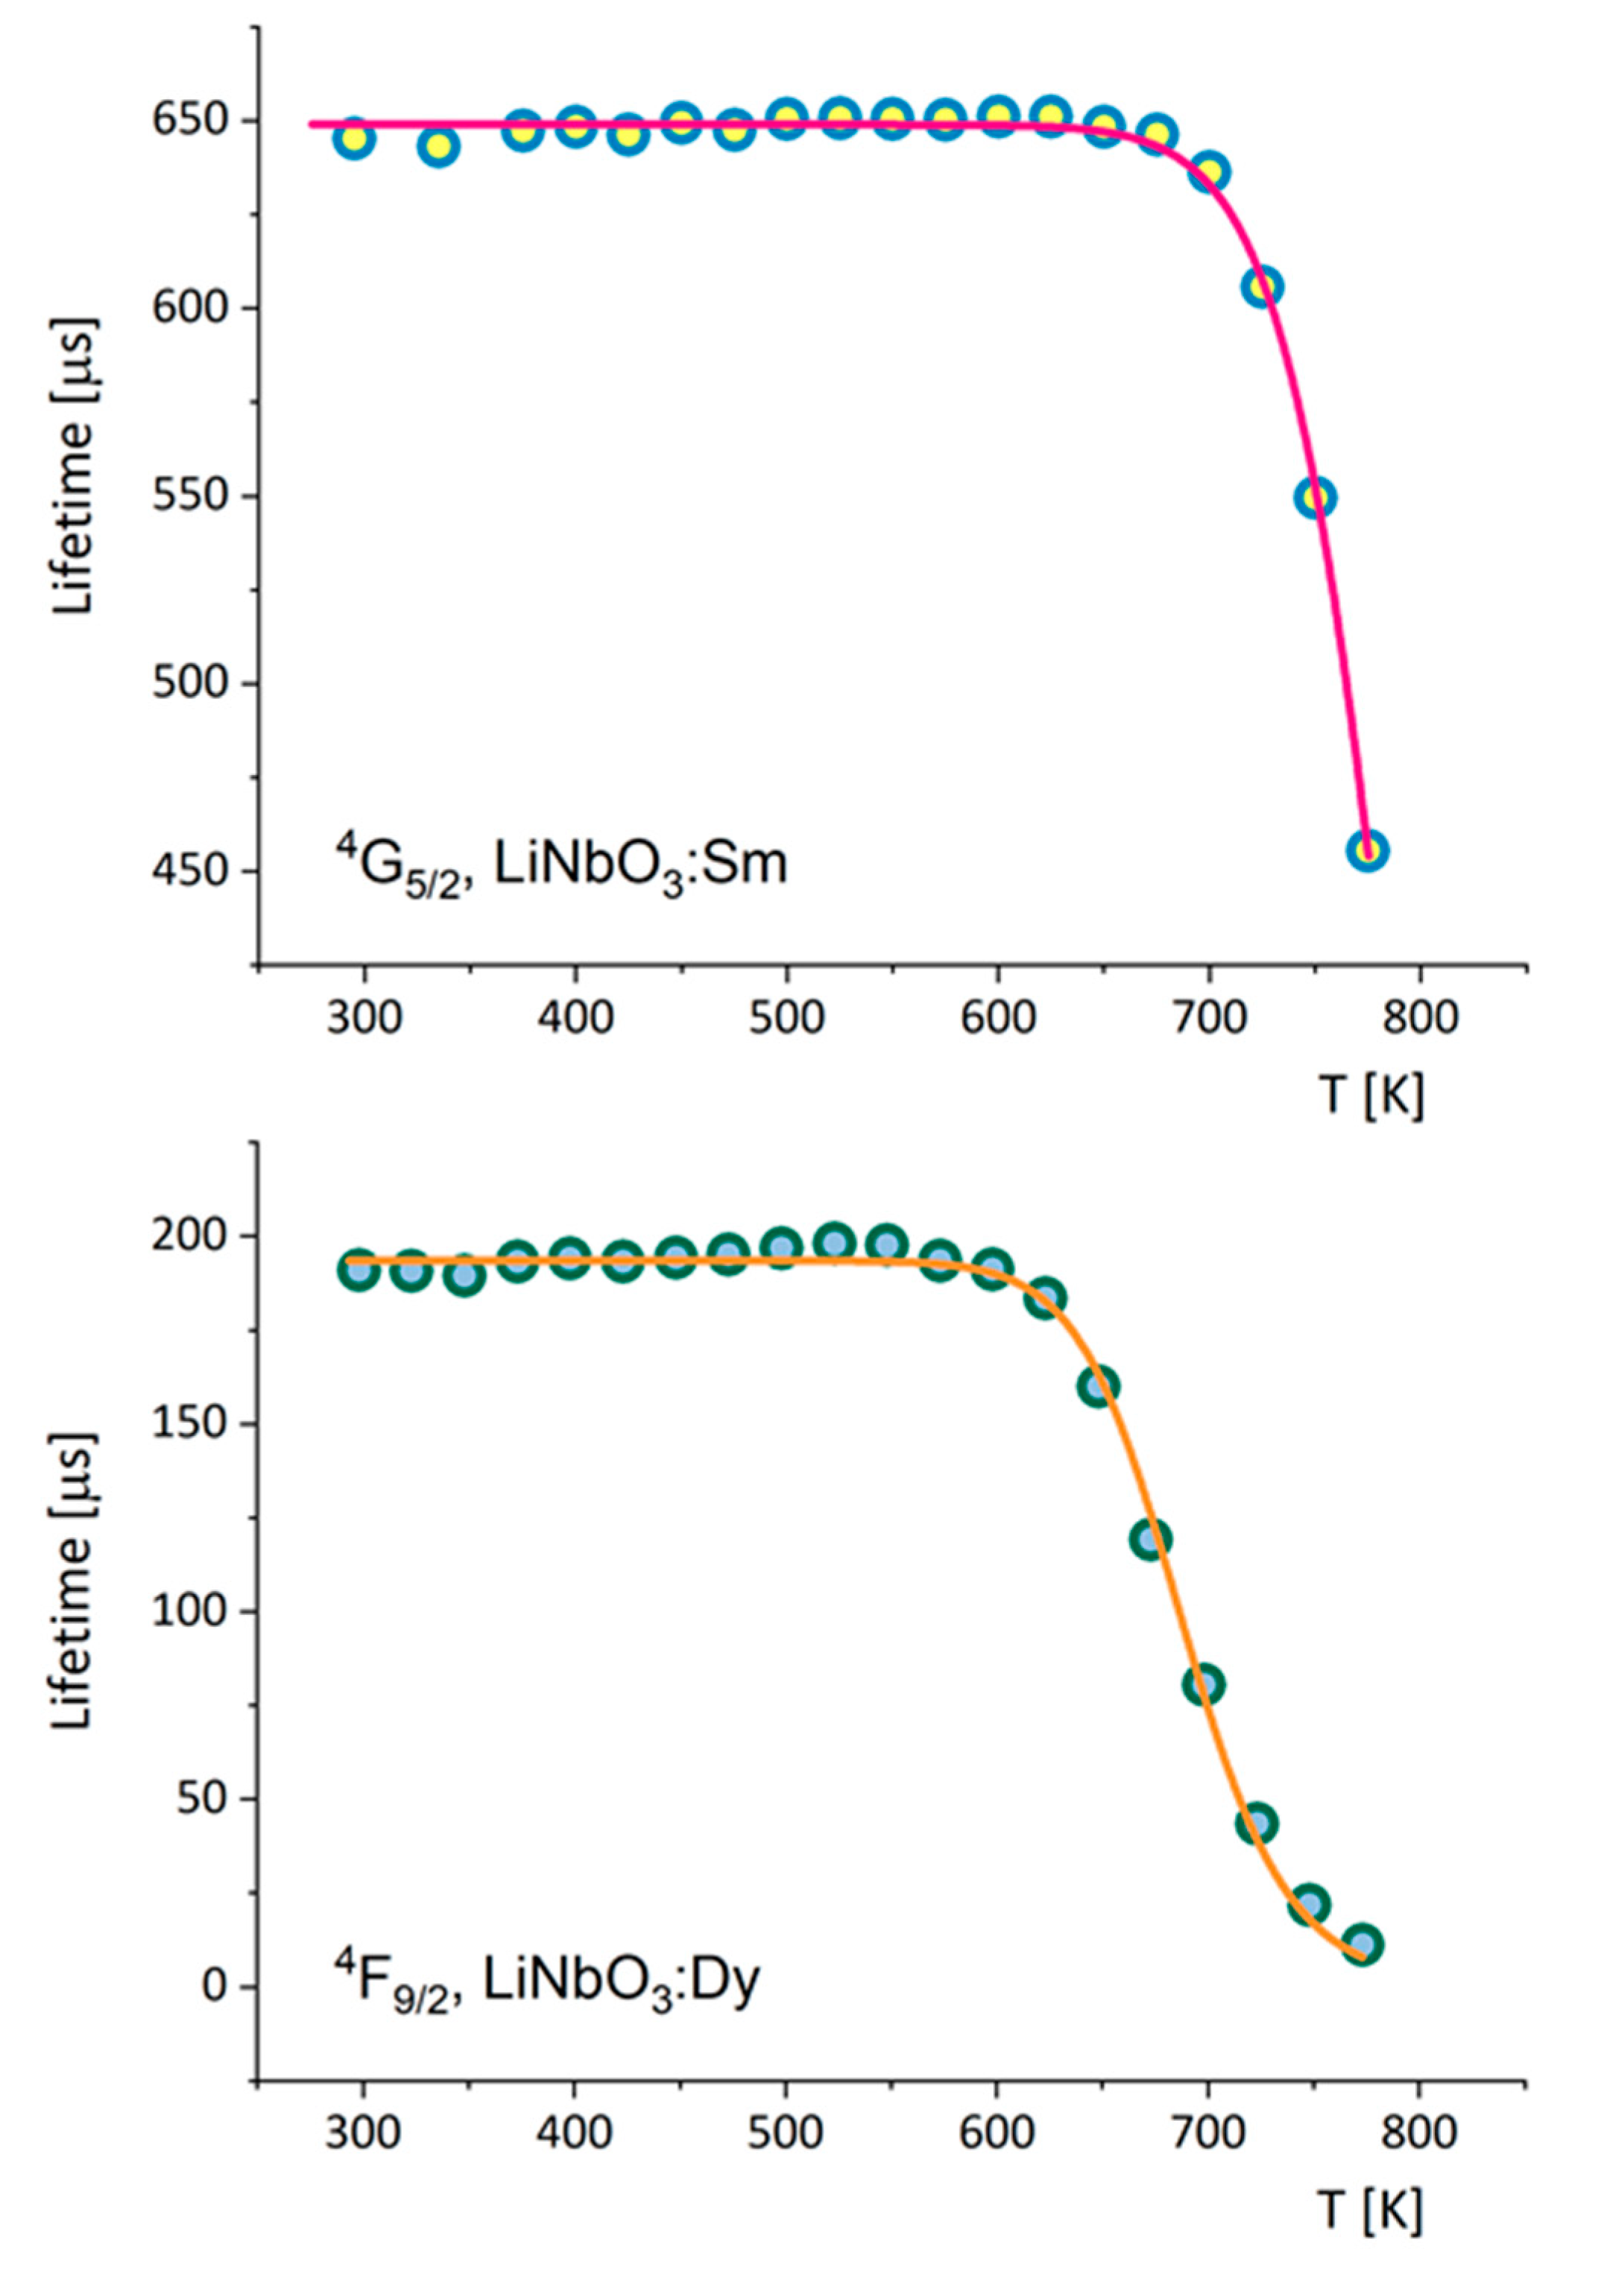
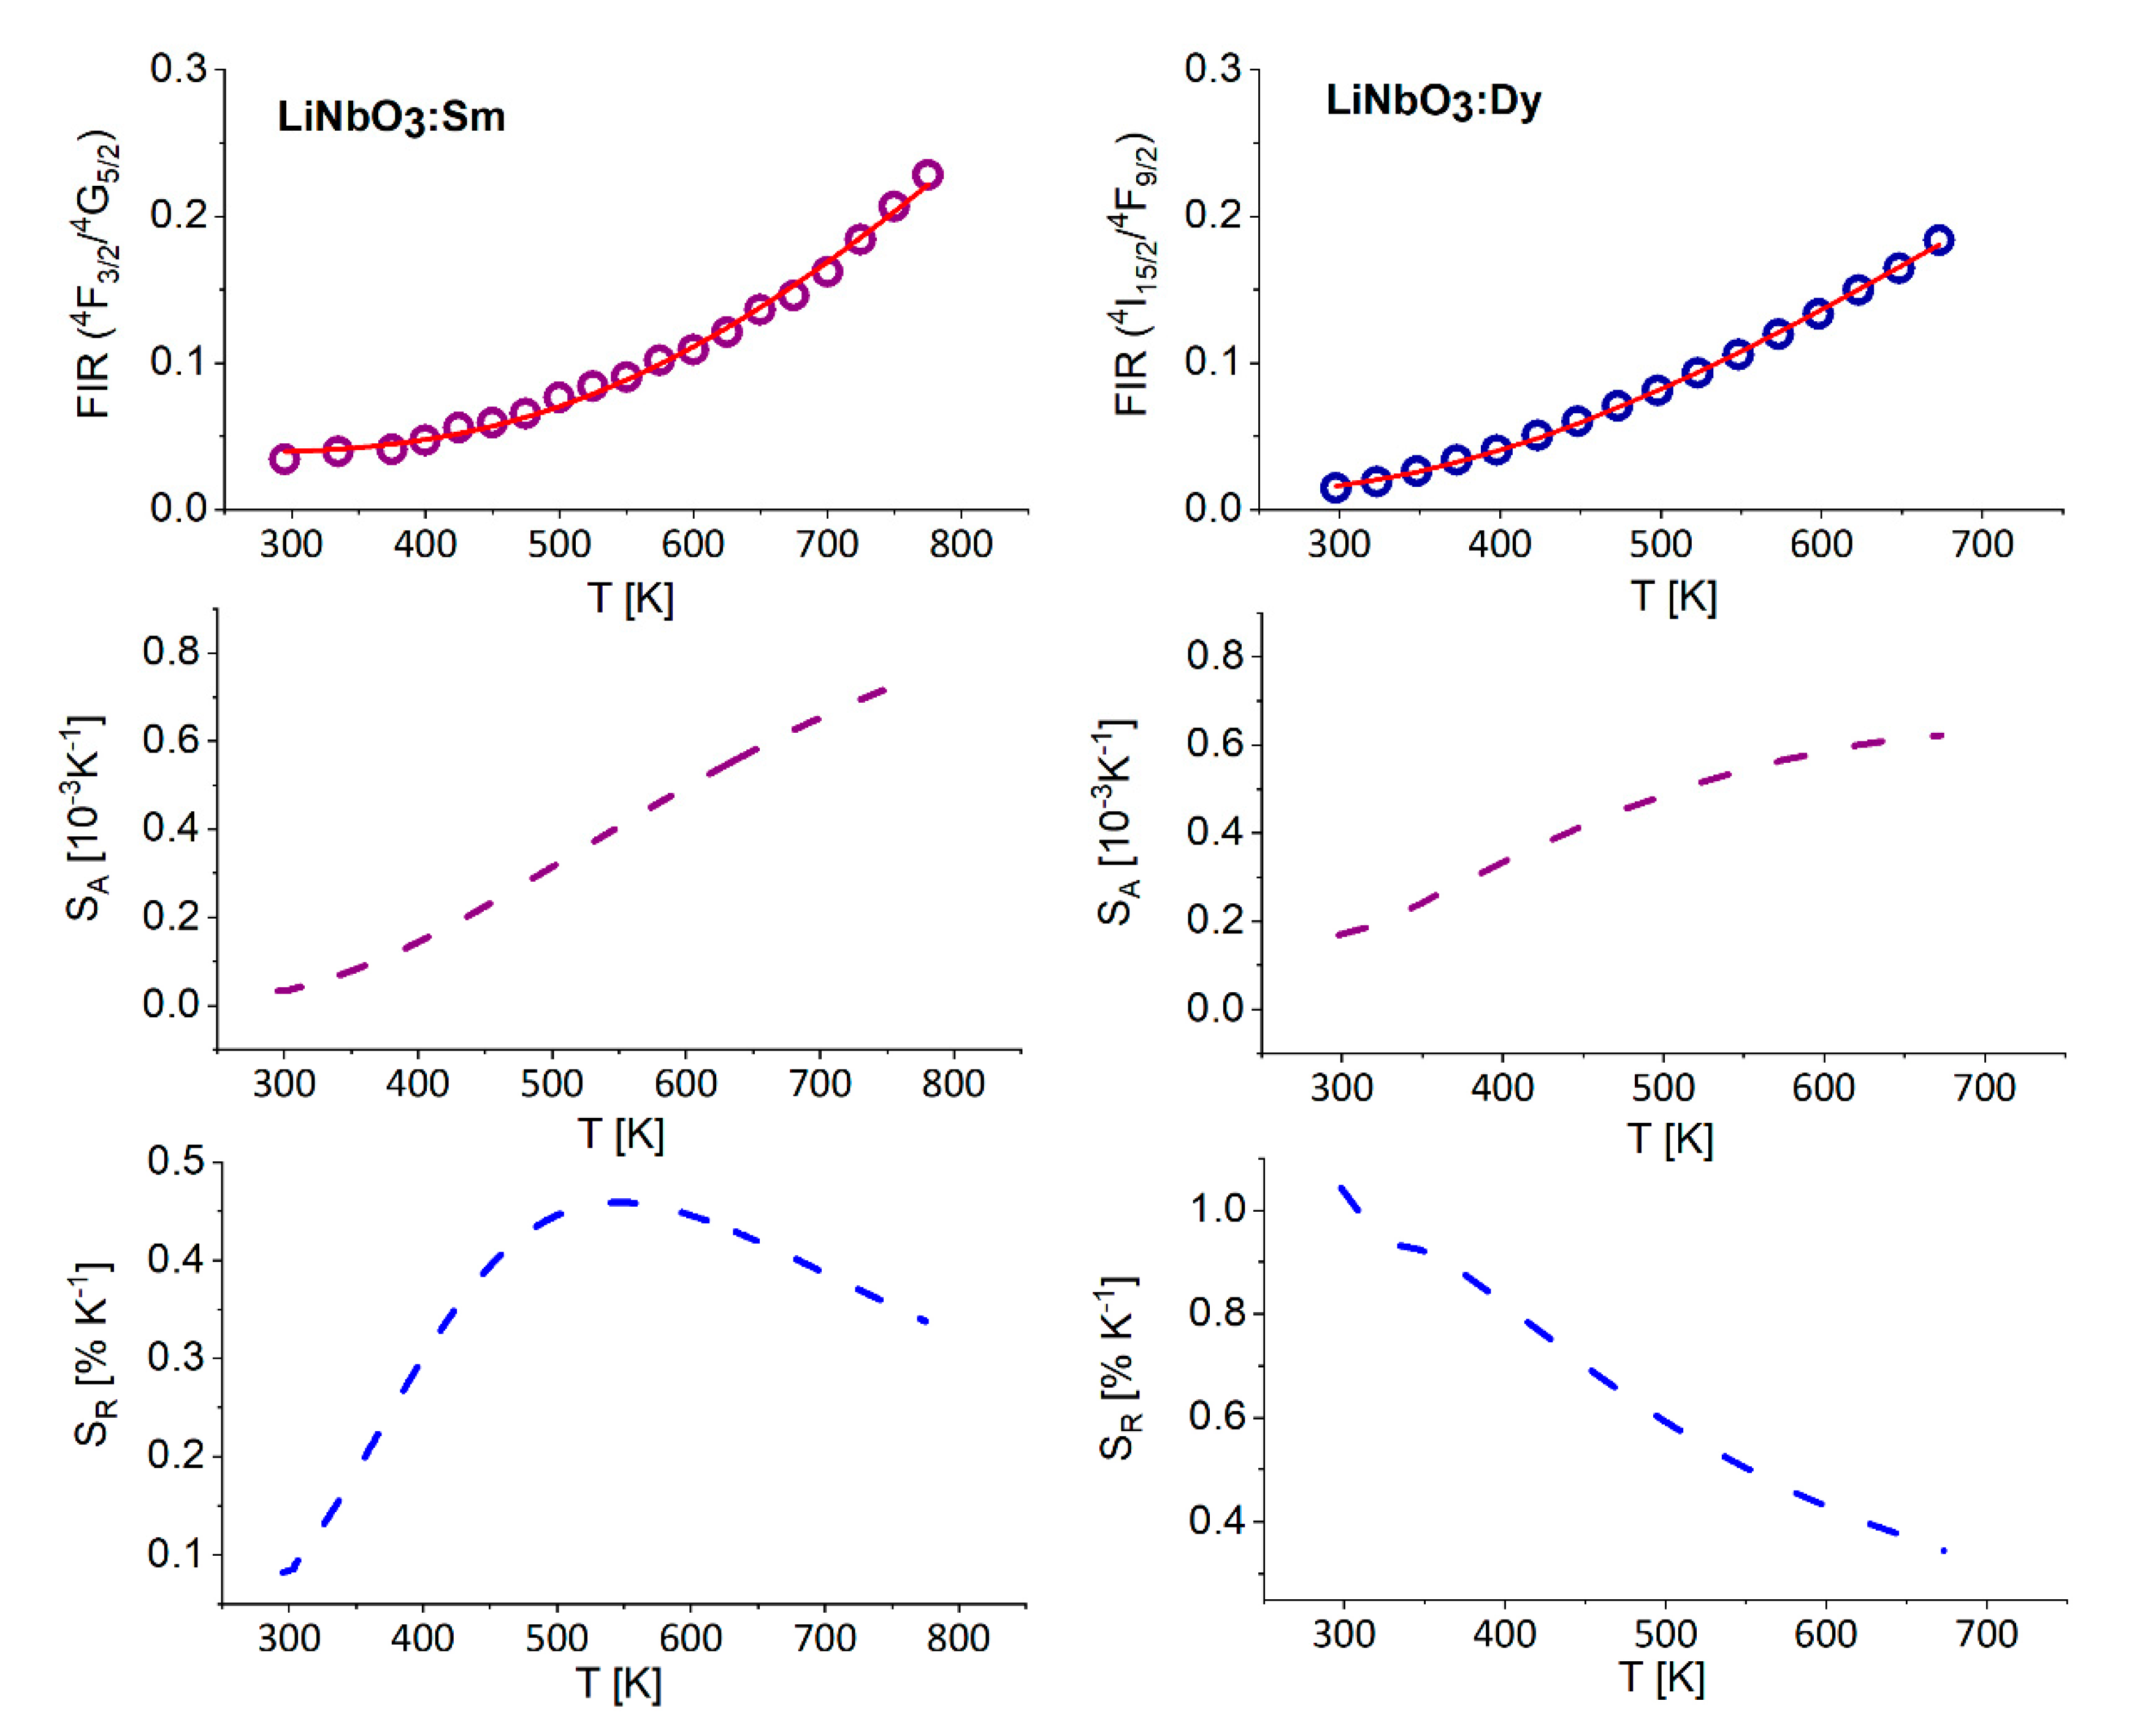
3.1. Effect of Temperature on Luminescence of Sm3+ and Dy3+ in LiNbO3

On the right side of Figure 2 we compare survey room temperature luminescence spectra of Sm3+ and Dy3+ ions in LiNbO3 recorded within the 450–800 nm spectral region. Sm3+ luminescence was excited at 402 nm. Its luminescence spectrum consists of bands located at about 567, 600, 646, and 708 nm related to transitions between the metastable 4G5/2 level and 6HJ (J = 5/2, 7/2, 9/2, 11/2) terminal levels, respectively. Very weak contribution of the 4G5/26H13/2 transition can be discerned around 800 nm. It should be noticed here that there are other transitions from the 4G5/2 level, namely to the multiplets of the 6F term and the 4G5/26H15/2 transition, all of them located in the near IR. The contribution of these transitions to luminescence spectra of samarium ions in crystals and glasses is marginal and therefore is commonly neglected. Dy3+ luminescence shown in Figure 2 was excited at 356 nm. Its luminescence spectrum consists of bands located at about 486, 580, 665, and 754 nm related to transition between the metastable 4F9/2 level and 6HJ (J = 15/2, 13/2, 11/2, and 9/2) terminal levels, respectively. Remaining transitions from the metastable 4F9/2 level are located in the IR and terminate on multiplets of the 6F term and on the 6H7/2 and 6H5/2 multiplets. Their contribution to dysprosium luminescence is very weak, as for samarium luminescence.
On the left side of Figure 2 we compare excitation spectra of Sm3+ luminescence and Dy3+ luminescence in LiNbO3, monitored at 611 and at 573 nm, respectively. Excitation spectra for the two ions show very complex structure of band components corresponding to closely spaced transitions from the ground states to high energy multiplets derived from the 4F, 4G, 4H, 4I, 4K, 4L, 4M quartet and the 6P sextet terms. It should be noticed here that despite a rich spectrum, the intensity of absorption in this spectral region is very low because spin forbidden sextet-quartet transitions are involved. It can be seen that the highest energy bands contributing to excitation spectra in Figure 2 are located around 411 and 356 nm although the energy level schemes of two ions contain levels at higher energy. Rather curiously, the wavelength 335 nm correspond to 3.7 eV, a value of the most frequently cited energy gap for LiNbO3. In view of theoretical calculations mentioned above in Section 1 the short wavelength limit of the excitation spectra may not be due to the fundamental UV absorption edge of LiNbO3. It may result also from an absorption of color centers, likely to exist in the matrix and/or transitions between the ground states of incorporated rare earth ions and trapped exciton states, as proposed for LiTaO3:Pr system [47,48].
Figure 3 compares luminescence spectra of Sm3+ in LiNbO3 recorded at different temperatures between 295 K and 775 nm. Excitation was at 402 nm. It can be seen that with increasing temperature the contribution of narrow band components to the spectrum vanishes gradually, the bands become smoother and their intensities diminish. To assess the effect of temperature on the overall Sm3+ luminescence the spectra recorded at different temperatures were integrated numerically within the 450–750 nm region. Results of this assessment presented in the inset on the right side of Figure 3 reveal the adverse thermally induced quenching of Sm3+emission. The inset on the left side of Figure 3 shows spectra for the high energy part of the spectrum between 460 and 550 nm, where the luminescence grows monotonously.
Examination of luminescence spectra of Dy3+ in LiNbO3 excited at 356 nm and recorded at different temperatures between 295 and 723 K reveal similar thermal effect.
Namely, the contribution of narrow band components to the spectrum vanishes gradually, the bands become more smooth and their intensities diminish, except for the high energy part of the spectrum between 440 and 500 nm, where the luminescence grows steadily. For the sake of brevity, the spectra shown in Figure 4 are restricted to the short wavelength parts encompassing bands within the 440–550 nm region. The Dy3+ luminescence intensities determined by a numerical integration of spectra within the 440–750 nm region are plotted versus temperature in the inset on the right. The inset on the left side shows the onset of steep rise of the sample absorption in the UV region observed at several different temperatures. Examination of plots in insets on the right side of Figure 3 and Figure 4 reveals a thermally enhanced quenching of both the Sm3+ and Dy3+ luminescence in LiNbO3. This phenomenon may be due to a thermally induced decrease of absorption efficiency in the optical pump region and/or to thermally enhanced increase of nonradiative relaxation rates of the metastable 4G5/2 and 4F9/2 levels of Sm3+ and Dy3+, respectively. The contribution of these quenching factors can be assessed based on examination of Figure 5.
Points in this figure show the temperature dependence of the 4G5/2 and 4F9/2 experimental lifetimes determined experimentally from respective exponential luminescence decay curves. It can be seen that initially, i.e., up to about 700 K for Sm3+ and up to about 600 K for Dy3+, the luminescence lifetimes do not depend on temperature implying that the contribution of the latter factor can be neglected. Therefore, we attribute the decrease of integrated luminescence intensity observed in this initial temperature region to thermally induced increase of a broad-band absorption that affects adversely the efficiency of optical pumping. In fact, the onset of this absorption shifts towards longer wavelengths when the temperature increases, as shown in the inset on the left side of Figure 4. Further increase of the temperature brings about a very steep decrease of the lifetime values. At 775 K, the highest temperature provided by our experimental setup, the Dy3+ lifetime is close to zero whereas the Sm3+ lifetime attains about 70% of its value at room temperature.
To interpret the effect of temperature on the 4G5/2 and 4F9/2 lifetimes, shown in Figure 5 one should remember that the measured luminescence lifetime τexp of an excited level of rare earth ion.
τ e x p = 1 / [ W r +   W n r ]
where Wr is the temperature independent radiative decay rate and Wnr denotes the rate of nonradiative decay affected by the temperature. Following the interpretation of data acquired for LiTaO3:Pr3+ [47] and recent generalization on spectroscopy of Pr3+ in niobate-titanates [48] we interpret the steep decrease of Sm3+ and Dy3+ lifetimes in terms of temperature-dependent charge transfer (CT) transitions within the modified model (TDCT) proposed by Nikolic et al. [40]. According to the TDCT model the rate Wnr(T) of nonradiative charge transfer transitions
W n r T =   W n r 0 × 1 T * 1 2 × exp [ ( E a + α T ) / k B   T * ]
where T denotes the temperature, Wnr(0) denotes the rate of the process at 0 K, Ea is the energy barrier to be crossed by phonons, kB is the Boltzmann constant. The factor αT represents the thermally induced change of the energy Ea assumed to be linear with the slope α.
The factor
T *   = ћ ω 2 k B   × cot h ( ћ ω / 2 k B T )
included to the above relation accounts for the non-Arrhenius nature of the excitation energy flow through CT states [49]. The ħω denotes the energy of the host phonons involved. Solid lines in Figure 5 represent theoretical temperature dependence of Sm3+ and Dy3+ lifetimes determined from Equation (2) with parameters gathered in Table 1. It can be seen that their agreement with experimental data points is reasonable.
In the following we focus our attention to temperature dependent changes of luminescence bands related to transitions that terminate on the 6H5/2 ground state of Sm3+ and the 6H15/2 ground state of Dy3+. It follows from Figure 3 and Figure 4 that there are contributions of luminescence that grow monotonously with increasing temperature at the expense of the 4G5/26H5/2 and 4F9/26H15/2 bands located at slightly longer wavelengths. Examination of low temperature absorption spectra reported in the past [45,46] reveals that these growing contributions in the Sm3+ spectrum is due to transitions from thermally populated 4F3/2 level and that in the Dy3+ spectrum from thermally populated 4I15/2 level. These levels are located, respectively, above the 4G5/2 and 4F9/2 metastable levels by about 1000 cm−1 only and therefore their populations are governed by the Boltzmann statistics. Accordingly, a thermally induced change of fluorescence intensity ratio (FIR) between the 4F3/26H5/2 and 4G5/26H5/2 emission bands for Sm3+ and between the 4I15/26H15/2 and 4F9/26H15/2 emission bands for Dy3+can be applied as the temperature sensing parameter. It is known that the luminescence intensities are proportional to the population of involved energy levels and FIR of two thermally coupled levels can be defined by following equation [39]:
F I R = I 4 I 15 / 2 I 4 F 9 / 2 = B exp Δ E k T
where B is temperature independent constant, ΔE is the energy gap between the two thermally coupled levels, and k is the Boltzmann constant. Plots of FIR versus temperature for LiNbO3:Sm3+ and LiNbO3:Dy3+ are compared in Figure 6.
Points indicate experimental data determined from spectra in Figure 3 and Figure 4 and the solid lines represent fits of Equation (4) with ΔE = 1139 cm−1 (for Sm3+) and ΔE = 1146 cm−1 (for Dy3+).
Optical thermometer may be quantitatively characterized with absolute and relative thermal sensitivity. The former parameter reveals the absolute FIR change with temperature variation and is expressed as:
S A = d F I R d T = F I R Δ E k T 2
To reliably compare the thermometers quality, relative sensitivity is usually used because this parameter determines normalized change of FIR with temperature variation and is defined as [39]:
S R = 1 F I R d F I R d T 100 % = Δ E k T 2 100 %
Figure 6 compares also plots of SA and SR parameters versus temperature for LiNbO3:Sm3+ (left) and LiNbO3:Dy3+ (right). Examination of the SR plots indicates that the LiNbO3:Sm3+ is mostly suitable for the optical sensor within the 500–750 K temperature region whereas LiNbO3:Dy3+ offers the highest sensitivity at lower temperatures between 300 and 400 K. However, the most significant shortcoming of these optical sensors resides in that their luminescence is quenched at temperatures markedly lower as compared to other hosts doped with Sm3+ and Dy3+.

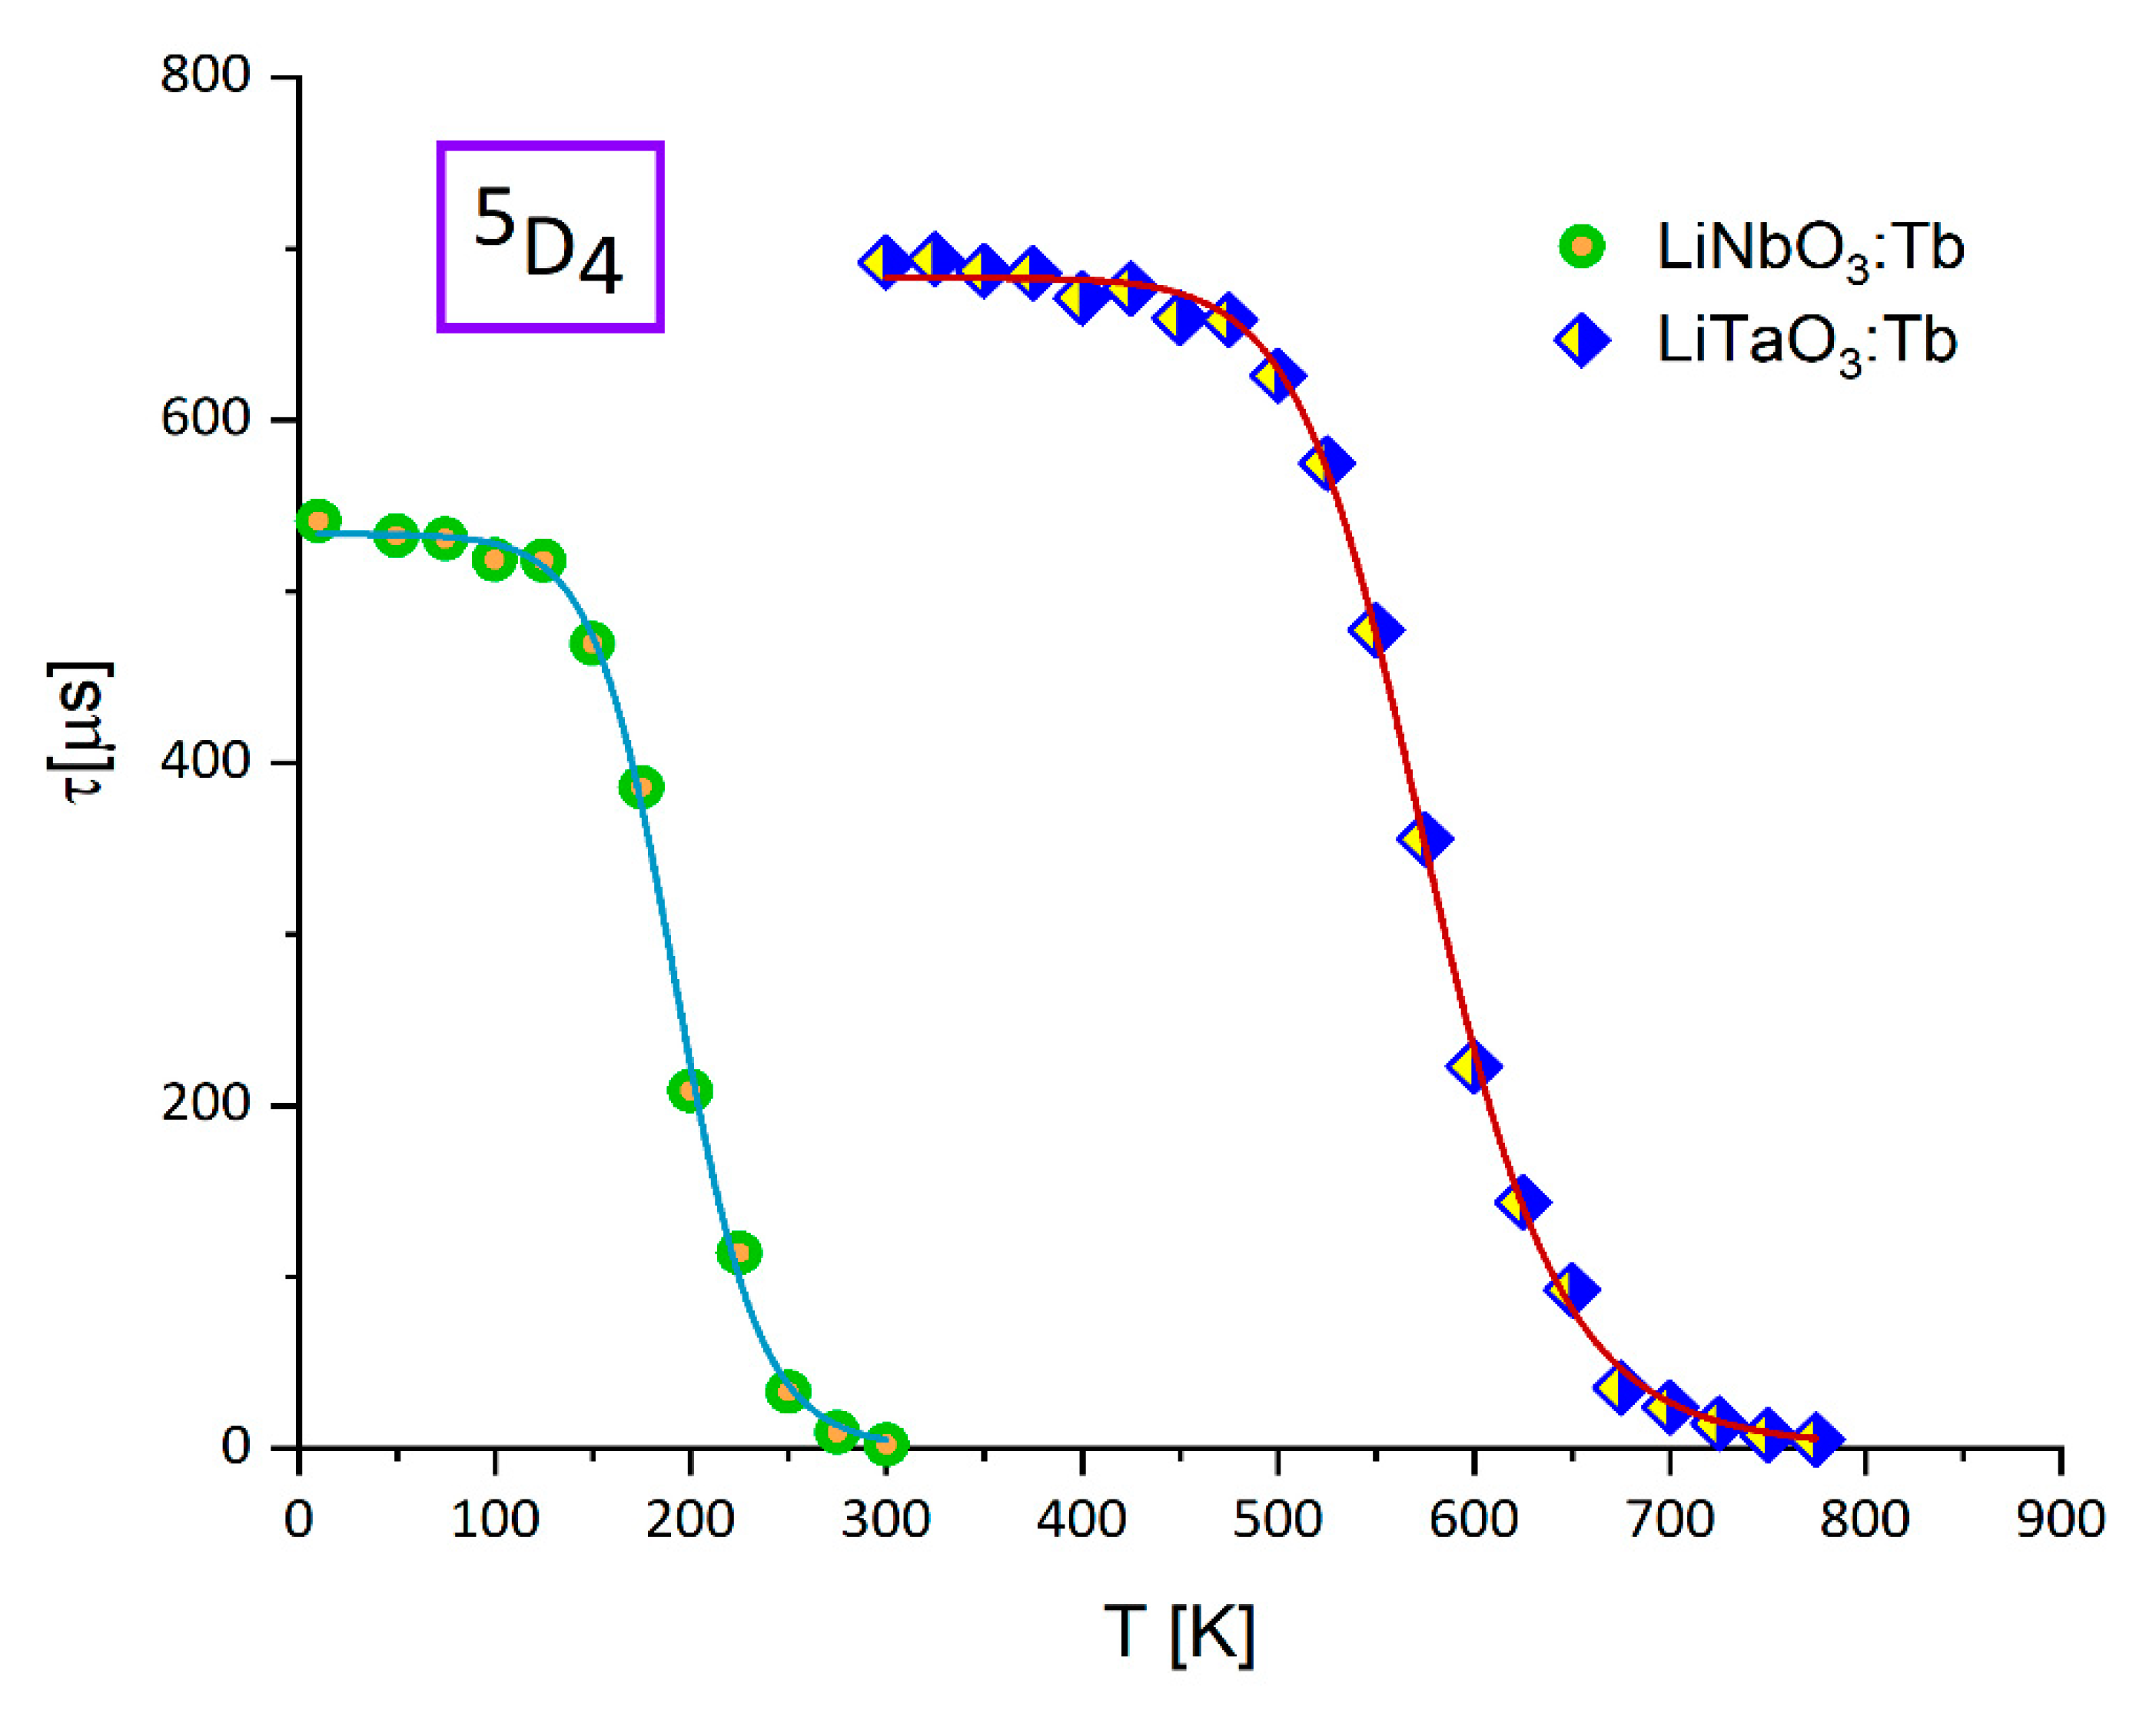
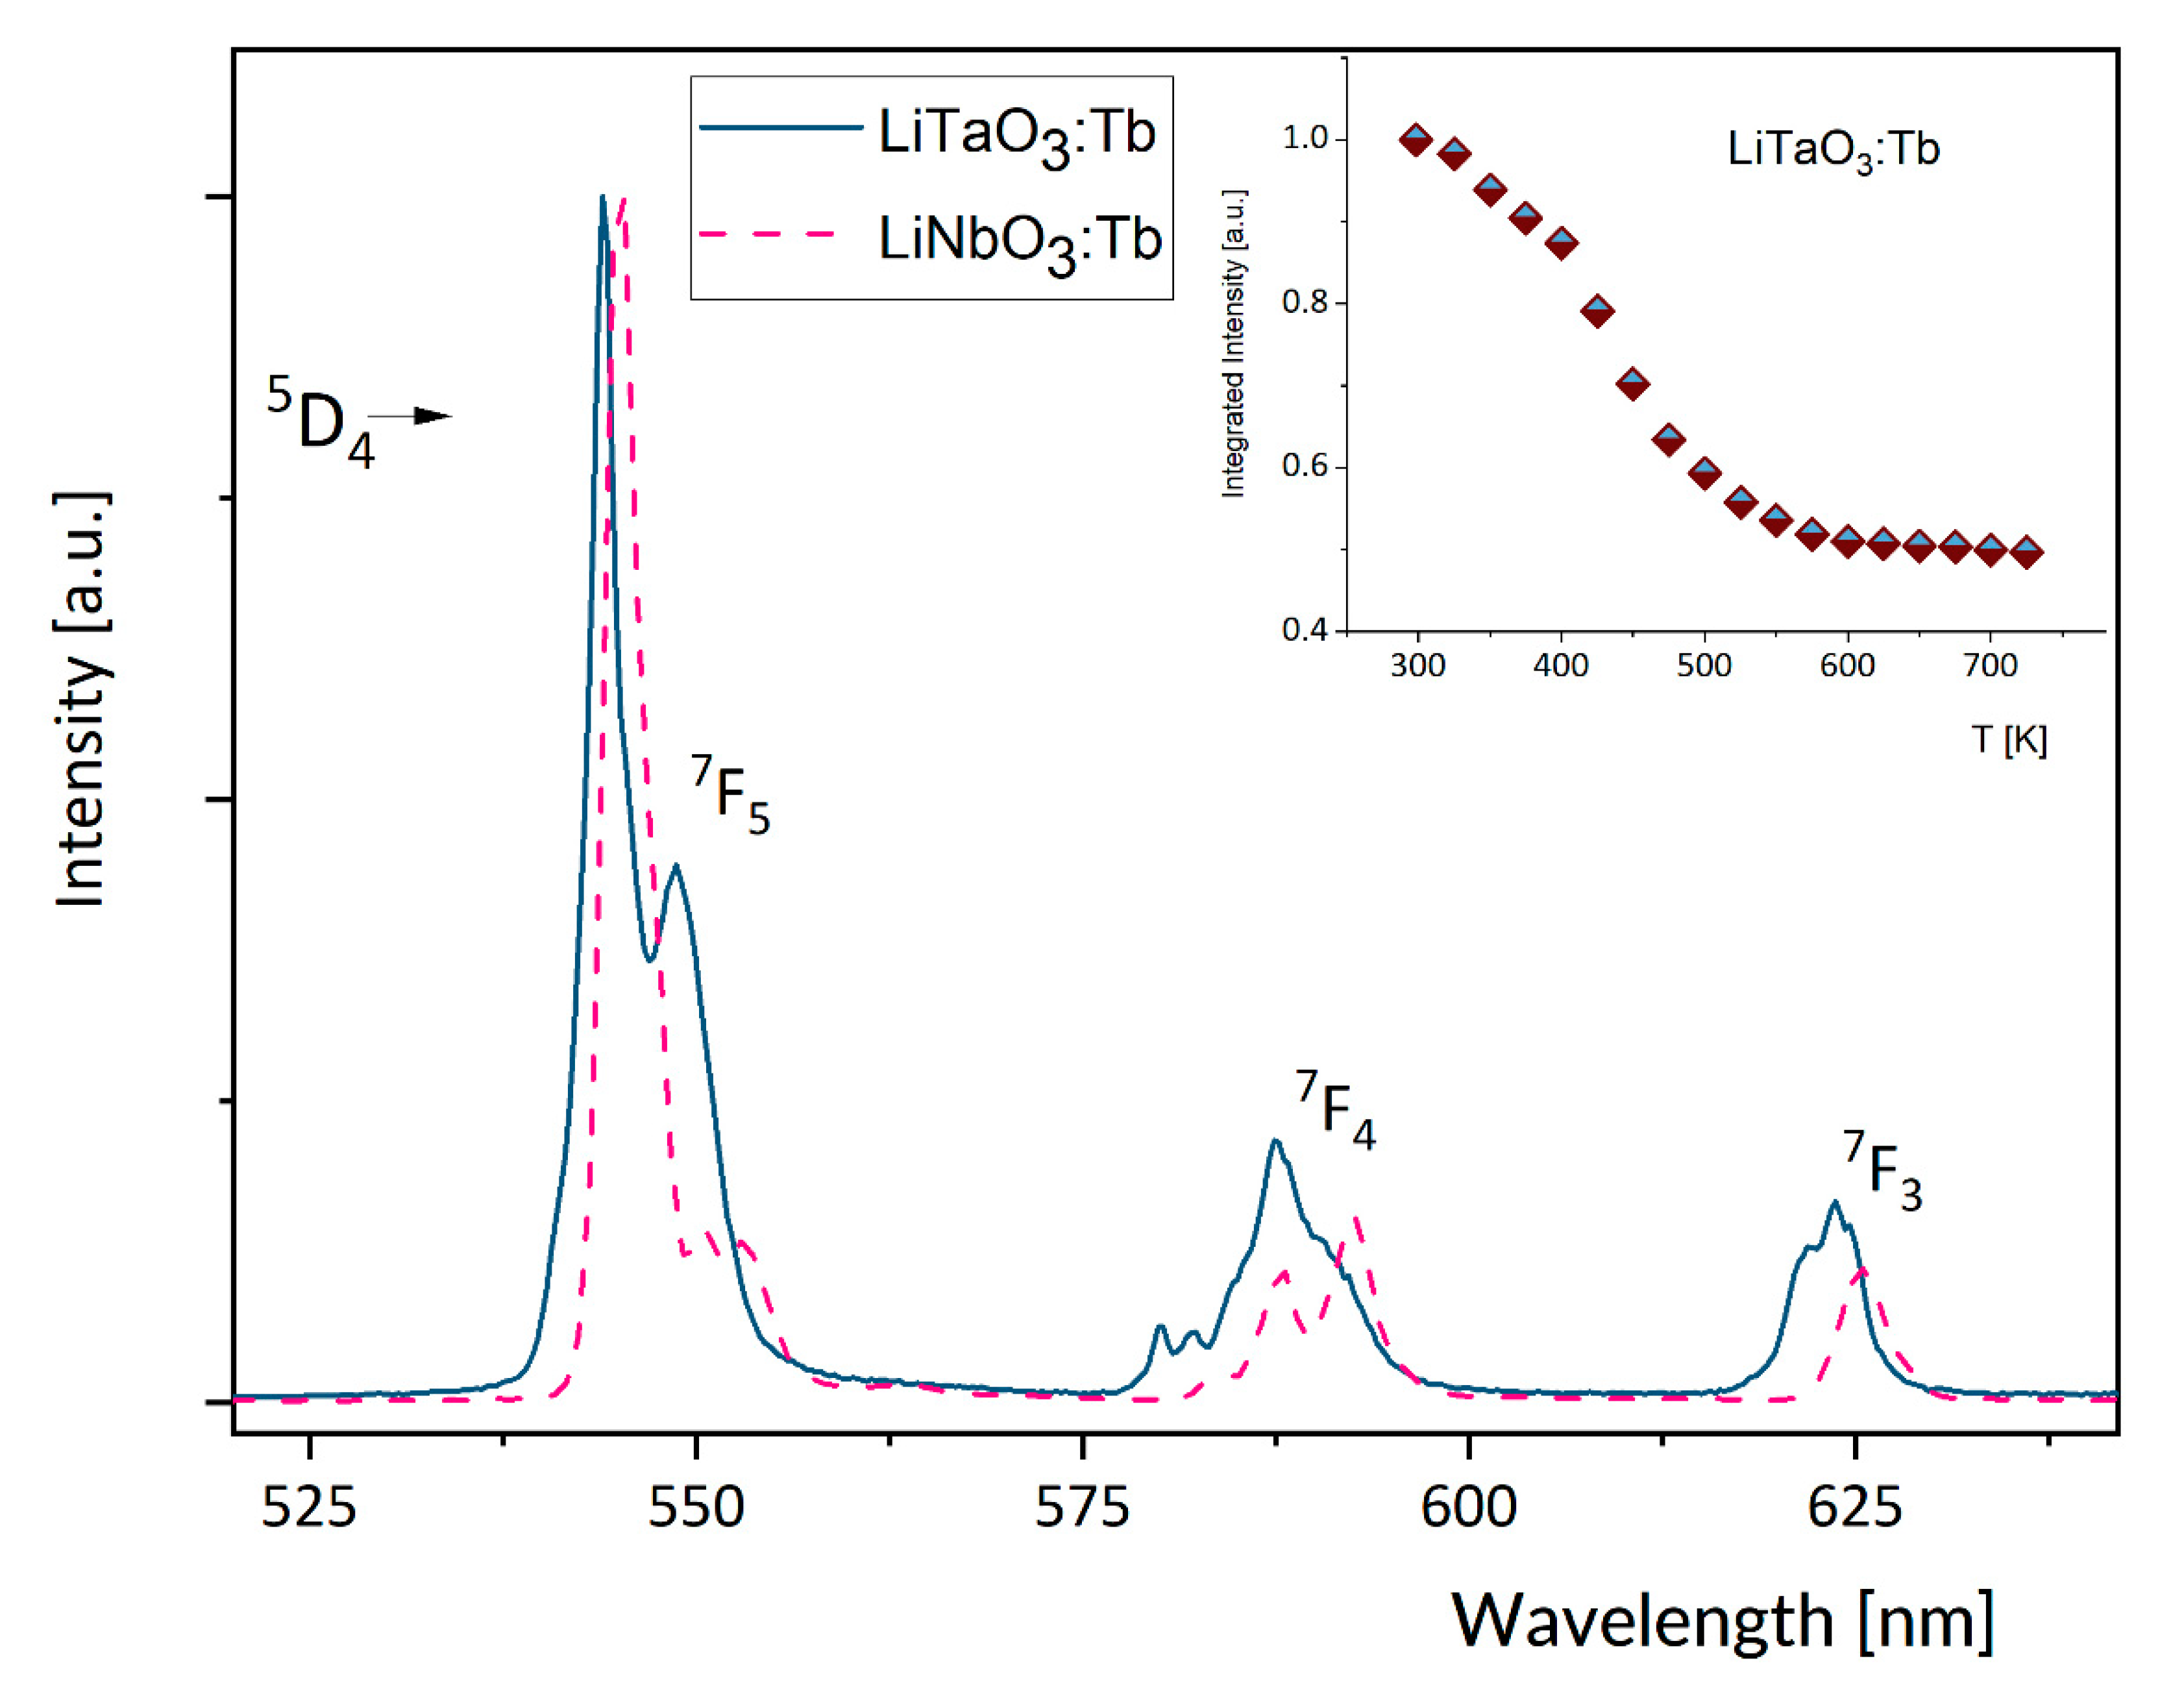
3.2. Effect of Temperature on Luminescence of Tb3+ in LiNbO3 and LiTaO3

Points in Figure 7 show the temperature dependence of the 5D4 lifetime determined experimentally from luminescence decay curves. Unlike LiNbO3:Sm3+ and LiNbO3:Dy3+ systems the LiNbO3:Tb3+ shows luminescence below ambient temperature only but still the dependence of its lifetime on the temperature consists of the initial part weakly affected by the temperature up to about 130 K and of subsequent steep decrease. For a comparison the experimental 5D4 lifetime for LiTaO3:Tb3+ plotted versus temperature also in Figure 7 is nearly constant at temperatures up to about 480 K and next decreases steeply. Solid lines in Figure 7 represent theoretical temperature dependence of the 5D4 lifetime for LiNbO3:Tb3+ and LiTaO3:Tb3+ determined from Equation (2) with parameters gathered in Table 2. It is worth noticing here that LiNbO3 and LiTaO3 compounds form isostructural crystals characterized by very similar physicochemical properties. Incorporated luminescent rare earth ions are located in sites with the same symmetry in these hosts. They interact with lattice phonons having similar energy distribution with nearly the same cut-off energy corresponding to Nb-O or Ta-O stretching vibrations [47]. Thus, rather small disparity between spectral features of Tb3+ in the two hosts can be supposed. Indeed, the survey luminescence spectra of LiNbO3:Tb3+ and of LiTaO3:Tb3+ compared in Figure 8 corroborate this supposition.

3.3. Discussion

Results presented above imply that the location of the metastable 5D4 level of Tb3+ with respect to the bottom of conduction band of the host is a factor that governs the luminescence quenching. Obviously, for a given band-gap the energy difference between the bottom of the conduction band and the metastable 5D4 level results from the energy difference between the Tb3+ ground state and the top of the valence band. The latter difference can be assessed based on generalizations proposed by Dorenbos et al. and by Dorenbos in a series of published papers, e.g., [50,51]. In particular, the ground state of Tb3+ located previously 0.7–1.0 eV higher above the valence band than that of Pr3+ has been adjusted based on new experimental data showing that these locations are at about the same energy [51]. The band-gap of LiTaO3 has been determined in the past to be 4.59 eV, a value corresponding to the UV absorption edge located at 271 nm [52]. The available information on band-gap of LiNbO3 is not reliable in view of the controversy mentioned above in Section 1 but the disparity of band-gap values for the two hosts is likely be small. In any case, we suppose that peculiarities of luminescence quenching in LiNbO3:Tb3+ and LiTaO3:Tb3+ are not governed by the band-gaps but stem from the fact that in LiTaO3 the ground state of Tb3+ is located lower, i.e., closer to the valence band that in LiNbO3. It follows from the zigzag curves connecting the ground state levels of rare earth ions [50,51] that among rare earth ions considered here the ground state of Tb3+ is located at the highest energy, that of Dy3+ is located markedly lower and that of Sm3+ at the lowest energy. In principle, the energy difference between the top of the valence band and the ground state level of the rare earth ion in question can be determined provided the energy of the charge transfer (denoted also IVCT = intervalence charge transfer) transition and the band-gap of the host are known. Unfortunately, we were not able to obtain these data from our measurement. Figure 2 shows that the IVCT transitions do not contribute to excitation spectra of Sm3+ and Dy3+ luminescence. Additionally, the IVCT transition does not contribute to the excitation spectrum of Tb3+ luminescence in LiNbO3. In [53] the IVCT transition energy of about 3.4 eV for Pr3+ in LiNbO3 has been mentioned. Assuming that the band-gap of LiNbO3 equals to 3.8 eV we locate the ground state of Pr3+ at about 0.4 eV above the top of the valence band. With this assumption and supposing that the ground states of Pr3+ and Tb3+ are located at the same energy we locate the 5D4 metastable level of Tb3+ at around 0.86 eV below the conduction band. This calculation is rather speculative and the reliability of the 5D4 location is not certain. However, it is worth noticing that it locates the ground states of Sm3+ and Dy3+ below the top of the valence band accounting for the absence of IVCT band in excitation spectra of their luminescence. The onset of the steep decrease of luminescence lifetime, related with the IVCT, occurs at about 700, 600, and 150 K for Sm3+, Dy3+, and Tb3+ ions in LiNbO3, respectively. The 4G5/2 metastable level of Sm3+is located at about 17,600 cm−1, i.e., about 2.18 eV above the ground state level. The 4F9/2 metastable level of Dy3+ is located at about 21,100 cm−1 i.e., about 2.61 eV above the ground state level. These values, combined with those inferred from the zigzag curve predict that the energy barrier to be crossed by phonons would be higher, hence the onset temperature would be also higher for Sm3+, in agreement with experimental data. The 5D4 metastable level of Tb3+ is located at about 2.55 eV above the ground state level, a value slightly smaller than that for Dy3+. However, this location combined with a relatively large energy inferred from the zigzag curve results in markedly smaller energy barrier hence the lower onset temperature.

4. Conclusions

The effect of temperature on experimental luminescence lifetimes consists of the initial temperature-independent stage followed by a steep decrease with the onset at about 700, 600, and 150 K for Sm3+, Dy3+, and Tb3+ ions, respectively. Experimental results were interpreted in terms of temperature-dependent charge transfer (CT) transitions within the modified phenomenological model TDCT. Disparity of the onset temperatures and their sequence were explained based on the location of familiar zigzag curves connecting the ground state levels of rare earth ions with respect to the band-gap of the host. It was concluded also that LiNbO3:Sm3+ is suitable as an optical sensor within the 500–750 K temperature region whereas LiNbO3:Dy3+ offers the highest sensitivity at lower temperatures between 300 and 400 K.

Author Contributions

Conceptualization, R.L. and W.R.-R.; methodology, R.L., B.M., R.K. and J.K.; software, J.K.; validation, R.L. and W.R.-R.; formal analysis, R.L., B.M., R.K. and J.K.; investigation, R.L., B.M., R.K. and J.K.; resources, W.R.-R.; data curation, R.L., B.M., R.K. and J.K.; writing—original draft preparation, R.L. and W.R.-R.; writing—review and editing, R.L. and W.R.-R.; visualization, R.L., B.M., R.K. and J.K.; supervision, R.L. and W.R.-R.; project administration, R.L. and W.R.-R.; funding acquisition, W.R.-R.; All authors have read and agreed to the published version of the manuscript.

Funding

The work was financially supported within the statutory funds of the Institute of Low Temperature and Structure Research, Polish Academy of Sciences in Wroclaw.

Conflicts of Interest

The authors declare no conflict of interest.

References

  1. Boyd, G.D.; Miller, R.C.; Nassau, K.; Bond, W.L.; Savage, A. LiNbO3: An efficient phase matchable nonlinear optical material. Appl. Phys. Lett. 1964, 5, 234. [Google Scholar] [CrossRef]
  2. Lee, M.; Takedawa, S.; Furukawa, Y.; Kitamura, K.; Hatano, H.; Tanaka, S. Nonvolatile two-color holographic recoding in Tb-doped LiNbO3. Appl. Phys. Lett. 2000, 76, 1653–1655. [Google Scholar] [CrossRef]
  3. Adibi, A.; Buse, K.; Psaltis, D. Two-center holographic recording. J. Opt. Soc. Am. B 2001, 18, 584–601. [Google Scholar] [CrossRef]
  4. Myers, L.E.; Eckhardt, R.C.; Fejer, M.M.; Byer, R.L.; Bosenberg, W.R.; Pierce, J.W. Quasi-phase-matched optical parametric oscillations in bulk periodically poled LiNbO3. J. Opt. Soc. Am. 1995, B12, 21022116. [Google Scholar] [CrossRef]
  5. Ross, G.W.; Pollnau, M.; Smith, P.G.R.; Clarkson, W.A.; Britton, P.E.; Hanna, D.C. Generation of high-power blue light in periodically poled LiNbO3. Opt. Lett. 1998, 23, 171–173. [Google Scholar] [CrossRef]
  6. Lallier, E.; Pachole, J.P.; Papuchon, M.; Micheli, M.; Li, M.J.; He, Q.; Ostrovsky, D.B.; Grezes-Besset, C.; Pelletier, E. Nd:Mgo:LiNbO3 waveguide laser and amplifier. Opt. Lett. 1990, 15, 682–684. [Google Scholar] [CrossRef]
  7. Amin, J.; Aust, J.A.; Veasey, D.L.; Sanfard, N.A. Dual wavelength 980 nm pumped Er/Yb-codoped waveguide laser in Ti:LiNbO3. Electron. Lett. 1998, 34, 456–458. [Google Scholar] [CrossRef]
  8. Li, R.; Wang, C.J.; Liang, X.; Peng, K.; Xu, G. CW Nd:Mg:LiNbO3 self-frequency-doubling laser at room temperature. IEEE J. Quantum Electron. 1993, 29, 2419–2420. [Google Scholar] [CrossRef]
  9. Jiangou, Z.; Shipin, Z.; Dingquan, X.; Xiu, W.; Guanfeng, X. Optical absorption properties of doped lithium niobate crystals. J. Phys. Condens. Matter. 1992, 4, 2977. [Google Scholar] [CrossRef]
  10. Kase, S.; Ohi, K. Optical absorption and interband Faraday rotation in LiTaO3 and LiNbO3. Ferroelectrics 1974, 8, 419. [Google Scholar] [CrossRef]
  11. Schmidt, W.G.; Albrecht, M.; Wippermann, S.; Blankenburg, S.; Rauls, E.; Fuchs, F.; Rodl, C.; Furthmuller, J.; Hermann, A. LiNbO3 ground- and excited-state properties from first-principles calculations. Phys. Rev. B 2006, 77, 035106. [Google Scholar] [CrossRef]
  12. Thierfelder, C.; Sanna, S.; Schindlmayr, A.; Schmidt, W.G. Do we know the band gap of lithium niobate? Phys. Stat. Solidi C 2010, 7, 362–365. [Google Scholar] [CrossRef]
  13. Mamoun, S.; Merad, A.E.; Guilbert, L. Energy band gap and optical properties of lithium niobate from ab initio calculations. Comp. Mater. Sci. 2013, 79, 125–131. [Google Scholar] [CrossRef]
  14. Abrahams, S.C.; Marsh, P. Defect structure dependence on composition in lithium niobate. Acta Cryst. B 1986, 42, 61. [Google Scholar] [CrossRef]
  15. Iyi, N.; Kitamura, K.; Izumi, F.; Yamamoto, J.K.; Hayashi, K.; Asano, H.; Kimura, J. Comparative study of defect structures in lithium niobate with different compositions. J. Solid State Chem. 1992, 101, 340. [Google Scholar] [CrossRef]
  16. Zotov, N.; Boysen, H.; Frey, F.; Metzger, T.; Born, E. Cation substitution models of congruent LiNbO3 investigated by X-ray and neutron powder diffraction. J. Phys. Chem. Solids 1994, 55, 145–152. [Google Scholar] [CrossRef]
  17. Lorenzo, A.; Jaffrezic, H.; Roux, B.; Boulon, G.; Garcia-Sole, J. Lattice location of rare earth ions in LiNbO3. Appl. Phys. Lett. 1995, 67, 3735. [Google Scholar] [CrossRef]
  18. Gasparotto, G.; Cebim, M.A.; Goes, M.S.; Lima, S.A.M.; Davolos, M.R.; Varela, J.A.; Paiva-Santos, C.O.; Zaghete, M.A. Correlation between the spectroscopic and structural properties with the occupation of the Eu3+ sites in powdered Eu3+-doped LiTaO3 prepared by the Pechini method. J. Appl. Phys. 2009, 106, 063509. [Google Scholar] [CrossRef] [Green Version]
  19. Shu, S.; Wang, Y.; Ke, Y.; Deng, B.; Liu, R.; Song, Q.; Wang, J.; Yu, R. NaCaTiTaO6:Sm3+: A novel orange-red-emitting tantalate phosphor with excellent thermal stability and high color purity for white LEDs. J. Alloy. Compd. 2020, 848, 156359. [Google Scholar] [CrossRef]
  20. Su, K.; Zhang, Q.; Yang, X.; Ma, B. Crystal structure and luminescence properties of thermally stable Sm3+-doped Sr9In(PO4)7 orange-red phosphor. J. Phys. D Appl. Phys. 2020, 53, 385101. [Google Scholar] [CrossRef]
  21. Zhang, L.; Che, J.; Ma, Y.; Wang, J.; Kang, R.; Deng, B.; Yu, R.; Geng, H. Luminescent and thermal properties of novel orange-red emitting Ca2MgTeO6:Sm3+ phosphors for white LED’s. J. Lumin. 2020, 225, 117374. [Google Scholar] [CrossRef]
  22. Kovács, L.; Kocsor, L.; Tichy-Rács, É.; Lengyel, K.; Bencs, L.; Corradi, G. Hydroxyl ion probing transition metal dopants occupying Nb sites in stoichiometric LiNbO3. Opt. Mater. Express 2019, 9, 4506–4516. [Google Scholar] [CrossRef]
  23. Mandula, G.; Kis, Z.; Kovacs, L.; Szaller, Z.; Krampf, A. Site-selective measurement of relaxation properties at 980 nmin Er3+-doped congruent and stoichiometric lithium niobite crystals. Appl. Phys. B 2016, 122, 72. [Google Scholar] [CrossRef]
  24. Kis, Z.; Mandula, G.; Lengyel, K.; Hajdara, I.; Kovacs, L.; Imlau, M. Homogeneous linewidth measurements of Yb3+ ions in congruent and stoichiometric lithium niobate crystals. Opt. Mater. 2014, 37, 845–853. [Google Scholar] [CrossRef]
  25. Robbins, D.J.; Cockayne, B.; Lent, B.; Glasper, J.L. The mechanism of 5D35D4 cross-relaxation in Y3Al5O12:Tb3+. Solid State Commun. 1976, 20, 673–676. [Google Scholar] [CrossRef]
  26. Park, J.Y.; Jung, H.C.; Raju, S.R.; Moon, B.K.; Jeong, J.H.; Kim, J.H. Solvothermal synthesis and luminescence properties of Tb3+-doped gadolinium aluminum garnet. J. Lumin. 2010, 130, 478–482. [Google Scholar] [CrossRef]
  27. Praveena, R.; Shim, J.J.; Cai, P.; Seo, H.J.; Chung, W.; Kwon, T.H.; Jayasankar, C.K.; Haritha, P.; Venkatramu, V. Luminescence properties of Lu3Al5O12:Tb3+ nano-garnet. J. Korean Phys. Soc. 2014, 64, 1859–1865. [Google Scholar] [CrossRef]
  28. Teng, X.; Wang, W.; Cao, Z.; Li, J.; Duan, G.; Liu, Z. The development of new phosphors 3f Tb3+/Eu3+ co-doped Gd3Al5O12 with tunable emission. Opt. Mater. (Amst.) 2017, 69, 175–180. [Google Scholar] [CrossRef]
  29. Solarz, P.; Głowacki, M.; Lisiecki, R.; Sobczyk, M.; Komar, J.; Macalik, B.; Ryba-Romanowski, W. Impact of temperature on excitation, emission and cross-relaxation processes of terbium ions in GGAG single crystal. J. Alloy. Compd. 2019, 789, 409–415. [Google Scholar] [CrossRef]
  30. Hakeem, D.A.; Pi, J.W.; Kim, S.W.; Park, K. New Y2LuCaAl2SiO12:Ln (Ln = Ce3+, Eu3+, and Tb3+) phosphors for white LED applications. Inorg. Chem. Front. 2018, 5, 1336–1345. [Google Scholar] [CrossRef]
  31. Deopa, N.; Rao, A.S. Spectroscopic studies of single near ultraviolet pumped Tb3+ doped Lithium Lead Alumino Borate glasses for green lasers and tricolour w-LEDs. J. Lumin. 2018, 194, 56–63. [Google Scholar] [CrossRef]
  32. Loiko, P.; Volokitina, A.; Mateos, X.; Dunina, E.; Kornienko, A.; Vilejshikova, E.; Aguiló, M.; Díaz, F. Spectroscopy of Tb3+ ions in monoclinic KLu(WO4)2 crystal application of an intermediate configuration interaction theory. Opt. Mater. 2018, 78, 495–501. [Google Scholar] [CrossRef]
  33. Liu, G.K.; Carnall, W.T.; Jones, R.P.; Cone, R.L.; Huang, J. Electronic energy level structure of Tb3+ in LiYF4. J. Alloy. Compd. 1994, 207–208, 69–73. [Google Scholar] [CrossRef]
  34. Gusowski, M.A.; Ryba-Romanowski, W. Unusual behavior of Tb3+ in K3YF6 green-emitting phosphor. Opt. Lett. 2008, 33, 1786–1788. [Google Scholar] [CrossRef] [PubMed]
  35. Metz, P.W.; Marzahl, D.T.; Huber, G.; Kränkel, C. Performance and wavelength tuning of green emitting terbium lasers. Opt. Express 2017, 25, 5716. [Google Scholar] [CrossRef]
  36. Rajendra, H.J.; Pandurangappa, C.; Monika, D.L. Luminescence properties of dysprosium doped YVO4 phosphor. J. Rare Earths 2018, 36, 1245–1249. [Google Scholar] [CrossRef]
  37. Liu, Y.; Liu, G.; Wang, J.; Dong, X.; Yu, W. Multicolor photoluminescence and energy transfer properties of dysprosium and europium-doped Gd2O3 phosphors. J. Alloy. Compd. 2015, 649, 96–103. [Google Scholar] [CrossRef]
  38. Rimbach, A.C.; Steudel, F.; Ahrens, B.; Schweizer, S. Tb3+, Eu3+, and Dy3+ doped lithium borate and lithium aluminoborate glass: Glass properties and photoluminescence quantum efficiency. J. Non Cryst. Solids 2018, 499, 380–386. [Google Scholar] [CrossRef]
  39. Perera, S.S.; Rabuffetti, F.A. Dysprosium-activated scheelite-type oxides as thermosensitive phosphors. J. Mater. Chem. C 2019, 7, 7601. [Google Scholar] [CrossRef]
  40. Nikolić, M.G.; Jovanović, D.J.; Dramićanin, M.D. Temperature dependence of emission and lifetime in Eu3+- and Dy3+-doped GdVO4. Appl. Opt. 2013, 52, 1716–1724. [Google Scholar] [CrossRef]
  41. Hertle, E.; Chepyga, L.; Batentschuk, M.; Will, S.; Zigan, L. Temperature-dependent luminescence characteristics of Dy3+ doped in various crystalline hosts. J. Lumin. 2018, 204, 64–74. [Google Scholar] [CrossRef]
  42. Bowman, S.R.; O’Connor, S.; Condon, N.J. Diode pumped yellow dysprosium lasers. Opt. Express 2012, 20, 12906–12911. [Google Scholar] [CrossRef] [PubMed]
  43. Haro-González, P.; Martín, L.L.; Martín, I.R.; Berkowski, M.; Ryba-Romanowski, W. Optical amplification properties of Dy3+-doped Gd2SiO5, Lu2SiO5 and YAl3(BO3)4 single crystals. Appl. Phys. B Lasers Opt. 2011, 103, 597–602. [Google Scholar] [CrossRef]
  44. Repelin, Y.; Husson, E.; Proust, F.B.C. Raman spectroscopy of lithium niobate and lithium tantalite. Force field calculations. J. Phys. Chem. Solids 1999, 60, 819–825. [Google Scholar] [CrossRef]
  45. Dominiak-Dzik, G. Sm3+-doped LiNbO3 crystal, optical properties and emission cross-sections. J. Alloy. Compd. 2005, 391, 26–32. [Google Scholar] [CrossRef]
  46. Dominiak-Dzik, G.; Ryba-Romanowski, W.; Palatnikov, M.N.; Sidorov, N.V.; Kalinnikov, V.T. Dysprosium-doped LiNbO3 crystal. Optical properties and effect of temperature on fluorescence dynamics. J. Mol. Struct. 2004, 704, 139–144. [Google Scholar] [CrossRef]
  47. Gryk, W.; Dyl, D.; Ryba-Romanowski, W.; Grinberg, M. Spectral properties of LiTaO3:Pr3+ under high hydrostatic pressure. J. Phys. Condens. Matter 2005, 17, 5381–5395. [Google Scholar] [CrossRef]
  48. Boutinaud, P. Rationalization of the Pr3+-to-transition metal charge transfer model: Application to the luminescence of Pr3+ in titano-nobates. J. Lumin. 2019, 214, 116557. [Google Scholar] [CrossRef]
  49. Englman, R.; Jortner, J. The energy gap law for radiationless transitions in large molecules. J. Mol. Phys. 1970, 18, 145. [Google Scholar] [CrossRef]
  50. Dorenbos, P.; Krumpel, A.H.; Boutinaud, E.v.P.; Bettinelli, M.; Cavalli, E. Lanthanide level location in transition metal complex compounds. Opt. Mater. 2010, 32, 1681–1685. [Google Scholar] [CrossRef]
  51. Dorenbos, P. Charge transfer bands in optical materials and related defect level location. Opt. Mater. 2017, 69, 8–22. [Google Scholar] [CrossRef]
  52. Nikl, M.; Morlotti, R.; Magro, C.; Bracco, R. Emission and storage properties of LiTaO3:Tb3+ phosphor. J. Appl. Phys. 1996, 79, 2853–2856. [Google Scholar] [CrossRef]
  53. Boutinaud, P.; Bettinelli, M.; Diaz, F. Intervalence charge transfer in Pr3+-and Tb3+-doped double tungstate crystals KRE(WO4)2 (RE = Y, Gd, Yb, Lu). Opt. Mater. 2010, 32, 1659–1663. [Google Scholar] [CrossRef]
Figure 1. Energy level schemes for Sm3+, Tb3+, and Dy3+. Vertical downward arrows indicate transitions involved.
Crystals 10 01034 g001
Figure 2. Survey, room temperature luminescence spectra of Sm3+ and Dy3+ ions in LiNbO3 recorded within the 450–800 nm spectral region (right) and excitation spectra of Sm3+ and Dy3+ luminescence in LiNbO3, monitored at 611 and 573 nm, respectively (left).
Crystals 10 01034 g002
Figure 3. Luminescence spectra of Sm3+ in LiNbO3 recorded at different temperatures between 295 and 775 K. Excitation was at 402 nm. Left inset: Magnified spectra of the high energy part of the spectrum between 460 and 550 nm. Right inset: Integrated luminescence intensity plotted versus temperature.
Crystals 10 01034 g003
Figure 4. Luminescence spectra between 440 and 500 nm for Dy3+ in LiNbO3 recorded at different temperatures between 295 and 723 K. Excitation was at 356 nm. Left inset: The onset of steep rise of the sample absorption in the UV region observed at several different temperatures. Right inset: Integrated luminescence intensity plotted versus temperature.
Crystals 10 01034 g004
Figure 5. Temperature dependence of 4G5/2 (Sm3+) and 4F9/2 (Dy3+) lifetimes in LiNbO3. Points indicate experimental data. Solid lines represent theoretical temperature dependence determined from Equation (2) with parameters gathered in Table 1.
Crystals 10 01034 g005
Figure 6. Plots of FIR versus temperature for LiNbO3:Sm3+ and LiNbO3:Dy3+ (upper graphs) and plots of SA and SR parameters versus temperature for LiNbO3:Sm3+ (left) and LiNbO3:Dy3+ (right).
Crystals 10 01034 g006
Figure 7. Temperature dependence of 5D4 (Tb3+) lifetimes in LiNbO3 and LiTaO3. Points indicate experimental data. Solid lines represent theoretical temperature dependence determined from Equation (1) with parameters gathered in Table 2.
Crystals 10 01034 g007
Figure 8. Comparison of the survey luminescence spectrum of LiNbO3:Tb3+ recorded at 10 K to survey luminescence spectrum of LiTaO3:Tb3+ recorded at 300 K. Inset shows effect of temperature on integrated emission intensity of LiTaO3:Tb3+.
Crystals 10 01034 g008
Table 1. Spectral parameters governing the temperature dependence of 4G5/2 (Sm3+) and 4F9/2 (Dy3+) lifetimes in LiNbO3 within the framework of the TDCTmodel.
LiNbO3:SmLiNbO3:Dy
Wnr (1/s)855508
Ea (cm−1)16,15914,795
α (cm−1/K)23.326.1
ħω (cm−1)672680
Wr (1/s)15405164
Table 2. Spectral parameters governing the temperature dependence of 5D4 (Tb3+) lifetimes in LiNbO3 and LiTaO3 within the framework of the TDCT model.
LiNbO3:TbLiTaO3:Tb
Wnr (1/s)1064807
Ea (cm−1)19848128
α (cm−1/K)17.117.6
ħω (cm−1)693778
Wr (1/s)18741464
Publisher’s Note: MDPI stays neutral with regard to jurisdictional claims in published maps and institutional affiliations.

