Article

Novel Sample-Stage for Combined Near Ambient Pressure X-ray Photoelectron Spectroscopy, Catalytic Characterization and Electrochemical Impedance Spectroscopy

1
Institute of Material Chemistry, Vienna University of Technology, Getreidemarkt 9/165-PC, 1060 Wien, Austria
2
Institute of Chemical Technologies and Analytics, Vienna University of Technology, Getreidemarkt 9/164-EC, 1060 Wien, Austria
3
Huber Scientific, Rottmayrgasse 17/29, 1120 Wien, Austria
4
Next-Generation Fuel Cell Research Center, Kyushu University, 744 Motooka Nishi-ku, Fukuoka 819-0395, Japan
*
Author to whom correspondence should be addressed.
Crystals 2020, 10(10), 947; https://doi.org/10.3390/cryst10100947
Submission received: 25 September 2020 / Revised: 13 October 2020 / Accepted: 16 October 2020 / Published: 17 October 2020
(This article belongs to the Section Inorganic Crystalline Materials)

Abstract

:
For an in-depth characterization of catalytic materials and their properties, spectroscopic in-situ (operando) investigations are indispensable. With the rapid development of advanced commercial spectroscopic equipment, it is possible to combine complementary methods in a single system. This allows for simultaneously gaining insights into surface and bulk properties of functional oxides, such as defect chemistry, catalytic characteristics, electronic structure, etc., enabling a direct correlation of structure and reactivity of catalyst materials, thus facilitating effective catalyst development. Here, we present a novel sample-stage, which was specifically developed to pave the way to a lab–based combination of near ambient pressure X-ray photoelectron spectroscopy and electrochemical impedance spectroscopy with simultaneous catalytic operando measurements. This setup is designed to probe different (model) systems under conditions close to real heterogeneous catalysis, with a focus on solid oxide electrochemical cells. In a proof of concept experiment using an electrochemical model cell with the doped perovskite Nd0.6Ca0.4Fe0.9Co0.1O3-δ as working electrode, the precise control of the surface chemistry that is possible with this setup is demonstrated. The exsolution behavior of the material was studied, showing that at a lower temperature (500 °C) with lower reducing potential of the gas phase, only cobalt was exsolved, forming metallic particles on the surface of the perovskite-type oxide. Only when the temperature was increased to 600 °C and a cathodic potential was applied (−250 mV) Fe also started to be released from the perovskite lattice.

Graphical Abstract

1. Introduction

Perovskite-type oxides are a versatile class of materials with the general formula ABO3, which have a vast range of applications utilizing their dielectric, electronic, electrochemical, and catalytic properties [1]. Perovskites that contain transition metals are used as catalysts for a wide variety of chemical reactions, especially in the context of renewable energy conversion. Reactions catalyzed are (reverse) water gas shift rWGS/WGS [2,3], dry reforming [4], water splitting [5], methanol reforming [6], or CO2 electrolysis [1], to name only a few. In addition, high mobility of electrons and oxygen anions enables application of perovskites in solid oxide fuel and electrolysis cells [7,8] (SOFC/SOEC).
Due to the highly dynamic nature of catalyst surfaces, especially at the high operation temperatures of solid oxide cells, a meaningful picture of the surface chemistry, especially regarding oxidation states and adsorbed species is only possible when properties are measured in-situ under reaction conditions. The recent improvements of lab-based near ambient pressure X-ray photoelectron spectroscopy (NAP–XPS) analyzers in terms of maximum pressure (up to mbar range) at reasonably high count-rates enable XPS measurements in a reactive atmosphere [9]. However, a setup for thorough in-situ characterization must also allow sample heating up to 1000 °C without outgassing of volatile contaminants, e.g., Cr, Mn, or Si from the heater materials.
Simultaneous NAP-XPS measurements and electrochemical characterization of solid oxide model cells are a powerful tool to obtain insights into reaction kinetics and mechanisms, as well as the p O 2 dependence of the surface chemistry, as shown by many studies in literature [10,11]. For this task, electrical feedthroughs and contacts at the sample—ideally for working, counter, and reference electro—need to be part of the sample-stage. So far, such sample-stages are not commercially available. In this paper, we present a novel design for a working sample-stage and holder, which meets all these requirements. Additionally, we show first lab-based simultaneous NAP-XPS measurements and catalytic and electrochemical characterization of a thin film perovskite-type catalyst, which was deposited on a three-electrode electrochemical cell, as shown in Figure 1.
In the case of SOFCs and SOECs, model cells with a thin film working electrode as seen in Figure 1 are an excellent configuration for mechanistic kinetic studies, which allow simultaneous determination of electrochemical performance by measuring the current-voltage characteristics as well as observation of surface chemistry and reaction intermediates by NAP-XPS. Several of such studies were already carried out at synchrotron facilities in two-electrode cells with ceria-based electrodes [12,13,14,15] and perovskite-type electrodes [12,16,17,18,19,20]. Recently, also the XPS investigation of operating Ni-GDC anodes in two-chamber cells and a three-electrode geometry were reported [21,22]. For the three-electrode measurements a new electrolyte design is used, where the reference electrode (RE) is placed on a protrusion, which is visible in Figure 1 as well. This design allows precise differentiation of the working electrode overpotential and half-cell impedance from counter electrode effects and minimizes artefacts that are very common in other cell geometries [23].

2. Experimental

In this section, key features of the novel setup featuring simultaneous in-situ NAP–XPS, in-situ electrochemical impedance spectroscopy (EIS), and mass spectrometry (MS) measurement are presented. Specific conditions under which this equipment can operate as well as its limits will be listed in detail. First, general considerations and experimental requirements for such a setup are presented. Second, the actual design of the sample-stage will be highlighted. Third, this section concludes with the electrochemical model cell and its application.

2.1. General Considerations

The general concept of the new instrument is to investigate fuel cell reactions and heterogeneous catalysis in conditions that are representative for real cell or catalyst operation. These include a significant gas phase pressure and elevated temperatures (up to 1000 °C). During reaction, the catalyst (typically a perovskite) surface must be available for simultaneous measurements by monochromatic NAP–XPS, EIS, and gas phase mass spectrometry. The setup itself should not contribute to any measurable catalytic activity at the sample. This section gives a step-by-step guide, how the presented setup tries to come closer to an ideal system, and which limits have yet to be overcome.
The in-situ XPS setup is designed to work at pressures of up to 20 mbar for high intensity signals. Typical experiments are however performed at 0.5–3 mbar, in order to minimize adverse gas phase effects such as scattering of photoelectrons and sample cooling [24]. For elements with low intensity (small cross-section and/or trace amounts <5%), the pressure is reduced to 0.7 mbar. As will be shown later for fitting of cobalt oxidation states, where the region is overlapping with the Fe AUGER LMM signal, a sufficient signal to noise ratio was achieved at 0.7 mbar. In general, a trade-off between pressure and signal quality has to be found for the respective systems under investigation.
The accessible temperature at ultra–high vacuum (UHV) conditions ranges from room temperature to 1000 °C. In the optimized NAP-XPS measurement position, the sample-nozzle distance is less than 0.5 mm. In order to avoid too high nozzle temperatures, the nozzle is water-cooled and can withstand short-term (about one hour) sample temperatures of 1000 °C and long–term (days) sample temperatures of 800 °C. For temperature control, a PID controller adjusts the infrared laser power by pulse width modulation at 100 Hz to reach the desired thermocouple temperature. Due to the small thermal mass, heating and cooling rates >200 °C min−1 are easily possible. With increasing gas pressure, the maximum temperature reachable with this setup is decreasing due to interaction and subsequent cooling of the hot sample by the gas phase. Below 1 mbar H2 (i.e., high heat transfer coefficient h) the maximum temperature realizable is 750 °C. To ensure reliable temperature measurements, both a thermocouple and a pyrometer are used. The S-type thermocouple (Pt10Rh-Pt) is welded onto the sample backside (or the sample back plate). The material for the thermocouple was chosen due to its stability against corrosion under reaction conditions. The signal from the thermocouple is transported to the sample-holder via Pt and PtRh10% wires and spring mounted bolts. From there, the signal is transmitted via compensated Ni-wires connected to the feedthrough. A pyrometer measures the thermal radiation of the sample front side facing the nozzle at elevated temperatures. The electrical feedthrough cables for EIS allow a third temperature measurement, provided the sample has a reproducible relation between an electrical quantity (e.g., conductivity) and temperature. In case of electrochemical cells based on an yttria-stabilized zirconia (YSZ) [25] electrolyte, the oxygen ion conductivity of YSZ [25] can be used as a temperature measure. This is presented in more detail in Section 3, Proof of Concept.
For XPS measurements, the X-ray spot size on the sample is 350 µm, which is also approximately the nozzle diameter. This spot size lies within the typical range for this type of in-situ NAP-XPS setup (250 to 350 µm). The whole sample can be scanned due to the mobility of the sample stage. As for other systems with an Al-K α source and a monochromator, the peak width of XPS signals is ~0.6 eV at half maximum. This facilitates an energy resolution of ~0.2 eV.
A wide variety of gas compositions can be realized due to the gas mixing setup consisting of multiple mass flow controllers. At the present state, the following lines are attached to the setup: Ar, He, H2, O2, and N2 with purity 6.0 as well as CH4 (4.5), and C2H4 (2.6). H2O vapor is provided through pure water (cleaned by freeze–thaw cycles) which is filled into a flask attached to a mass flow controller. Moreover, it is possible to change to other desired gases. The flow of each mass flow controller can be adjusted between 0.5 and 5 min−1. When dosing the desired gas phase into the reaction chamber, total flows between 12 and 20 mL min−1 (depending on the gas) at 1 mbar are reached. For higher pressures, the total flow increases. The setup itself is designed to operate from 2 × 10 10 mbar up to 20 mbar. Under real conditions, the pressure used in experiments depends on the signal to noise ratio of the XPS signal as well as on cooling effects of the gas phase. For instance, for pressures above 1 mbar in H2 rich gas atmospheres, the necessary laser power to reach 700 °C increases strongly. The gas phase is analysed by a Prism Pro Mass Spectrometer (MS) from Pfeiffer placed at the second differential pumping stage of the NAP–XPS analyzer. At this position, the MS analyses the gas composition that is pumped through the nozzle in front of the sample (working electrode). Thus, it is sensitive to the catalytic properties of the sample surface.
For measuring EIS we decided to utilize three-electrode geometry that allows reliable separation of working and counter electrode impedance and half-cell overpotentials. When using two electrode geometry, the counter electrode may significantly contribute to the measured polarization resistance, e.g., if an undesired reaction with the gas phase takes place. Therefore, the three-electrode setup gives much more reliable experimental values. EIS measurements can be carried out simultaneously to XPS measurements, since the AC amplitude is sufficiently small (typically 10 mV), for the surface chemistry to remain in the equilibrium state.

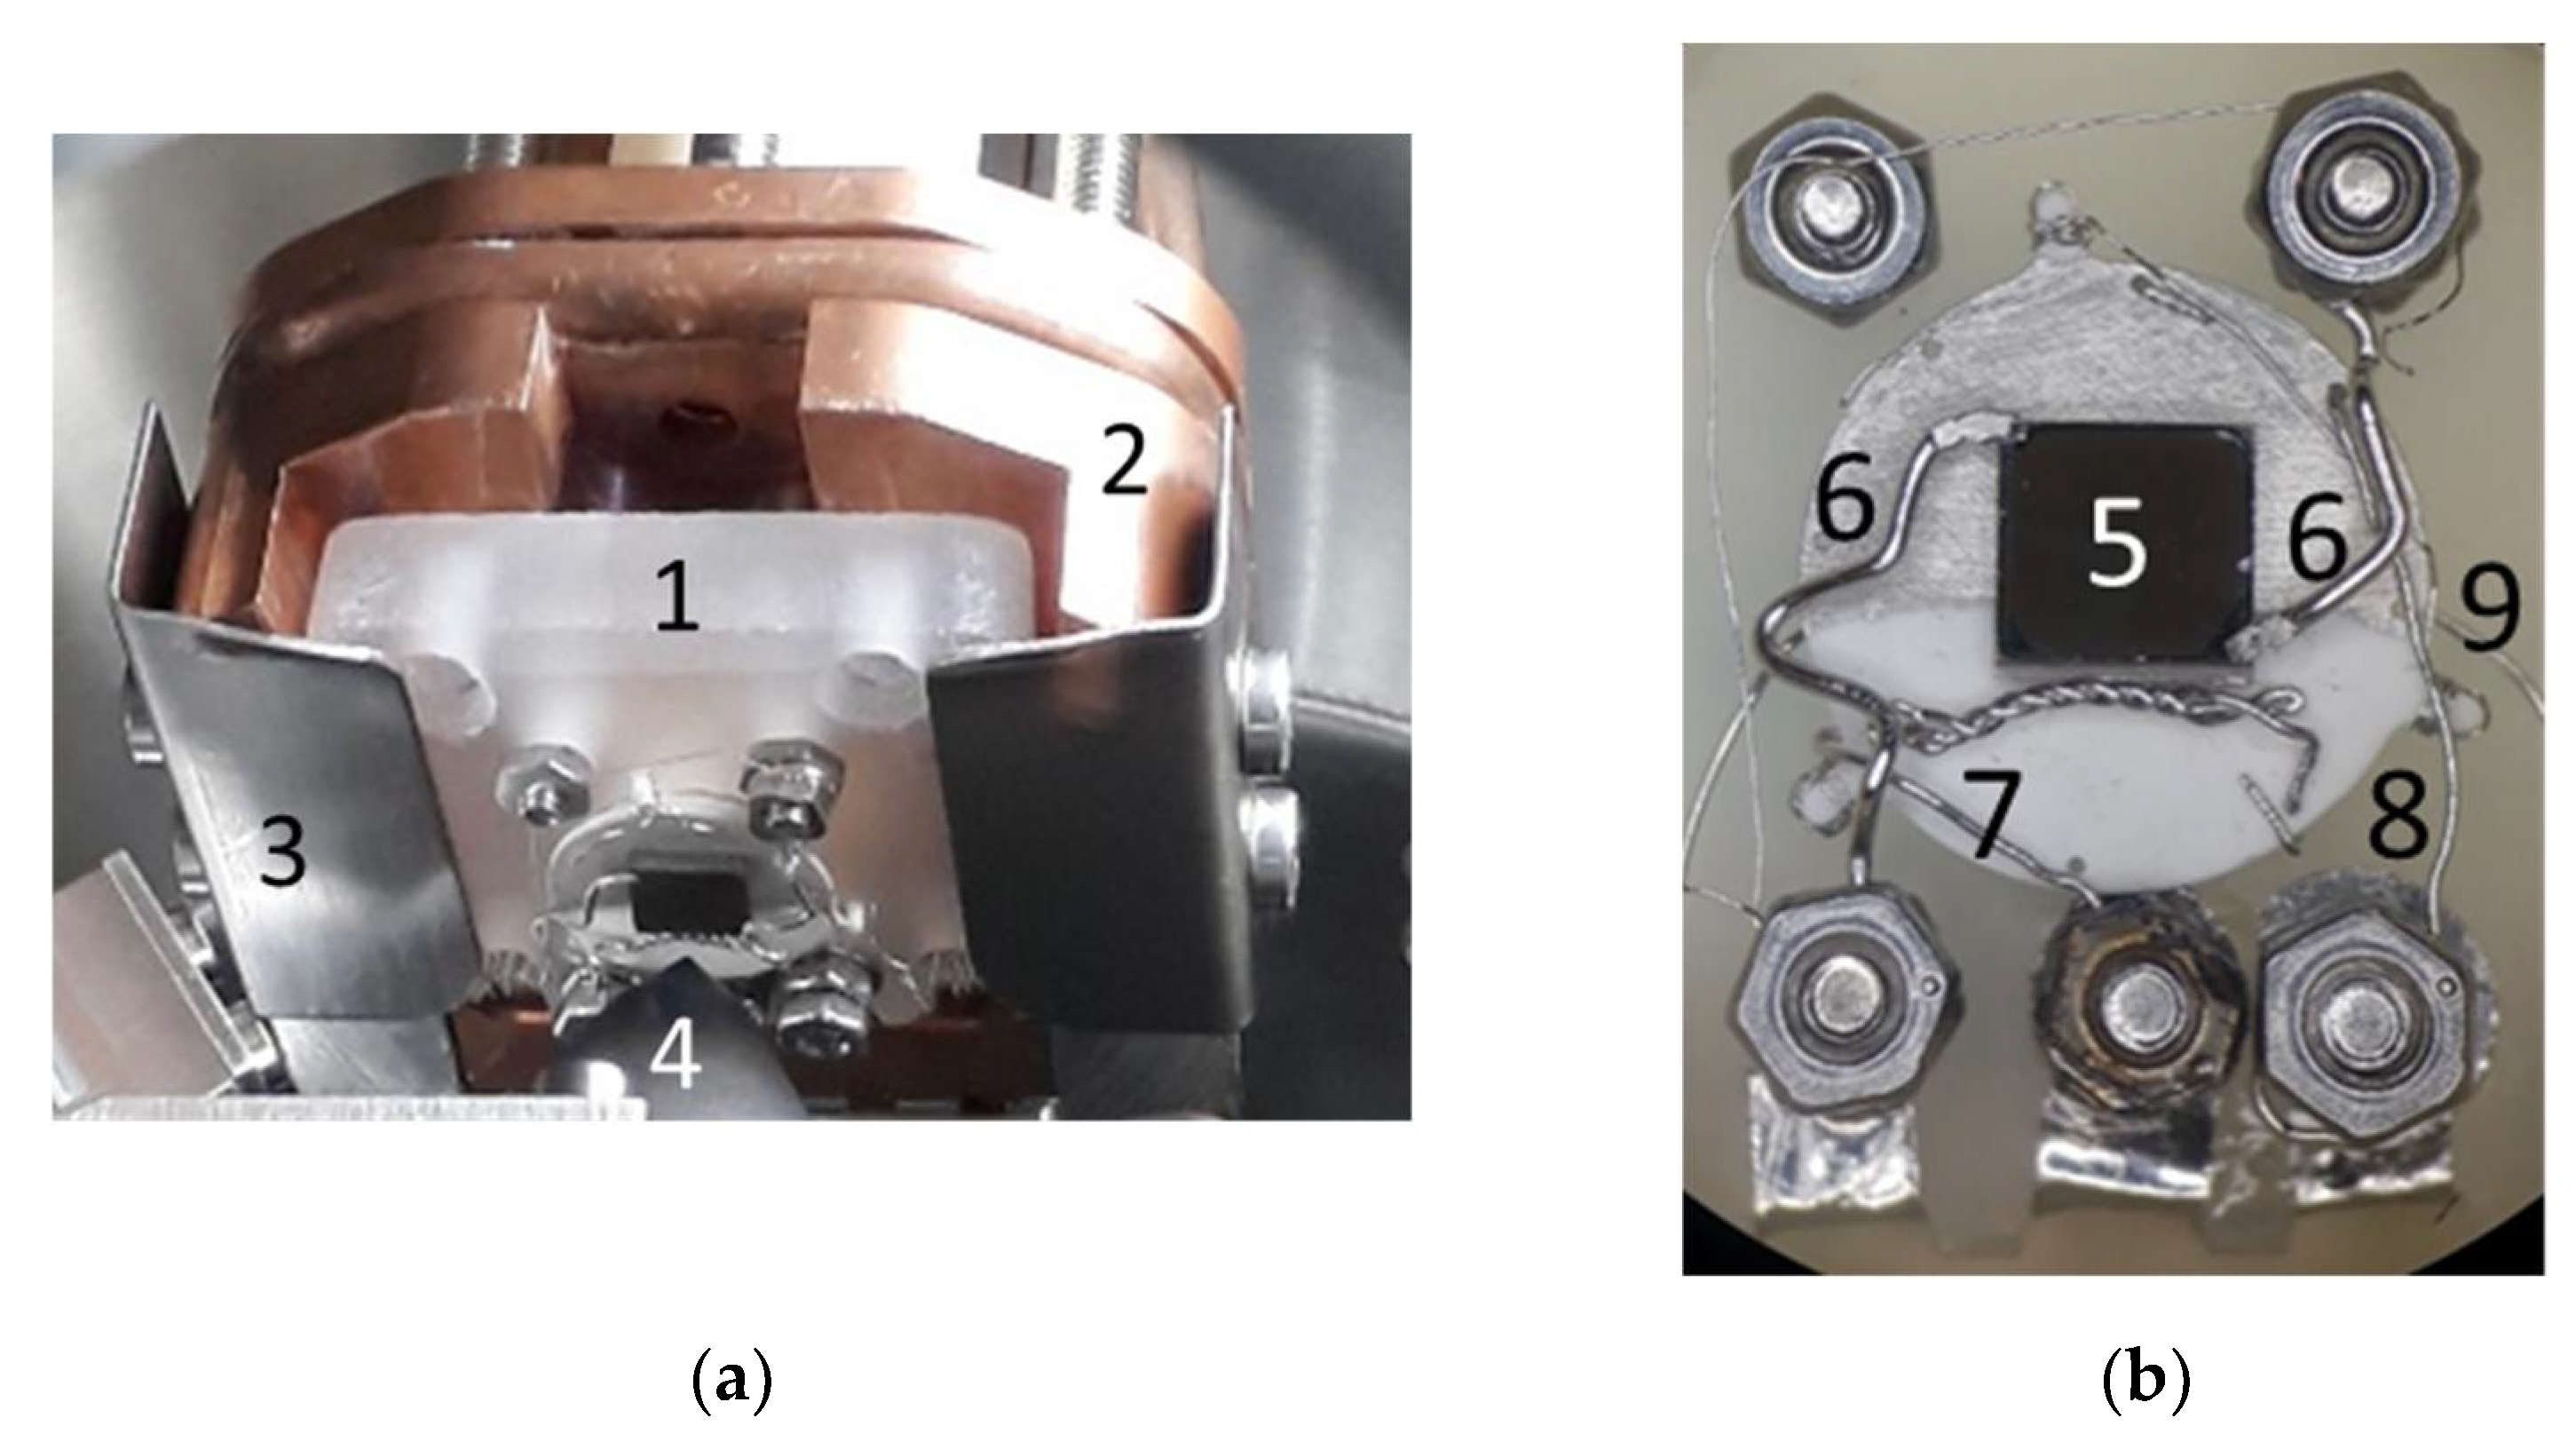
2.2. Sample-Stage and Sample Mounting

The requirements for the design of the sample-stage and sample-holder with respect to their application in catalysis and electrochemistry were diverse and numerous. They are presented in the following:
All elements used for the sample–holder or the sample stage should ideally be not active (or only very weakly active) for any investigated catalytic reactions. An elegant way to achieve this, is to ensure that only the sample itself is heated during catalytic reactions. Therefore, heating is done by an infrared laser (details see below) and the whole sample-stage head is cooled with water (copper tube visible in Figure 2). As a result, the sample stage is (nearly) at room temperature even when the sample is heated to very high temperatures. For the thermocouple, an S–type configuration (Pt10Rh–Pt) was used instead of the common K-type (NiCr–Ni) to avoid any interfering Ni or Cr evaporation at high temperatures and oxidation/corrosion of electrical contacts. Additionally, catalytic reactions should be impacted as little as possible by the presence of a thermocouple.
In order to minimize unwanted catalytic activity or evaporation of contaminants from a conventional sample heater, laser heating was chosen. Consequently, a stainless-steel tube is mounted in the center of the sample-stage, which acts as housing for the laser beam. In order to still guarantee high pumping rates in UHV, the tube has a recess in the middle, which is covered by a larger half tube to ensure high laser safety. To increase laser efficiency, a laser absorbing back plate can be placed behind the sample. Additionally, direct laser heating of the sample through an appropriately dimensioned hole in the sample holder is possible.
The laser is coupled into the setup via a viewport. This enables simple maintenance and quick adjustment of the laser spot position. The optical fiber ends in a collimator, which is mounted in front of the window. In order to avoid damage to the laser fiber, back reflection is avoided by several measures: The laser enters the sample-holder slightly off-center as well as slightly off-axis such that the spot on the sample is centered, while a polished sample surface will not directly reflect light back into the fiber. The window used to couple the laser into the setup is tilted to avoid reflections off the window into the fiber in case the coating of the window is damaged. The box housing the window and the collimator are encased in an aluminum box for additional laser safety. Two thermocouples are used to monitor the temperatures both at the spot of the laser back reflection as well as the overall box temperature on the outside. The two green tubes visible at the backside of the box (in Figure 3) are part of an additional air-cooling of the laser coupling.
For EIS measurements, there are 6 BNC (Bayonett Neill–Concelman connector) feedthrough connections in the CF 63 flange. Additionally, two thermocouple connections (+,−) are present. The water-cooling to and from the head of the sample-holder is realized by copper tubes connected to the CF 63 flange with the optical window for the laser heating in its center. With this layout all necessary feedthroughs and components of the sample-stage are realized on the CF 63 flange. Moreover, the sample-stage is adjustable in total length to provide flexibility and adaptability. This is done mainly to ensure the stages compatibility with synchrotron facilities, where flexibility is appreciated.
For high temperature measurements, minimization of thermal expansion of the sample-holder is desired, as otherwise the sample-nozzle distance would be changing, which in turn would interfere with the NAP–XPS measurements. Consequently, the sample-holder is made from quartz, which has negligible thermal expansion and is catalytically inactive. The sample-stage itself does not expand due to water-cooling. The sample-holder is held in place by four spring mounted stainless steel balls, which are located behind the sample-holder.
In-situ solid-state electrochemistry measurements are possible when an electrochemical model cell with the proper electrical contacts is heated inside the NAP-XPS chamber. In case of SOFC/SOEC related studies, model cells with a thin film working electrode (cf. Figure 1) are an excellent configuration for mechanistic kinetic studies, which allow simultaneous determination of electrochemical performance by measuring the current-voltage characteristics and observation of surface chemistry and reaction intermediates by NAP–XPS [12,16]. For three-electrode measurements [23], a new electrolyte design is used, where the reference electrode (RE) is placed on a protrusion (visible in Figure 1). This design allows precise differentiation of working and counter electrode over-potentials and impedance spectra [26].
For EIS, the sample is mounted on a CNC machined alumina back plate, which in turn is placed on the sample-holder as seen in the left side of Figure 4. The back plate is positioned on top of the central hole of the quartz sample-holder. For efficient heating and minimizing the thermal contact of the sample (i.e., minimized loss of heat) and sample holder, the alumina back plate only touches the quartz sample holder on three small legs. The thermocouple is mounted inside a bore of the back plate to ensure accurate temperature measurements. Significantly higher sample temperatures are possible when the electrochemical model cell is mounted above a bore in a modified version of the alumina back plate, and directly heated by the IR laser. With direct sample heating, sample temperatures above 800 °C are easily achieved already at 20 W laser power, while the alumina back plate remains several hundred degrees colder.
The electrochemical model cell is mechanically fixed and electrically contacted by clamps made from a Pt–Ir alloy. The upper half of the alumina cylinder (Figure 4, right) is covered with Pt to establish the electrical counter electrode contact. The reference electrode is contacted by a Pt-Ir wire, visible below the sample in Figure 4.

2.3. Fabrication of the Electrochemical Model Cell

The electrochemical model cell was fabricated using an yttria-stabilized zirconia 5 mm × 5 mm × 1 mm single crystal (CrysTec, Germany) as electrolyte, which has a protrusion on one side, to enable placement of a reference electrode, as schematically depicted in Figure 1. Numerical simulations have shown that this design is perfectly suited for determining half–cell overpotentials and impedance spectra [26].
The porous counter and reference electrodes, consisting of a Gd0.1Ce0.9O1.9-δ and a Pt layer were manufactured by brushing of pastes containing Gd0.1Ce0.9O1.9-δ or Pt particles, terpineol as solvent, and ethyl cellulose as organic binder. These layers were then sintered at 1150 °C for 3 h to form a porous structure with high surface area and therefore fast redox kinetics.
The investigated working electrode consists of a Nd0.6Ca0.4Fe0.9Co0.1O3-δ thin film, grown on the YSZ single crystal by pulsed laser deposition (PLD) subsequently to porous electrode fabrication. To achieve better electrical contacting, a Pt thin film grid was prepared by sputtering and lithography before deposition of the perovskite thin film, thus being embedded in the thin film working electrode to avoid additional catalytic effects of Pt. For more details regarding sample preparation, see, e.g., Reference [16].

3. Proof of Concept

3.1. Layout of Experiments
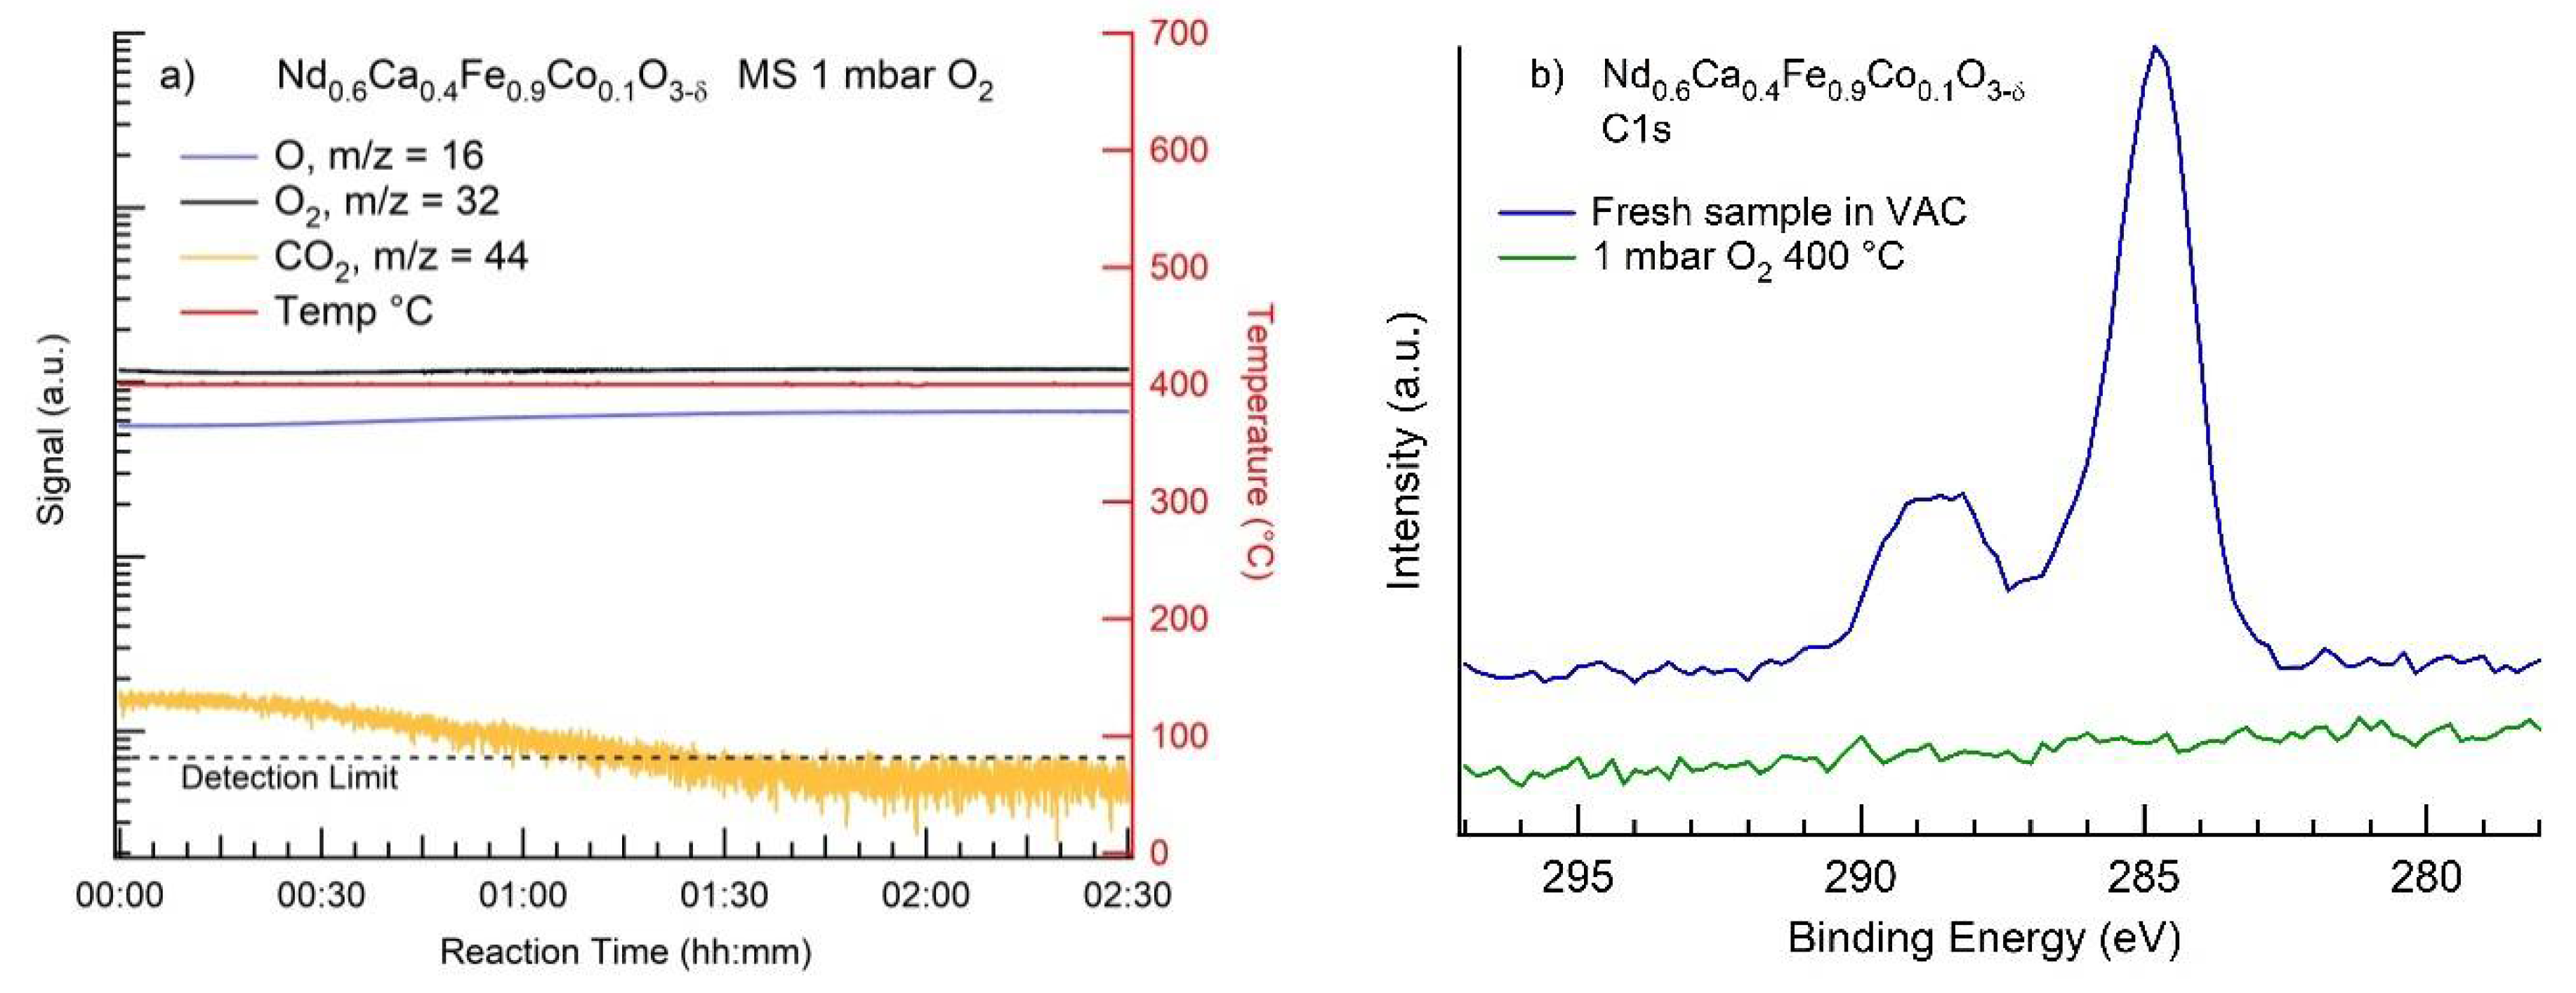
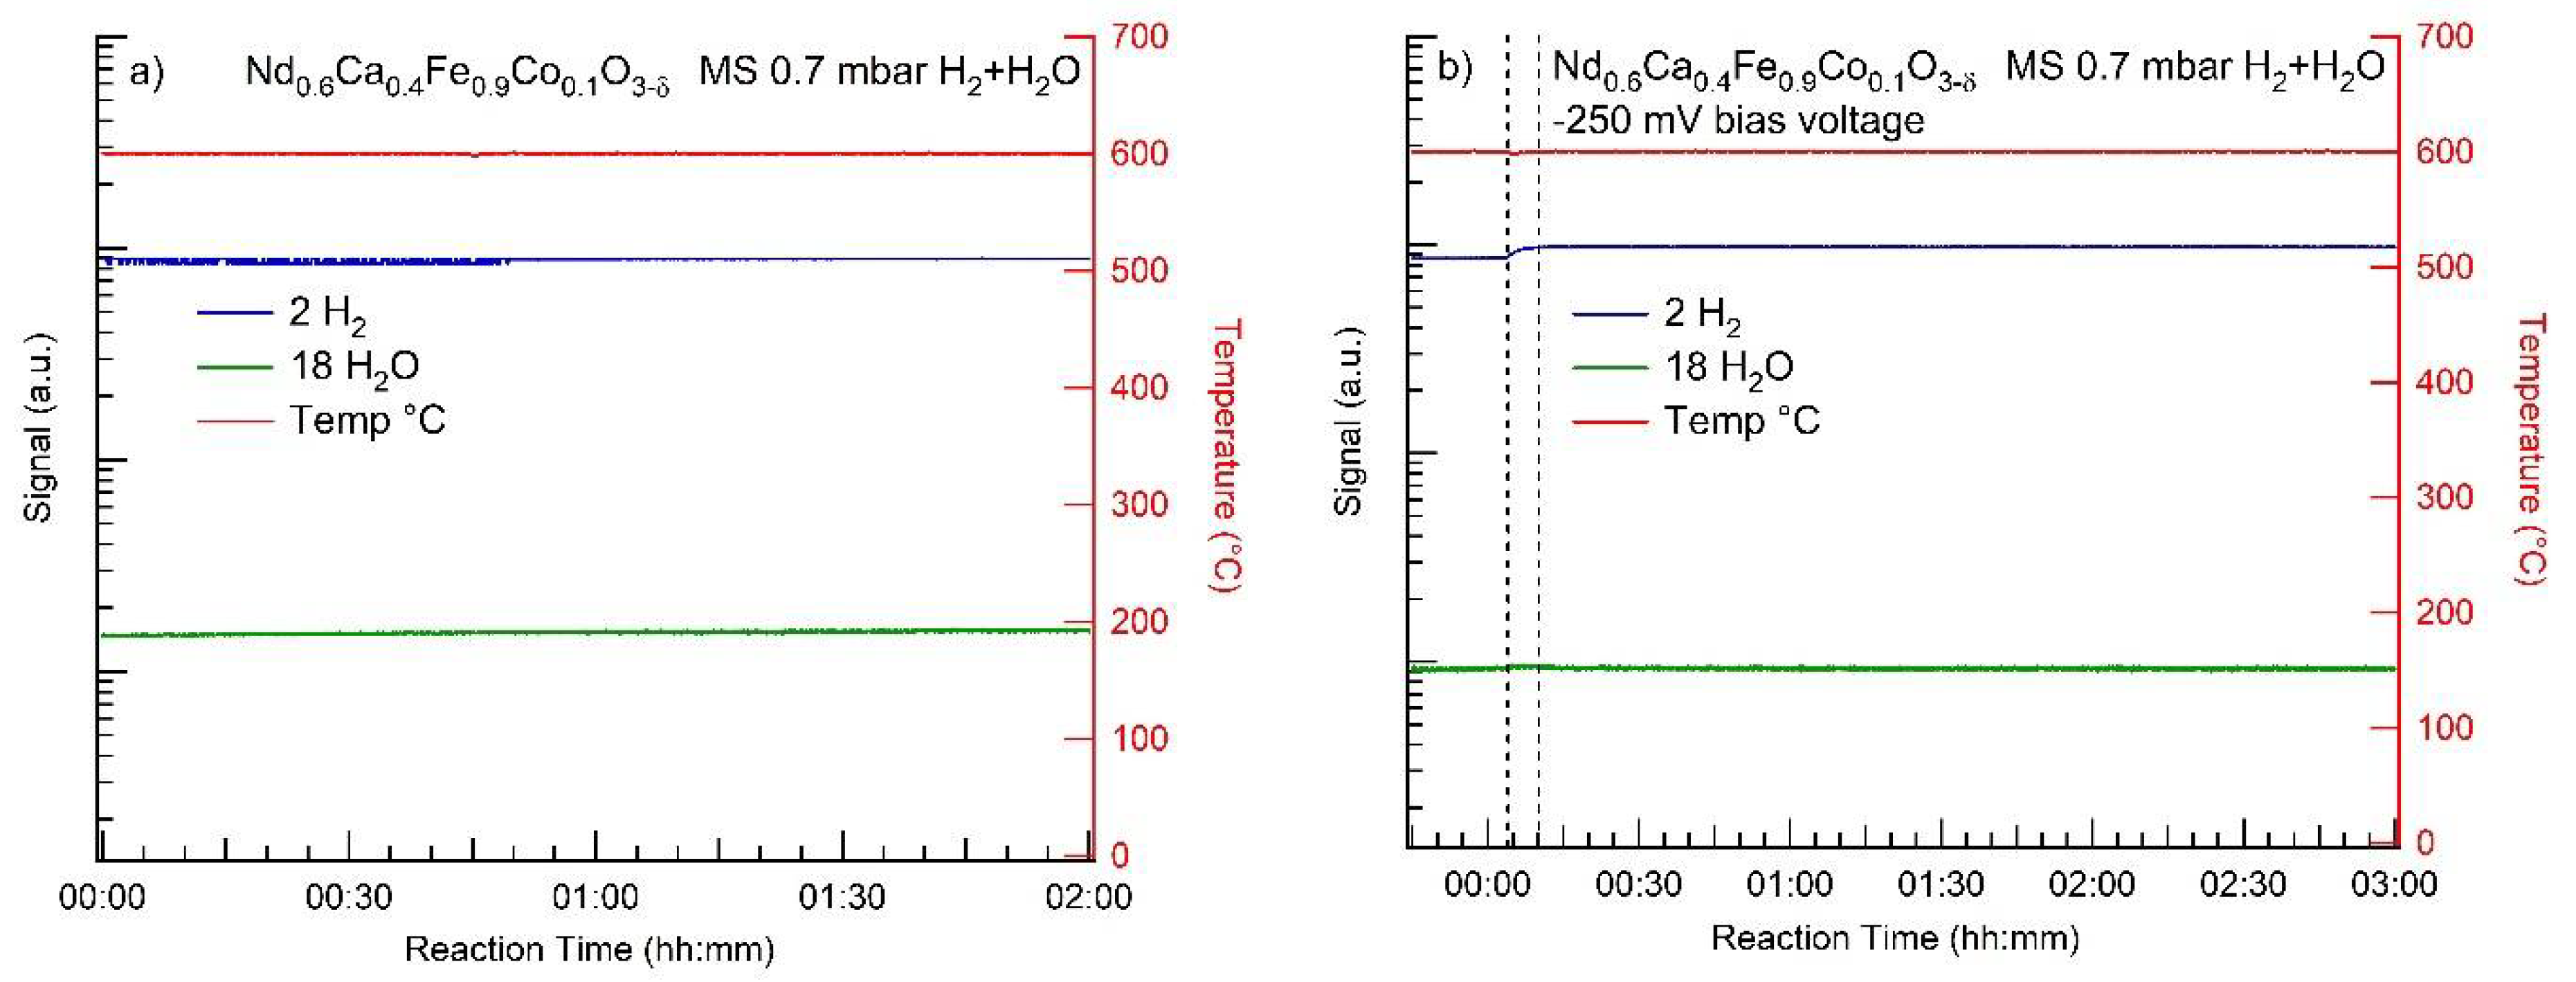
To demonstrate the performance of the NAP-XPS setup and novel sample-stage, the effects of gas phase, temperature, and bias voltage on a solid oxide working electrode are shown. To this end, the perovskite-type Nd0.6Ca0.4Fe0.9Co0.1O3-δ was exposed to different reaction conditions, while XPS, EIS, and MS were measured simultaneously. To set up the measurements, the electrochemical model cell with a Nd0.6Ca0.4Fe0.9Co0.1O3-δ thin film electrode was transferred into the NAP-XPS system through a load-lock. Subsequently, the sample was secured on the sample-stage. In order to minimize gas phase scattering of photo-electrons at the measurement position, the distance between sample and analyzer nozzle was set to 0.5 mm. For the respective experiments, either pure O2 or a H2O/H2 gas mixture was introduced into the experimental chamber in flow mode and the sample was heated from the back side as indicated in Figure 1.
After transfer into the NAP–XPS system, the sample surface usually contains significant amounts of adventitious carbon and carbonate species or other atmospheric contaminants. Therefore, the oxidation state of metal ions is not exactly defined [27]. To ensure a defined starting point for the electrochemical cells, an oxidation treatment was performed at elevated temperatures (400 °C at 1 mbar O2 with a flow rate of 3 mL min−1).

3.2. MS Results

Figure 5a shows the MS data from the oxidative treatment. It takes approximately 30 min to reach steady state conditions where no pressure and gas phase changes are detectable. This timespan takes temperature dependent shifts in account, which lead to small shifts of the sample–nozzle distance, which can in turn change the absolute XPS intensity. At steady state conditions, XPS and EIS were measured. Three different signals are visible: steady O2 and O signals (atomic oxygen is produced in the MS as an artefact of the ionization method) and the signal of CO2, decreasing over time [28]. Remaining surface carbon (impurities on the sample surface due to exposure to air) was converted to CO2 which is detected by MS. After 90 min the CO2 signal is at its detection limit indicated by the dashed black line in Figure 5a. The C1s photoelectron spectrum in Figure 5b depicts the amount of carbon on the sample before and after the end of the oxygen treatment where carbon was effectively removed.
After oxidation, the sample was cooled down in O2 and the measurement chamber was pumped out. Subsequently, the gas phase was changed to reducing conditions by switching to 0.7 mbar H2 + H2O with a ratio of 32:1 with 3 mL min−1 flow. After heating the sample for 30 min, a steady state both in gas phase composition and temperature was observed again and the XPS and EIS measurement were performed. The aim was to investigate, if these conditions are sufficient to (partially) reduce Fe and/or Co B–site cations in the perovskite host lattice and to trigger exsolution of metallic nanoparticles [29].
To reduce Fe and Co more strongly, the temperature was increased from 500 °C to 600 °C (cf. Figure 6a). Finally, a bias voltage of −250 mV was applied to the working electrode in order to further reduce the perovskite and enhance exsolution (shown in Figure 6b).
The detected MS signal does not significantly change when bias is applied to the system. While the perovskite working electrode catalyzes H2O splitting, H2 is oxidized at the counter electrode, which means the net atmospheric composition does not change. This indicates that the gas phase composition is rather homogeneous in the experimental chamber, due to the rather high diffusion coefficient of the gas phase species at 0.7 mbar. The small increase of the H2 signal in Figure 6b occurred due to a slight change in the H2 flow rate. To predominantly detect the gas composition close to the working electrode, the nozzle will be moved closer to the sample in follow–up experiments. However, there is an expected trade-off between the intensity of XPS signals and MS sensitivity.

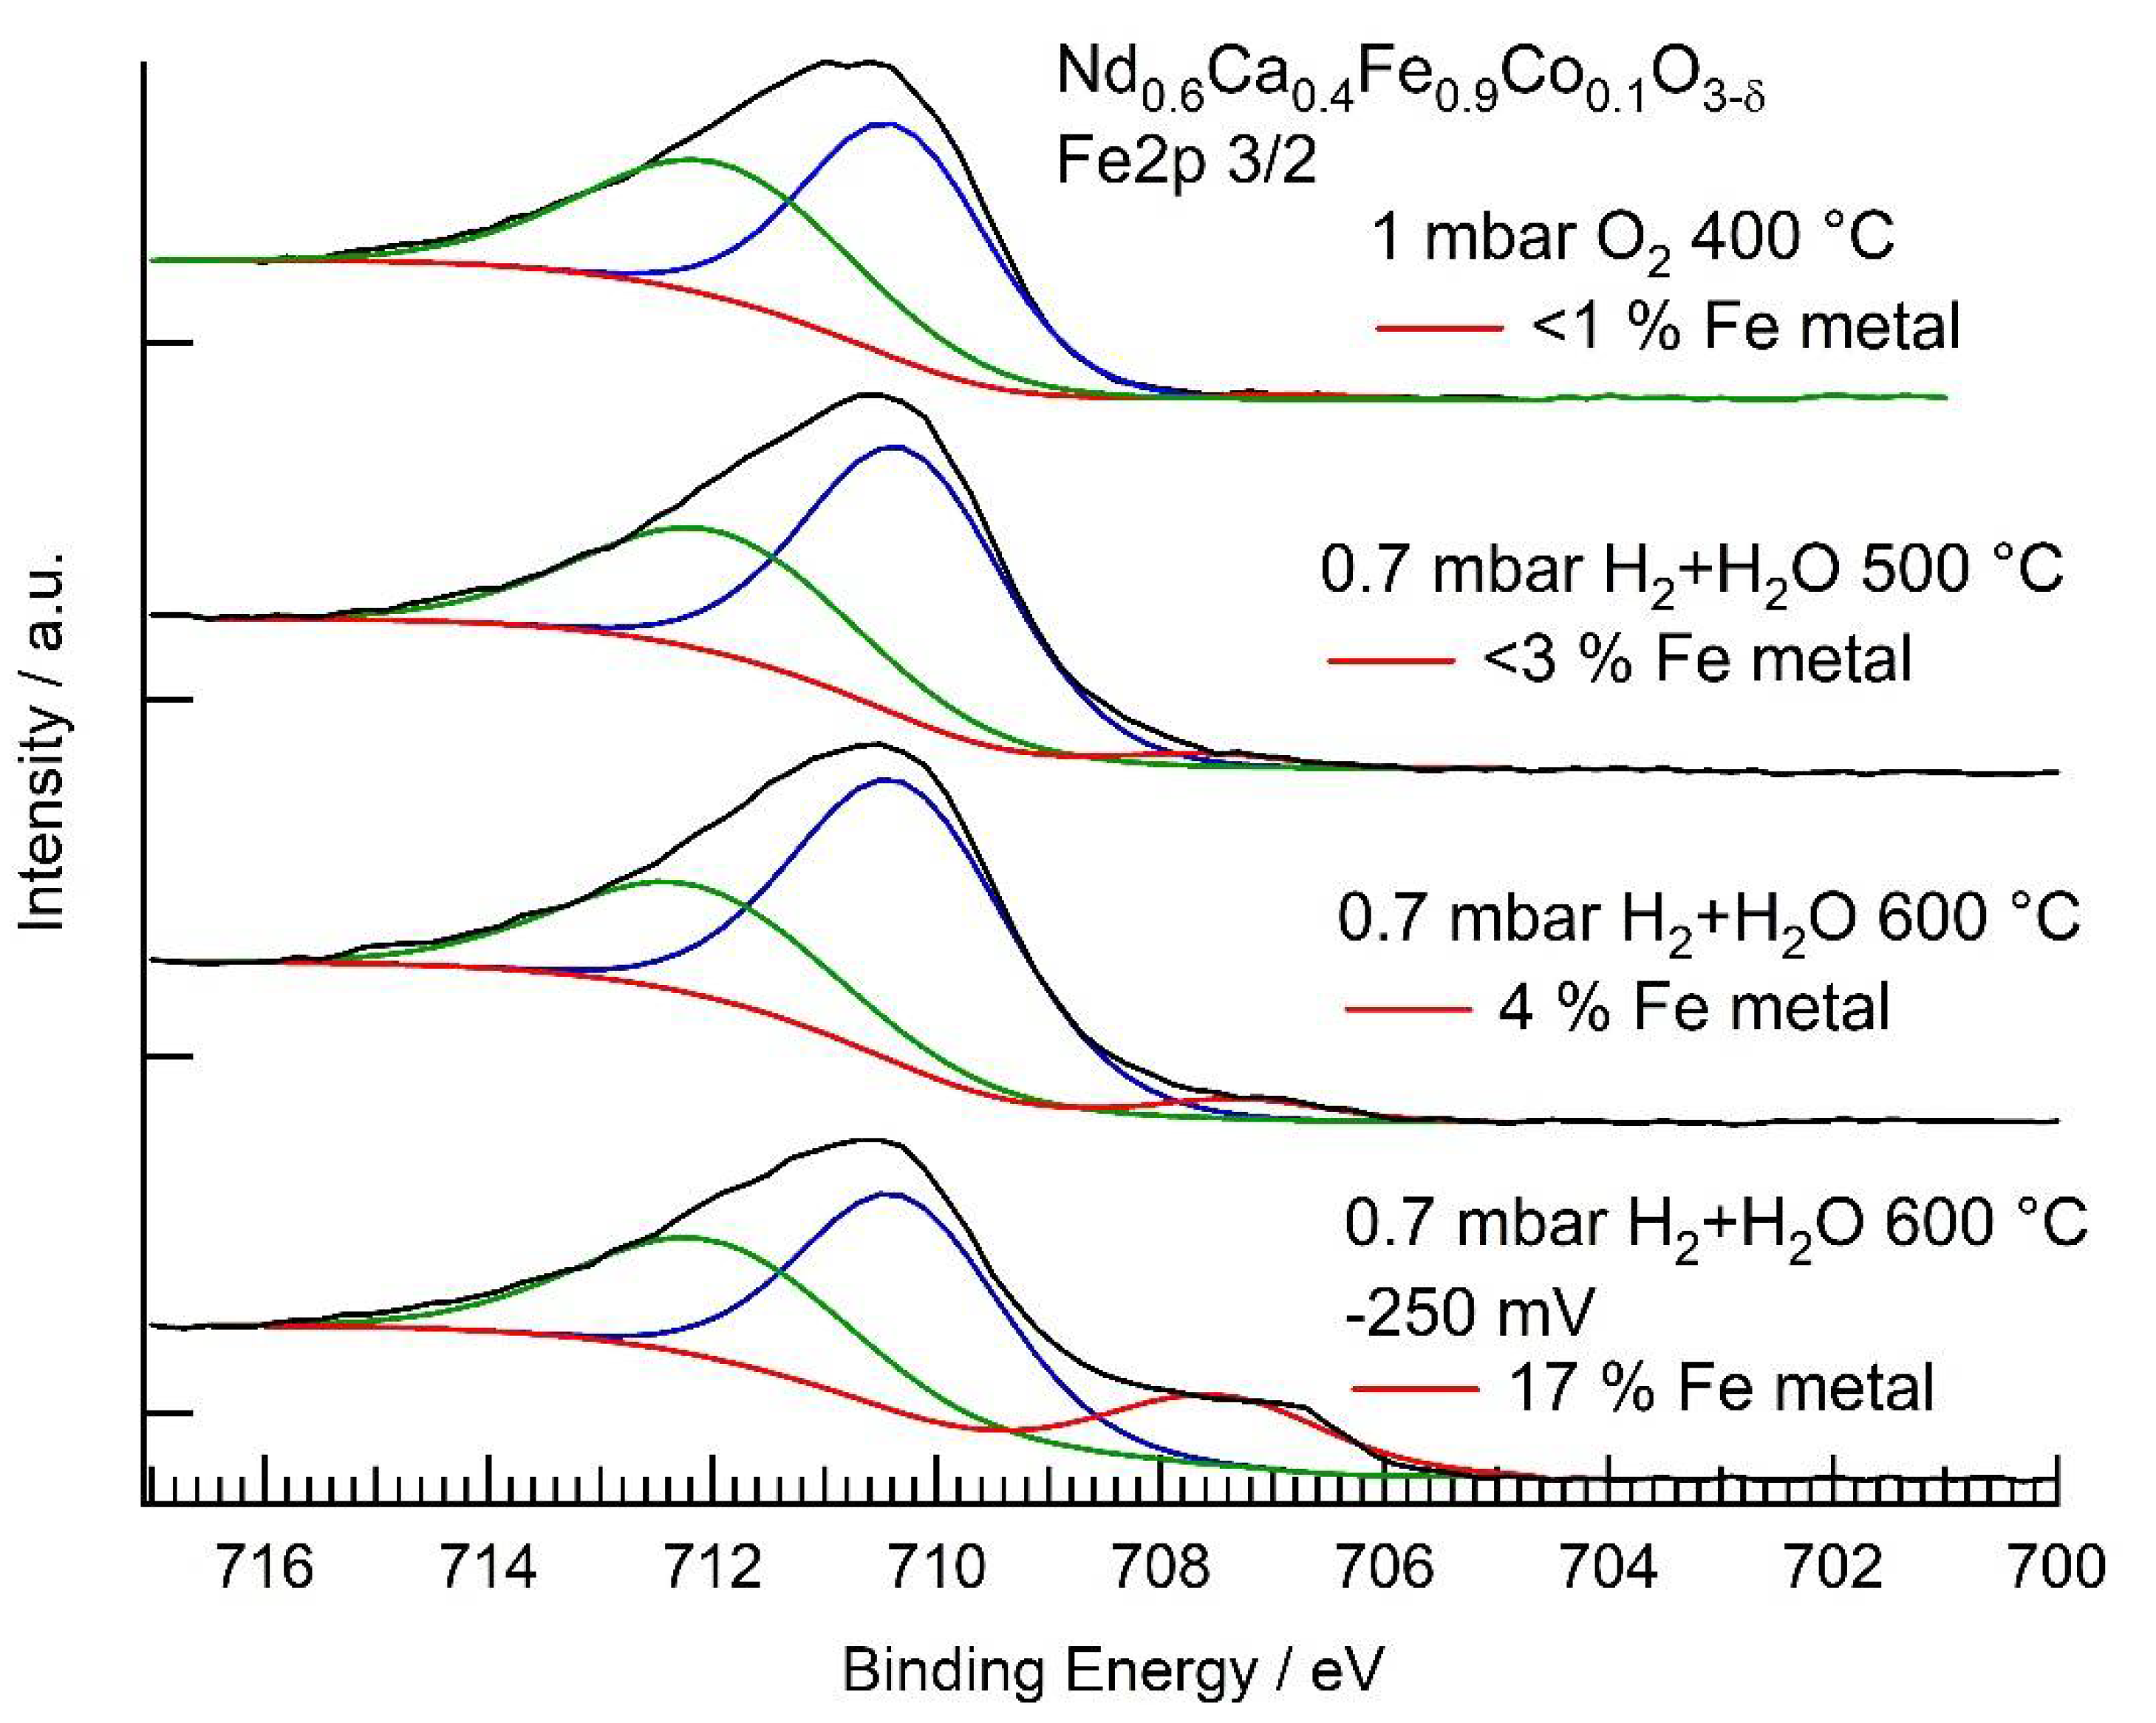
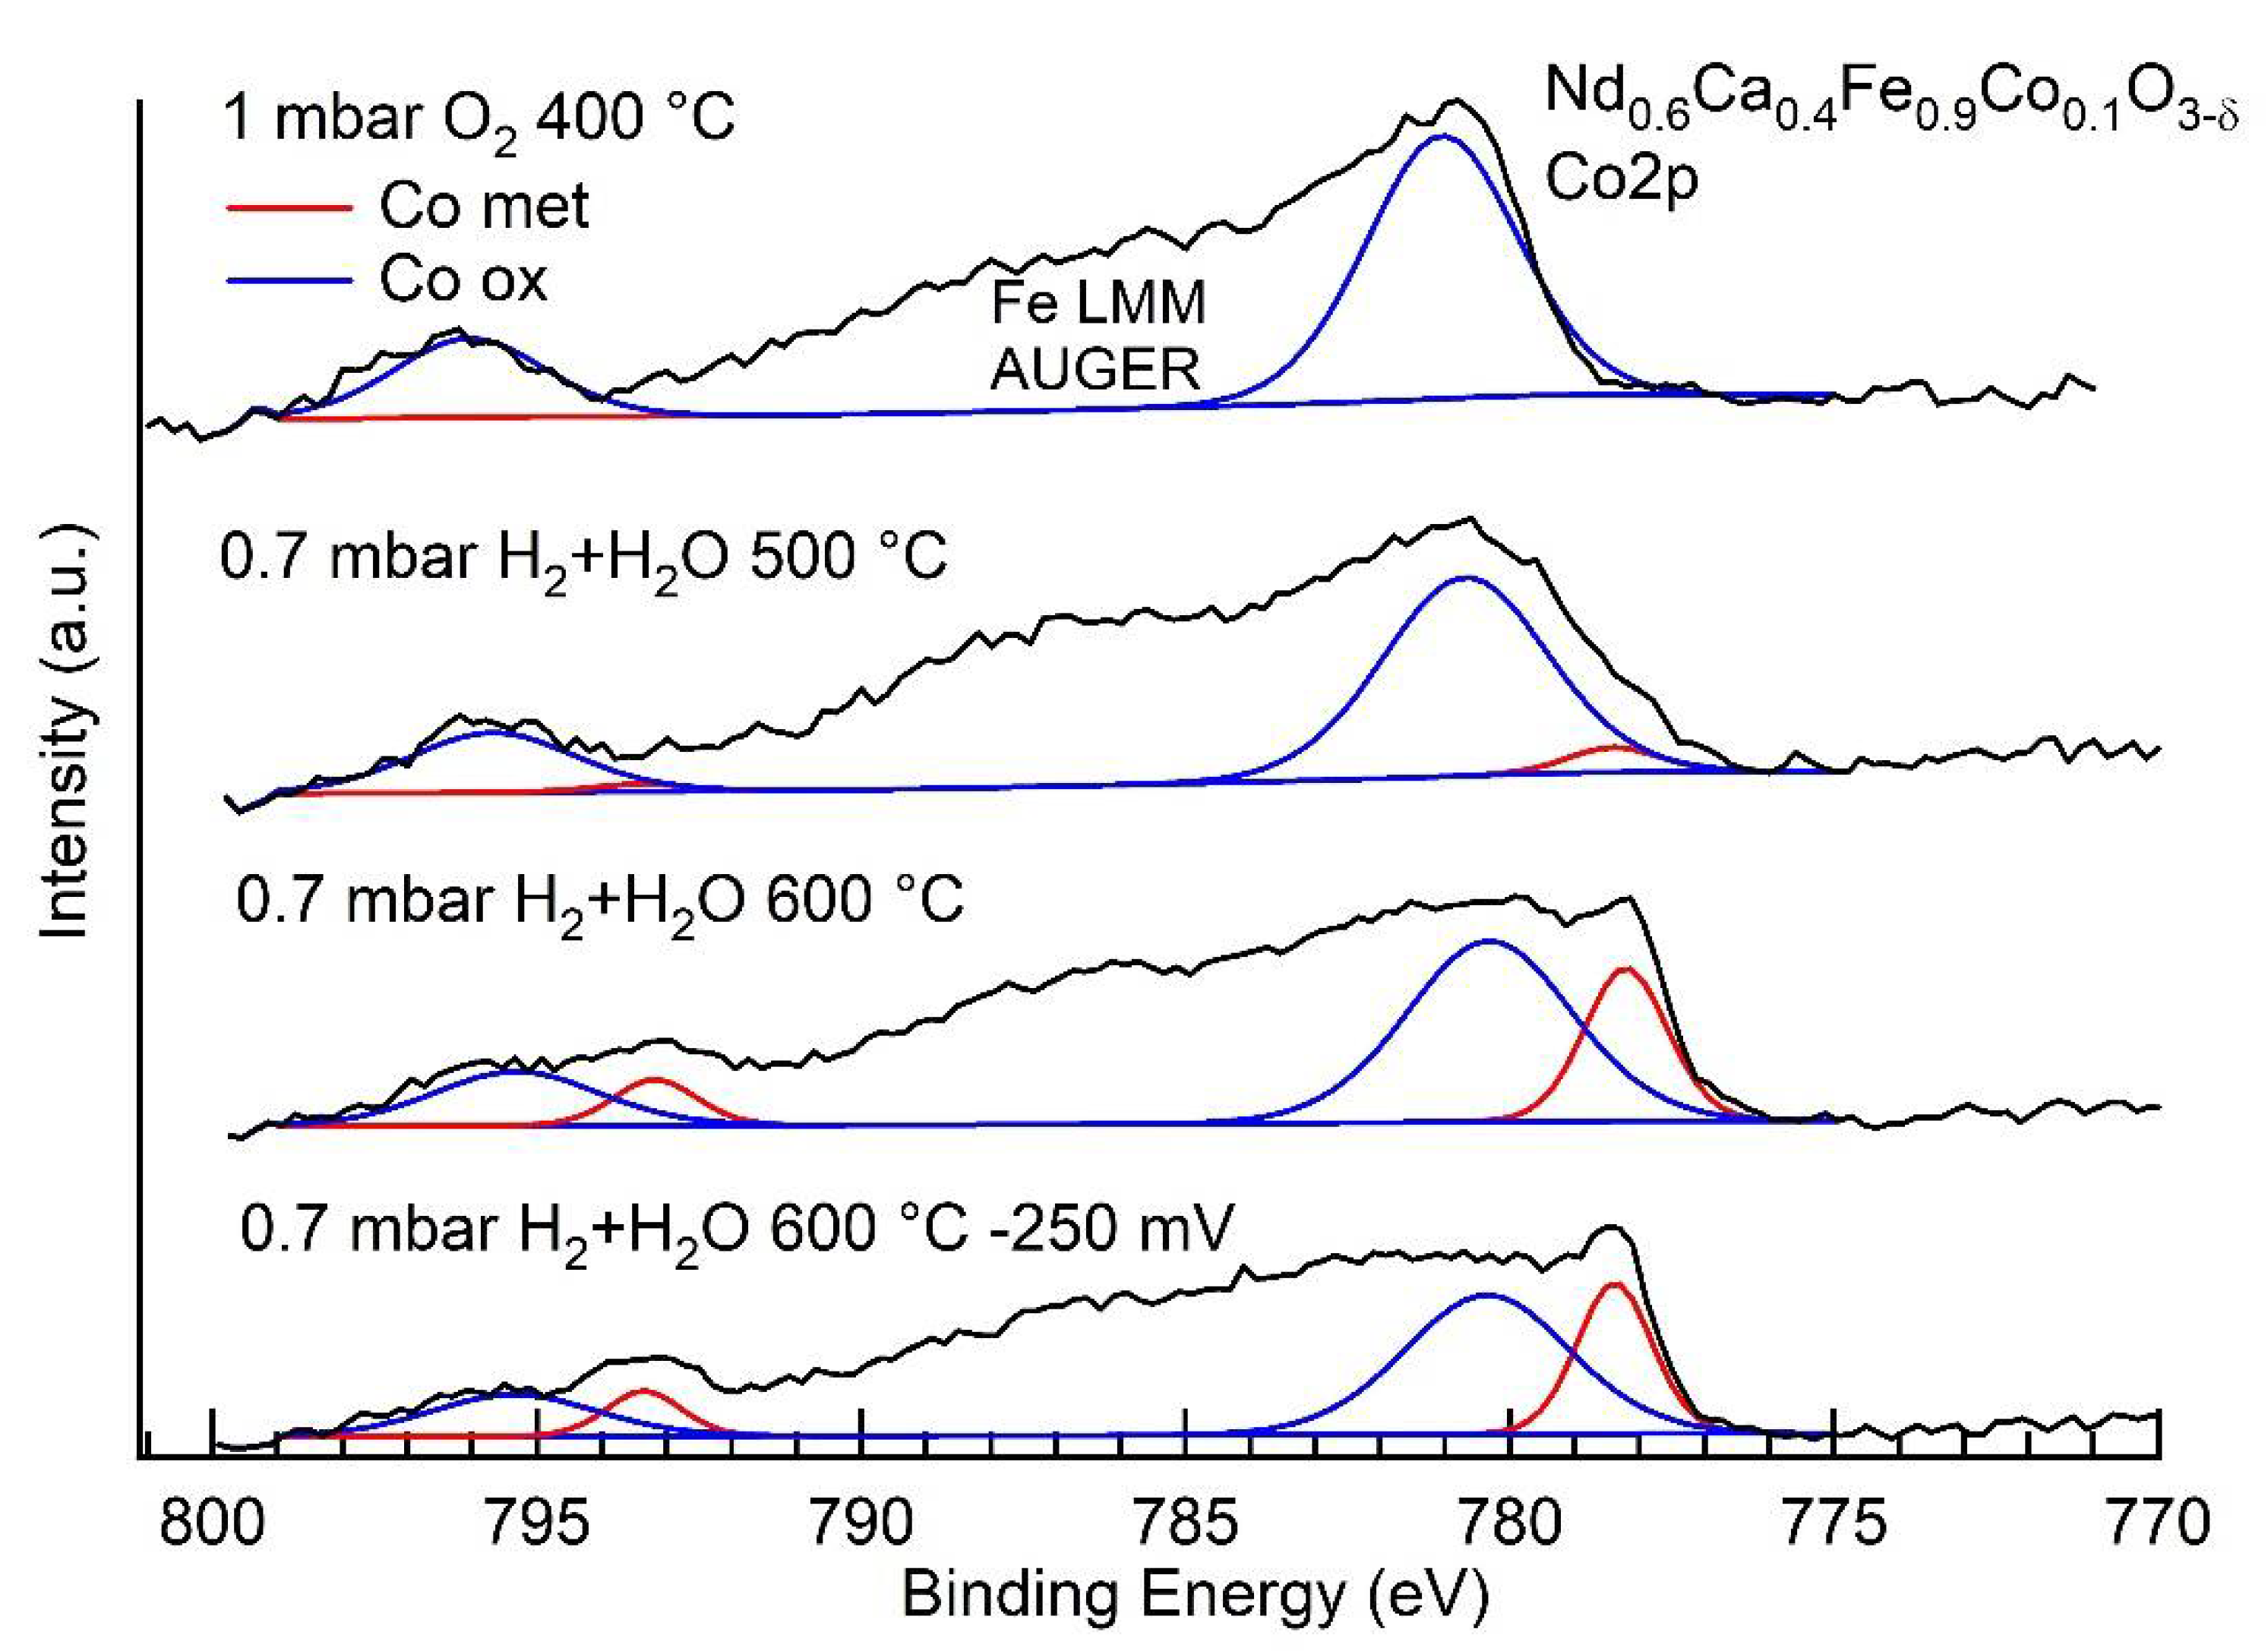
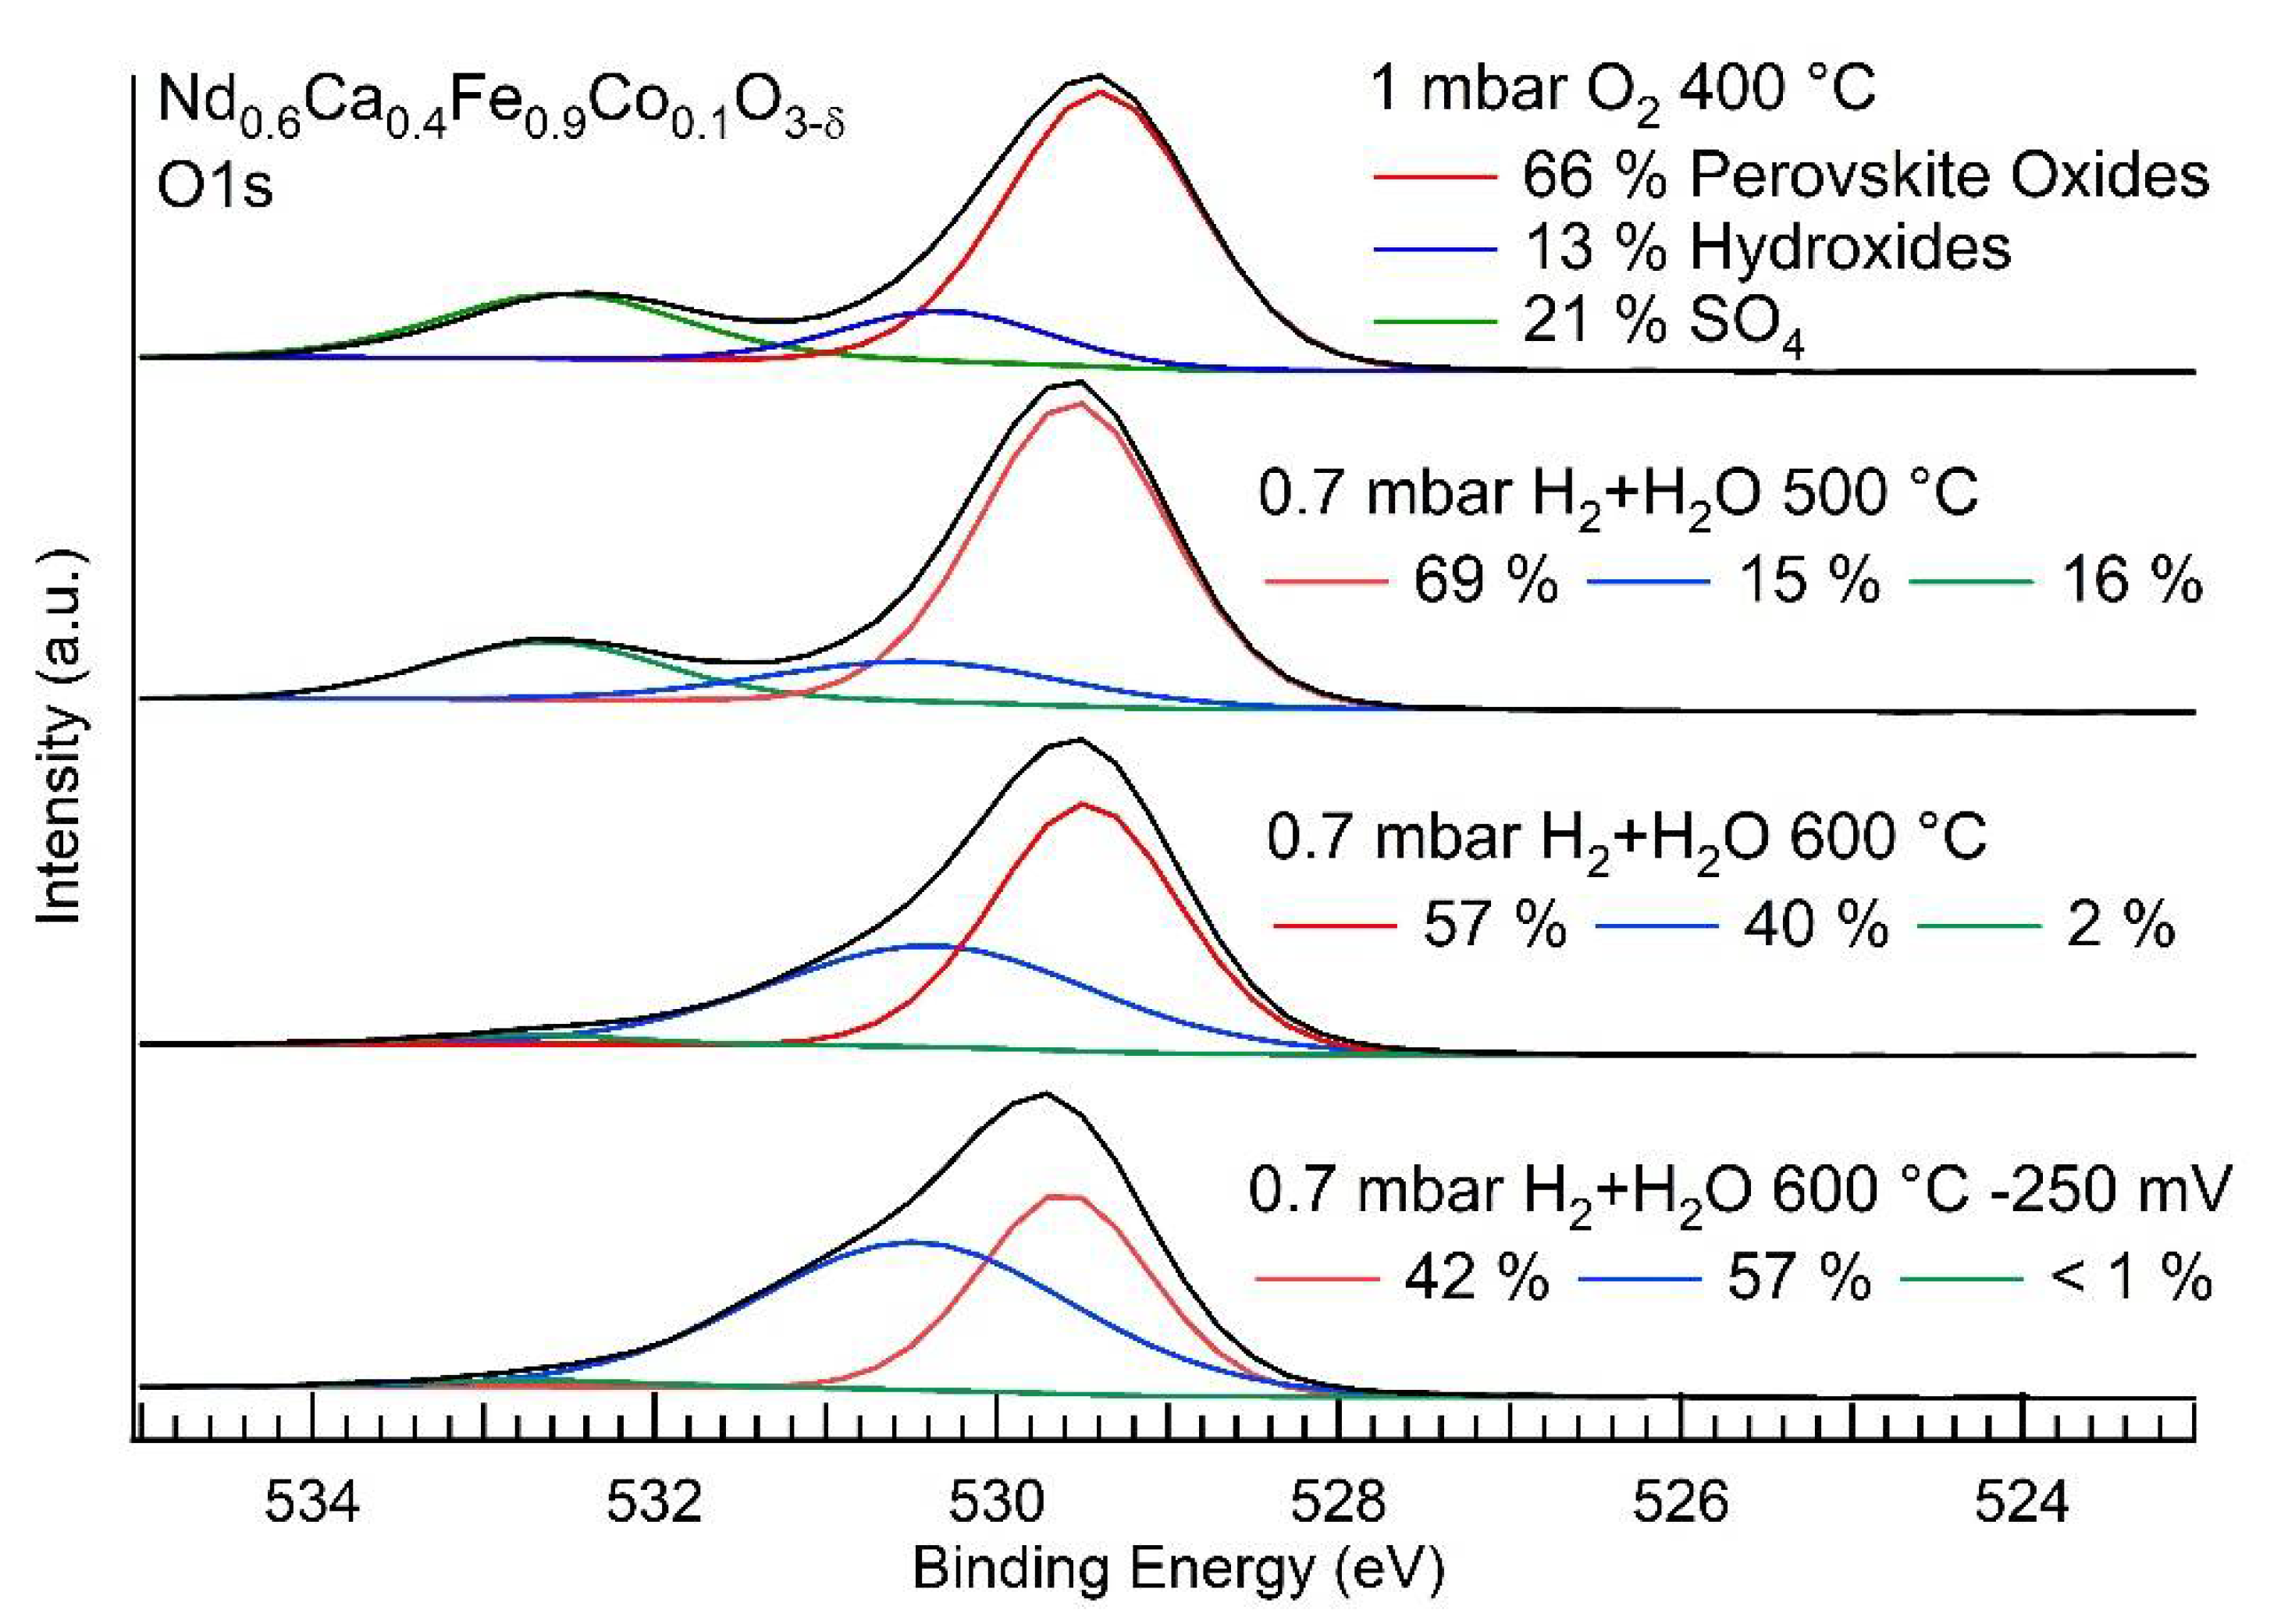
3.3. NAP-XPS Results

NAP–XPS spectra of Fe2p peaks are presented in Figure 7. Recording, calibrating, and fitting of the spectra were done with the software package Casa XPS provided by SpecsTM (Specslab, Berlin, Germany). Binding energies were calibrated by referring to the 1s signal of adventitious C (C1s at 284.8 eV) and for the region a Shirley background was used. The Fe2p 3/2 oxide peak was fitted with two components that both represent oxidized iron and account for the strong asymmetry of the Fe2p 3/2 peak. A clear assignment of both components to Fe2+ (710.3 eV, shown in blue) and Fe3+ (712 eV, shown in green) oxidation states is not possible, because the ratio of both components does not significantly change between oxidizing and reducing gas phases, although this would be expected from the defect chemistry of related ferrite perovskites [30,31]. The metallic contribution to the Fe2p 3/2 peak can be usually clearly distinguished as shown in [32] (red, 706.6 eV to 708.4 eV), however it is not clearly visible at 500 °C or less, but increases in intensity with more reducing conditions (e.g., higher temperature and cathodic bias). At 600 °C, this Fe signal becomes more strongly pronounced, with about 4% of the total Fe signal. When a cathodic bias of −250 mV is applied to the system, Fe is further reduced, and the Fe0 component is increased from 4% to 17% of the overall Fe signal. This correlates with the reported exsolution effect which was observed in recent works [29].
For Al-Kα lab sources, the Co2p region overlaps with an AUGER signal of Fe (LMM). To fit the Co signal, Nd0.6Ca0.4Fe0.9Co0.1O3-δ and Nd0.6Ca0.4FeO3-δ without Co–doping were compared to obtain positions and intensity restraints for the metallic Co and the Co oxide peaks. By doing so, the signals still can be fitted although overlapping with the AUGER signal, but one has to accept a somewhat higher error of the fit result. Nevertheless, the signal at 778 eV in Figure 8 can be attributed to metallic Co. During the experiment, its evolution was monitored. Starting at 400 °C in O2, no metallic Co signal could be detected. By switching to reducing atmosphere and 500 °C, the metallic Co contribution becomes visible, and it grows with increasing temperature as well as with applied bias to a value of 17% of the total Fe 2p signal.
A comparison of the ratio of Fe metal to Co metal is presented in Table 1. The table clearly shows how Co is predominantly exsolved at 600 °C. This leads to an increase in metallic Co to metallic Fe ratio at the surface. At 600 °C and with applied bias voltage, Fe is exsolved as well. Thus, the ratio is now similar to that at the start (500 °C). Both Co and Fe precipitates are present on the surface after this last experimental step.
In Figure 9 the O1s spectra are shown with three components fitted for the respective experiments. These three components are generally observed on ferrite and cobaltite perovskites [16,22,33], but the interpretation of their presence is not entirely conclusive in literature. Almost all studies identify the low energy component at 529.3 eV as lattice oxygen (red in Figure 9). The two other components were proven to be located mostly at the surface, and the species could be assigned to hydroxides (OH, 530.2 eV, blue) and sulphate (SO42−, 532.6 eV, green), respectively. The exact position of the O1s peak in perovskites (ABO3 structure) depends on the A and B species as well as the doping [34,35].
SO42− is stable on the perovskite up to 500 °C, however, it decomposes at 600 °C. The hydroxide component does not respond to the change in gas phase between 400 and 500 °C. Its signal increases when heating to 600 °C under reducing conditions and grows further when a bias voltage of −250 mV is applied to the working electrode. The increase in hydroxide seems to correlate with the increased amount of exsolved Co/Fe and thus with increased surface reactivity towards hydrogen activation as reported earlier [17].
In summary, the NAP-XPS results reveal a sequential Co (Figure 8) and Fe (Figure 7) exsolution. Depending on the chemical potential of the gas phase (i.e., strength of reduction), first only Co is reduced–only at higher temperatures and when applying a potential, significant amounts of Fe are reduced and exsolved as well. Consequently, a signal of metallic Co at 778 eV is already observed in H2/H2O at 500 °C. When raising the temperature to 600 °C the amount of metallic Co is increasing, but only minor amounts of metallic Fe at 707 eV could be observed. Only when applying −250 mV bias voltage, larger amounts of Fe were observed. To clearly distinguish the formation of a combination of pure Fe and Co nanoparticles from formed FeCo alloy particles, further investigations would be needed.

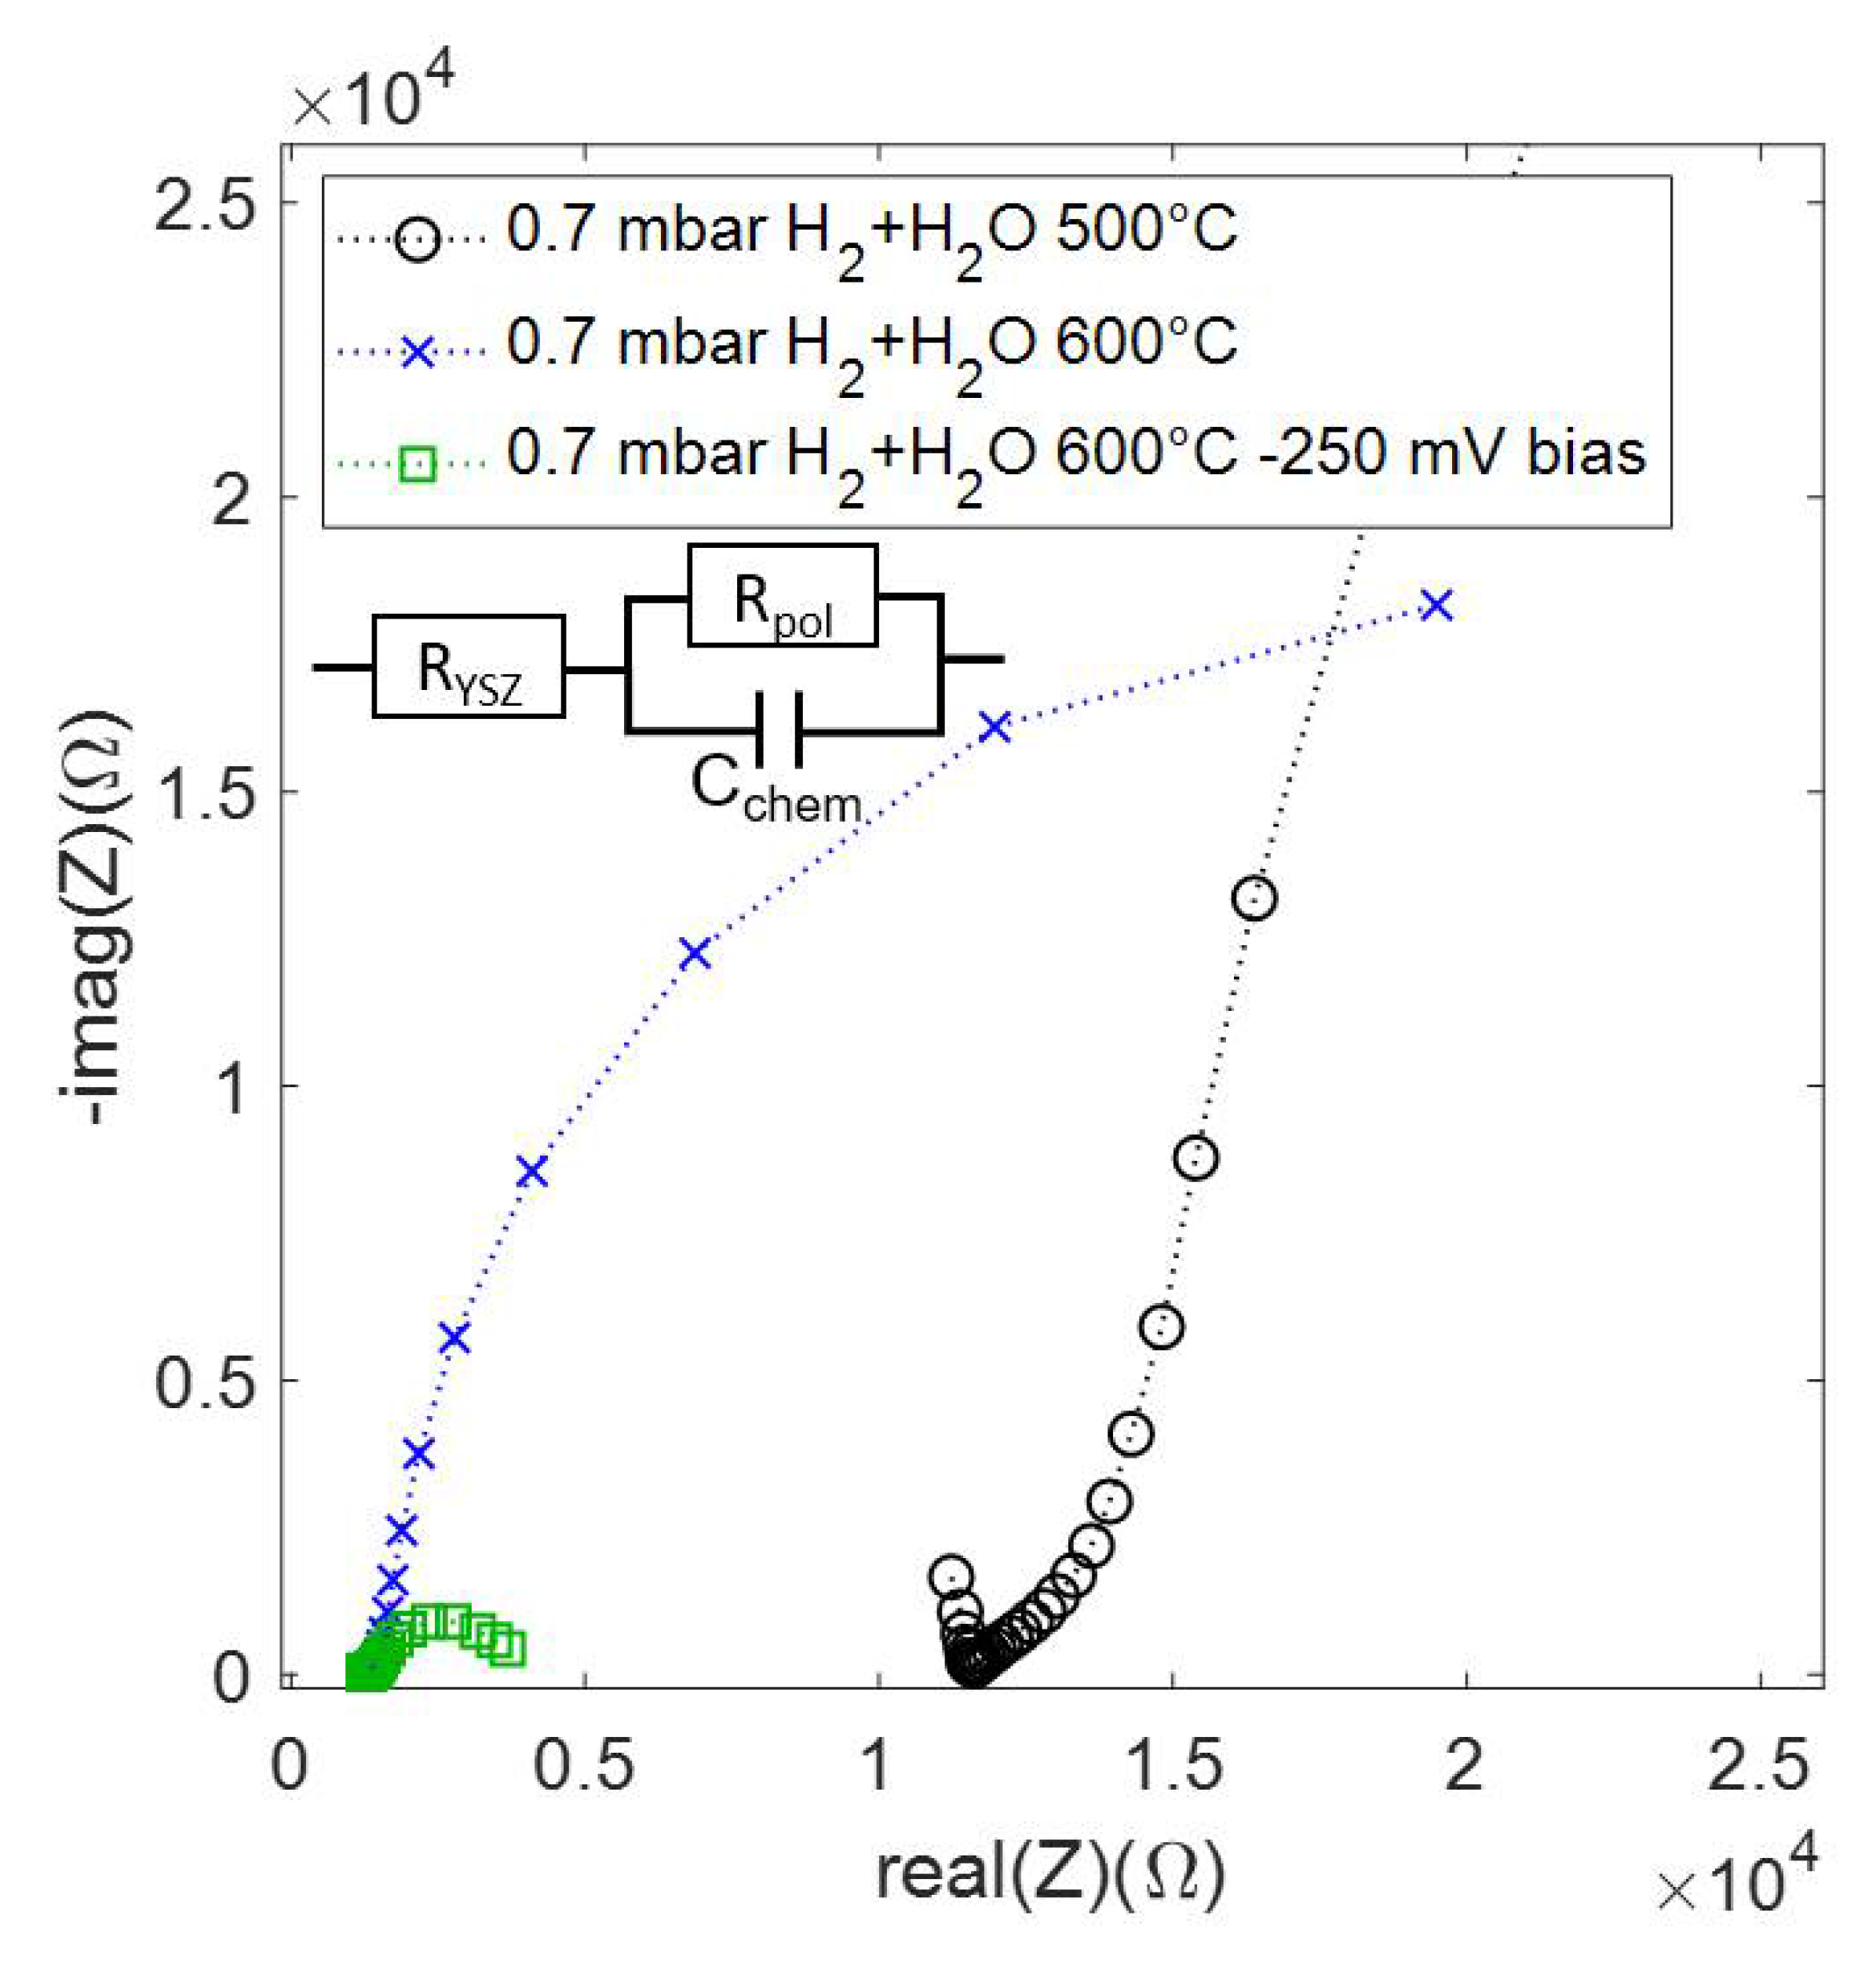
3.4. Electrochemical Characterization

Electrochemical impedance spectra were acquired simultaneously during XPS characterization. When doing EIS, a small AC voltage (of the order of 10 mV) is applied to the cell, in order to drive the defect chemistry and surface reaction slightly out of equilibrium. The magnitude and phase of the O2− ion current in the electrolyte is then measured as a function of frequency. Due to the small AC voltage, the sample surface chemistry remains virtually unchanged by the EIS measurement. Typically, EIS spectra are plotted in the complex plane (commonly called Nyquist plot), where each data point corresponds to a measurement at a different frequency (Figure 10).
This additional electrochemical experiment yields valuable supplementary information. The impedance spectra exhibit a high frequency real axis intercept of 12,000 Ω at 500 °C and 1200 Ω at 600 °C. This axis intercept correlates with the resistance of oxide ion conduction through the YSZ electrolyte. Therefore, the ionic conductivity determined by EIS (and the geometry of the electrolyte) can be used to directly obtain the temperature of the model cell via the known conductivity-temperature relationship of YSZ (see for instance Ref. [25]). This analysis gives a cell temperature of 510 to 520 °C, while the thermocouple indicates 600 °C. In addition, impedance spectra exhibit a dominant semi-circular arc at low frequencies. In the spectrum acquired at 500 °C, only a fraction of this arc is visible. A smaller impedance arc corresponds to higher oxygen exchange (H2 oxidation or H2O splitting) activity [36,37], so the smaller arc at 600 °C results from the thermal activation of the oxygen exchange reaction. It was previously shown that thin film electrodes with current collector typically have kinetics that are limited by the surface reaction [16,37]. In this case and at open circuit conditions, the electrode arc diameter (Rpol), one can also calculate the equilibrium rate of the H2 oxidation/H2O splitting reaction ( R e q ) on the electrode surface, according to Equation (1) [38,39].
R e q = R T ( n e F ) 2 R p o l A
where R is the gas constant, T is the temperature, F is the Faraday constant, ne is the number of electrons transferred during the reaction ( n e = 2 ), Rpol is the polarization resistance (i.e., the low frequency impedance arc diameter), and A is the electrode surface area. With applied bias, the impedance arc size decreases strongly, which is the common behavior of a non-linear electrode resistance. In addition, a further activation effect may be observed here due to the increased concentration of catalytically active metallic Fe and Co particles [17]. For an unambiguous separation of both effects, additional electrochemical experiments would be needed, which is beyond the scope of the present paper. Due to the non-equilibrium conditions, instead of the equilibrium exchange rate, the net reaction (H2O splitting) rate R n e t can be calculated from the DC current by Faraday’s law. R n e t = I D C / n e F A . Lastly, when fitting the data with an equivalent circuit (depicted in the inset of Figure 10), the capacitance of the impedance arc (Cchem) can yield valuable information about the concentrations of point defects in the bulk. For acceptor doped ferrite perovskites, which have a relatively large amount of oxygen vacancies in reducing conditions, and relatively few reduced (from 3+ to 2+) Fe or Co ions, the amount of reduced ions can be calculated by Equation (2) [30,40].
[ F e + C o ] 2 + = R T C c h e m F 2 V
where Cchem is the chemical capacitance derived from EIS fitting and V is the volume of the thin film electrode.
The results of these calculations are summarized in Table 2. The overall merit of combining EIS with XPS is resulting complementary data. One striking feature of the model system is that the concentration of Fe2+ determined from XPS is much higher than that estimated from EIS. These results do, however, not contradict each other, but rather show a surface enrichment of reduced cations. Enrichment of reduced cations on the surface is well known for ceria [41,42], and was also suggested for the ferrite perovskite La0.6Sr0.4FeO3-δ [16]. Additionally, correlating surface chemistry with equilibrium oxygen exchange kinetics (from Rpol at Open Cicruit Voltage–OCV) or the net reaction rate (from IDC with applied bias) helps to identify catalytically active species (or even potential catalyst poisons).

4. Conclusions

A novel sample-stage for lab-based NAP-XPS systems is presented, enabling simultaneous in-situ NAP-XPS measurements, catalytic characterization, and electrochemical characterization by EIS. The system can operate in a wide temperature range due to a combination of sample heating by infrared laser with a water-cooled analyzer nozzle. Therefore, catalytic reactions can be followed from room temperature to 1000 °C—the sample-stage is optimized for long-term measurements at temperatures up to 800 °C. Catalytic reactivity is monitored via a MS built into the second differential pumping stage of the analyzer. The electrical sample connectors of the setup enable impedance spectroscopy in 3-electrode geometry, which is used to apply bias to the sample and acquire half–cell impedance spectra and electrode overpotentials.
The capabilities of the setup were demonstrated by investigating a model three-electrode solid oxide cell with a perovskite-type oxide thin film electrode with the composition Nd0.6Ca0.4Fe0.9Co0.1O3-δ. We could prove that this measurement setup in combination with the sample-holder enables the simultaneous measurement of EIS and NAP-XPS. The presented data shows that ion mobility in the electrolyte as well as oxygen exchange activity increase with temperature and cathodic bias. The number of reduced ions (Co2+ and Fe2+) in the bulk grows when cathodic bias is applied in H2 + H2O atmosphere. Cathodic bias also leads to precipitation of metallic Fe to the surface. The presented NAP–XPS experiment shows sequential exsolution: Co is exsolved first at 600 °C in an H2 + H2O atmosphere at open circuit conditions, followed by Fe exsolution when an additional bias voltage of −250 mV was applied. These results demonstrate that with control of the chemical potential of the gas phase and with the applied bias the surface state and composition of catalysts can be precisely controlled.

Author Contributions

Conceptualization, R.R., A.N., A.K.O. and C.R.; Data curation, R.R., A.N., J.R., L.L. and T.R.; Formal analysis, R.R., L.L., H.S. and T.M.H.; Funding acquisition, A.K.O. and C.R.; Investigation, R.R. and A.N.; Methodology, R.R. and A.N.; Project administration, C.R.; Resources, C.R.; Software, J.R.; Supervision, A.K.O. and C.R.; Validation, R.R., A.N., J.R., L.L., T.R., H.S. and T.M.H.; Visualization, R.R., A.N., J.R., T.R., H.S. and T.M.H.; Writing—original draft, R.R.; Writing—review & editing, A.N., T.R., A.K.O. and C.R. All authors have read and agreed to the published version of the manuscript.

Funding

This research was funded by the European Research Council (ERC) under the European Union′s Horizon 2020 research and innovation programme, grant agreement No. 755744/ERC—Starting Grant TUCAS.

Acknowledgments

This research was funded by the European Research Council (ERC) under the European Union’s Horizon 2020 research and innovation programme, grant agreement No. 755744/ERC—Starting Grant TUCAS. We want to thank Johannes Frank for support during the construction of the sample stage.

Conflicts of Interest

The authors declare no conflict of interest.

References

  1. Hwang, J.; Rao, R.R.; Giordano, L.; Katayama, Y.; Yu, Y.; Shao-Horn, Y. Perovskites in catalysis and electrocatalysis. Science 2017, 358, 751–756. [Google Scholar] [CrossRef] [Green Version]
  2. Zhu, M.; Wachs, I.E. Iron-Based Catalysts for the High-Temperature Water–Gas Shift (HT-WGS) Reaction: A Review. ACS Catal. 2015, 6, 722–732. [Google Scholar] [CrossRef]
  3. Popovic, J.; Lindenthal, L.; Rameshan, R.; Ruh, T.; Nenning, A.; Löffler, S.; Opitz, A.K.; Rameshan, C. High Temperature Water Gas Shift Reactivity of Novel Perovskite Catalysts. Catalysts 2020, 10, 582. [Google Scholar] [CrossRef]
  4. Aramouni, N.A.K.; Touma, J.G.; Abu Tarboush, B.; Zeaiter, J.; Ahmad, M.N. Catalyst design for dry reforming of methane: Analysis review. Renew. Sustain. Energy Rev. 2018, 82, 2570–2585. [Google Scholar] [CrossRef]
  5. Kubicek, M.; Bork, A.H.; Rupp, J.L.M. Perovskite oxides—A review on a versatile material class for solar-to-fuel conversion processes. J. Mater. Chem. A 2017, 5, 11983–12000. [Google Scholar] [CrossRef]
  6. Sá, S.; Silva, H.; Brandão, L.; Sousa, J.M.; Mendes, A. Catalysts for methanol steam reforming—A review. Appl. Catal. B Environ. 2010, 99, 43–57. [Google Scholar] [CrossRef]
  7. Mahato, N.; Banerjee, A.; Gupta, A.; Omar, S.; Balani, K. Progress in material selection for solid oxide fuel cell technology: A review. Prog. Mater. Sci. 2015, 72, 141–337. [Google Scholar] [CrossRef]
  8. Yang, X.; Irvine, J.T.S. (La0.75Sr0.25)0.95Mn0.5Cr0.5O3 as the cathode of solid oxide electrolysis cells for high temperature hydrogen production from steam. J. Mater. Chem. 2008, 18, 2349–2354. [Google Scholar] [CrossRef]
  9. Arble, C.; Jia, M.; Newberg, J.T. Lab-based ambient pressure X-ray photoelectron spectroscopy from past to present. Surf. Sci. Rep. 2018, 73, 37–57. [Google Scholar] [CrossRef]
  10. Starr, D.E.; Liu, Z.; Hävecker, M.; Knop-Gericke, A.; Bluhm, H. Investigation of solid/vapor interfaces using ambient pressure X-ray photoelectron spectroscopy. Chem. Soc. Rev. 2013, 42, 5833–5857. [Google Scholar] [CrossRef] [Green Version]
  11. Yamamoto, S.; Bluhm, H.; Andersson, K.; Ketteler, G.; Ogasawara, H.; Salmeron, M.; Nilsson, A. In situx-ray photoelectron spectroscopy studies of water on metals and oxides at ambient conditions. J. Phys. Condens. Matter 2008, 20. [Google Scholar] [CrossRef] [Green Version]
  12. Feng, Z.A.; Gopal, C.B.; Ye, X.; Guan, Z.; Jeong, B.; Crumlin, E.; Chueh, W.C. Origin of Overpotential-Dependent Surface Dipole at CeO2−x/Gas Interface During Electrochemical Oxygen Insertion Reactions. Chem. Mater. 2016, 28, 6233–6242. [Google Scholar] [CrossRef]
  13. Chueh, W.C.; Hao, Y.; Jung, W.; Haile, S.M. High electrochemical activity of the oxide phase in model ceria–Pt and ceria–Ni composite anodes. Nat. Mater. 2011, 11, 155–161. [Google Scholar] [CrossRef] [PubMed] [Green Version]
  14. Feng, Z.A.; Machala, M.L.; Chueh, W.C. Surface electrochemistry of CO2 reduction and CO oxidation on Sm-doped CeO2−x: Coupling between Ce3+ and carbonate adsorbates. Phys. Chem. Chem. Phys. 2015, 17, 12273–12281. [Google Scholar] [CrossRef]
  15. Zhang, C.; Yu, Y.; Grass, M.E.; Dejoie, C.; Ding, W.; Gaskell, K.; Jabeen, N.; Hong, Y.P.; Shavorskiy, A.; Bluhm, H.; et al. Mechanistic Studies of Water Electrolysis and Hydrogen Electro-Oxidation on High Temperature Ceria-Based Solid Oxide Electrochemical Cells. J. Am. Chem. Soc. 2013, 135, 11572–11579. [Google Scholar] [CrossRef] [PubMed]
  16. Nenning, A.; Opitz, A.K.; Rameshan, C.; Rameshan, R.; Blume, R.; Hävecker, M.; Knop-Gericke, A.; Rupprechter, G.; Klötzer, B.; Fleig, J. Ambient Pressure XPS Study of Mixed Conducting Perovskite-Type SOFC Cathode and Anode Materials under Well-Defined Electrochemical Polarization. J. Phys. Chem. C 2016, 120, 1461–1471. [Google Scholar] [CrossRef] [Green Version]
  17. Opitz, A.K.; Nenning, A.; Rameshan, C.; Rameshan, R.; Blume, R.; Hävecker, M.; Knop-Gericke, A.; Rupprechter, G.; Fleig, J.; Klötzer, B. Enhancing Electrochemical Water-Splitting Kinetics by Polarization-Driven Formation of Near-Surface Iron(0): An In Situ XPS Study on Perovskite-Type Electrodes. Angew. Chem. Int. Ed. 2014, 54, 2628–2632. [Google Scholar] [CrossRef]
  18. Opitz, A.K.; Nenning, A.; Rameshan, C.; Kubicek, M.; Götsch, T.; Blume, R.; Hävecker, M.; Knop-Gericke, A.; Rupprechter, G.; Klötzer, B.; et al. Surface Chemistry of Perovskite-Type Electrodes During High Temperature CO2 Electrolysis Investigated by Operando Photoelectron Spectroscopy. ACS Appl. Mater. Interfaces 2017, 9, 35847–35860. [Google Scholar] [CrossRef]
  19. Opitz, A.K.; Rameshan, C.; Kubicek, M.; Rupp, G.M.; Nenning, A.; Götsch, T.; Blume, R.; Hävecker, M.; Knop-Gericke, A.; Rupprechter, G.; et al. The Chemical Evolution of the La0.6Sr0.4CoO3−δ Surface Under SOFC Operating Conditions and Its Implications for Electrochemical Oxygen Exchange Activity. Top. Catal. 2018, 61, 2129–2141. [Google Scholar] [CrossRef] [Green Version]
  20. Stoerzinger, K.A.; Hong, W.T.; Crumlin, E.J.; Bluhm, H.; Shao-Horn, Y. Insights into Electrochemical Reactions from Ambient Pressure Photoelectron Spectroscopy. Accounts Chem. Res. 2015, 48, 2976–2983. [Google Scholar] [CrossRef] [Green Version]
  21. Nurk, G.; Kooser, K.; Korjus, O.; Kanarbik, R.; Urpelainen, S.; Käämbre, T.; Joost, U.; Kook, M.; Kodu, M.; Möller, P.; et al. Operando NAP-HT-XPS and Impedance Spectroscopy Study of Pulsed Laser Deposited Ni-Ce0.9Gd0.1O2-δ Solid Oxide Fuel Cell Electrode. ECS Trans. 2019, 91, 555–561. [Google Scholar] [CrossRef]
  22. Kooser, K.; Käämbre, T.; Vestli, M.; Joost, U.; Urpelainen, S.; Kook, M.; Bournel, F.; Gallet, J.-J.; Lust, E.; Kukk, E.; et al. Operando high-temperature near-ambient pressure X-ray photoelectron spectroscopy and impedance spectroscopy study of Ni−Ce0.9Gd0.1O2−δ solid oxide fuel cell anode. Int. J. Hydrogen Energy 2020, 45, 25286–25298. [Google Scholar] [CrossRef]
  23. Adler, S.B. Reference Electrode Placement in Thin Solid Electrolytes. J. Electrochem. Soc. 2002, 149, E166–E172. [Google Scholar] [CrossRef]
  24. Bluhm, H. Photoelectron spectroscopy of surfaces under humid conditions. J. Electron Spectrosc. Relat. Phenom. 2010, 177, 71–84. [Google Scholar] [CrossRef]
  25. Ahamer, C.; Opitz, A.K.; Rupp, G.M.; Fleig, J. Revisiting the Temperature Dependent Ionic Conductivity of Yttria Stabilized Zirconia (YSZ). J. Electrochem. Soc. 2017, 164, F790–F803. [Google Scholar] [CrossRef]
  26. Schlesinger, R. Modeling and Evaluation of Three-Terminal Impedance Measurement Configurations for Solid Oxide Fuel Cell Electrodes; TU Wien: Vienna, Austria, 2018. [Google Scholar]
  27. Lorenz, H.; Zhao, Q.; Turner, S.; Lebedev, O.I.; Van Tendeloo, G.; Klötzer, B.; Rameshan, C.; Penner, S. Preparation and structural characterization of SnO2 and GeO2 methanol steam reforming thin film model catalysts by (HR)TEM. Mater. Chem. Phys. 2010, 122, 623–629. [Google Scholar] [CrossRef] [Green Version]
  28. Lorenz, H.; Zhao, Q.; Turner, S.; Lebedev, O.I.; Van Tendeloo, G.; Klötzer, B.; Rameshan, C.; Pfaller, K.; Konzett, J.; Penner, S. Origin of different deactivation of Pd/SnO2 and Pd/GeO2 catalysts in methanol dehydrogenation and reforming: A comparative study. Appl. Catal. A Gen. 2010, 381, 242–252. [Google Scholar] [CrossRef] [Green Version]
  29. Lindenthal, L.; Rameshan, R.; Summerer, H.; Ruh, T.; Popovic, J.; Nenning, A.; Löffler, S.; Opitz, A.K.; Blaha, P.; Rameshan, C. Modifying the Surface Structure of Perovskite-Based Catalysts by Nanoparticle Exsolution. Catalysts 2020, 10, 268. [Google Scholar] [CrossRef] [Green Version]
  30. Schmid, A.; Rupp, G.M.; Fleig, J. Voltage and partial pressure dependent defect chemistry in (La,Sr)FeO3−δ thin films investigated by chemical capacitance measurements. Phys. Chem. Chem. Phys. 2018, 20, 12016–12026. [Google Scholar] [CrossRef] [Green Version]
  31. Kuhn, M.; Hashimoto, S.; Sato, K.; Yashiro, K.; Mizusaki, J. Oxygen nonstoichiometry, thermo-chemical stability and lattice expansion of La0.6Sr0.4FeO3−δ. Solid State Ionics 2011, 195, 7–15. [Google Scholar] [CrossRef]
  32. Biesinger, M.C.; Payne, B.P.; Grosvenor, A.P.; Lau, L.W.; Gerson, A.R.; Smart, R.S. Resolving surface chemical states in XPS analysis of first row transition metals, oxides and hydroxides: Cr, Mn, Fe, Co and Ni. Appl. Surf. Sci. 2011, 257, 2717–2730. [Google Scholar] [CrossRef]
  33. Crumlin, E.J.; Mutoro, E.; Hong, W.T.; Biegalski, M.D.; Christen, H.M.; Liu, Z.; Bluhm, H.; Shao-Horn, Y. In Situ Ambient Pressure X-ray Photoelectron Spectroscopy of Cobalt Perovskite Surfaces under Cathodic Polarization at High Temperatures. J. Phys. Chem. C 2013, 117, 16087–16094. [Google Scholar] [CrossRef]
  34. Pawlak, D.A.; Ito, M.; Oku, M.; Shimamura, K.; Fukuda, T. Interpretation of XPS O (1s) in Mixed Oxides Proved on Mixed Perovskite Crystals. J. Phys. Chem. B 2002, 106, 504–507. [Google Scholar] [CrossRef]
  35. Merino, N.A.; Barbero, B.P.; Eloy, P.; Cadús, L.E. La1−xCaxCoO3 perovskite-type oxides: Identification of the surface oxygen species by XPS. Appl. Surf. Sci. 2006, 253, 1489–1493. [Google Scholar] [CrossRef]
  36. Jung, W.; Tuller, H.L. A New Model Describing Solid Oxide Fuel Cell Cathode Kinetics: Model Thin Film SrTi1-xFexO3-δ Mixed Conducting Oxides-a Case Study. Adv. Energy Mater. 2011, 1, 1184–1191. [Google Scholar] [CrossRef]
  37. Kogler, S.; Nenning, A.; Rupp, G.M.; Opitz, A.K.; Fleig, J.; Fleig, J. Comparison of Electrochemical Properties of La0.6Sr0.4FeO3-δ Thin Film Electrodes: Oxidizing vs. Reducing Conditions. J. Electrochem. Soc. 2015, 162, F317–F326. [Google Scholar] [CrossRef] [Green Version]
  38. Kubicek, M.; Huber, T.M.; Welzl, A.; Penn, A.; Rupp, G.M.; Bernardi, J.; Stöger-Pollach, M.; Hutter, H.; Fleig, J. Electrochemical properties of La0.6Sr0.4CoO3−δ thin films investigated by complementary impedance spectroscopy and isotope exchange depth profiling. Solid State Ionics 2014, 256, 38–44. [Google Scholar] [CrossRef] [Green Version]
  39. Nenning, A.; Navickas, E.; Hutter, H.; Fleig, J. Water-Induced Decoupling of Tracer and Electrochemical Oxygen Exchange Kinetics on Mixed Conducting Electrodes. J. Phys. Chem. Lett. 2016, 7, 2826–2831. [Google Scholar] [CrossRef] [Green Version]
  40. Fleig, J.; Schmid, A.; Rupp, G.M.; Slouka, C.; Navickas, E.; Andrejs, L.; Hutter, H.; Volgger, L.; Nenning, A.; Juergen, F. The Chemical Capacitance as a Fingerprint of Defect Chemistry in Mixed Conducting Oxides. Acta Chim. Slov. 2016, 63, 509–518. [Google Scholar] [CrossRef] [Green Version]
  41. Chueh, W.C.; McDaniel, A.H.; Grass, M.E.; Hao, Y.; Jabeen, N.; Liu, Z.; Haile, S.M.; Mccarty, K.F.; Bluhm, H.; El Gabaly, F. Highly Enhanced Concentration and Stability of Reactive Ce3+ on Doped CeO2 Surface Revealed In Operando. Chem. Mater. 2012, 24, 1876–1882. [Google Scholar] [CrossRef] [Green Version]
  42. Gopal, C.B.; El Gabaly, F.; McDaniel, A.H.; Chueh, W.C. Origin and Tunability of Unusually Large Surface Capacitance in Doped Cerium Oxide Studied by Ambient-Pressure X-Ray Photoelectron Spectroscopy. Adv. Mater. 2016, 28, 4692–4697. [Google Scholar] [CrossRef]
Figure 1. Schematic presentation of the sample during measurements. Top: nozzle with port of the near ambient pressure X-ray photoelectron spectroscopy (NAP-XPS) analyzer. Middle: sample with connections for electrochemical impedance spectroscopy (EIS) measurement. Bottom: laser heating.
Crystals 10 00947 g001
Figure 2. Sample–stage (mounted on a CF 63 Flange) with sample-holder (quartz trapeze) and sample.
Crystals 10 00947 g002
Figure 3. Near–IR 980 nm 100 W continuous wave laser mounted at the sample-stage feedthrough. On the left side, the tilted window can be seen. In the middle, the laser mount is visible. The silver tube on the right side is the collimator for the laser. All parts are encased in an aluminum box for laser safety reasons.
Crystals 10 00947 g003
Figure 4. On the left side (a), the sample-stage with sample-holder (1) mounted onto the copper cooling block (2) is shown. Stainless steel shields (3) were used to fix the sample-holder against the water-cooled copper block. In the bottom of the picture, the black nozzle (4) of the analyzer in front of the sample is visible. The right picture (b) depicts the investigated sample with perovskite (Nd0.6Ca0.4Fe0.9Ca0.1O3-δ) thin film electrode mounted on the sample-holder (5). Connections towards the working electrode (6), reference electrode (7), and counter electrode (8) are visible. The thermocouple enters the back-plate at (9).
Crystals 10 00947 g004
Figure 5. (a) MS data recorded under oxidizing conditions after introducing the sample into the NAP-XPS System. The perovskite was heated to 400 °C and exposed to 1 mbar O2, flow 3 mL min−1. The CO2 signal decreases due to the removal of carbon traces from the surface. (b) C1s XPS of carbon before and after the end of this oxygen treatment is shown. The amount of carbon was reduced below the XPS detection limit.
Crystals 10 00947 g005
Figure 6. MS taken during exposure to H2 + H2O with a ratio 32:1 at 600 °C. (a) No bias voltage and (b) −250 mV bias voltage were applied. An increase in H2 (shown between the dashed lines) occurs due to a slight adjustment of H2 flow rate.
Crystals 10 00947 g006
Figure 7. Fe2p 3/2 signals for each experiment step. The contributions are assigned to Fe0 (red) and a combination of two components for the asymmetric oxide peak (blue and green). The sample was first heated in O2 to 400 °C. Then, the gas phase was switched to H2 + H2O at 500 °C. In a next step the temperature was increased to 600 °C. Finally, a bias voltage of −250 mV was applied. A stepwise increase of the contribution of metallic Fe is clearly visible with increasing strength of reduction.
Crystals 10 00947 g007
Figure 8. Co2p signal. Although the signal overlaps with the AUGER signal of Fe (LMM), metallic Co (778 eV, red) and Co oxide species (780 eV, blue) can still be resolved. After switching the gas phase from oxidizing to reducing conditions, a clear metallic Co shoulder becomes visible. The metallic Co contribution grows further with increasing temperature and applied bias.
Crystals 10 00947 g008
Figure 9. NAP–XPS spectra of the O1s region. From top to bottom: The sample was first exposed to O2 and heated to 400 °C. Then, the gas phase was switched to H2 + H2O with a ratio of 32:1 while the temperature was increased to 500 °C and subsequently to 600 °C. Finally, a bias voltage of −250 mV between working and counter electrodes was applied. The sulphates decomposed when increasing the temperature to 600 °C. With increasing reduction of the sample, the hydroxide species increased.
Crystals 10 00947 g009
Figure 10. Impedance spectra of the WE half–cell (i.e., WE vs. RE), measured in H2 + H2O atmosphere at different temperatures and with applied bias.
Crystals 10 00947 g010
Table 1. Cross section corrected ratio of metallic Co0 and metallic Fe0.
Ratio Co0/Fe0
0.7 mbar H2 + H2O, 500 °C0.6
0.7 mbar H2 + H2O, 600 °C2.5
0.7 mbar H2 + H2O, 600 °C, −250 mV bias0.5
Table 2. Comparison of polarization resistances, equilibrium rates, and Fe and Co species contents determined by EIS and NAP-XPS under different experimental conditions.
ConditionsRpol (Ω) R e q (mol cm−2 s−1)Fe2+ + Co2+ (EIS)Fe0 (XPS)Co0 (XPS)
O2---0%0%
H2 + H2O 500 °C147,000 5.5 · 10 8 0.4%<3%7%
H2 + H2O 600 °C36,000 2 · 10 7 0.36%<4%42%
H2 + H2O 600 °C, −250 mV bias3600 7 · 10 6 (net reaction)2.2%17%49%
Publisher’s Note: MDPI stays neutral with regard to jurisdictional claims in published maps and institutional affiliations.

