Article

Crystallographic Orientation Dependence of Mechanical Responses of FeCrAl Micropillars

Department of Mechanical and Materials Engineering, University of Nebraska-Lincoln, Lincoln, NE 68588, USA
*
Author to whom correspondence should be addressed.
Crystals 2020, 10(10), 943; https://doi.org/10.3390/cryst10100943
Submission received: 4 October 2020 / Revised: 14 October 2020 / Accepted: 14 October 2020 / Published: 16 October 2020
(This article belongs to the Special Issue Crystal Plasticity at Micro- and Nano-scale Dimensions)

Abstract

:
Iron-chromium-aluminum (FeCrAl) alloys are used in automobile exhaust gas purifying systems and nuclear reactors due to its superior high-temperature oxidation and excellent corrosion resistance. Single-phase FeCrAl alloys with a body centered cubic structure plastically deform through dislocation slips at room temperature. Here, we investigated the orientation dependence of mechanical responses of FeCrAl alloy through testing single-crystal and bi-crystal micropillars in a scanning electron microscopy at room temperature. Single-crystal micropillars were fabricated with specific orientations which favor the activity of single slip system or two slip systems or multiple slip systems. The strain hardening rate and flow strength increase with increasing the number of activated slip system in micropillars. Bi-crystal micropillars with respect to the continuity of slip systems across grain boundary were fabricated to study the effect of grain boundary on slip transmission. The high geometrical compatibility factor corresponds to a high flow strength and strain hardening rate. Experimental results provide insight into understanding mechanical response of FeCrAl alloy and developing the mechanisms-based constitutive laws for FeCrAl polycrystalline aggregates.

Graphical Abstract

1. Introduction

Iron-chromium-aluminum (FeCrAl) alloys was initially developed by General Electric (GE) Corporation in the 1960s. This material exhibits superior high-temperature oxidation and excellent corrosion resistance, and thus were used in automobile exhaust gas purifying systems and nuclear reactors [1,2]. Single-phase FeCrAl alloys with a body centered cubic (BCC) structure plastically deform through dislocation slips. Predominate slip systems include {110}<111> and {112}<111> at room temperature [3,4]. The development of the constitutive laws for FeCrAl polycrystalline aggregates is in urgent demand for designing and predicting mechanical response of FeCrAl-made structural components. Numerous efforts were made to develop constitutive models based on the knowledge of crystal defects, such as dislocations, twins and grain boundaries [5,6,7,8,9,10,11,12]. Yielding strength of a material is determined by the glide of dislocations, in turn, the glide resistance of dislocations associated with different slip systems is the essential parameter. Strain hardening effect is mainly ascribed to dislocation interactions and/or dislocation-grain boundary interactions.
The glide resistance of dislocations, i.e., critical resolved shear stress (CRSS), can be estimated using different methods. First, CRSS can be estimated by analysis of orientation and slip trace on polycrystal sample after macro mechanical tests. In this method, the orientations of grains are analyzed by using transmission electron microscopy (TEM) [13] or electron backscatter diffraction (EBSD) [14]. The slip system of traces and Schmid factors are calculated with help of orientation information. Then the ratio of CRSS can be calculated by counting the frequency of slip traces. Coupled with in situ observation of deformation process, this method can also provide absolute estimation of CRSS [15]. However, the stress state in each grain may be different from macroscopic stress, which will lead to inaccurate measurement of CRSS. Second, CRSS can be calculated by mechanical tests and data fitting of crystal plasticity modeling. To use this method, the mechanical behavior of material is measured by using mechanical tests on polycrystalline specimens with known texture [16,17] or indentation tests on grains with measured orientation (also known as inverse indentation analysis) [18,19]. Then CRSS and other parameters in the model are fitted to the results of experiments. However, previous study shows that this method yields different CRSS for same material due to the difference in constitutive law [16,17]. The third method is based on in situ far-field high-energy X-ray diffraction microscopy (FF-HEDM) [20,21]. During mechanical tests, FF-HEDM can identify the activated slip system in each grain, measure the corresponding shear stress. This method requires expensive high energy synchrotron X-rays and is not suitable for the measurement of small irradiated region. Another method is directly applying load on single crystal with orientation favorable for a specific slip system. The orientation of grains is characterized by using EBSD. The Schmid factors in each grain can be calculated. In situ micromechanical tests can be performed on the pillars. The activated slip system can be identified by slip traces and the CRSS of slip systems can be directly obtained [22,23,24].
Dislocations interactions have been studied by different methods, such as dislocation dynamics simulations, molecular dynamics simulations, and experimental testing. For example, to estimate the interaction coefficients of slip systems in BCC iron, which are defined by Franciosi [25] and Devincre [26], the researchers built up the interaction matrix of slip systems by analyzing the crystal structure, and preformed dislocation dynamics simulations [27,28]. Meanwhile, molecular dynamics simulations also were used to study the interactions of dislocations [29,30]. The detailed process of dislocations interaction is closely analyzed in atomic scale. In addition to numerical simulations, dislocations interactions were also investigated by using micro and macro mechanical tests. Based on traditional macro mechanical tests, a lot of effort was made to measure the hardening effect of materials [31,32,33,34]. Most easy way is to measure the response of polycrystal materials and fit it with empirical equations, e.g., Ludwik equation [35], Hollomon equation [36], Swift equation [37], and Voce equation [38]. To get more detailed understand on the effect of slip on a specific system on other system, latent hardening tests was employed [25,39,40]. Single crystal sample was loaded in a specific direction to activate a specific primary slip system, and then loaded in another direction to activate another secondary slip system. The CRSS change of secondary slip system can be measured. In recent years, the development of micromechanical test enables us to study mechanical properties of small samples; for example, flow behavior and strain hardening rate by micro-pillar compression testing [41,42].
Micropillar compression/tension testing has been widely used to study mechanical properties of materials with sub-micron and micro-sized microstructural features [43,44,45], particularly for nuclear materials because limited ion penetration depths, a few microns for typical self-ions (2–10 MeV) and tens of microns for typical light ions (1–3 MeV), make micro-scale mechanical tests a necessity. In situ micromechanical testing is essential for correctly extracting experimental data, because shear instability often happens associated with local stress/strain concentration. In this study, we investigate the orientation dependence of mechanical responses of FeCrAl alloy using micromechanical testing of single-crystal and bi-crystal micropillars in a scanning electron microscopy at room temperature. Single-crystal micropillars were fabricated with designed orientation which favors the activity of single slip system or two slip systems or multiple slip systems in order to study the orientation dependence of mechanical responses of FeCrAl alloy. We evaluated the strain hardening rate by extracting the stress-strain data, i.e., Θ = d σ / d ϵ . By tailoring the orientation of single-crystal micro-pillars, we characterized the strain hardening behavior of micropillars associated with the activity of (a) one slip system, (b) two slip systems, and (c) multiple slip systems. Bi-crystal micropillars with respect to the continuity of slip systems across two high-angle GBs were fabricated to study the effect of grain boundary on slip transmission. These results provide insight into understanding mechanical response of FeCrAl alloy.

2. Experimental Methods

2.1. Materials

The FeCrAl alloy tested in the study has a nominal composition of Fe-13Cr-5Al-2Mo-0.2Si-0.05Y (wt.%). The ingot of alloy was prepared by arc-melting under an argon atmosphere using elemental ingredients with a purity above 99.9 at. %. The ingot was homogenized, hot-rolled at 1100 °C, warm-rolled at 800 °C in three steps from its initial thickness ~5 mm to a final thickness ~2 mm and annealed at 800 °C for 1 h. The grain size of the materials is around 50 μm. The sample was mechanically polished with silicon carbide grinding papers from grit 800# to 4000# and electropolished in a solution of 10 mL perchloric acid and 90 mL methanol at −5 °C for 15 s at 15 V. The following SEM observation and FIB fabrication were conducted on a FEI Helios NanoLab 660 dual beam system. The orientation of polished sample was characterized by using electron backscatter diffraction (EBSD). The orientation information was collected with an EBSD detector from EDAX in this dual-beam system. The OIM software was used to control the data collection process, during which a step size of 0.5 μm was adopted.
Based on the orientation mapping from EBSD, we choose the grain with specific orientation where SF of slip systems with designed interaction are maximized. On these grains, we prepared micropillars by using FIB. The acceleration voltage of Ga+ beam was 30 kV. The currents for initial cut and final cut are 64 nA and 0.24 nA respectively. The height-to-diameter ratio of each pillar was 1.5–2.5. The taper angle is within 2 to 5 degrees. The in situ mechanical tests were performed by using a Hysitron PI85 PicoIndentor equipped with a 20-μm flat punch tip. The tests were displacement-controlled while the loading rate was set to reach a strain rate of 10−3 s−1. During in situ testing, the indenter was controlled to minimize the misalignment between the tip and the top surface of the pillars, and a minimum of three tests were performed for each type of pillar to ensure the reproducibility of interested phenomena. The in situ compression testing stops when obvious slip bands can be observed on the surface of the samples.
Slip trace analysis based on self-developed Matlab program is used to identify the activated slip system in all deformed micropillars. The true stress is estimated using a full width half maximum (FWHM) approach [22,46], where the diameter in the middle of the pillar is estimated from known (1) top surface diameter, (2) taper angle, and (3) total length of the pillar. The true strain is obtained by correcting the engineering strain with the Young’s modulus correction formula for a pillar [47,48].

2.2. Orientation Selection of Micro-Pillars

Three families of slip systems, {110}<111>, {112}<111>, and {123}<111>, are usually observed in BCC materials, as depicted in Figure 1a. For most BCC metals (e.g., Fe, V, and W), {110}<111> and {112}<111> slip systems are generally activated but {123}<111> slip system is rarely activated at room temperature. {123}<111> slip system is observed in Na and K at room temperature [49] and in Fe at high temperature [50]. For BCC FeCrAl alloy, the predominant slip systems at room temperature are {110}<111>and {112}<111> slip systems [51,52].
There will be 300 combinations amongst {110}<111> and {112}<111> slip systems, but only 17 configurations of interactions are unique as considering the symmetry of crystal [27]. As depicted in Figure 1b, these dislocations interactions are correspondingly classified into four types, self-, dipolar-, junction-, and collinear-interactions. Most interactions are belonging to junction interaction where both slip plane and slip direction of two slip systems are different. Dipolar interaction is the interaction between dislocations on the same slip plane with different slip vectors, and thus only happen in {110}<111> slip systems because two slip directions are available on a slip plane {110}. Collinear interaction is the interaction between dislocations on two slip planes with same slip direction. Self-interaction refers to the interaction between dislocations on same slip system.
For single-crystal micropillars, strain gradients are generally lacking because of free surface [44,53]. When a single slip system is predominately activated in a micropillar, self-interaction is to a great extend reduced, and an obvious yielding and continuous shearing with weak hardening is generally observed. Thus, maximizing the Schmid factor (SF) of one specific slip system can be used to measure the glide resistance of dislocations associated with the slip system. Meanwhile, an apparent strain hardening behavior was expected to occur when the least two slip systems could be activated in the micropillar. Correspondingly, we choose the orientation of micropillars with the following criteria: (a) maximizing the SF of one slip systems in order to assess glide resistance of dislocations in a specific slip system, and (b) maximizing the SFs of two slip systems in order to study the effect of junction interaction on strain hardening. As a comparison, micropillars with multiple activated slip systems were fabricated and tested.
For bi-crystal micropillars, GBs generally act as pinning barriers for impeding dislocation propagation. Dislocation-GB interactions are heavily dependent on the transferability or continuity of slip systems in the two grains across a GB. Geometrical compatibility factor (m’) is successfully used to estimate the deformation compatibility across GBs [54,55,56,57,58], where m’=cos(φ)×cos(k), φ is the angle between the slip plane normal directions and k is the angle between the slip directions. We chose bi-crystals with m’ varying from 0.44 to 0.84.

3. Results and Discussion

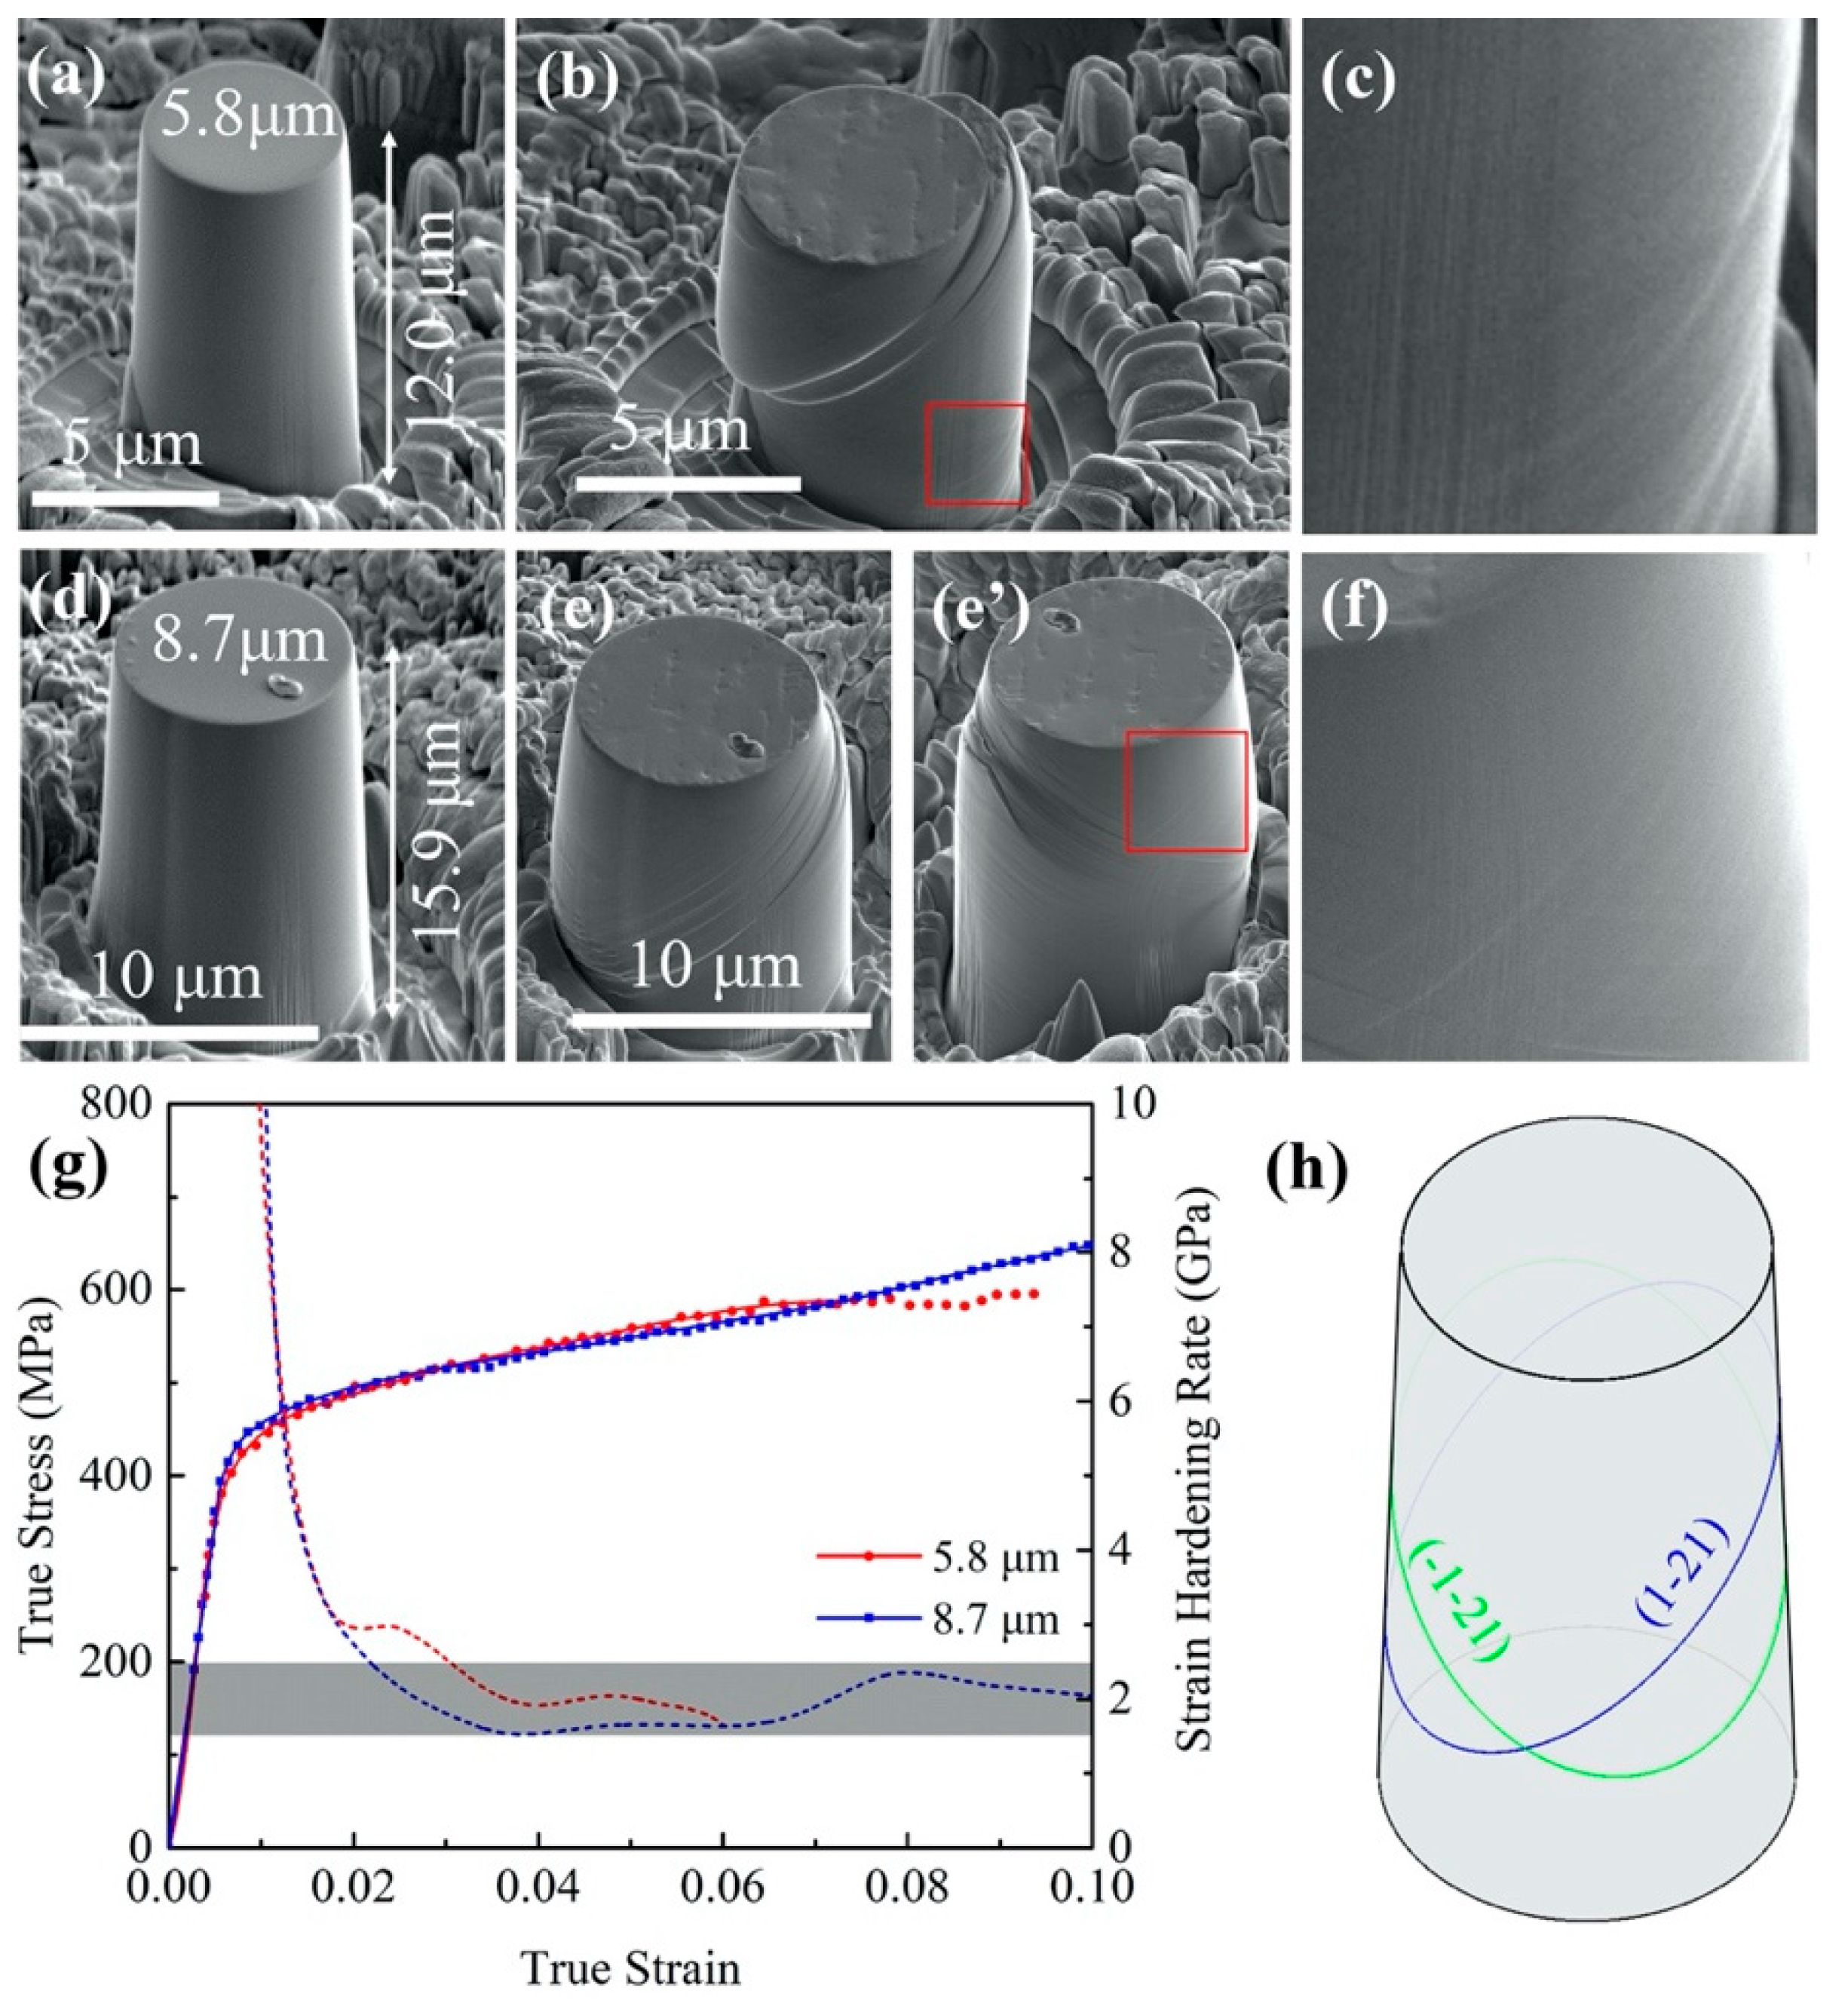
3.1. Weak Hardening Associated with One Activated Slip System

The self-interaction of dislocations refers to the interaction between dislocations belonging to the same slip system. To study the mechanical response of micropillars with one dominant slip system, we selected grains with specific orientation in a polycrystalline sample according to the SF analysis on each slip system with Euler angle measured from EBSD mapping. As shown in Figure 2a, we chosen a grain with the orientation where [ 5 ¯   1 ¯ 5] direction is parallel to the loading direction. Under uniaxial loading, the SF of (12-1)[-111] slip system reaches the maximum value of 0.5, the SF of (0-11)[-111] slip system is the second highest and equals 0.438, and SFs of other slip systems are lower than 0.428. Therefore, the (1-1)[-111] slip system would be primarily activated. Similarly, the grain with the orientation where [ 20 ¯   9 ¯ 2] is parallel to the loading direction and shown in Figure 2b favors (10-1)[111] slip system, because this slip system has the maximum SF of 0.5, the second highest SF is 0.4683 associated with the slip system (101)[11-1], and SFs of other slip systems are lower than 0.435. The orientation of the two grains is demonstrated by the inverse pole figure in Figure 2c. Figure 2d,e show the pillars with initial diameters of 8.9 μm and 8.5 μm. Figure 2f,g show the compressed pillars where the apparent slip traces well match the slip traces on (12-1) plane and (10-1) plane, respectively.
We thus concluded that (12-1)[-111] slip system and (10-1)[111] slip system were obviously activated in each pillar, respectively. Figure 2h shows the typical stress-strain curves. It is noted there is no apparent strain hardening behavior once continuous plastic flow occurs. Several slight stress drops correspond to shear instability due to free surface. The weak hardening effect is ascribed to the lack of dislocation pileup because the size of the pillar is too small to form dislocation pileup. Videos 1 and 2 record the in situ compression testing of the two pillars. Corresponding to the 0.2% offset yield strengths of 460 MPa and 450 MPa, the glide resistance of dislocations are estimated to be 230 MPa and 220 MPa for the two slip systems {12-1}<-111> and {10-1}<111>, respectively. The similar resistance for the two slip systems is consistent with our previous study [52]. The strain hardening rate is around 1.0 GPa for the two slip systems {12-1}<-111> and {10-1}<111> as the strain exceeds 0.015.

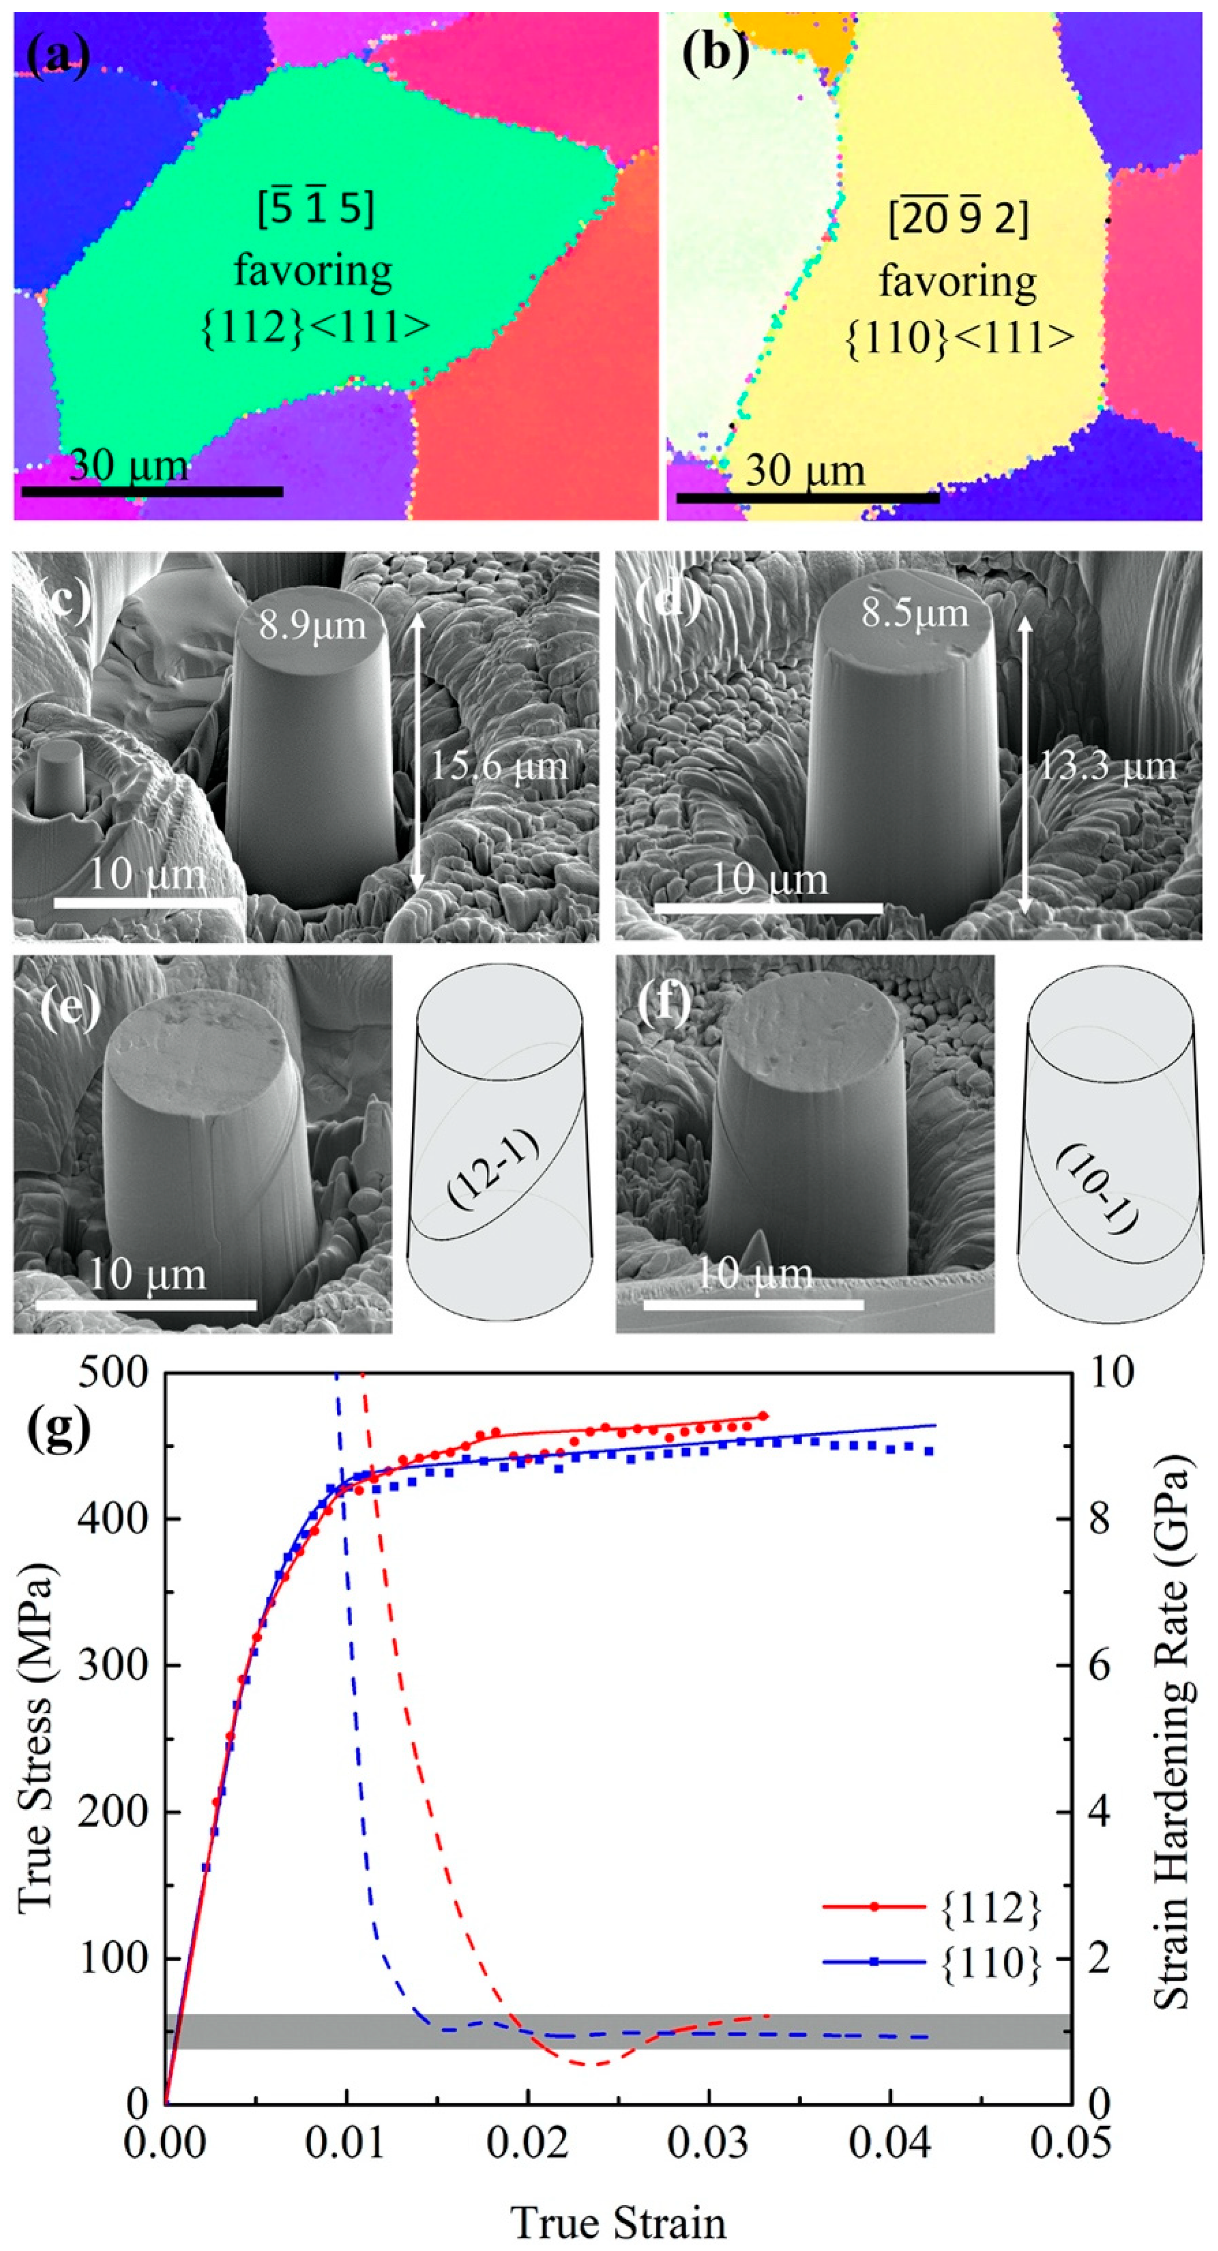
3.2. Intermediate Hardening Associated with Two Activated Slip Systems

Micropillars with two orientations were prepared to study the interactions between two {1-21}<111> slip systems and between two {110}<111> slip systems, respectively. When the grain is orientated along the crystallographic direction [1 48 8], the (1-21)[111] and (-1-21)[-111] slip systems have the largest SFs of 0.494 and 0.487, and other slip systems have the SF smaller than 0.462. Figure 3a,d show two micro-pillars with diameters of 5.8 μm and 8.7 μm. Figure 3g shows the stress-strain curves, revealing apparent strain hardening with a hardening rate of ~1.9 GPa for the strain exceeding 0.02. Figure 3h schematically show two slip traces associated with the slip planes (1-21) and (-1-21). Apparent slip traces are identified to be associated with dislocation motion on the slip plane (1-21), as observed in the compressed pillars in Figure 3b,e. The slip trace associated with the slip plane (-1-21) was not obvious. Thus, we magnified the red square regions in Figure 3b,e’ which is the backside of the pillar. The high magnification images in Figure 3c,f reveal the slip traces associated with dislocation motion on the slip plane (-1-21). Thus, the slightly increased strain hardening rate is ascribed to the junction formation interaction between (1-21)[111] and (-1-21)[-111] slip systems. Video 3 records the in situ compression testing of the pillar with a diameter of 8.7 μm. Corresponding to the 0.2% offset yield strength of 430 MPa in Figure 3g, the critical resistance for dislocation glide on {121} slip planes is calculated to be 212 MPa, which is consistent with the result obtained from Section 3.1.
When the grain is orientated along the crystallographic direction [-6 9 -5], the (01-1)<1-1-1> and (-110)<-1-11> slip systems have the largest SFs of 0.399 and 0.344, and other slip systems have the SF smaller than 0.31. Figure 4a and d show two micro-pillars with diameters of 5.9 μm and 8.9 μm. Figure 4h schematically show two sets of slip traces associated with the slip planes (0 1 -1) and (-1 1 0). Apparent slip traces are associated with dislocation motion on the two slip planes (0 1 -1) and (-1 1 0), as observed in the compressed pillars in Figure 4b,e and the magnified images in Figure 4c,f. Especially in Figure 4c, the two slip systems seem equally activated. The stress-strain curves in Figure 4g show apparent strain hardening with a hardening rate around 4.0 GPa for the strain exceeding 0.02. Thus, the strain hardening rate is ascribed to the junction formation interaction between (01-1)[1-1-1] and (-110)[-1-11] slip systems, and is greater than the case associated with the interaction between two {110}<111> slip systems where one slip system is more activated. Video 4 records the in situ compression testing of the pillar with a diameter of 5.9 μm. Corresponding to the 0.2% offset yield strength of 580 MPa in Figure 4c, the critical resistance for dislocation glide is 231 MPa for (01-1)[111] slip family, which is consistent with the results in Section 3.1.

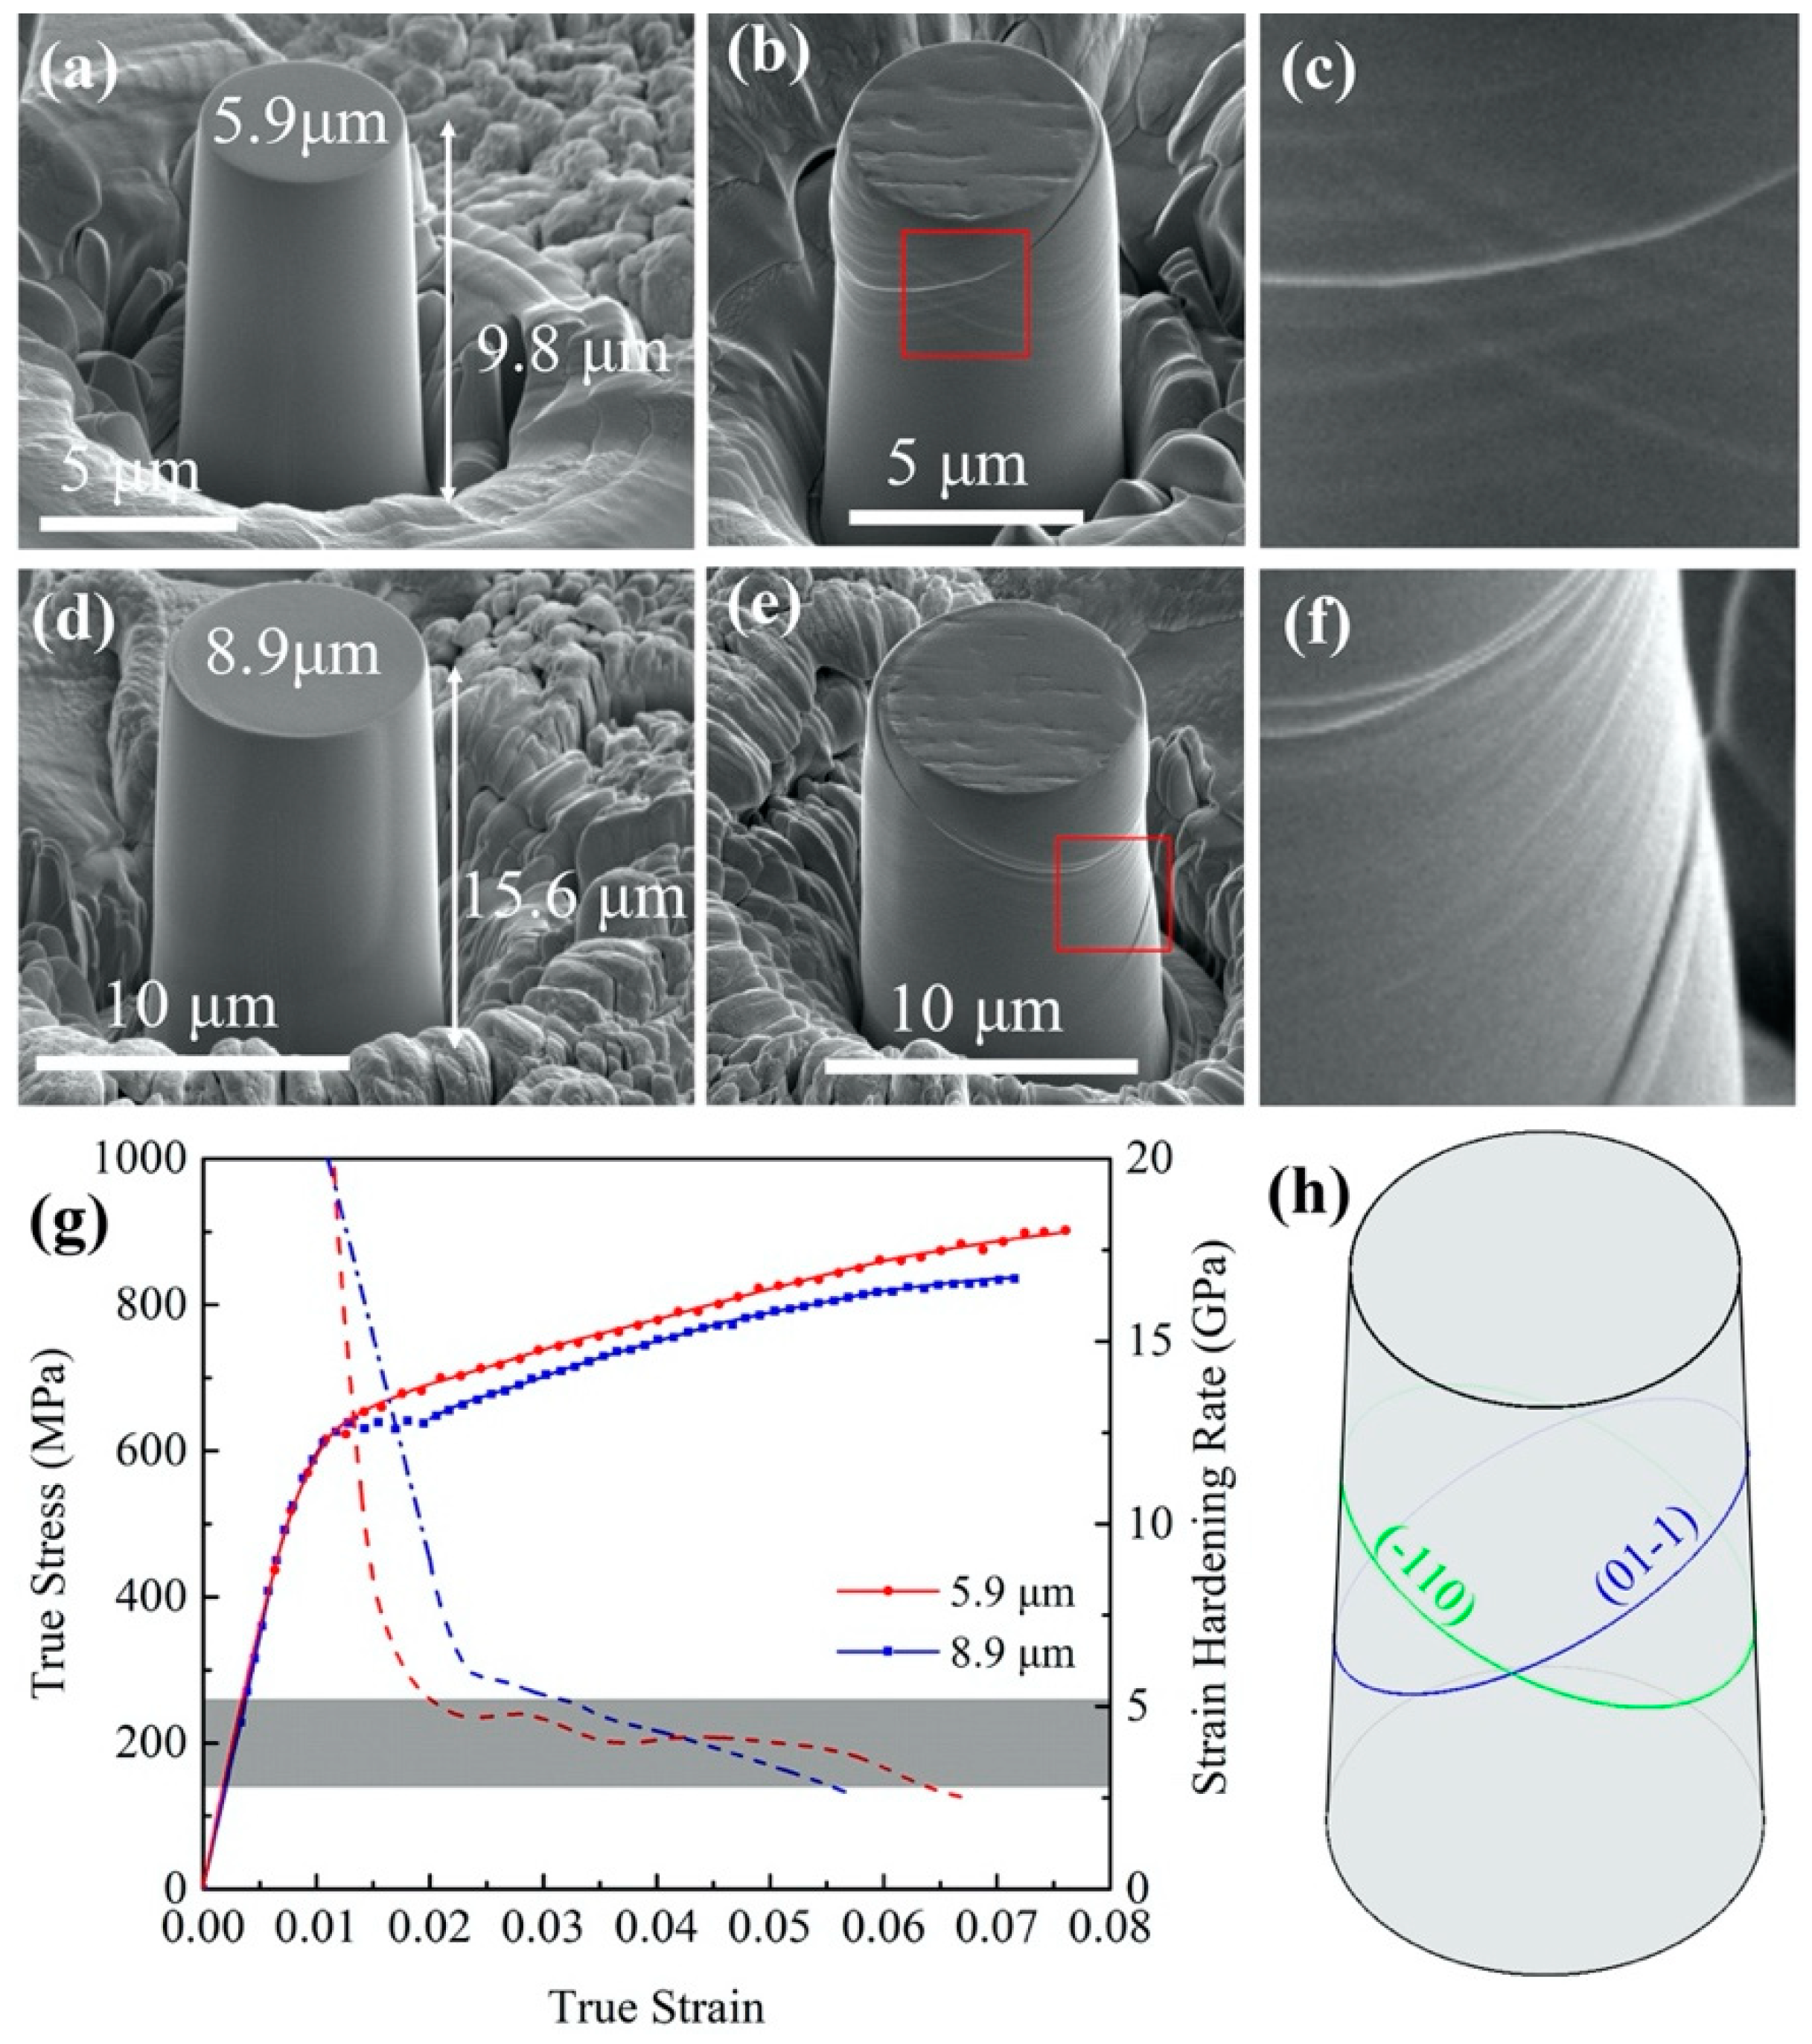
3.3. Strong Hardening Behaviors Associated with Multiple Activated Slip Systems

To reveal hardening behaviors of micropillars associated with multiple activated slip systems, we fabricated two types of micropillars with the crystallographic orientations [100] and [111]. When the micropillars are oriented along the [100], four slip systems have comparable SFs around 0.47, including (-1-1-2)[11-1], (-1-12)[111], (-11-2)[1-1-1], and (-112)[1-11], as shown in Figure 5f. Figure 5a,c show the two pillars with a diameter of 5.8 μm and 8.5 μm, respectively. Figure 5b,d show the pillars at a compression strain of 0.1. Figure 5e shows the stress strain curves. Although the 0.2% offset yield strength is approximately same about 430 MPa for the two micropillars, the strain hardening behaviors are different. The micropillar with the bigger diameter of 8.5 μm shows a high strain hardening rate varying from 20 GPa to 2.0 GPa as the strain increases from 0.01 to 0.02. A relatively stable strain hardening rate is 2.0 GPa as the strain exceeds 0.025. A homogenous deformation was observed before the strain reaches 0.02, indicating multiple slip systems were activated. Video 5 records the in situ compression testing of the pillar with a diameter of 8.5 μm. The pillar with a diameter of 5.8 μm shows a low strain hardening rate varying from 5.0 GPa to 2.0 GPa for the strain from 0.01 to 0.02. Video 6 records the in situ compression testing of the pillar with a diameter of 5.8 μm, showing homogenous deformation which implies the activation of multiple slip systems. The lower strain hardening rate is thus ascribed to the smaller diameter.
A much stronger hardening behavior was observed in Figure 6a when the micropillar is oriented along the [111]. The strain hardening rate decreases from 35 GPa to 5 GPa as the strain increase from 0.01 to 0.05. Four slip systems, (1-1-2)[1-11], (1-2-1)[11-1], (10-1)[1-11] and (1-10)[11-1] as shown in Figure 6b, have comparable SFs in the range from 0.32 to 0.35, while other slip systems have SFs less than 0.29. Corresponding to the 0.2% offset yield strength of 600 MPa, these slip systems have the glide resistance of about 213 MPa which is consistent with the results from other tests. Figure 6c shows a dog-bone shaped micro-pillar with the cross-section of 3.3 μm × 3.0 μm. Figure 6d,e shows two snapshots at a strain of 0.075 and 0.085, respectively, indicating homogeneous deformation before cracking takes place. Video 7 records the in situ tension testing of the pillar, showing homogenous deformation during tension testing and implying the activation of multiple slip systems before the pillar failures at a strain of 0.08.

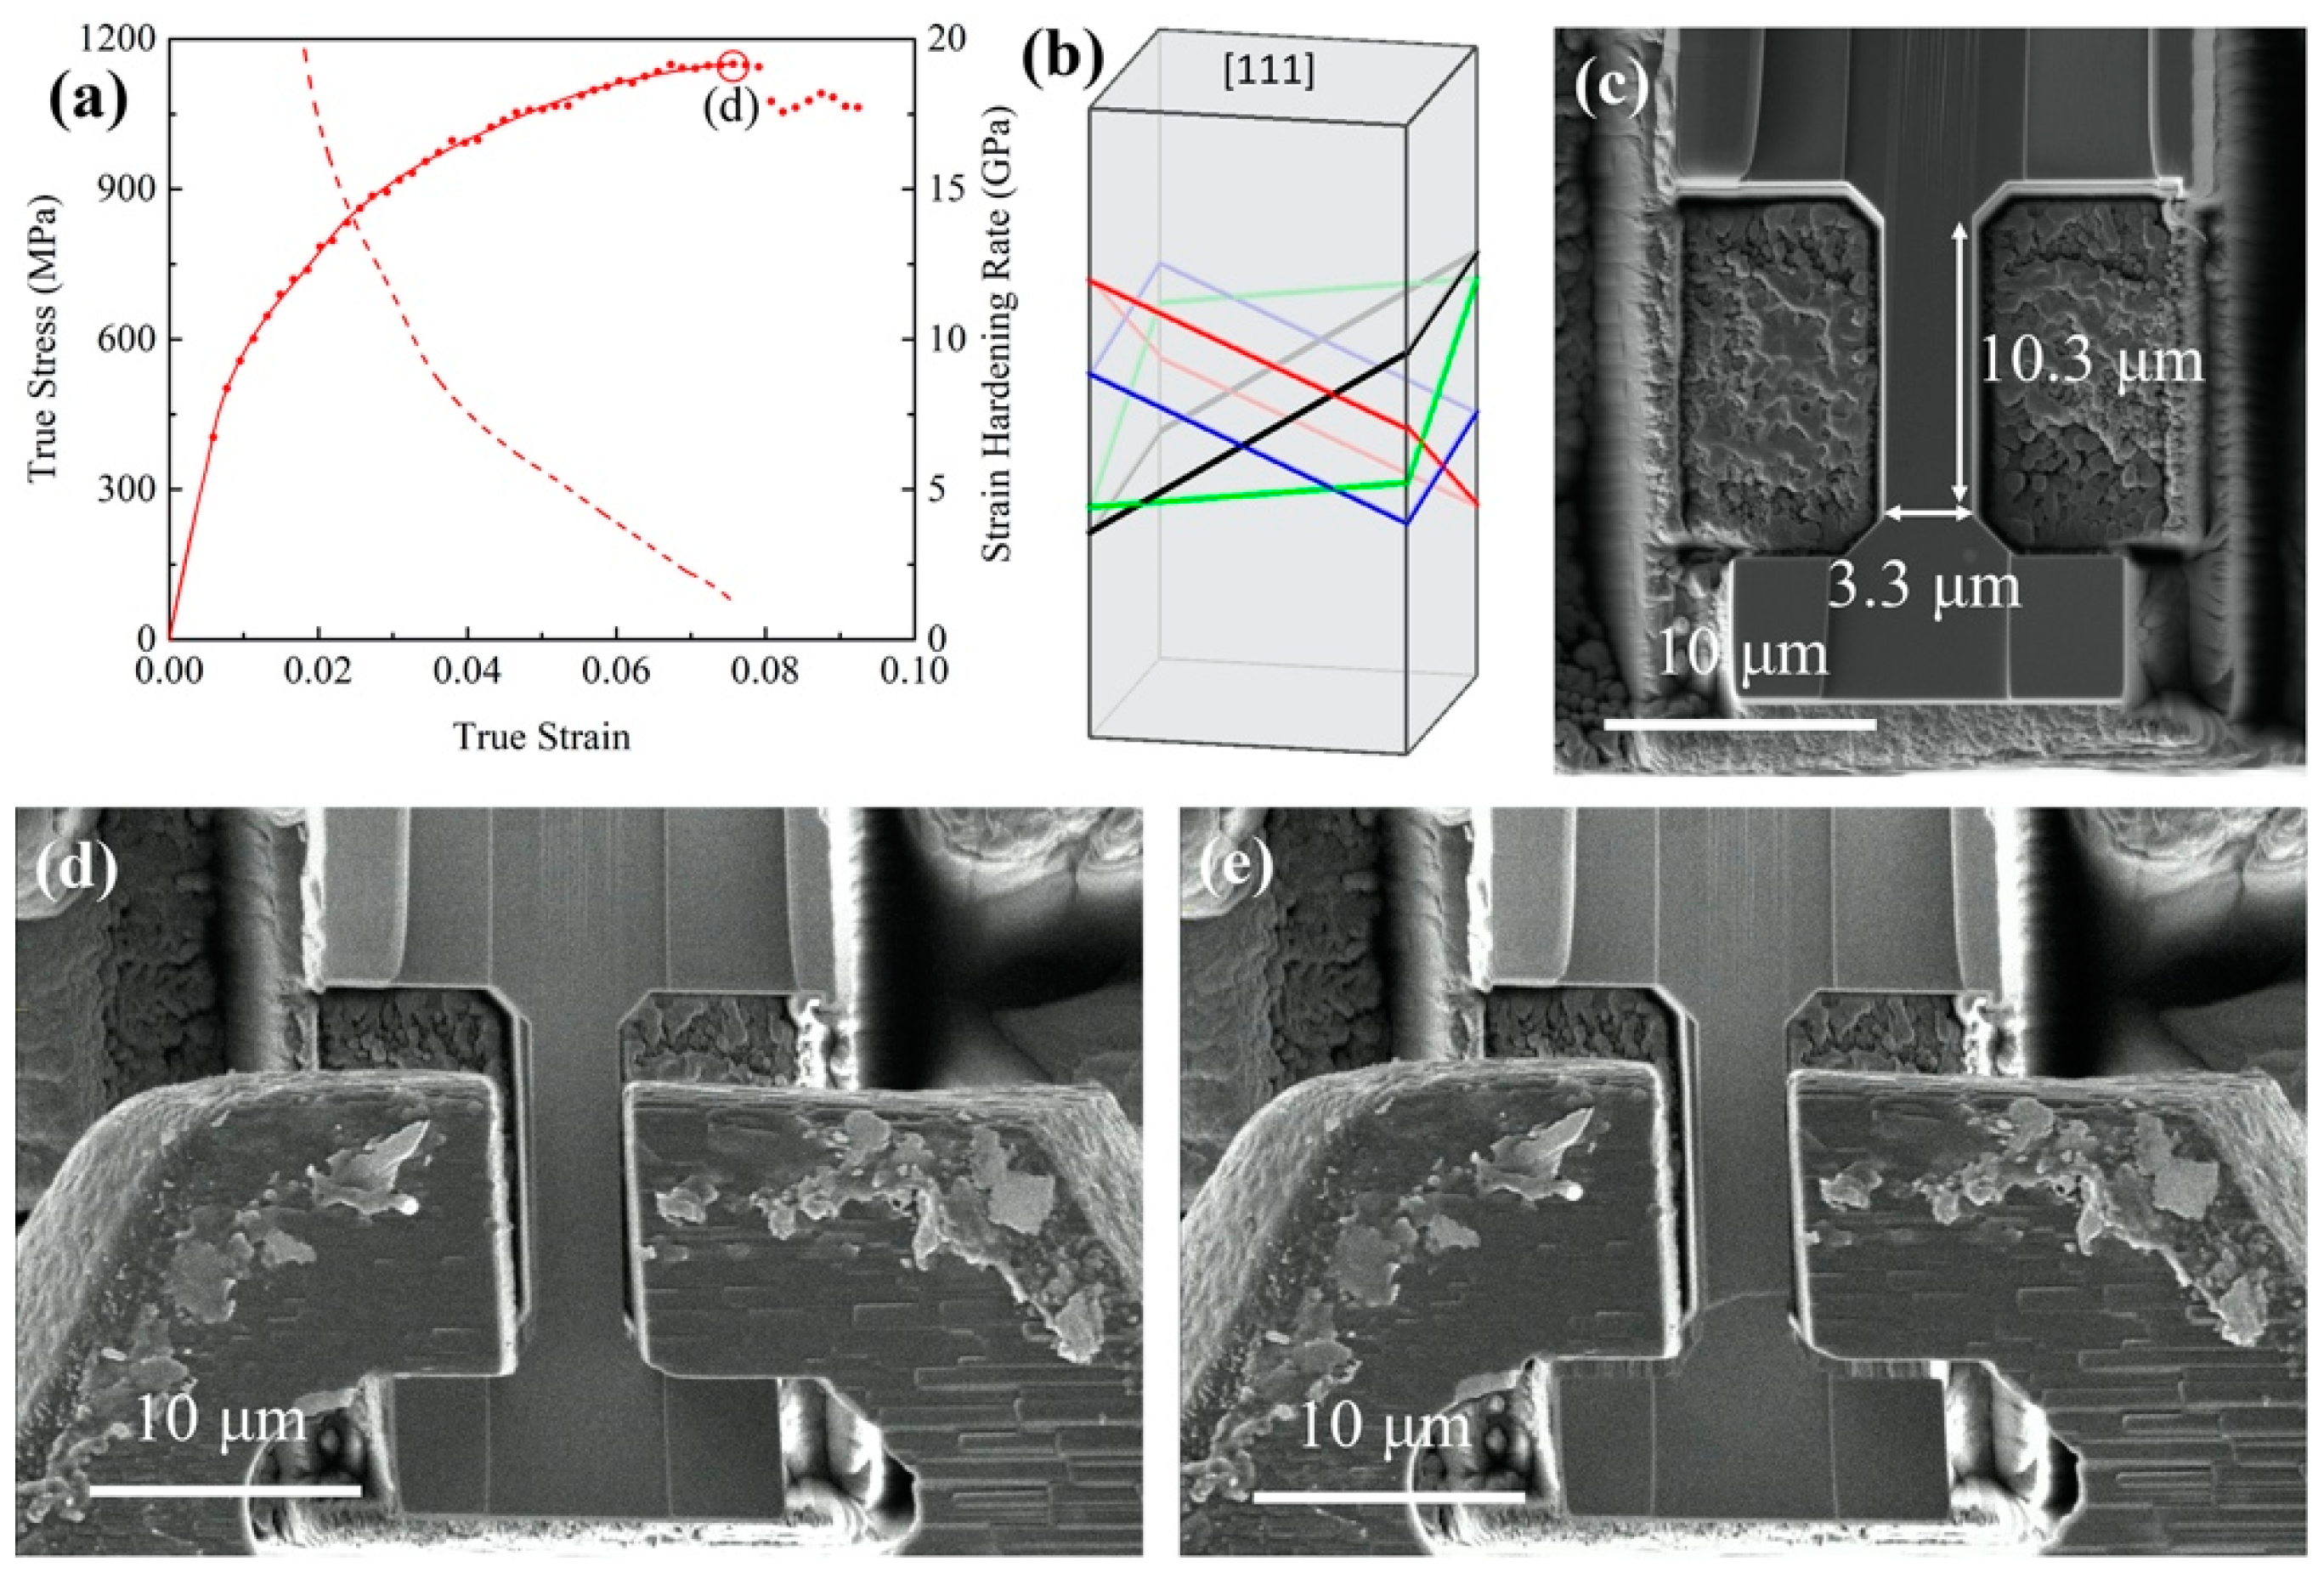
3.4. Grain Boundary Effects on Mechanical Behavior

Grain boundary (GB) strengthening mechanism is based on the observation that GBs impede dislocation movement. Since the adjacent grains differ in orientation, it requires more energy for a dislocation to change slip direction and slip plane and transfer into the adjacent grain [59,60]. The transferability or continuity of slip systems in the two grains across a GB is described by a geometrical compatibility factor (GCF), m’=cos(φ)×cos(k) [54,55,56,57,58]. The bigger the GCF is, the easier slip transmission happens. φ is the angle between the slip plane normal directions and k is the angle between the slip directions. We examined this in two bi-crystal micropillars.
The bi-crystal 1 has the orientation relation: [403]A//[1]B, (010)A//(010)B between Grains A and B. The compression direction is parallel to [403]A and [1]B. The maximum SF in Grain A is 0.478 for (121)A and the second highest SF is 0.455 for (1 2 ¯ 1)A. The maximum SF in Grain B is 0.483 for ( 1 ¯ 12)B and the second highest SF is 0.479 for (112)B. Video 8 records the in situ compression testing of the pillar, showing slip transmission across the GB. The morphology of the micropillar after compression is shown in Figure 7a. The slip traces on the surface of the deformed pillar enable us to identify the activated slip planes, (1 2 ¯ 1)A with a SF of 0.455 in grain A and (0 1 ¯ 1)B with a SF of 0.355 in grain B, as depicted in Figure 7b. We computed geometrical compatibility factors associated with any pair of slip systems (1 2 ¯ 1)A/{011}B and (1 2 ¯ 1)A/{112} across the GB, the factor associated with the pair of slip systems (1 2 ¯ 1)A/(0 1 ¯ 1)B is the largest, m’ = 0.84, which accounts for the observed slip transmission across the GB in Figure 7a and no apparent strain hardening during the compression as shown in Figure 7e.
The bi-crystal 2 has the orientation relation: [11 5 9]C // [1 3 ¯ 5]D and ( 9 ¯ 4 2)//(2 1 10 ¯ ) between Grains C and D. The compression direction is parallel to [11 5 9]C and [1 3 ¯ 5]D. The highest SF in Grain C is 0.466 for (121)C and the second highest SF is 0.428 for (110)C. The highest SF in Grain D is 0.483 for (2 1 ¯ 1)D and the second highest SF is 0.482 for (101)D. Video 9 records the in situ compression testing of the pillar, showing slip transmission across the GB. The morphology of the micropillar after compression in Figure 7c shows two sets of slip transmission across the GB of the bi-crystal. According to the slip traces on the surface of the deformed pillar, the activated slip systems are identified to be (101)D with a SF of 0.482 and (101)C with a SF of 0.25, as illustrated in Figure 7d. The geometrical compatibility factor associated with the two slip systems (101)D/(101)C is 0.44. We computed the geometrical compatibility factors associated with all pairs of slip systems (101)D/{110}C and (101)D/{112}C, the largest factor m’ = 0.74 is associated with the pair of slip systems (101)D/(1 2 ¯ 1)C. However, this pair of slips did not apparently activate. One possible reason is ascribed to the low SF of 0.15 associated with the slip system (1 2 ¯ 1)C<111>. The another pair of slips are identified to be (121)C with the highest SF of 0.466 in grain C and (01 1 ¯ )D slip with a SF of 0.24 in grain D, as illustrated in Figure 7d. The geometrical compatibility factor associated with the two slip systems is 0.75. We computed the geometrical compatibility factors associated with all pairs of slip systems (121)C/{110}D and (121)C/{112}D, the largest factor m’ = 0.79 is associated with the pair of slip systems (121)C/(11 2 ¯ )D, but the slip system (11 2 ¯ )D<111> has a low SF of 0.20. Compared to the case of bi-crystal 1, there are two sets of slip transmissions associated with slip systems (101)D/(101)C and (121)C/(01 1 ¯ )D, the pair of (101)D/(101)C has small geometrical compatibility factor but large SFs and the pair of (121)C/(01 1 ¯ )D has big geometrical compatibility factor but small SFs. Thus, the bi-crystal 2 exhibits a high flow strength, as shown in Figure 7e.

4. Conclusions

In this study, we investigated the mechanical response of single crystal and bi-crystal FeCrAl alloys using in situ micropillar compression and tension testing. According to the EBSD data, we selected grains with specific orientations which favor the type and number of activated slip systems. In order to explicitly envision the influence of the orientation and microstructures on the stress strain responses of micropillars, Figure 8 shows the mechanical responses of single crystal micropillars with one activated slip system, two activated slip systems, and multiple activated slip systems and bi-crystal micropillars. Firstly, it is expected that these micropillars will show different stress strain responses, corresponding to plastic anisotropy associated with crystal plasticity. However, we obtained a very close glide resistance of about 225 MPa for slips on {110} and {112} planes when the 0.2% offset yield strength and the largest Schmid factor were used to estimate the glide resistance. This conclusion is consistent with our systematic study in single crystal micropillars [52]. Secondly, the strain hardening rates derived from these tests clearly indicated that the weakest hardening is associated with pillars with one activated slip system, the largest hardening is observed in pillars with multiple activated slip systems. With increasing the number of activated slip systems, the strain hardening rate increases. Thirdly, the critical strain for reaching a stable strain hardening rate increases with the number of activated slip systems in micropillars and pillars’ diameter. Lastly, for the bi-crystal pillars, the strain hardening rate is also related to the geometrical compatibility factor, the higher the factor is, the lower the strain hardening rate and the weaker the strengthening effect are. These results can be used to develop the mechanisms-based meso/micro/macro-scale constitutive laws for FeCrAl polycrystalline aggregates in order to accelerate designing and predicting mechanical response of structural components [61,62].

Author Contributions

Conceptualization and methodology, J.W.; software, D.X. and B.W.; formal analysis, D.X., B.W. and W.W.; investigation, D.X. and B.W.; resources, J.W.; data curation, D.X., B.W. and W.W.; writing—original draft preparation, D.X.; writing—review and editing, J.W.; supervision, J.W.; project administration, J.W.; funding acquisition, J.W. All authors have read and agreed to the published version of the manuscript.

Funding

This work was fully supported by the Department of Energy (DOE) Office of Nuclear Energy and Nuclear Energy University Program through Award No. DE-NEUP-18-15703.

Acknowledgments

The research was performed in part in the Nebraska Nanoscale Facility: National Nanotechnology Coordinated Infrastructure and the Nebraska Center for Materials and Nanoscience (and/or NERCF), which are supported by the National Science Foundation under Award ECCS: 2025298, and the Nebraska Research Initiative. Valuable discussions with Kaisheng Ming and Shun Xu is really appreciated.

Conflicts of Interest

The authors declare no conflict of interest.

References

  1. He, Y.; Liu, J.; Han, Z.; Deng, Z.; Su, X.; Ji, Y. Phase transformation and precipitation during solidification of FeCrAl alloy for automobile exhaust gas purifying systems. J. Alloy. Comp. 2017, 714, 251–257. [Google Scholar] [CrossRef]
  2. Field, K.G.; Briggs, S.A.; Edmondson, P.D.; Haley, J.C.; Howard, R.H.; Hu, X.; Littrell, K.C.; Parish, C.M.; Yamamoto, Y. Database on Performance of Neutron Irradiated FeCrAl Alloys; Oak Ridge National Laboratory (ORNL): Oak Ridge, TN, USA, 2016.
  3. Du, C.; Maresca, F.; Geers, M.G.; Hoefnagels, J.P. Ferrite slip system activation investigated by uniaxial micro-tensile tests and simulations. Acta Mater. 2018, 146, 314–327. [Google Scholar] [CrossRef]
  4. Sun, Z.; Yamamoto, Y.; Chen, X. Impact toughness of commercial and model FeCrAl alloys. Mater. Sci. Eng. A 2018, 734, 93–101. [Google Scholar] [CrossRef]
  5. Peirce, D.; Asaro, R.J.; Needleman, A. An analysis of nonuniform and localized deformation in ductile single crystals. Acta Metal. 1982, 30, 1087–1119. [Google Scholar] [CrossRef]
  6. Follansbee, P.S.; Kocks, U.F. A constitutive description of the deformation of copper based on the use of the mechanical threshold stress as an internal state variable. Acta Metal. 1988, 36, 81–93. [Google Scholar] [CrossRef] [Green Version]
  7. Zerilli, F.J.; Armstrong, R.W. Dislocation-mechanics-based constitutive relations for material dynamics calculations. J. Appl. Phys. 1987, 61, 1816–1825. [Google Scholar] [CrossRef] [Green Version]
  8. Lee, M.G.; Lim, H.; Adams, B.L.; Hirth, J.P.; Wagoner, R.H. A dislocation density-based single crystal constitutive equation. Int. J. Plast. 2010, 26, 925–938. [Google Scholar] [CrossRef]
  9. Beyerlein, I.J.; Tomé, C.N. A dislocation-based constitutive law for pure Zr including temperature effects. Int. J. Plast. 2008, 24, 867–895. [Google Scholar] [CrossRef]
  10. Bertin, N.; Capolungo, L.; Beyerlein, I.J. Hybrid dislocation dynamics based strain hardening constitutive model. Int. J. Plast. 2013, 49, 119–144. [Google Scholar] [CrossRef]
  11. Lin, Y.C.; Wen, D.-X.; Huang, Y.-C.; Chen, X.-M.; Chen, X.-W. A unified physically based constitutive model for describing strain hardening effect and dynamic recovery behavior of a Ni-based superalloy. J. Mater. Res. 2015, 30, 3784–3794. [Google Scholar] [CrossRef]
  12. Ma, A.; Roters, F.; Raabe, D. On the consideration of interactions between dislocations and grain boundaries in crystal plasticity finite element modeling—Theory, experiments, and simulations. Acta Mater. 2006, 54, 2181–2194. [Google Scholar] [CrossRef]
  13. Zaefferer, S. A study of active deformation systems in titanium alloys: Dependence on alloy composition and correlation with deformation texture. Mater. Sci. Eng. A 2003, 344, 20–30. [Google Scholar] [CrossRef]
  14. Li, H.; Mason, D.E.; Bieler, T.R.; Boehlert, C.J.; Crimp, M.A. Methodology for estimating the critical resolved shear stress ratios of α-phase Ti using EBSD-based trace analysis. Acta Mater. 2013, 61, 7555–7567. [Google Scholar] [CrossRef]
  15. Barkia, B.; Doquet, V.; Couzinié, J.P.; Guillot, I.; Héripré, E. In Situ monitoring of the deformation mechanisms in titanium with different oxygen contents. Mater. Sci. Eng. A 2015, 636, 91–102. [Google Scholar] [CrossRef]
  16. Wu, X.; Kalidindi, S.R.; Necker, C.; Salem, A.A. Prediction of crystallographic texture evolution and anisotropic stress-strain curves during large plastic strains in high purity α-titanium using a Taylor-type crystal plasticity model. Acta Mater. 2007, 55, 423–432. [Google Scholar] [CrossRef]
  17. Knezevic, M.; Lebensohn, R.A.; Cazacu, O.; Revil-Baudard, B.; Proust, G.; Vogel, S.C.; Nixon, M.E. Modeling bending of α-titanium with embedded polycrystal plasticity in implicit finite elements. Mater. Sci. Eng. A 2013, 564, 116–126. [Google Scholar] [CrossRef]
  18. Chakraborty, A.; Eisenlohr, P. Evaluation of an inverse methodology for estimating constitutive parameters in face-centered cubic materials from single crystal indentations. Eur. J. Mech. A/Solids 2017, 66, 114–124. [Google Scholar] [CrossRef]
  19. Sánchez-Martín, R.; Pérez-Prado, M.T.; Segurado, J.; Bohlen, J.; Gutiérrez-Urrutia, I.; Llorca, J.; Molina-Aldareguia, J.M. Measuring the critical resolved shear stresses in Mg alloys by instrumented nanoindentation. Acta Mater. 2014, 71, 283–292. [Google Scholar] [CrossRef] [Green Version]
  20. Wang, L.; Zheng, Z.; Phukan, H.; Kenesei, P.; Park, J.S.; Lind, J.; Suter, R.M.; Bieler, T.R. Direct measurement of critical resolved shear stress of prismatic and basal slip in polycrystalline Ti using high energy X-ray diffraction microscopy. Acta Mater. 2017, 132, 598–610. [Google Scholar] [CrossRef]
  21. Pagan, D.C.; Shade, P.A.; Barton, N.R.; Park, J.-S.; Kenesei, P.; Menasche, D.B.; Bernier, J.V. Modeling slip system strength evolution in Ti-7Al informed by in-situ grain stress measurements. Acta Mater. 2017, 128, 406–417. [Google Scholar] [CrossRef] [Green Version]
  22. Liu, Y.; Li, N.; Arul Kumar, M.; Pathak, S.; Wang, J.; McCabe, R.J.; Mara, N.A.; Tomé, C.N. Experimentally quantifying critical stresses associated with basal slip and twinning in magnesium using micropillars. Acta Mater. 2017, 135, 411–421. [Google Scholar] [CrossRef]
  23. Gong, J.; Wilkinson, A.J. Anisotropy in the plastic flow properties of single-crystal α titanium determined from micro-cantilever beams. Acta Mater. 2009, 57, 5693–5705. [Google Scholar] [CrossRef]
  24. Kim, J.-Y.; Greer, J.R. Tensile and compressive behavior of gold and molybdenum single crystals at the nano-scale. Acta Mater. 2009, 57, 5245–5253. [Google Scholar] [CrossRef]
  25. Franciosi, P.; Berveiller, M.; Zaoui, A. Latent hardening in copper and aluminium single crystals. Acta Metal. 1980, 28, 273–283. [Google Scholar] [CrossRef]
  26. Devincre, B.; Kubin, L.; Hoc, T. Physical analyses of crystal plasticity by DD simulations. Scr. Mater. 2006, 54, 741–746. [Google Scholar] [CrossRef]
  27. Po, G.; Mohamed, M.S.; Crosby, T.; Erel, C.; El-Azab, A.; Ghoniem, N. Recent progress in discrete dislocation dynamics and its applications to micro plasticity. JOM 2014, 66, 2108–2120. [Google Scholar] [CrossRef]
  28. Queyreau, S.; Monnet, G.; Devincre, B. Slip systems interactions in α-iron determined by dislocation dynamics simulations. Int. J. Plast. 2009, 25, 361–377. [Google Scholar] [CrossRef]
  29. Nomoto, A.; Soneda, N.; Takahashi, A.; Ishino, S. Interaction analysis between edge dislocation and self interstitial type dislocation loop in BCC iron using molecular dynamics. Mater. Trans. 2005, 46, 463–468. [Google Scholar] [CrossRef] [Green Version]
  30. Buehler, M.J.; Hartmaier, A.; Gao, H.; Duchaineau, M.A.; Abraham, F.F. The dynamical complexity of work-hardening: A large-scale molecular dynamics simulation. Acta Mech. Sin. 2005, 21, 103–111. [Google Scholar] [CrossRef]
  31. Choudhary, B.K.; Samuel, E.I.; Bhanu Sankara Rao, K.; Mannan, S.L. Tensile stress–strain and work hardening behaviour of 316LN austenitic stainless steel. Mater. Sci. Technol. 2001, 17, 223–231. [Google Scholar] [CrossRef]
  32. Sainath, G.; Choudhary, B.K.; Christopher, J.; Isaac Samuel, E.; Mathew, M.D. Applicability of Voce equation for tensile flow and work hardening behaviour of P92 ferritic steel. Int. J. Press. Vessel. Pip. 2015, 132, 1–9. [Google Scholar] [CrossRef]
  33. Kocks, U.F. Laws for work-hardening and low-temperature creep. J. Eng. Mater. Technol. 1976, 98, 76–85. [Google Scholar] [CrossRef]
  34. Sengupta, A.; Putatunda, S.K.; Bartosiewicz, L.; Hangas, J.; Nailos, P.J.; Peputapeck, M.; Alberts, F.E. Tensile behavior of a new single-crystal nickel-based superalloy (CMSX-4) at room and elevated temperatures. J. Mater. Eng. Perfor. 1994, 3, 73–81. [Google Scholar] [CrossRef]
  35. Ludwik, P. Fließvorgänge bei einfachen Beanspruchungen. In Elemente der Technologischen Mechanik; Springer: Berlin/Heidelberg, Germany, 1909; pp. 11–35. [Google Scholar]
  36. Hollomon, J.H. Tensile deformation. Aime Trans. 1945, 12, 1–22. [Google Scholar]
  37. Swift, H.W. Plastic instability under plane stress. J. Mech. Phys. Solid. 1952, 1, 1–18. [Google Scholar] [CrossRef]
  38. Voce, E. The relationship between stress and strain for homogeneous deformation. J. Inst. Met. 1948, 74, 537–562. [Google Scholar]
  39. Wu, T.-Y.; Bassani, J.L.; Laird, C. Latent hardening in single crystals—I. Theory and experiments. Proc. Roy. Soc. London. A Math. Phys. Sci. 1991, 435, 1–19. [Google Scholar]
  40. Wang, M.; Shi, L.; Li, C.; Wang, Z.G.; Xiao, J.M. A study of latent hardening behavior in aluminium single crystals. Scr. Mater. 1996, 35, 1183–1188. [Google Scholar]
  41. Frick, C.P.; Clark, B.G.; Orso, S.; Schneider, A.S.; Arzt, E. Size effect on strength and strain hardening of small-scale [111] nickel compression pillars. Mater. Sci. Eng. A 2008, 489, 319–329. [Google Scholar] [CrossRef]
  42. Kiener, D.; Guruprasad, P.J.; Keralavarma, S.M.; Dehm, G.; Benzerga, A.A. Work hardening in micropillar compression: In Situ experiments and modeling. Acta Mater. 2011, 59, 3825–3840. [Google Scholar] [CrossRef]
  43. Greer, J.R.; De Hosson, J.T.M. Plasticity in small-sized metallic systems: Intrinsic versus extrinsic size effect. Prog. Mater. Sci. 2011, 56, 654–724. [Google Scholar] [CrossRef]
  44. Uchic, M.D.; Dimiduk, D.M.; Florando, J.N.; Nix, W.D. Sample dimensions influence strength and crystal plasticity. Science 2004, 305, 986–989. [Google Scholar] [CrossRef]
  45. Uchic, M.D.; Shade, P.A.; Dimiduk, D.M. Plasticity of micrometer-scale single crystals in compression. Ann. Rev. Mater. Res. 2009, 39, 361–386. [Google Scholar] [CrossRef] [Green Version]
  46. Budiman, A.S.; Narayanan, K.R.; Li, N.; Wang, J.; Tamura, N.; Kunz, M.; Misra, A. Plasticity evolution in nanoscale Cu/Nb single-crystal multilayers as revealed by synchrotron X-ray microdiffraction. Mater. Sci. Eng. A 2015, 635, 6–12. [Google Scholar] [CrossRef] [Green Version]
  47. Fei, H.; Abraham, A.; Chawla, N.; Jiang, H. Evaluation of micro-pillar compression tests for accurate determination of elastic-plastic constitutive relations. J. Appl. Mech. 2012, 79, 061011. [Google Scholar] [CrossRef] [Green Version]
  48. Ming, K.; Gu, C.; Su, Q.; Wang, Y.; Zare, A.; Lucca, D.A.; Nastasi, M.; Wang, J. Strength and plasticity of amorphous silicon oxycarbide. J. Nucl. Mater. 2019, 516, 289–296. [Google Scholar] [CrossRef] [Green Version]
  49. Tsien, L.; Chow, Y. The glide of single crystals of molybdenum. Proc. Roy. Soc. London. A Math. Phys. Sci. 1937, 163, 19–28. [Google Scholar]
  50. Barrett, C.S.; Ansel, G.; Mehl, R. Slip, twinning and cleavage in iron and silicon ferrite. Trans. ASM 1937, 25, 702. [Google Scholar]
  51. Sun, Z.; Yamamoto, Y. Processability evaluation of a Mo-containing FeCrAl alloy for seamless thin-wall tube fabrication. Mater. Sci. Eng. A 2017, 700, 554–561. [Google Scholar] [CrossRef]
  52. Xu, S.; Xie, D.; Liu, G.; Ming, K.; Wang, J. Quantifying the resistance to dislocation Gglide in single phase FeCrAl alloy. Int. J. Plast. 2020, 132, 102770. [Google Scholar] [CrossRef]
  53. Greer, J.R.; Nix, W.D. Nanoscale gold pillars strengthened through dislocation starvation. Phys. Rev. B 2006, 73, 245410. [Google Scholar] [CrossRef] [Green Version]
  54. Luster, J.; Morris, M. Compatibility of deformation in two-phase Ti-Al alloys: Dependence on microstructure and orientation relationships. Metal. Mater. Trans. A 1995, 26, 1745–1756. [Google Scholar] [CrossRef]
  55. Kacher, J.; Sabisch, J.E.; Minor, A.M. Statistical analysis of twin/grain boundary interactions in pure rhenium. Acta Mater. 2019, 173, 44–51. [Google Scholar] [CrossRef]
  56. Wang, L.; Eisenlohr, P.; Yang, Y.; Bieler, T.; Crimp, M. Nucleation of paired twins at grain boundaries in titanium. Scr. Mater. 2010, 63, 827–830. [Google Scholar] [CrossRef]
  57. Xin, R.; Liu, Z.; Sun, Y.; Wang, H.; Guo, C.; Ren, W.; Liu, Q. Understanding common grain boundary twins in Mg alloys by a composite Schmid factor. Int. J. Plast. 2019, 123, 208–223. [Google Scholar] [CrossRef]
  58. Beyerlein, I.J.; Wang, J.; Kang, K.; Zheng, S.; Mara, N. Twinnability of bimetal interfaces in nanostructured composites. Mater. Res. Lett. 2013, 1, 89–95. [Google Scholar] [CrossRef] [Green Version]
  59. Wang, J. Atomistic simulations of dislocation pileup: Grain boundaries interaction. JOM 2015, 67, 1515–1525. [Google Scholar] [CrossRef]
  60. Molodov, K.D.; Molodov, D.A. Grain boundary mediated plasticity: On the evaluation of grain boundary migration—Shear coupling. Acta Mater. 2018, 153, 336–353. [Google Scholar] [CrossRef]
  61. Liu, G.; Xie, D.; Wang, S.; Misra, A.; Wang, J. Mesoscale crystal plasticity modeling of nanoscale Al–Al2Cu eutectic alloy. Int. J. Plast. 2019, 121, 134–152. [Google Scholar] [CrossRef]
  62. Wang, H.; Wu, P.; Wang, J.; Tomé, C.N. A crystal plasticity model for hexagonal close packed (HCP) crystals including twinning and de-twinning mechanisms. Int. J. Plast. 2013, 49, 36–52. [Google Scholar] [CrossRef]
Figure 1. (a) Schematic diagram of three slip systems in a body centered cubic (BCC) unit cell; (b) Schematic diagrams show four categories of interactions between slip systems.
Crystals 10 00943 g001
Figure 2. Electron backscatter diffraction (EBSD) IPF mappings showing the grains with the orientation of (a) [ 51 ¯ 5] favoring slip system {112}<111> and (b) [ 20 ¯   9 ¯ 2] favoring slip system {110}<111>. (c,d) Micropillars FIBed in the two grains. (e,f) Compressed micropillars and schematic diagrams with traces. (g) Stress-strain curves and strain hardening rates.
Crystals 10 00943 g002
Figure 3. (a,b) Micropillars with a diameter of 5.8 μm before and after compression, showing apparent slip trace associated with slip plane (1-21); (c) the magnified image of the red square in (b), showing slip traces associated with slip plane (-1-21). (d,e) The micro-pillar with a diameter of 8.7 μm before and after compression; (e’) the back-side of the image (e); (f) The magnified image of the red square in (e’), showing slip traces associated with two slip planes (1-21) and (-1-21). (g) Stress-strain curves. (h) A schematic showing slip traces associated with slip planes (1-21) in blue and (-1-21) in green.
Crystals 10 00943 g003
Figure 4. (a,d) Micro-pillars with a diameter of 5.9 μm and 8.9 μm. (b,e) The compressed micro-pillars. (c,f) The magnified images of the compressed micro-pillars, showing apparent slip traces. (g) Stress strain curves. (h) A schematic showing traces associated with slips on (-110) plane in green and (01-1) plane in blue.
Crystals 10 00943 g004
Figure 5. (a,b) The micropillar with a diameter of 5.8 μm before and after compression at a strain of 0.1. (c,d) The micropillar with a diameter of 8.5 μm before and after compression at a strain of 0.1. (e) Stress strain curves. (f) A schematic showing four slip systems, (-1-1-2)[11-1] in blue, (-1-12)[111] in green, (-11-2)[1-1-1] in red, and (-112)[1-11] in black.
Crystals 10 00943 g005
Figure 6. (a) Stress strain curve and strain hardening rate. (b) A schematic showing four slip systems, (1-1-2)[1-11] in blue, (1-2-1)[11-1] in green, (10-1)[1-11] in red, and (1-10)[11-1] in black. (c) A dog-bone micropillar. (d,e) Two snapshots at strain of 0.075 and 0.085, respectively.
Crystals 10 00943 g006
Figure 7. (a,c) Two bi-crystal micropillars after compression at a strain of 0.3. (b) A schematic of bi-crystal 1 showing two preferred slip systems. (d) Two schematics of bi-crystal 2 showing two pairs of two preferred slip systems. Yellow dashed lines indicate grain boundaries. The arrows show the slip vectors. (e) True stress-strain curves and strain hardening rates.
Crystals 10 00943 g007
Figure 8. Comparison of stress-strain responses and corresponding strain hardening rates of micropillars with different orientations.
Crystals 10 00943 g008
Publisher’s Note: MDPI stays neutral with regard to jurisdictional claims in published maps and institutional affiliations.

