Article

Study on Co-Crystallization of LCZ696 Using In Situ ATR-FTIR and Imaging

1
School of Chemistry and Chemical Engineering, South China University of Technology, Guangzhou 510641, China
2
Laboratory for Pharmaceutical and Crystallization Systems Engineering, Beijing Key Laboratory of Enze Biomass Fine Chemicals, School of Chemical Engineering, Beijing University of Petrochemical Technology, Beijing 102617, China
*
Authors to whom correspondence should be addressed.
Crystals 2020, 10(10), 922; https://doi.org/10.3390/cryst10100922
Submission received: 11 September 2020 / Revised: 5 October 2020 / Accepted: 7 October 2020 / Published: 12 October 2020
(This article belongs to the Section Crystal Engineering)

Abstract

:
In situ ATR-FTIR spectroscopy and imaging and image analysis were applied to the study of the multicomponent co-crystallization process involving S-valsartan and sacubitril in which LCZ696 crystals were formed. LCZ696 is a combination drug for use in heart failure that was approved by the FDA in 2015 following development by Novartis Pharmaceuticals. Though much work was reported on LCZ696 about its pharmacokinetic and pharmacodynamic effects in the evaluation and clinical testing, less attention was paid to study on the co-crystallization process. LCZ696 crystals have shown difficulties in filtration mainly due to the small particle size. In this work, LCZ696 crystals were prepared successfully by S-valsartan and sacubitril, and characterized by SEM, XRPD, TG-DSC and ATR-FTIR. ATR-FTIR and imaging and image analysis were used to monitoring solution concentration and investigating the co-crystallization mechanism. It revealed that the nucleation process was very slow compared with the transformation process, which is indication that the co-crystallization was controlled by nucleation. LCZ696 crystals are composed of very thin hexagonal plates, which seems indicating that LCZ696 crystals grow mainly in two size dimensions. Stirrer speed and crystal seeds were found to have noticeable effect on the induction time, transformation time and crystal size distribution. The Johnson-Mehl-Avrami equation was found to be able to describe the co-crystallization process.

Graphical Abstract

1. Introduction

Valsartan (C24H29N5O3; S-configure CAS No. 137862-53-4; R-configure CAS No. 137862-87-4; molar mass 957.99 g·mol−1; Figure 1), originally developed by Ciba-Geigy and later Novartis Pharmaceuticals is for hypertension and heart failure as an orally bioavailable and highly selective angiotensin receptor blocker (ARB) [1,2]. There is one chiral center in the valsartan molecule but the pure S-configure is essentially used on the market [3]. It was approved by the FDA (U.S. Food and Drug Administration) in 1996 [4,5]. The drug however was classified as a BCS (biopharmaceutics classification system) class II compound with poor water-solubility at pH 4.5 or lower, resulting in low bioavailability in a pivotal human study [6,7]. In addition, it is known that highly crystalline valsartan material was difficult to make [1,4,8,9,10,11], which could lead to an undesired solid state with unfavorable processability and chemical stability [12,13].
Multicomponent pharmaceutical solid forms, including hydrates, solvates, salts, and supramolecules are often used to improve the properties of an API (active pharmaceutical ingredient). In recent years, supramolecules attracted much research attention [14,15,16]. Supramolecules have different structures and functions compared to the original self-assembly molecules. They are formed by a combination of intermolecular weak interactions, including hydrogen bonds, coordinate bonds and π-π stacking [17,18,19].
LCZ696 (trisodium [3-((1S,3R)-1-biphenyl-4-ylmethyl-3-ethoxycarbonyl-1-butylcarbamoyl)propionate-(S)-3′-methyl-2′-(pentanoyl(2′-(tetrazol-5-ylate)biphenyl-4′-ylmethyl)amino)butyrate] hemipentahydrate; C48H55N6O8Na3·2.5H2O; CAS No. 936623-90-4; molar mass 957.99 g·mol−1; Figure 2), sold under the name Entresto, is a blockbuster heart failure drug developed by Novartis [20]. The FDA approved it in July 2015 [21,22]. It is a supramolecular complex comprised of valsartan (ARB) and sacubitril (neprilysin inhibitor, NEPi) [23]. LCZ696 shows dual inhibition mechanisms of NEPi and ARB, the sacubitril part could block threatens of the peptides responsible for lowering blood pressure and the valsartan part could improve vasodilation and stimulate the body to excrete sodium and water [24,25]. Unlike valsartan, LCZ696 shows favorable stability and water-solubility [20].
There are two synthesis methods for LCZ696 in the original patent [23]. One is to prepare LCZ696 by sacubitril and valsartan directly in acetone/isopropyl acetate and the other is to obtain sacubitril from sacubitril hemi-calcium salt first before preparing LCZ696. Li et al. [26] studied the preparation of LCZ696 in different solvents. In addition, previous literature about LCZ696 has focused on pharmacokinetic and pharmacodynamic effects in evaluation and clinical testing [21,27,28], but little attention was paid to the co-crystallization process of the complex multicomponent of LCZ696, despite the fact that it is known that LCZ696 crystals could have difficulty in processing such as filtration due to small crystal size and that the crystals are prone to absorb moisture.
The use of PAT (process analytical technology) in co-crystallization study has attracted much attention in recent years [29,30,31,32,33,34,35,36]. ATR-FTIR spectroscopy [37,38,39], Raman spectroscopy [40,41], particle vision measurement (PVM) [42], and focused beam reflectance measurement (FBRM) [43] were used to real-time crystallization process monitoring. The above literature on applying PAT to the study of multicomponent crystallization processes, despite still relatively limited in number in comparison to the use in research on mono-component crystallization, provides valuable reference to the current work on applying in situ ATR-FTIR spectroscopy and on-line microscopic imaging and image analysis. In this paper, PAT, including ATR-FTIR and an on-line imaging probe, were applied to the co-crystallization of LCZ696 with the aim of improving the mechanistic understanding of its co-crystallization process and controlling the crystal properties. ATR-FTIR was used to monitor the supersaturation and the on-line imaging probe was utilized to detect the crystal shape and size as well as observing process phenomena.

2. Experiment

2.1. Materials

Sacubitril calcium salt (99% purity grade) and valsartan (99% purity grade) were purchased from Shanghai Link Chem Technology Co., Ltd. and Aladdin Reagent Technology Co. Ltd., respectively, which were stored under ambient conditions and used as received. Solid state forms were identified by X-ray powder diffraction. Acetone (99% purity grade), isopropyl acetate (99% purity grade), and concentrated hydrochloric acid (36%~38% purity grade) of analytical pure grade was purchased from Sinopharm Chemical Reagent Co., Ltd. Deionized water was also used.

2.2. Apparatus and Analysis Methods

All the samples were weighted by an analytical balance (Mettler Toledo AL204, Switzerland) with uncertainty of 0.0001 g. The product was analyzed by X-ray powder diffraction (Bruker D8 ADVANCE, Germany). The samples were determined by Cu Kα radiation (0.15405 nm), and the tube voltage and current were set at 40 KV and 40 mA, respectively. The data were collected at the 2θ range of 3° to 40° with a step size of 0.01313° under atmospheric pressure. Thermal properties were measured by a simultaneous thermal analyzer (NETZSCH STA 449 C, NETZSCH, Germany) with temperatures ranging from 298.15 K to 773.15 K with a heating rate of 10 K/min in a nitrogen atmosphere. Calibration of temperature and heat flow of the instrument were performed with indium before measurement. Thermal property was also investigated under hot stage (LTS 420, LinKam, UK) with a heating rate of 5 K/min in a nitrogen atmosphere at temperatures ranging from 298.15 K to 473.15 K. The digital images of the crystals were captured using a CCD color vision camera (MicroPublisher 3.3 RTV, QImaging, Canada) mounted on an Olympus BX53 optical microscope. The crystal size distribution of the crystal products was measured using a laser particle analyzer (Mastersizer 3000, Malvern, UK). The digital images were also captured by scanning electron microscope (LEO1530VP, Zeiss, Germany). The solution was concentrated by the rotary evaporator (RE 52AA, Shanghai Biochemical Instrument Factory, China). The off-line infrared (IR) spectra for solids of the initial reactants and their products were measured by attenuated total reflection Fourier transform infrared (VERTEX 70, Bruker, Germany).
All experiments were conducted in a 250 mL cylindrical double-jacketed glass vessel with a mechanical stirrer (IKA, RW20, Germany) and a circulating JULABO thermostatic water bath (FP51, JULABO, Germany). The temperature of circulating water was measured by a temperature probe with a standard uncertainty of 0.01 K. In situ attenuated total reflection Fourier transform infrared spectrometer (ReactIR 15, Mettler Toledo, Switzerland) was used to monitor the co-crystallization process in solution. The spectra were acquired with a resolution of 2 cm−1 over a wavenumber interval between 650 cm−1 and 4000 cm−1 as an average of 256 scans. The instrument is controlled via the IC IR software (version 4.3.35.0, Mettler Toledo, Switzerland), including data acquisition, and data analysis. The probe was inserted at about 15° angle close to the impeller into the co-crystallization solution in order to not interfere with the process of each experiment. The calibration model was established to analyze the variation of concentration during the co-crystallization, details of which was in Section 3.2. An on-line imaging probe (2DVP-17V16X200, Pharmavision (Qingdao) Intelligent Technology Ltd., China) was used to detect the crystal shape and size as well as observing co-crystallization phenomena.

2.3. Synthesis and Characterization of LCZ696 Crystals

LCZ696 consists of a 1:1 molecular ratio of valsartan and sacubitril. In general, valsartan can be directly purchased, while sacubitril is required to be prepared on the spot in consideration of its economic efficiency and the property of not being easily stored. So the synthetic route adopted for LCZ696 can be described as two steps, as shown graphically in Figure 3, which is the same as reported in the literature [23].
Firstly, sacubitril was prepared by sacubitril calcium salt reacting with 2 mol·L−1 dilute hydrochloric acid in the solvent of isopropyl acetate, as described below. 16.67 mL concentrated hydrochloric acid was put into a 100 mL beaker and dissolved by deionized water. The solution was poured into 100 mL volumetric flask by a glass rod, with the washing water of the beaker and the glass rod. 2 mol·L−1 dilute hydrochloric acid was prepared successfully after the deionized water was added to the scale. 10 g sacubitril calcium salt and 100 mL isopropyl acetate were put into a 250 mL conical flask, which were stirred by a magnetic stirring at room temperature. 22.8 mL 2 mol·L−1 dilute hydrochloric acid was added into the suspension above, which was transformed into clear two-phase solution after stirring for about 15 min [23]. It was separated by separatory funnel to get the sacubitril organic layer, which was washed three times using deionized water. Sacubitril that was concentrated and dried by vacuum rotary evaporation was used for the follow-up experiments.
Secondly, LCZ696 was prepared by valsartan and sacubitril in acetone using the following steps [23]. Equimolar sacubitril (2.296 mmol) and valsartan (2.296 mmol) were dissolved in 20 mL acetone in a 100 mL double-jacketed glass vessel, which was dissolved sufficiently by a mechanical agitation at 350 rpm. Sodium hydroxide aqueous solution was prepared with NaOH (6.89 mmol) and deionized water (0.6 mL). Cooled sodium hydroxide aqueous solution was added into the solution above slowly through 1 mL injection syringe at a certain rate. Then after the solution was stirred for 3 h at 25 °C, the suspension was filtered and dried in a vacuum oven at 35 °C for 12 h. The obtained solid product was analyzed by microscope, scanning electron microscope (SEM), thermogravimetry/differential scanning calorimetry (TG-DSC), X-ray powder diffraction (XRPD) and attenuated total reflection-Fourier transform infrared (ATR-FTIR). In this paper, S-valsartan, R-valsartan and racemic valsartan were used to prepare LCZ696, respectively, for studying the effects of chiral configuration of valsartan on the preparation of LCZ696.
In addition, seed crystals of LCZ696 were prepared in isopropanol as follows. The solubility of LCZ696 in isopropanol (<25 mg·mL−1) was higher than that in acetone (<1 mg·mL−1), as reported by Li et al. [26] The solvent used in this step is isopropanol. Equimolar sacubitril (2.296 mmol) and valsartan (2.296 mmol) were dissolved in 50 mL isopropanol in a 100 mL double-jacketed glass vessel, which was dissolved sufficiently by a mechanical agitation at 40 °C. Sodium hydroxide aqueous solution was prepared with NaOH (6.89 mmol) and deionized water (0.6 mL). Cooled sodium hydroxide aqueous solution was added into the solution above slowly through 1 mL injection syringe. Then the suspension was filtered and dried in a vacuum oven at 35 °C for 12 h after the solution was stirred for 2 h at 25 °C. The solution sealed by filter paper was hold for few days in a stable environment at room temperature. The seeds used in all experiments were from the same sample obtained from the same experimental run. The crystals were sieved to get the seeds. The sieve size was 20 μm.

2.4. Monitoring the Co-Crystallization of LCZ696 Using ATR-FTIR and Imaging

Equimolar sacubitril (2.296 mmol) and S-valsartan (2.296 mmol) were added to 30 mL acetone in the 100 mL double-jacketed glass vessel. The solution was stirred by a mechanical stirrer and the temperature of the system was 25 °C all the way through the experiments. After the solution was clarified by stirring, cooled sodium hydroxide aqueous solution (nsodium hydroxide = 6.89 mmol, Vwater = 0.6 mL) filtered was added into the solution above through injection syringe. After 2 h, the suspension was filtered and dried in a vacuum oven at 35 °C for 12 h. During the experiment, the IR probe and on-line imaging probe was set at about 15° angle close to the impeller into the co-crystallization solution for real-time monitoring. All the experiments were repeated twice.

3. Result and Discussion

3.1. Formation and Characterization of LCZ696

In Section 2.3, in the experiments of the co-crystallization, different configurations of valsartan, including S-valsartan, R-valsartan and racemic valsartan, were used to test a hypothesis that if S-valsartan and sacubitril or R-valsartan and sacubitril could selectively form a supramolecular complex with sacubitril, if it could it then might be used as a method for chiral resolution. One white solid matter was obtained by S-valsartan and sacubitril, which was marked as Solid I. And another white solid matter was obtained by racemic valsartan and sacubitril, which was marked as Solid II. But there was no precipitate obtained by R-valsartan and sacubitril at the end of the experiment. Analysis of Solid I and Solid II is presented below.
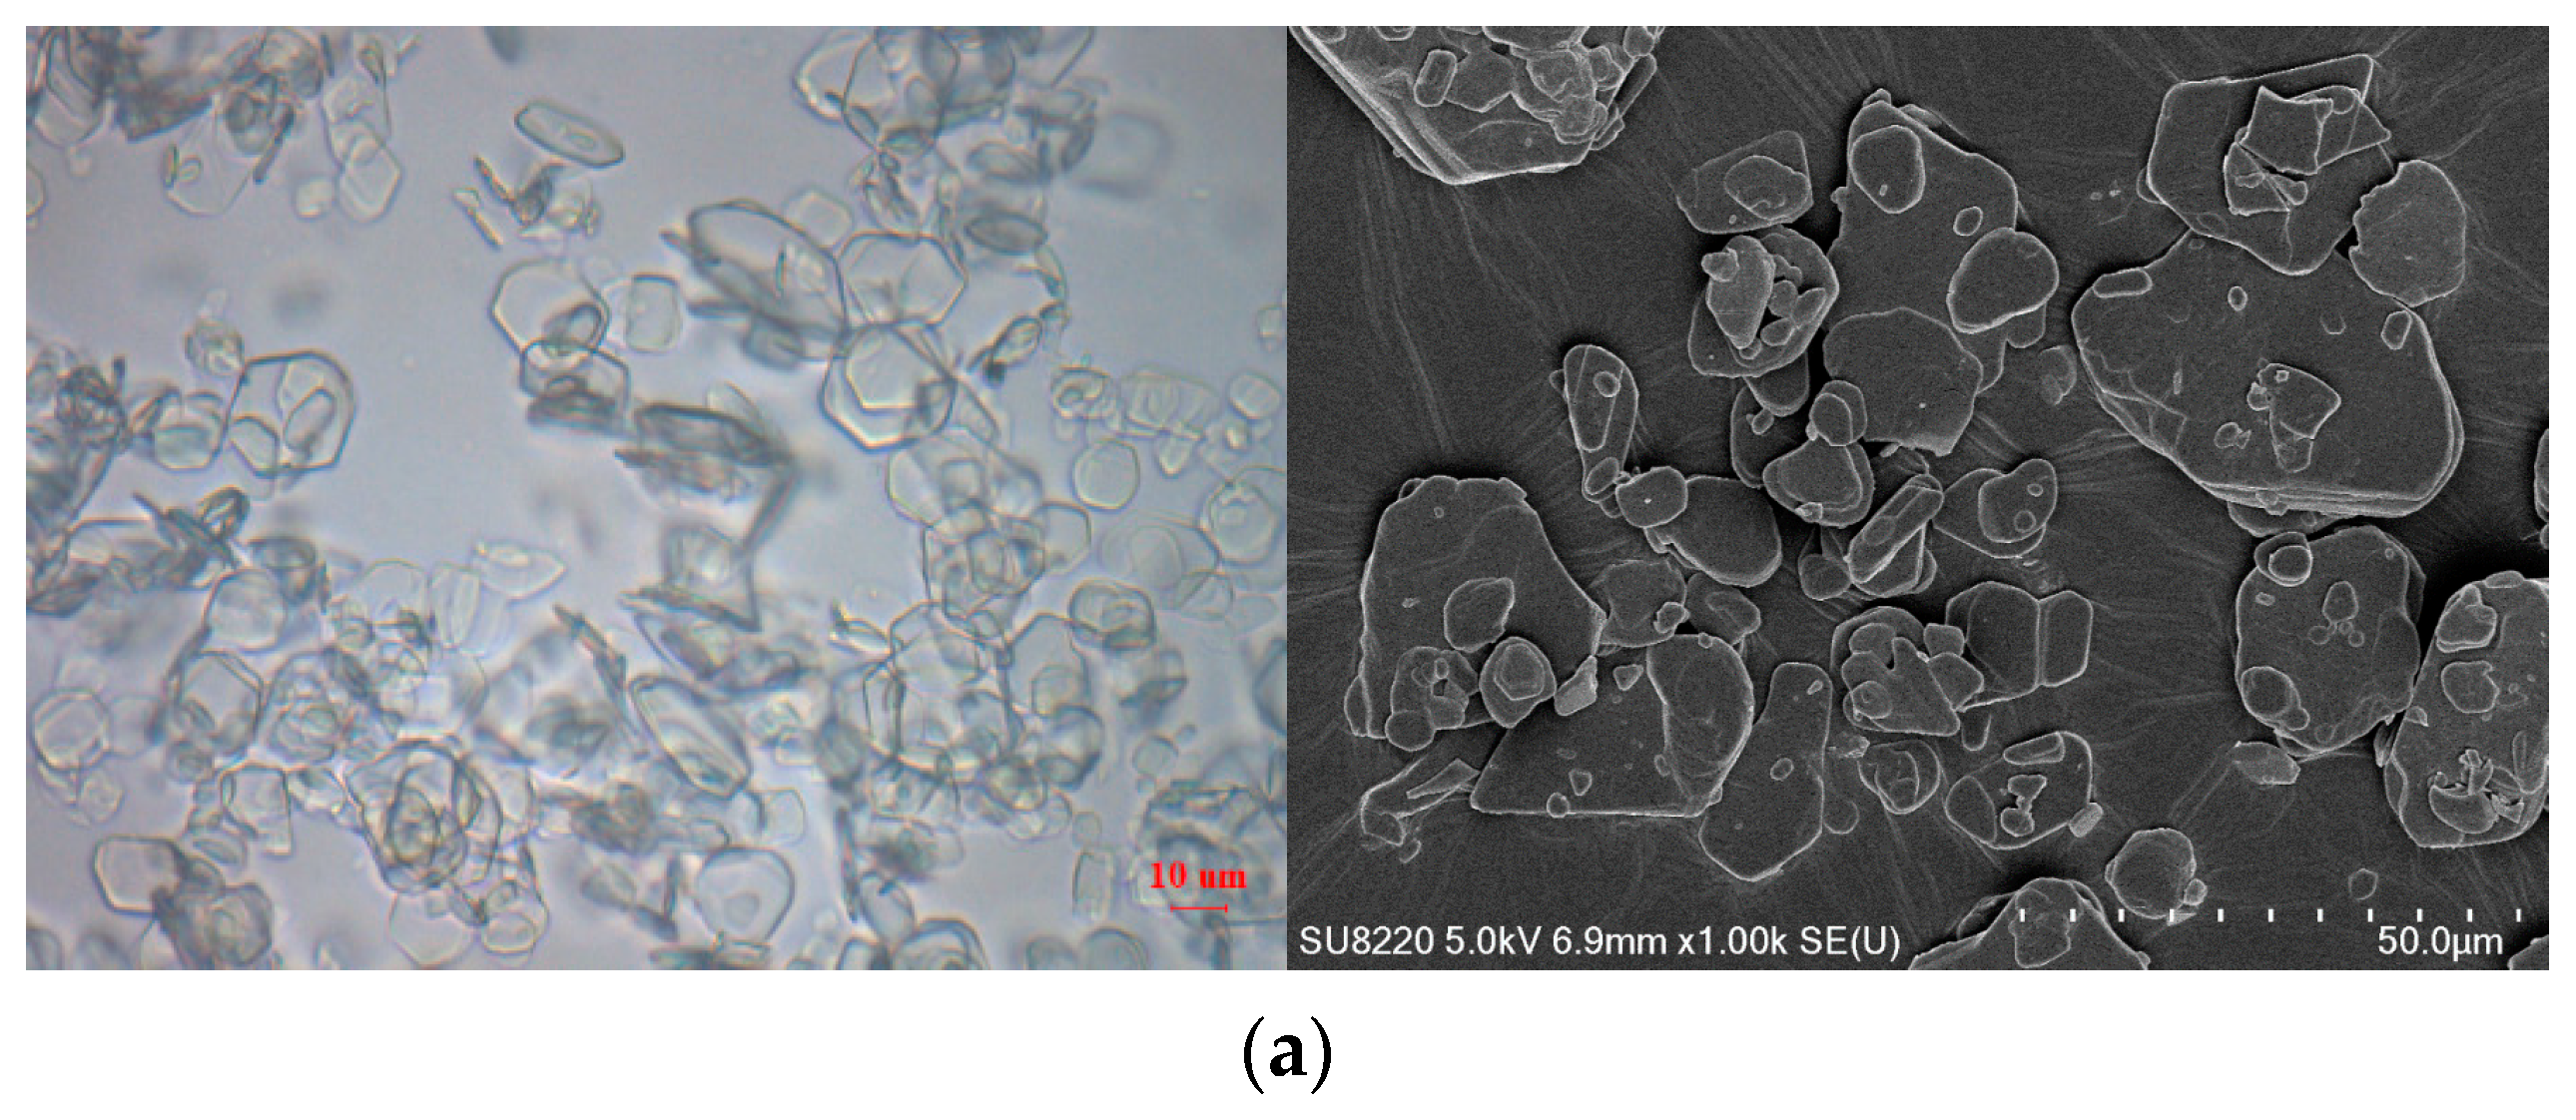
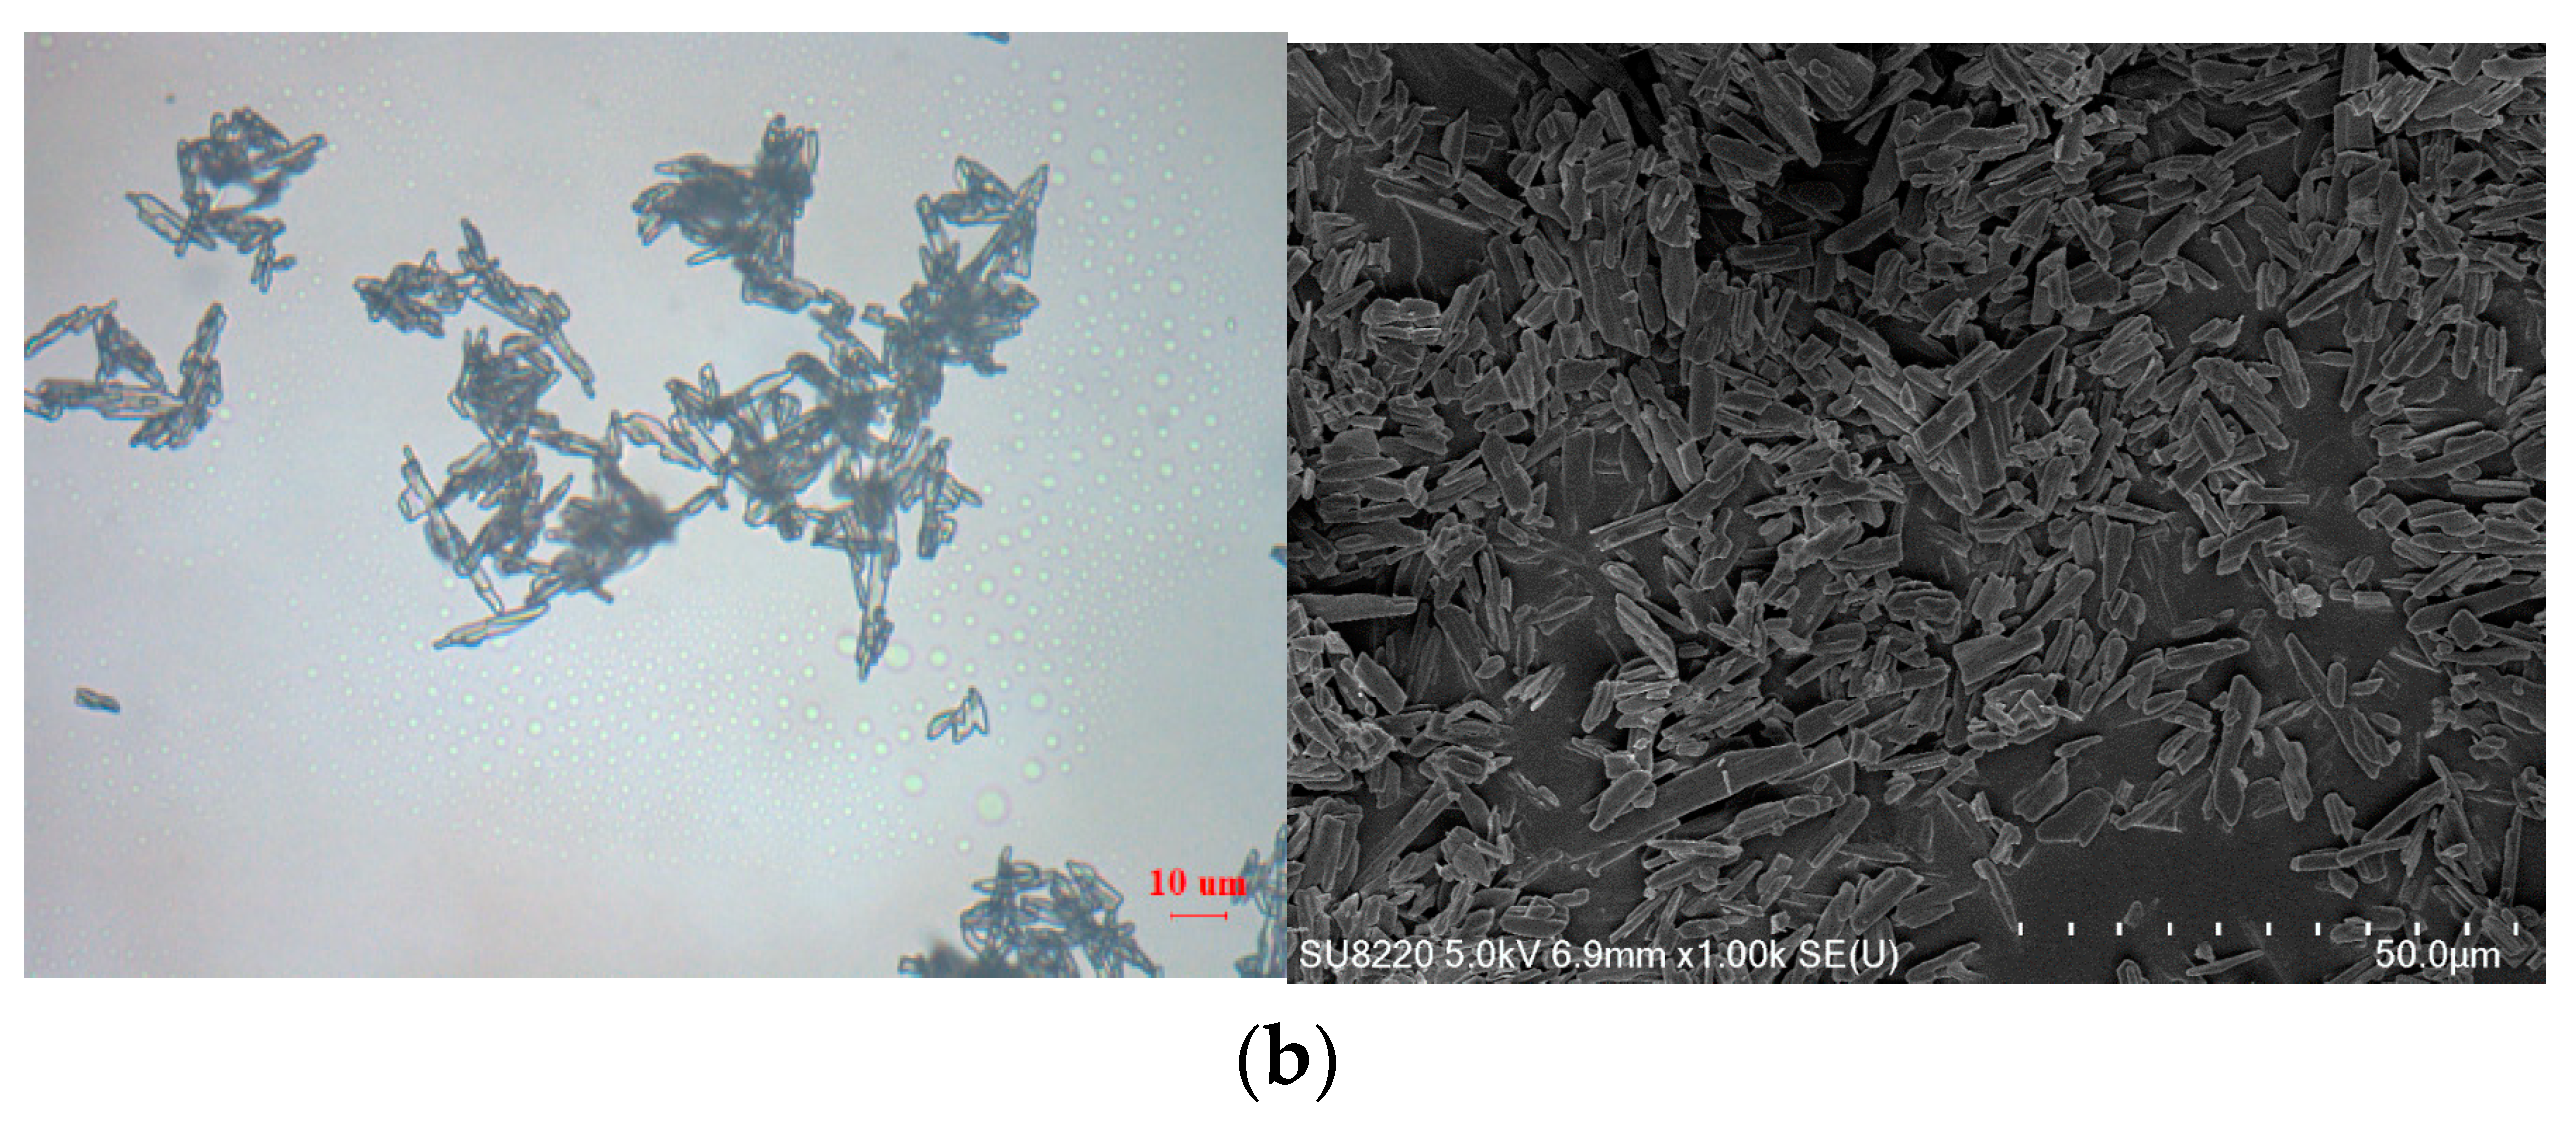
Solid I and Solid II were first analyzed by microscope and SEM, as shown in Figure 4. Obviously, Solid I is morphologically composed of very thin hexagonal plates or irregular plates. But the crystals of Solid II are slender plates, which is distinctly different from Solid I.
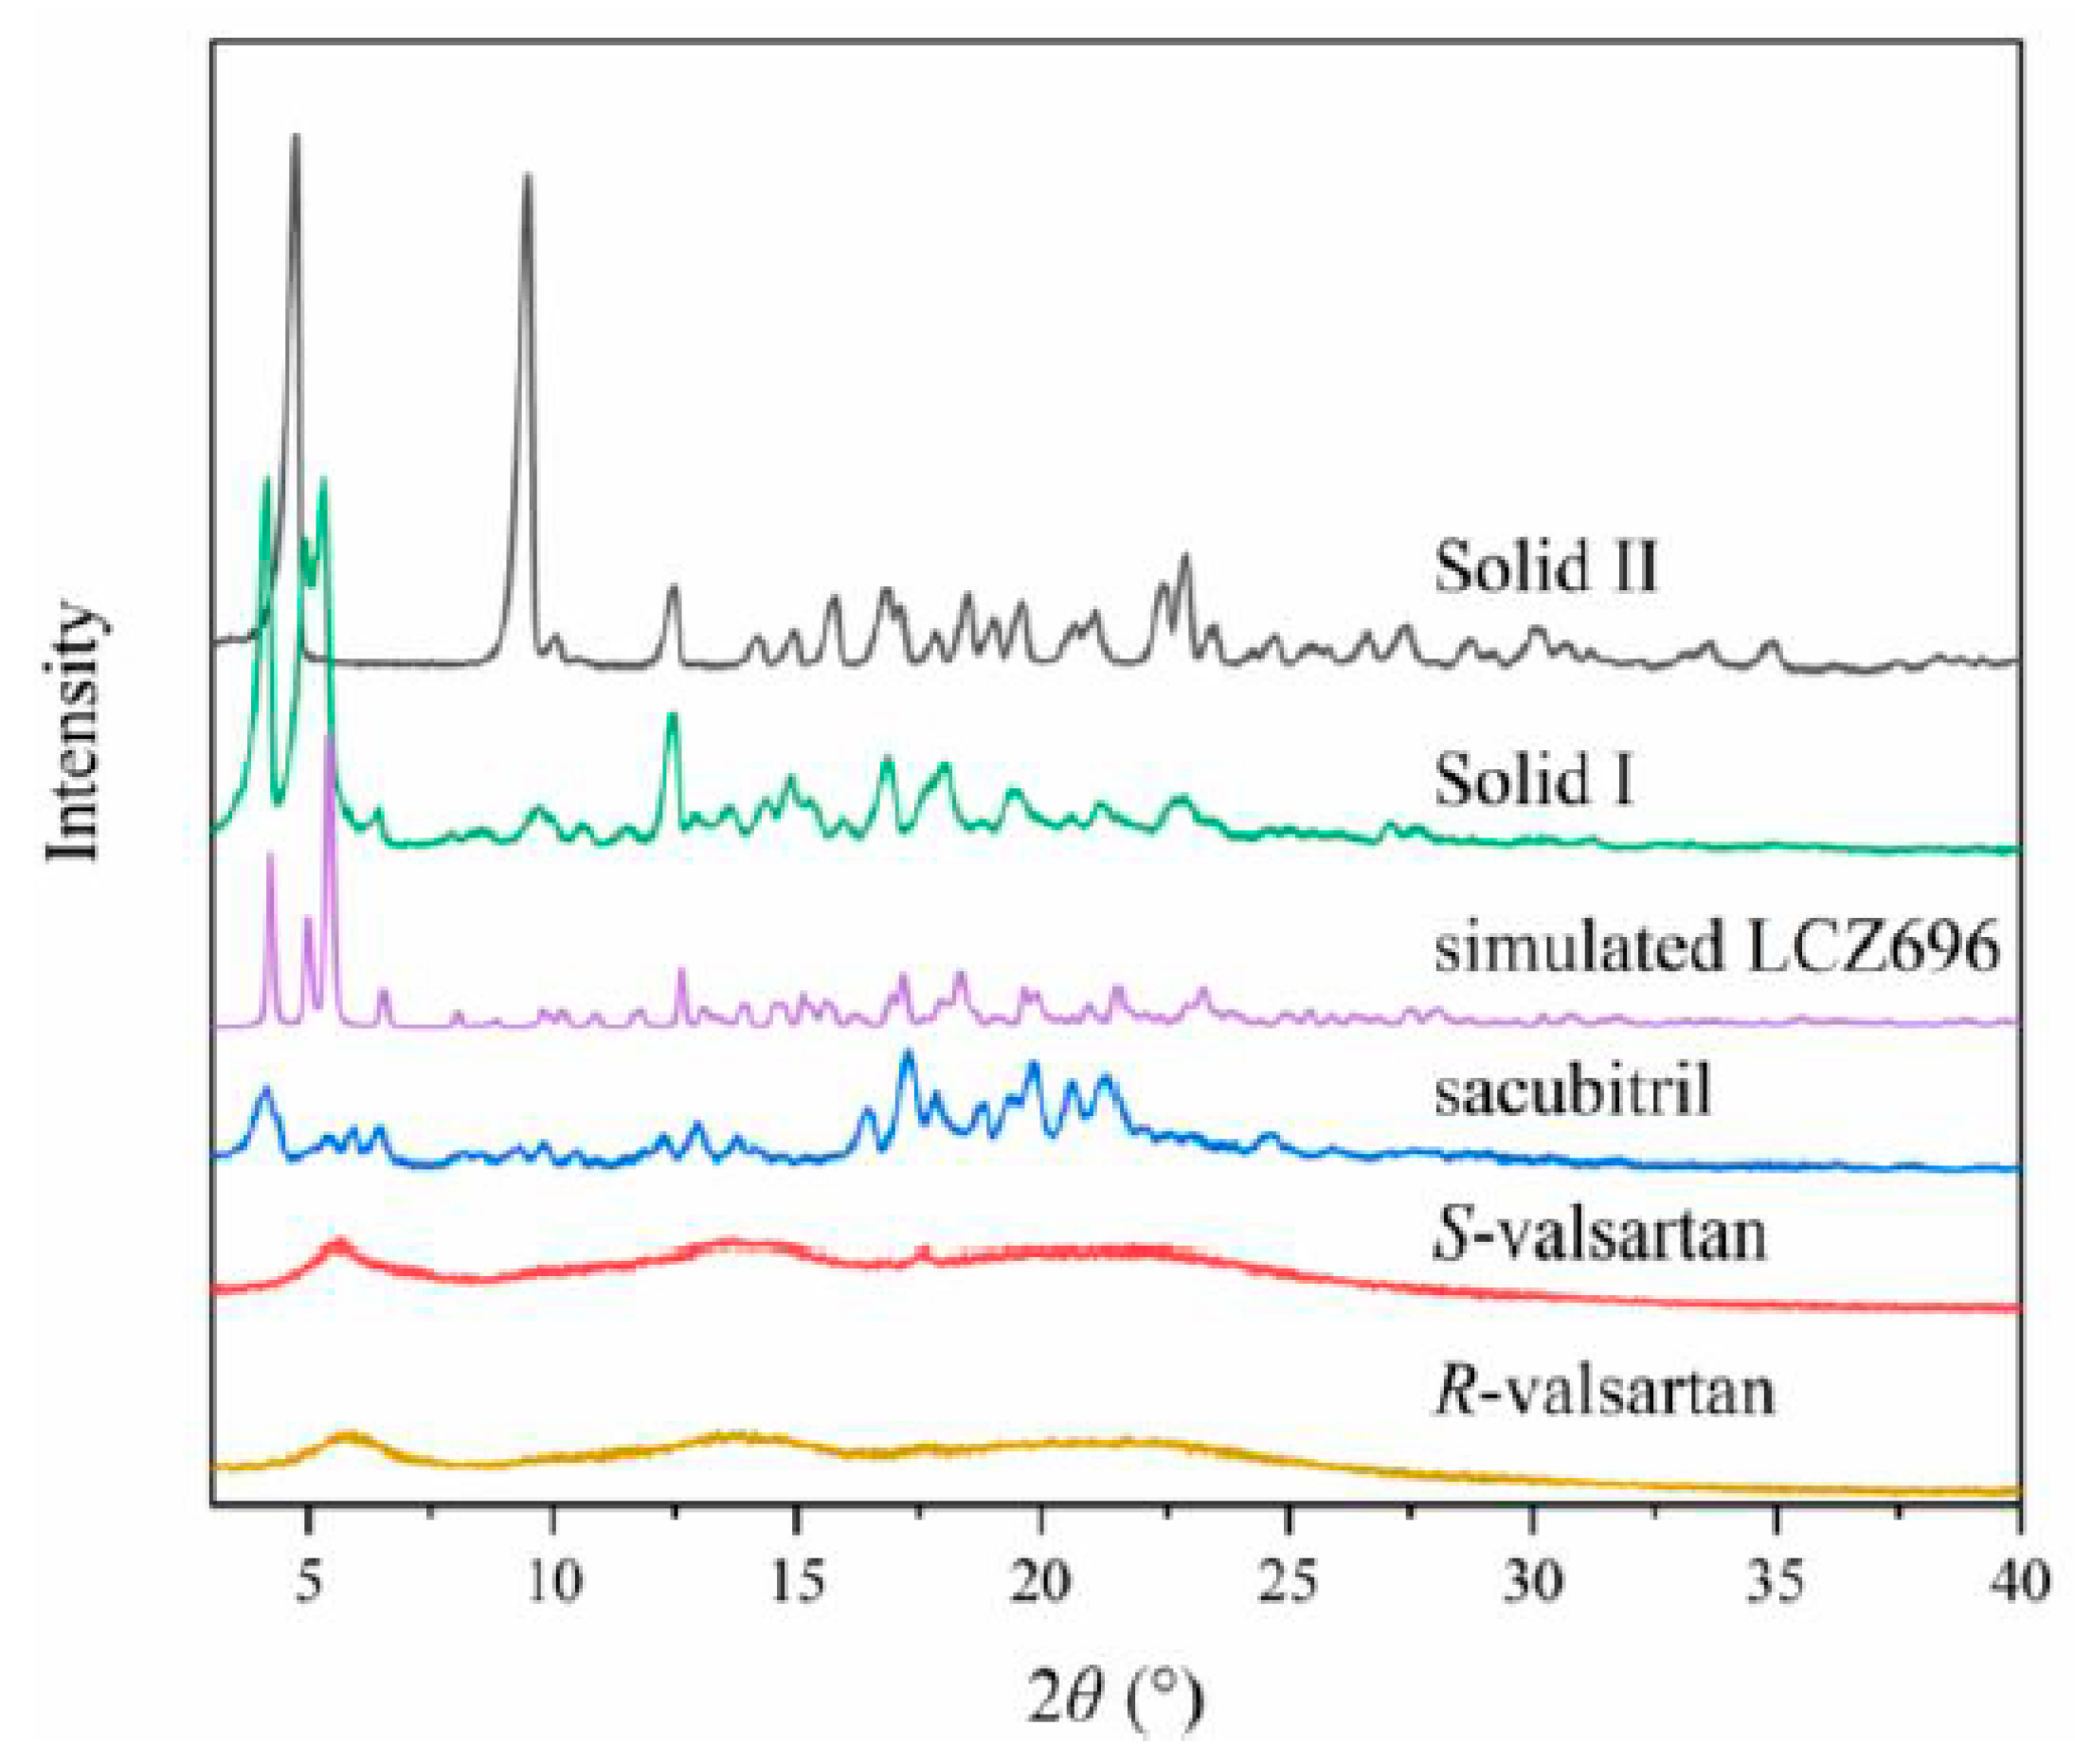
The measured XRPD patterns of S-valsartan, R-valsartan, sacubitril, solid I, and solid II are shown in Figure 5, as well as the simulated XRPD pattern of LCZ696. The crystal structure data of LCZ696 is available in the Cambridge Crystallographic Data Centre (CCDC). XRPD pattern of LCZ696 was obtained by importing the files of cif format into Material Studio software and using the module of powder diffraction. As listed in Figure 5, Solid I obtained by S-valsartan includes the diffraction peaks at 2θ = 4.5°, 5.5°, 5.6°, 9.9°, 12.8°, 15.7°, 17°, 18.3°, 19.8°, and 23.2°, which are significantly different from the initial reactants, but the same to the simulated XRPD pattern of LCZ696 and what was reported in literature. Solid I was not only compared with simulated XRPD of LCZ696, but also compared with the commercial LZC696 purchased in Shanghai Jiangge Chemical Co. Ltd. The comparison of FTIR spectra, Raman spectra and XRPD pattern by Solid I and commercial LZC696 are in good consistency (result is not given here due to space consideration).
The XRPD of solid II is also given in Figure 5, without a reasonable match with the PDF standard card. It can be concluded that LCZ696 was prepared by S-valsartan, neither by R-valsartan or by racemic valsartan.
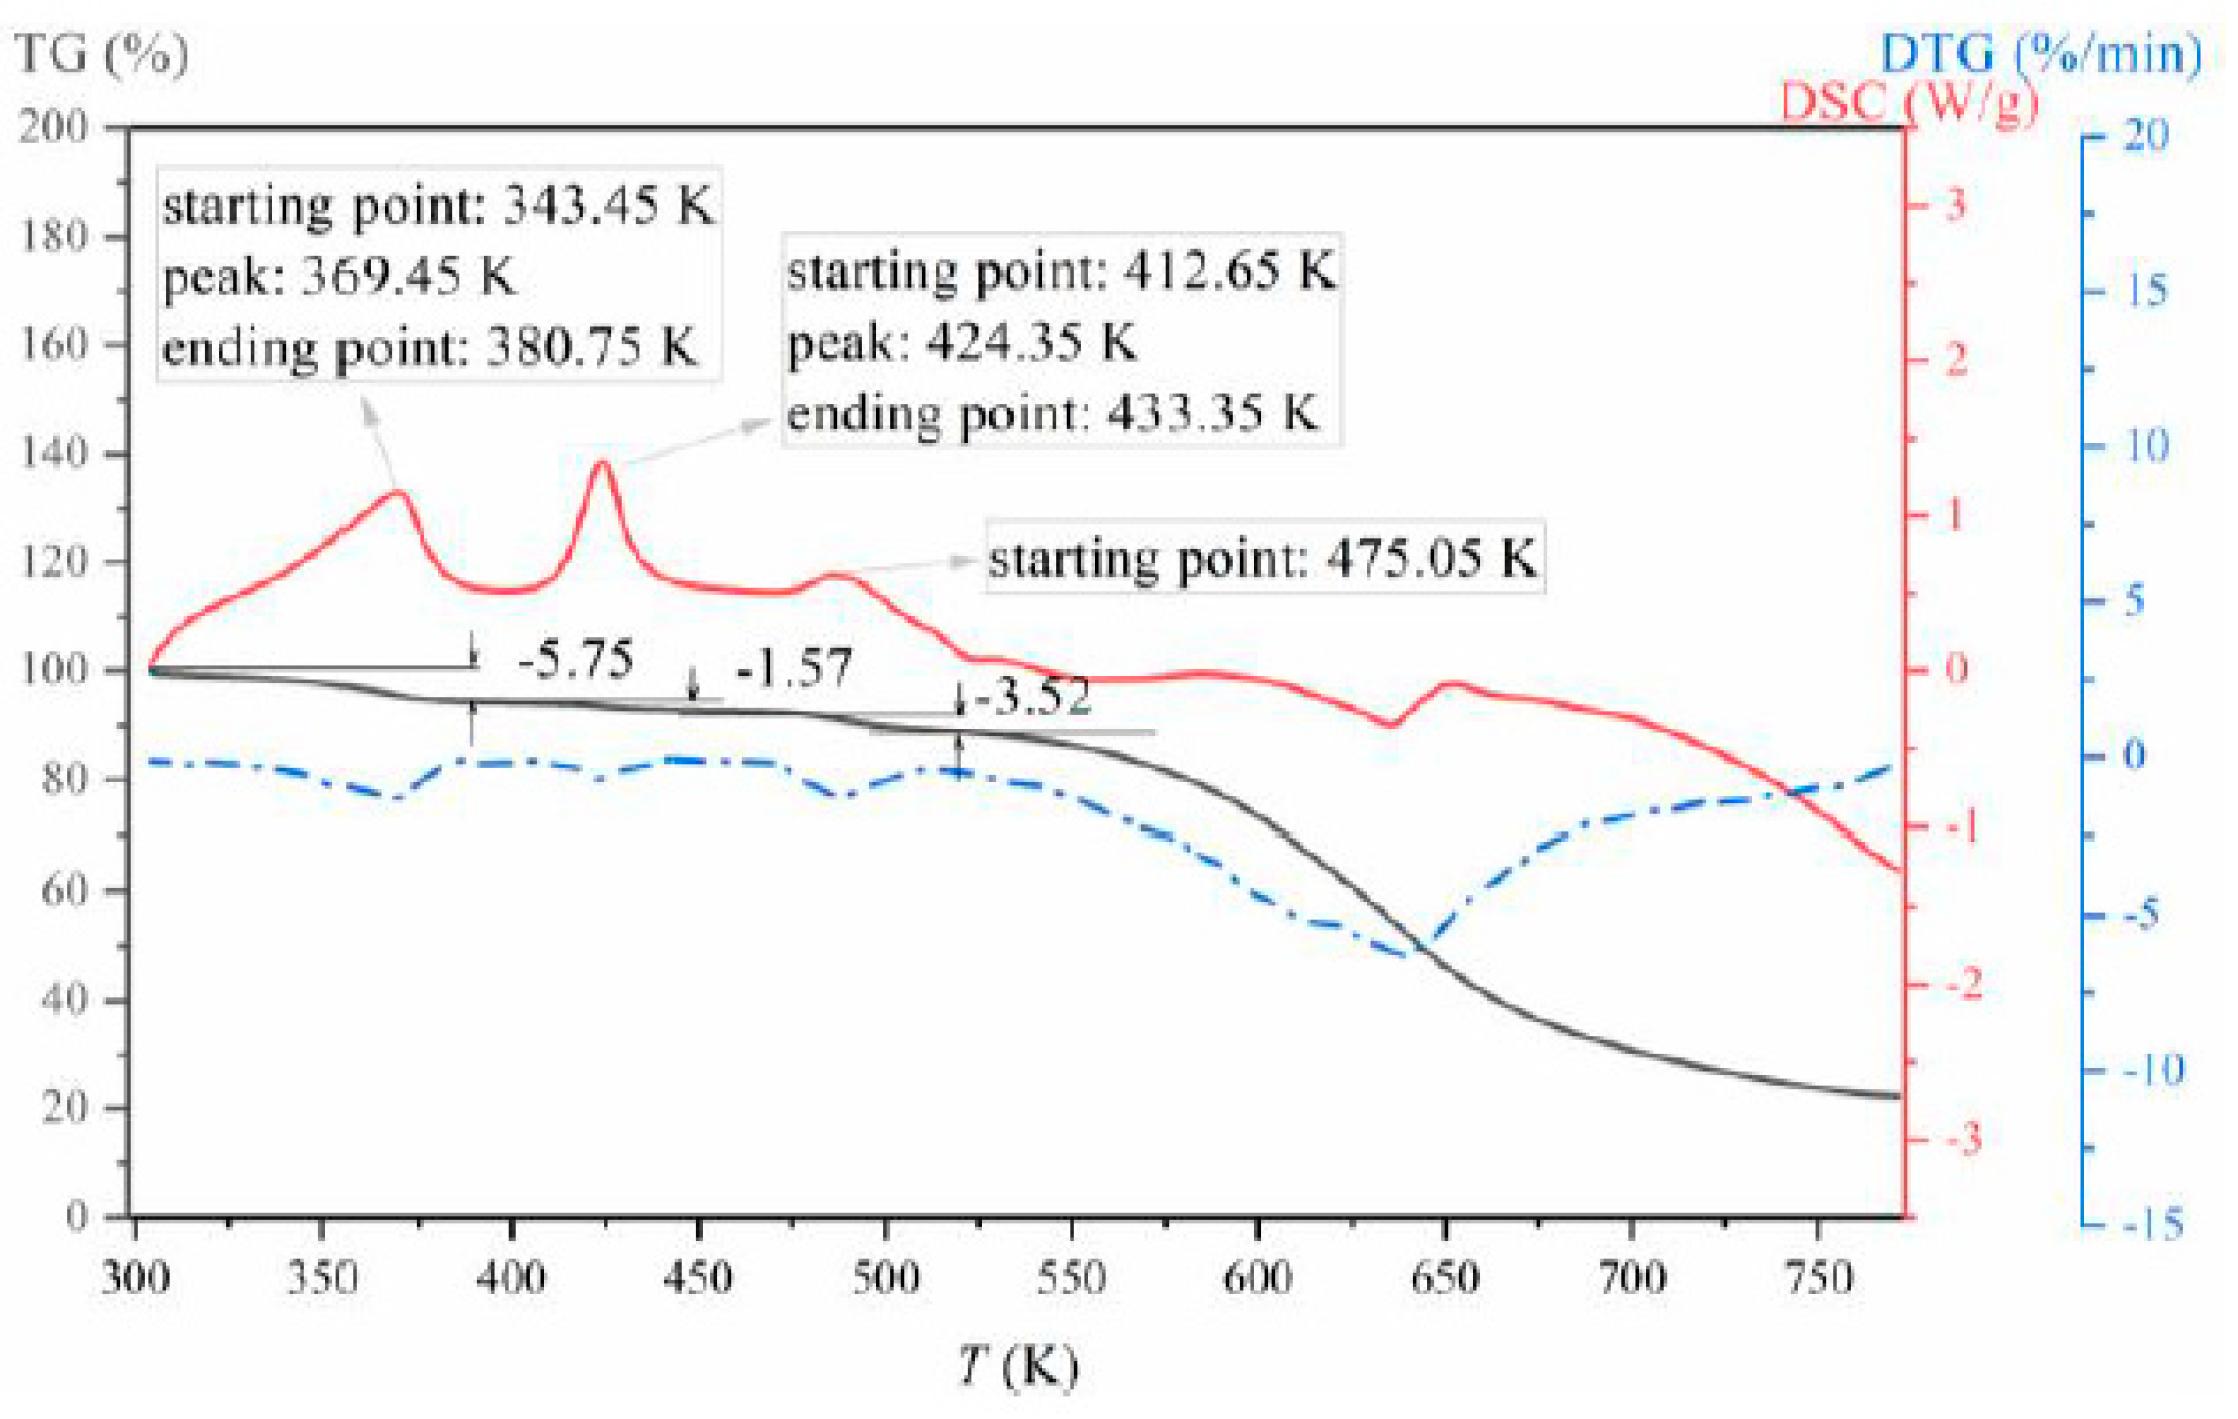
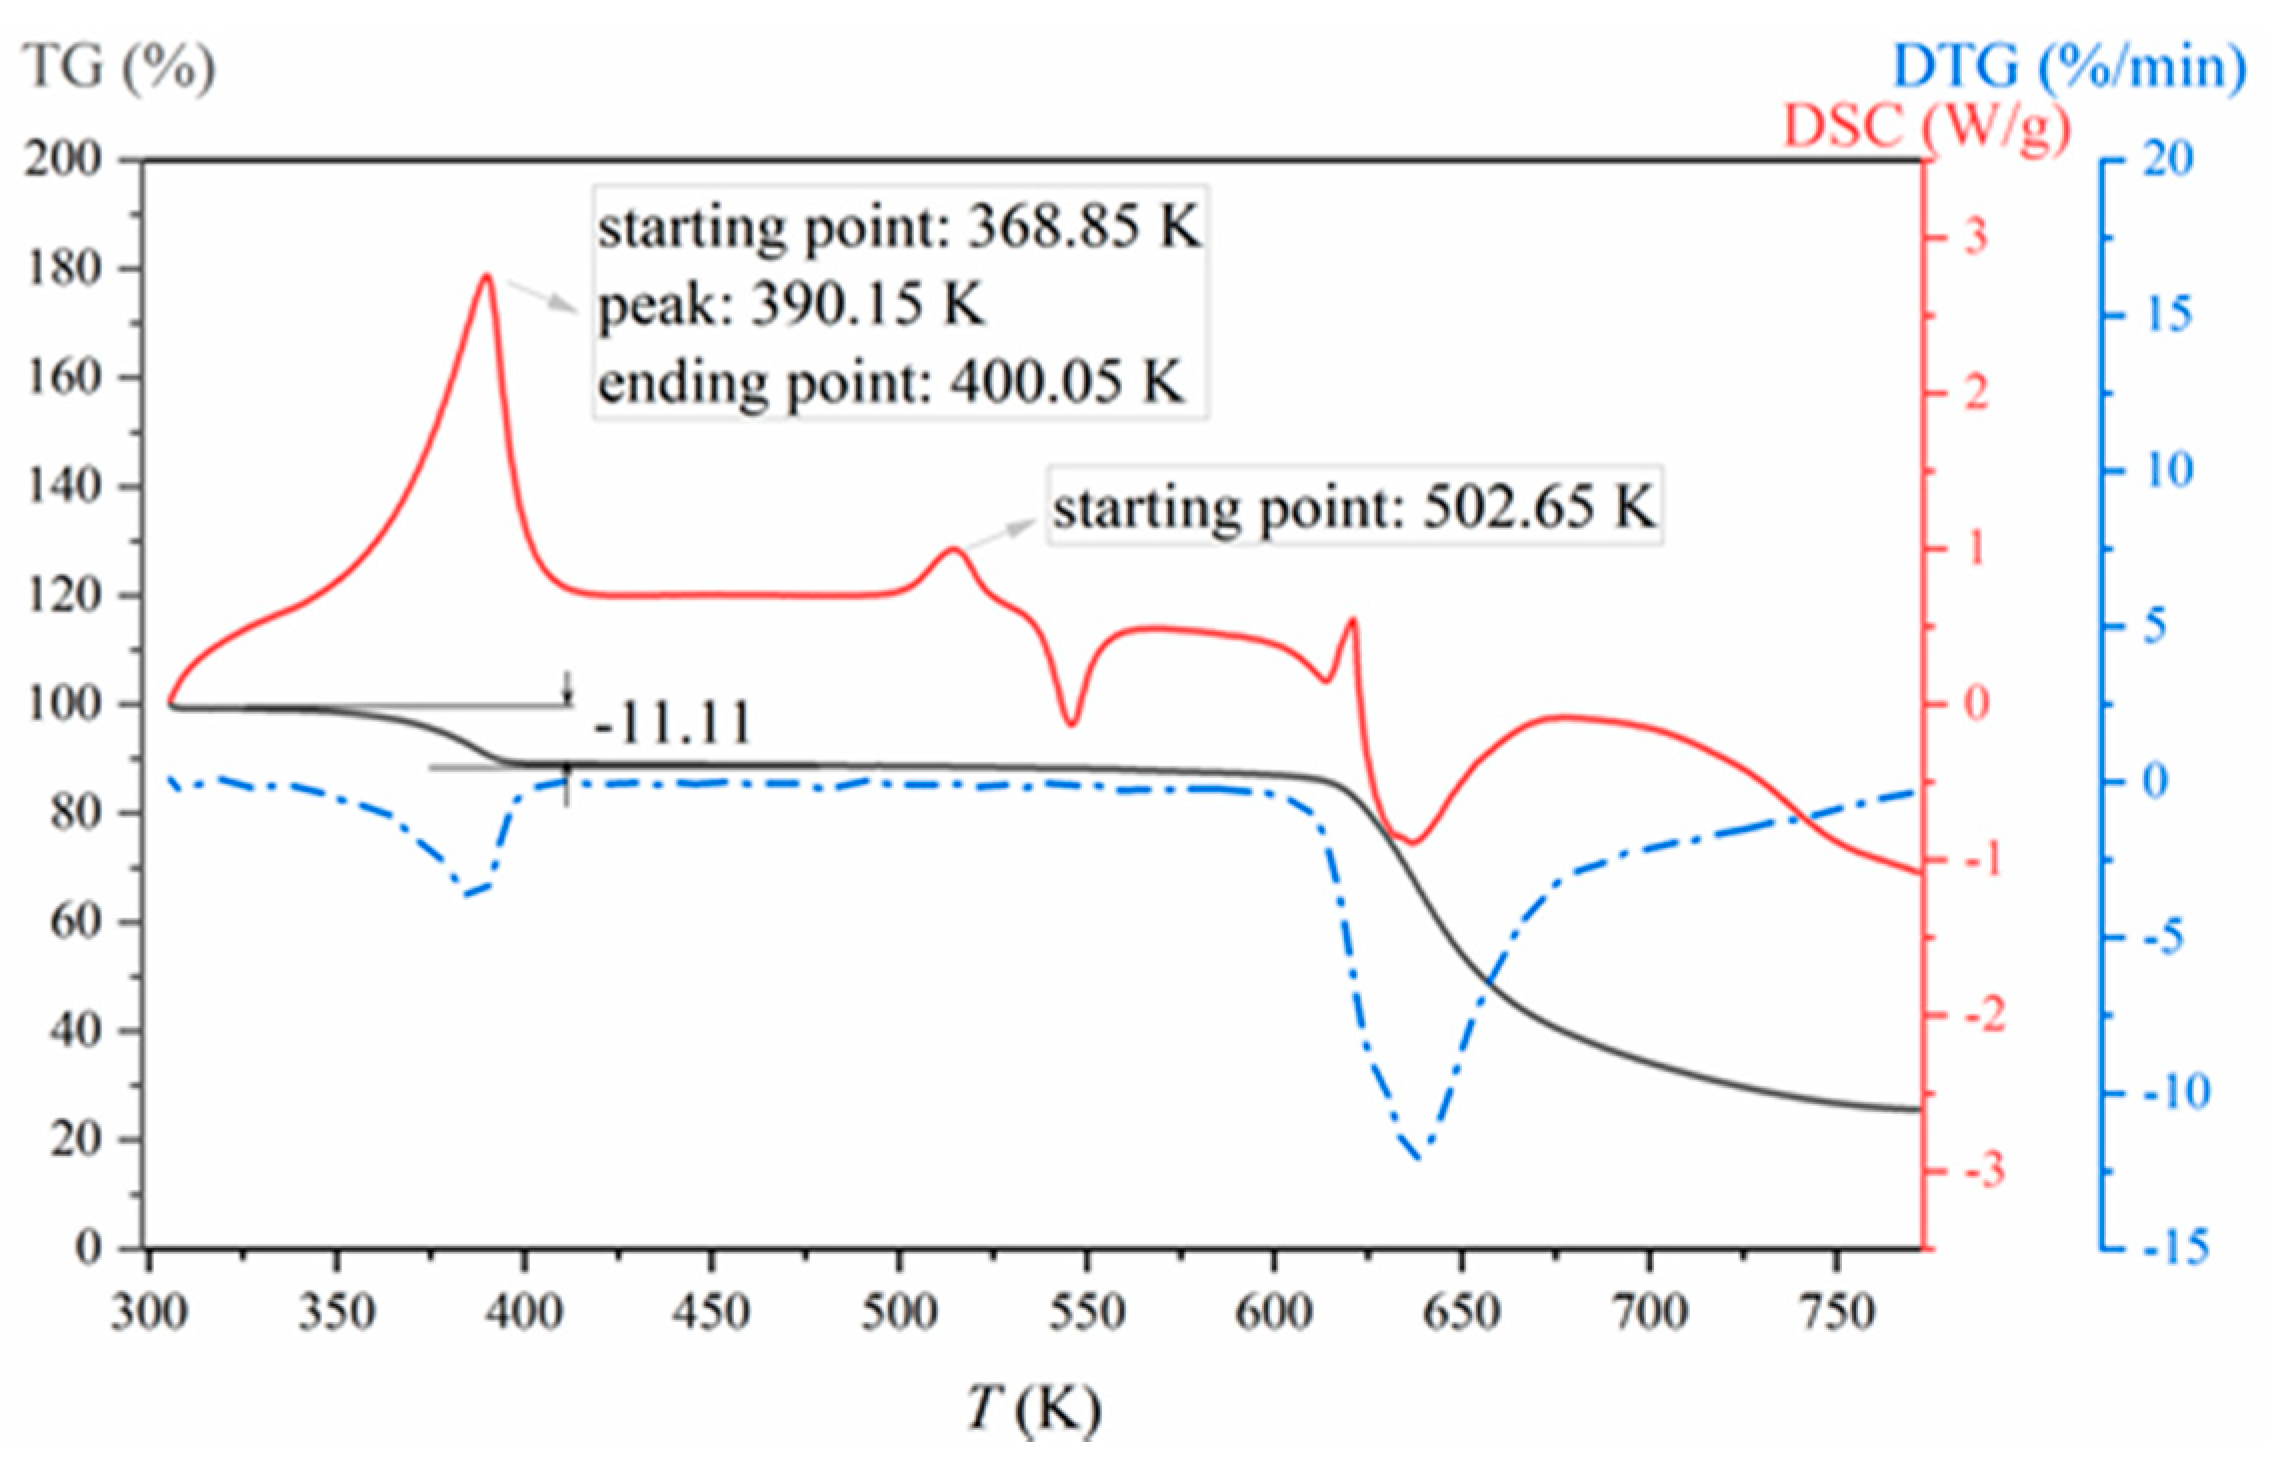
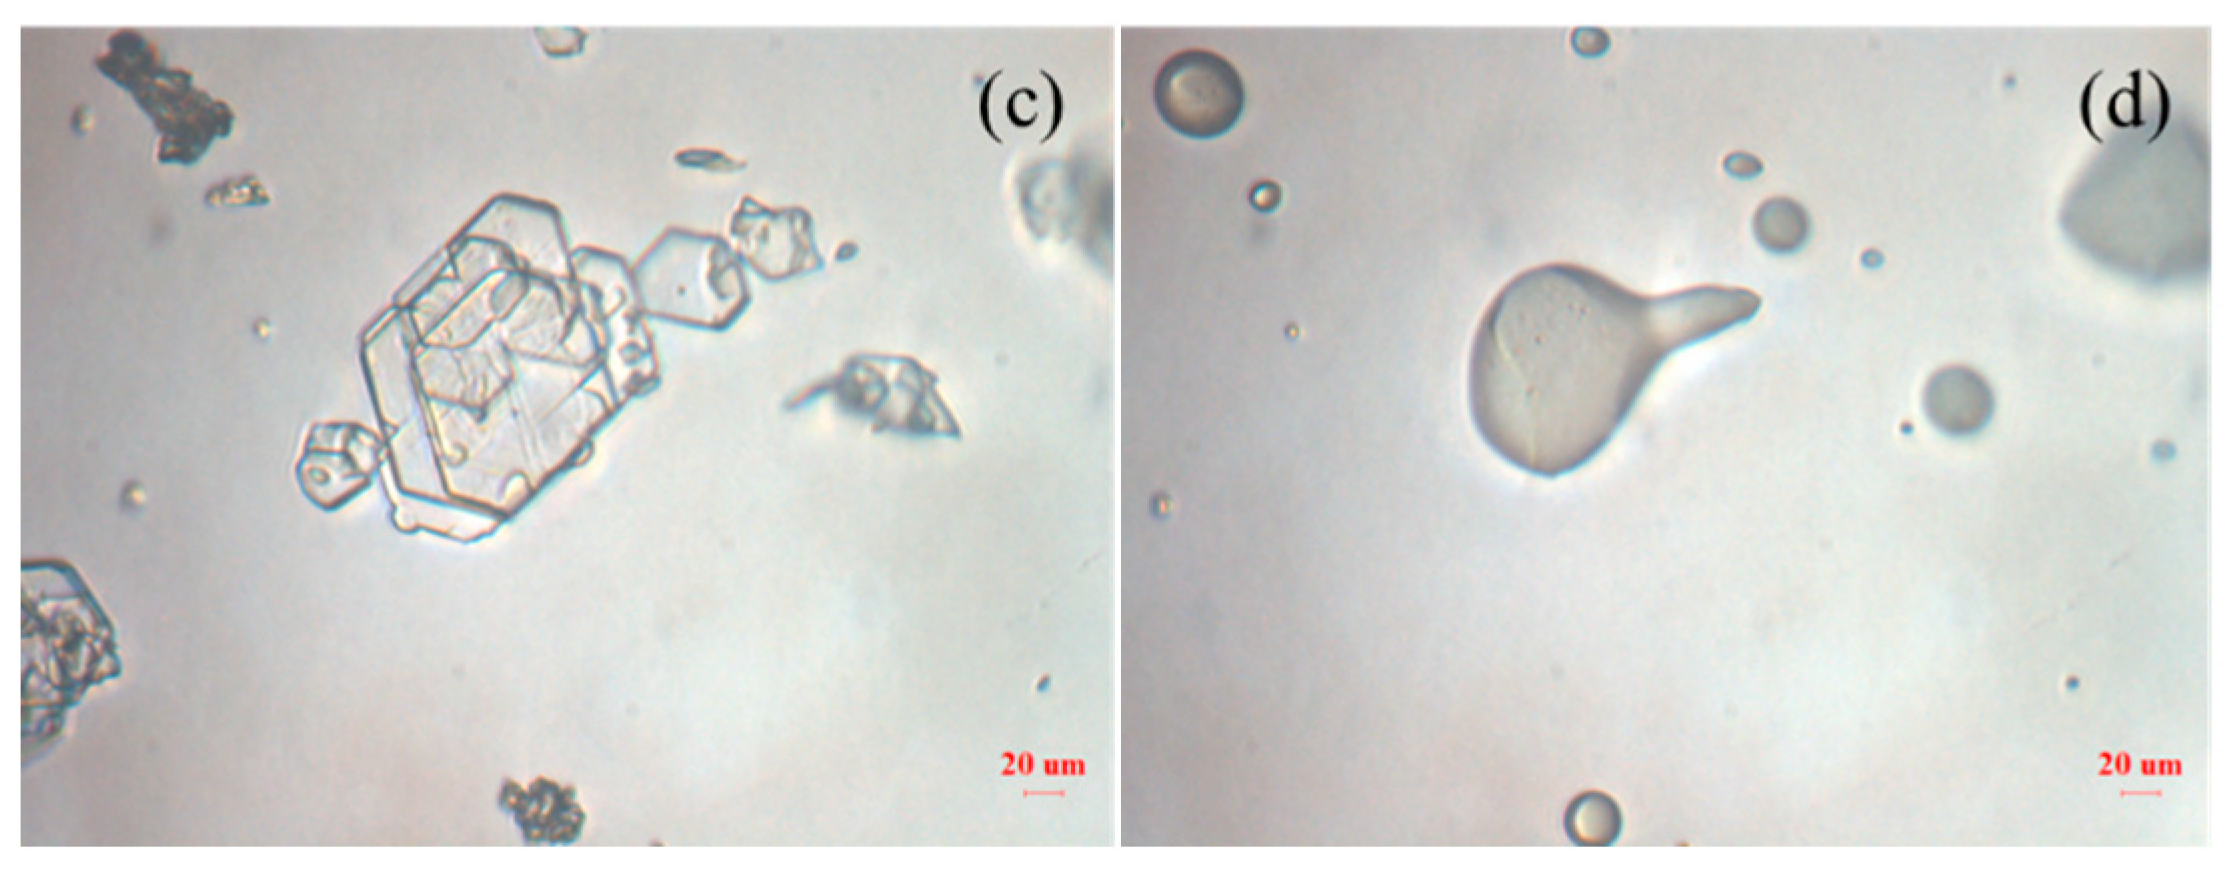
The DSC curve (red color), TG curve (black color) and DTG curve (blue color) of LCZ696 obtained from the experiment (i.e., Solid I), as well as Solid II, are shown as Figure 6 and Figure 7. It can be concluded that LCZ696 has two significantly endothermic peaks on the DSC curve before decomposing, which is consistent with literature report [23]. In the heating process, it can be observed that LCZ696 firstly lost the weight of 5.75% at about 343.45 K (equivalent to two water molecules). Then it lost the weight of 1.57% (equivalent to one half water molecules), coincident with the onset of melting 412.65 K. Images captured during the experiment of hot stage at T = 298.15 K, 369.15 K, 390.15 K and 416.15 K are shown as Figure 8. It is clear that no changes occurred on the crystal morphology of LCZ696 after the water loss in the first step. When T = 416.15 K, close to the measured onset of the melting temperature, the crystal began to melt and lost its original appearance, which also demonstrated that the second endothermic peak of DSC, rather than the first endothermic peak, was the melting peak. As shown in Figure 7, Solid II has two weight loss peaks from the TG curve and DTG curve firstly. It lost the weight of 11.11% before decomposing, coincident with the onset of melting 368.85 K. It can be speculated that Solid II was solvate or hydrate.
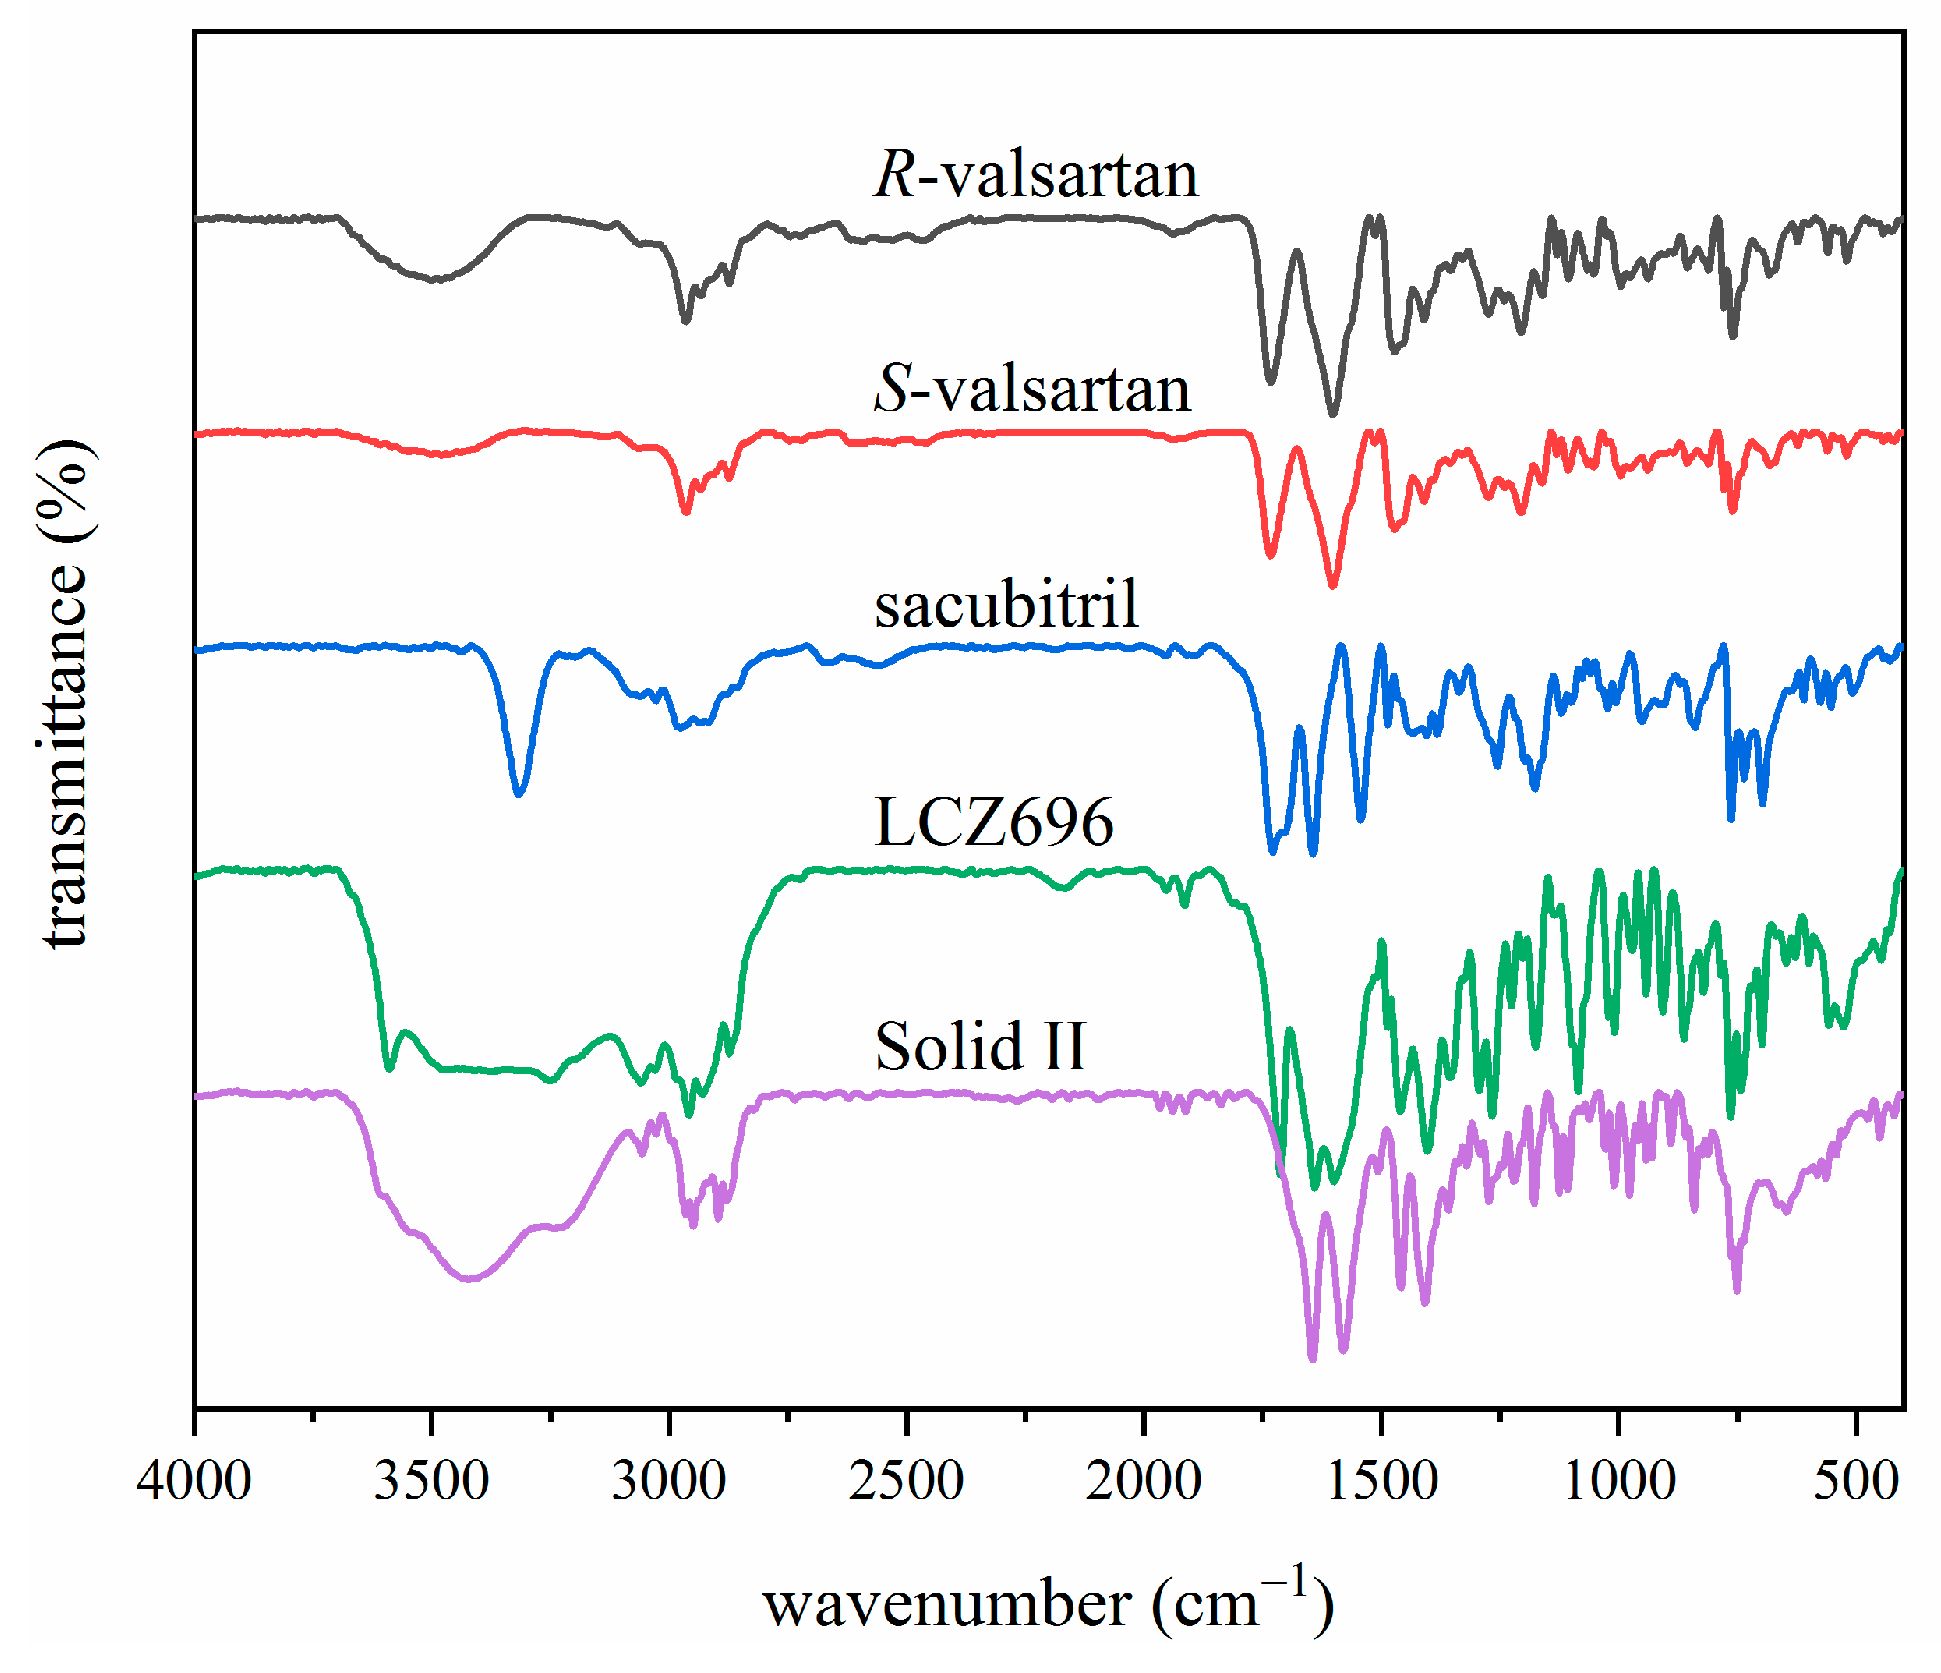
S-valsartan, R-valsartan, sacubitril, LCZ696 and Solid II in solid form were analyzed by ATR-FTIR, as shown in Figure 9. The trace labeled as LCZ696 is solid I obtained from the experiment. It can be seen that the IR spectrum of LCZ696 is significantly different from that of S-valsartan, sacubitril and Solid II, which can be distinguished by the characteristic peaks with S-valsartan and sacubitril. For example, the amide νNH band of valsartan and sacubitril exhibit peaks in the 3342~3500 cm−1 region and at 3324 cm−1, respectively. But in the ATR-FTIR spectra of LCZ696, the peak regions of amide νNH band has changed due to the formation of hydrogen bonds between tetrazole rings of valsartan and the amide NH of the sacubitril molecule [20]. In addition, the tetrazole ring also forms hydrogen bonds with water. In addition, in the 1500–1800 cm−1 region, compared with valsartan and sacubitril which have characteristics peaks at 1605, 1737, 1541, 1643, and 1726 cm−1, LCZ696 only shows characteristics peaks at 1595, 1639 and 1714 cm−1 in the same range. It is considered that all these changes in the spectroscopy could contributed to the hydrogen bonds and coordination bonds involved in crystal formation between valsartan and sacubitril.
It can be concluded that LCZ696 was prepared successfully by S-valsartan, sacubitril and sodium hydroxide aqueous solution under the experimental conditions in this paper. While S-valsartan was replaced by R-valsartan or racemic valsartan, no formation of LCZ696 was observed during the experiments. In addition, some unknown substance was formed when S-valsartan was replaced by racemic valsartan, which was different from what was described in the literature [23].

3.2. ATR-FTIR Model Building

S-valsartan, sacubitril, and LCZ696 in acetone and in acetone with sodium hydroxide aqueous solution, whose concentration and amount were the same as the experiments of co-crystallization of LCZ696, were separately analyzed by in situ ATR-FTIR, as shown in Figure 10. The solutions used to construct the correlation plot was independent samples. Specifically in Figure 10, the concentration of S-valsartan in ‘S-valsartan (acetone)’ and ‘S-valsartan (acetone + NaOH + H2O)’ were both 0.10 g·mL−1; the concentration of sacubitril in ‘sacubitril (acetone)’ and ‘sacubitril (acetone + NaOH + H2O)’ were both 0.10 g·mL−1; the solutions of ‘LCZ696 (acetone)’ and ‘LCZ696 (acetone + NaOH + H2O)’ were both the state of suspension; in addition, the concentration of (NaOH + H2O) in ‘S-valsartan (acetone + NaOH + H2O)’, ‘sacubitril (acetone + NaOH + H2O)’ and ‘LCZ696 (acetone + NaOH + H2O)’ were the same with the intial (NaOH + H2O) concentration of the co-crystallization process. It can be seen that ATR-FTIR spectra of S-valsartan, sacubitril were different from LCZ696 in acetone and acetone with sodium hydroxide aqueous solution. In addition, because LCZ696 was nearly insoluble in acetone, its ATR-FTIR spectra were consistent with the solvent peak. The co-crystallization process could be monitored via real-time characterization of the variation of concentration of valsartan or sacubitril. But during the co-crystallization, there was some sodium hydroxide and water in the solution, which might affect the measurement of valsartan or sacubitril. In order to simplify the experiment, a small quantity of sodium hydroxide and water much less than valsartan and sacubitril was used in the experiment to ensure that they were consumed completely and made as little impact as possible to the monitor of the process.
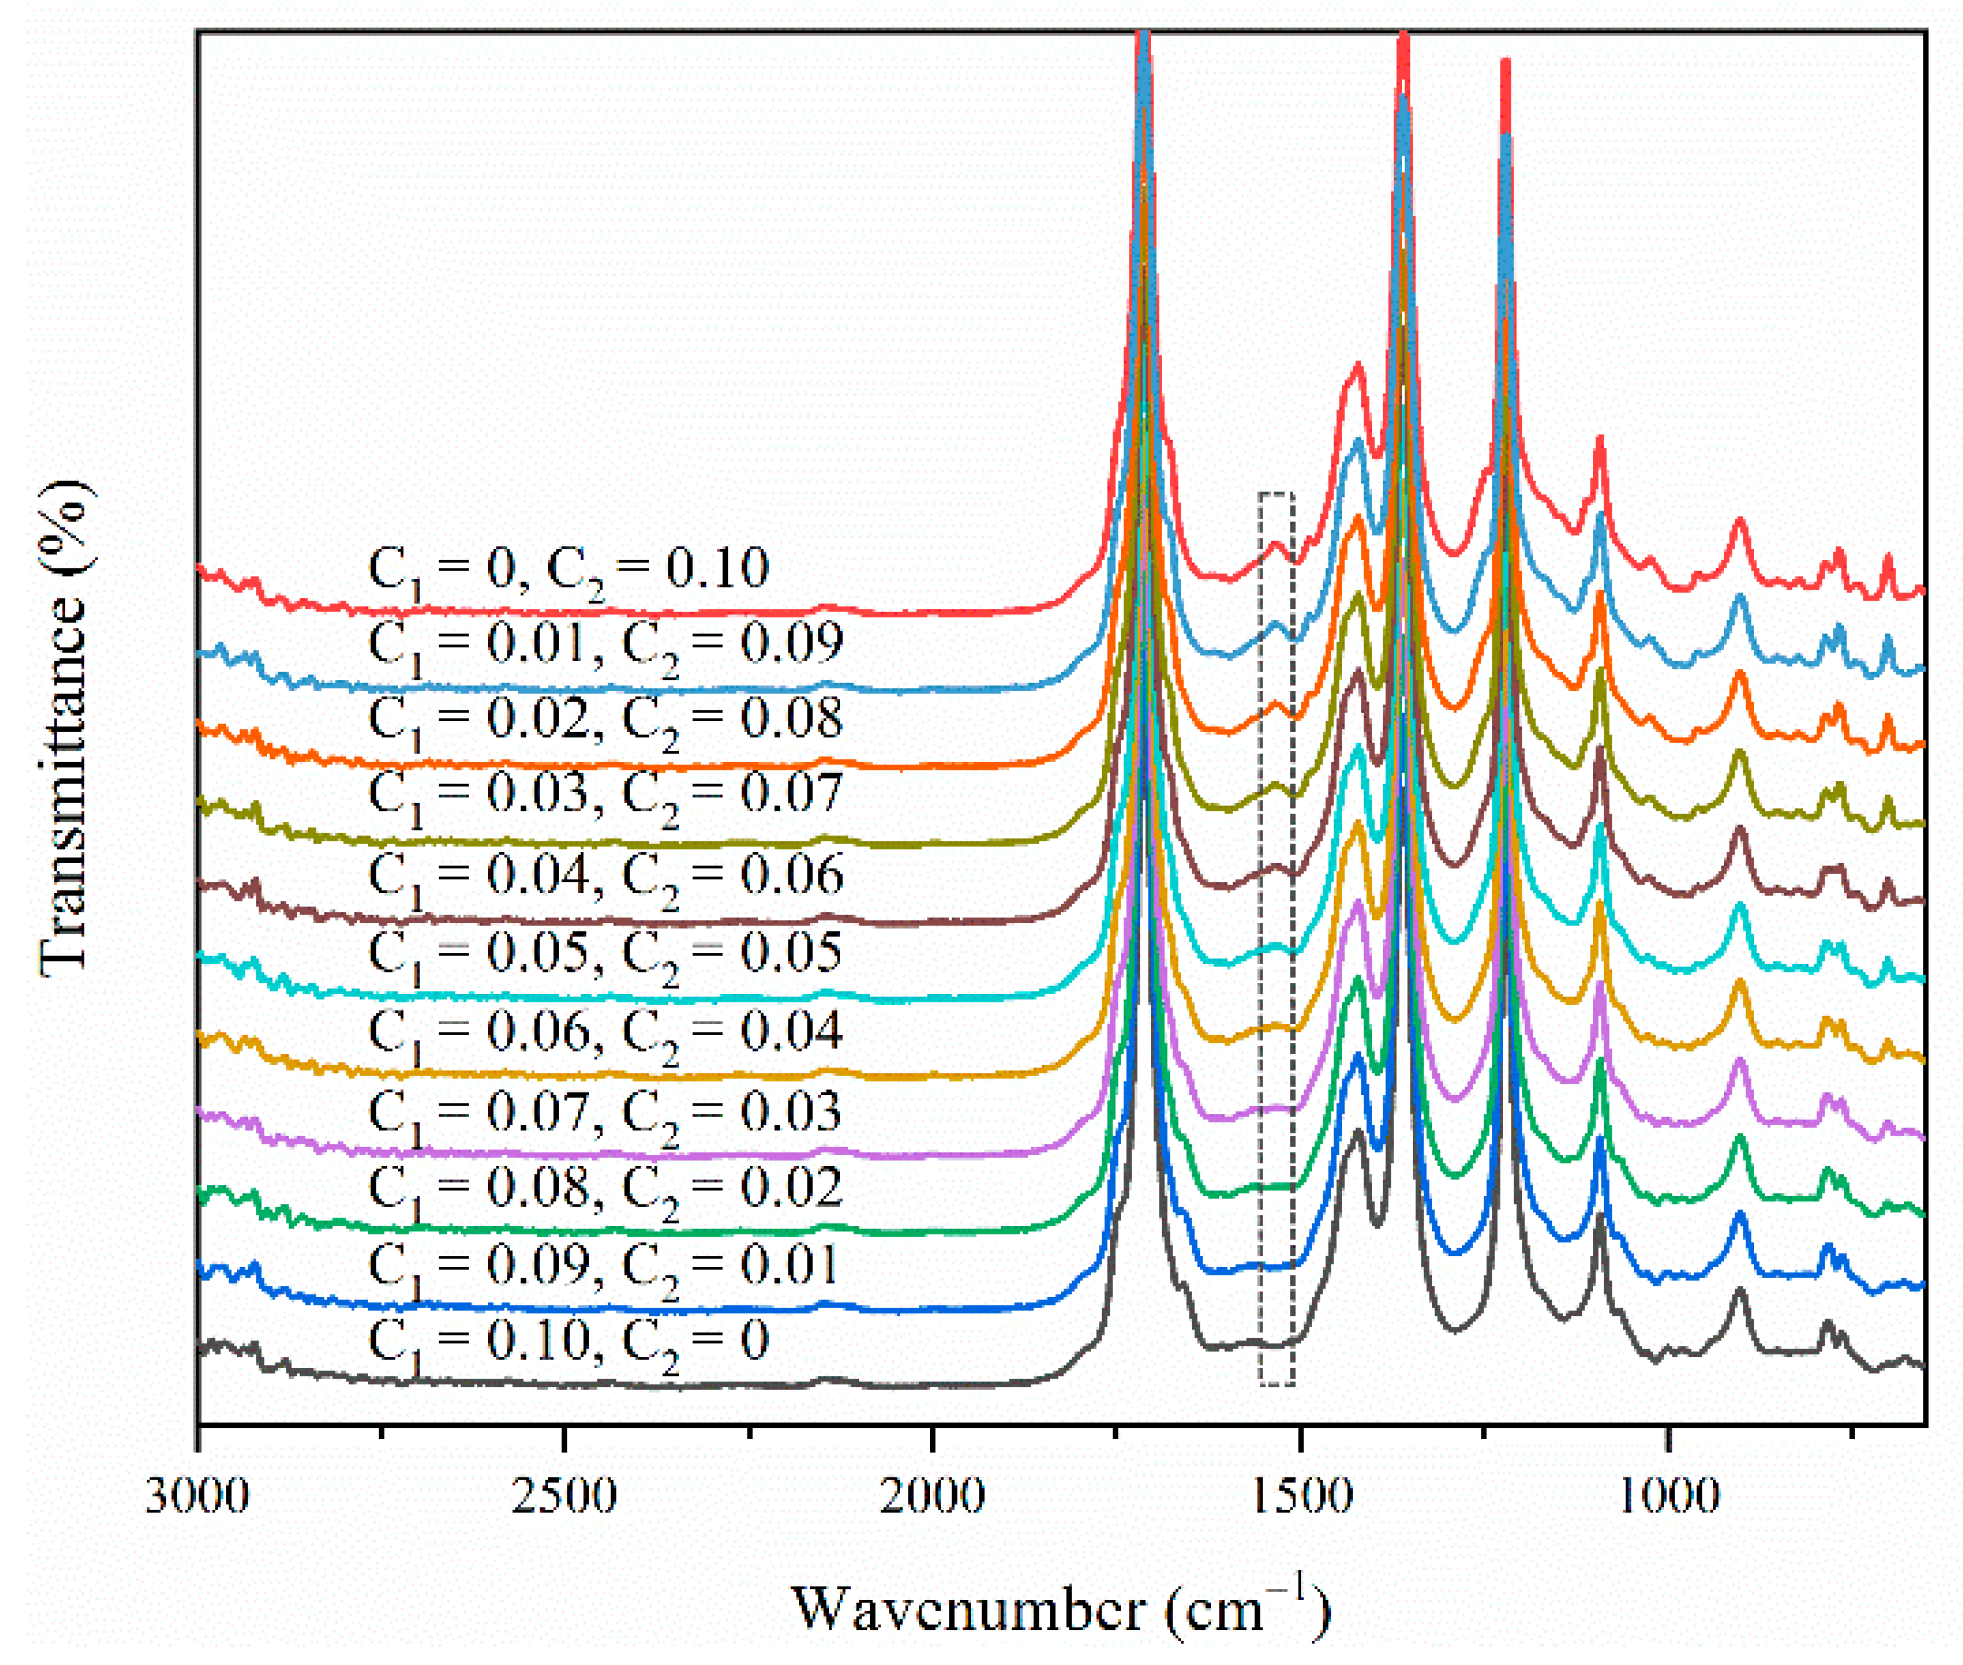
Eleven groups of mixed solutions of sacubitril and S-valsartan dissolved in acetone by varying proportions were prepared for constructing the calibration model, which were analyzed with ATR-FTIR spectroscopy immediately at 298.15 K, as shown in Figure 11. Each group of the concentration of sacubitril is in the range of 0~0.1 g·mL−1 with the gradient interval of 0.01 g·mL−1, so is valsartan. And the total concentration of each group is 0.1 g·mL−1. Characteristic peaks were selected to build the concentration prediction model. As listed in Figure 11 and Figure 12, the ATR-FTIR peak at 1536 cm−1 was chosen as characteristic peak for sacubitril to monitor the variation of its concentration. The R2 of the calibration curve was 0.99837, demonstrating that the experimental results could be analyzed quantitatively by in situ ATR-FTIR spectra.

3.3. In Situ Pat Monitoring

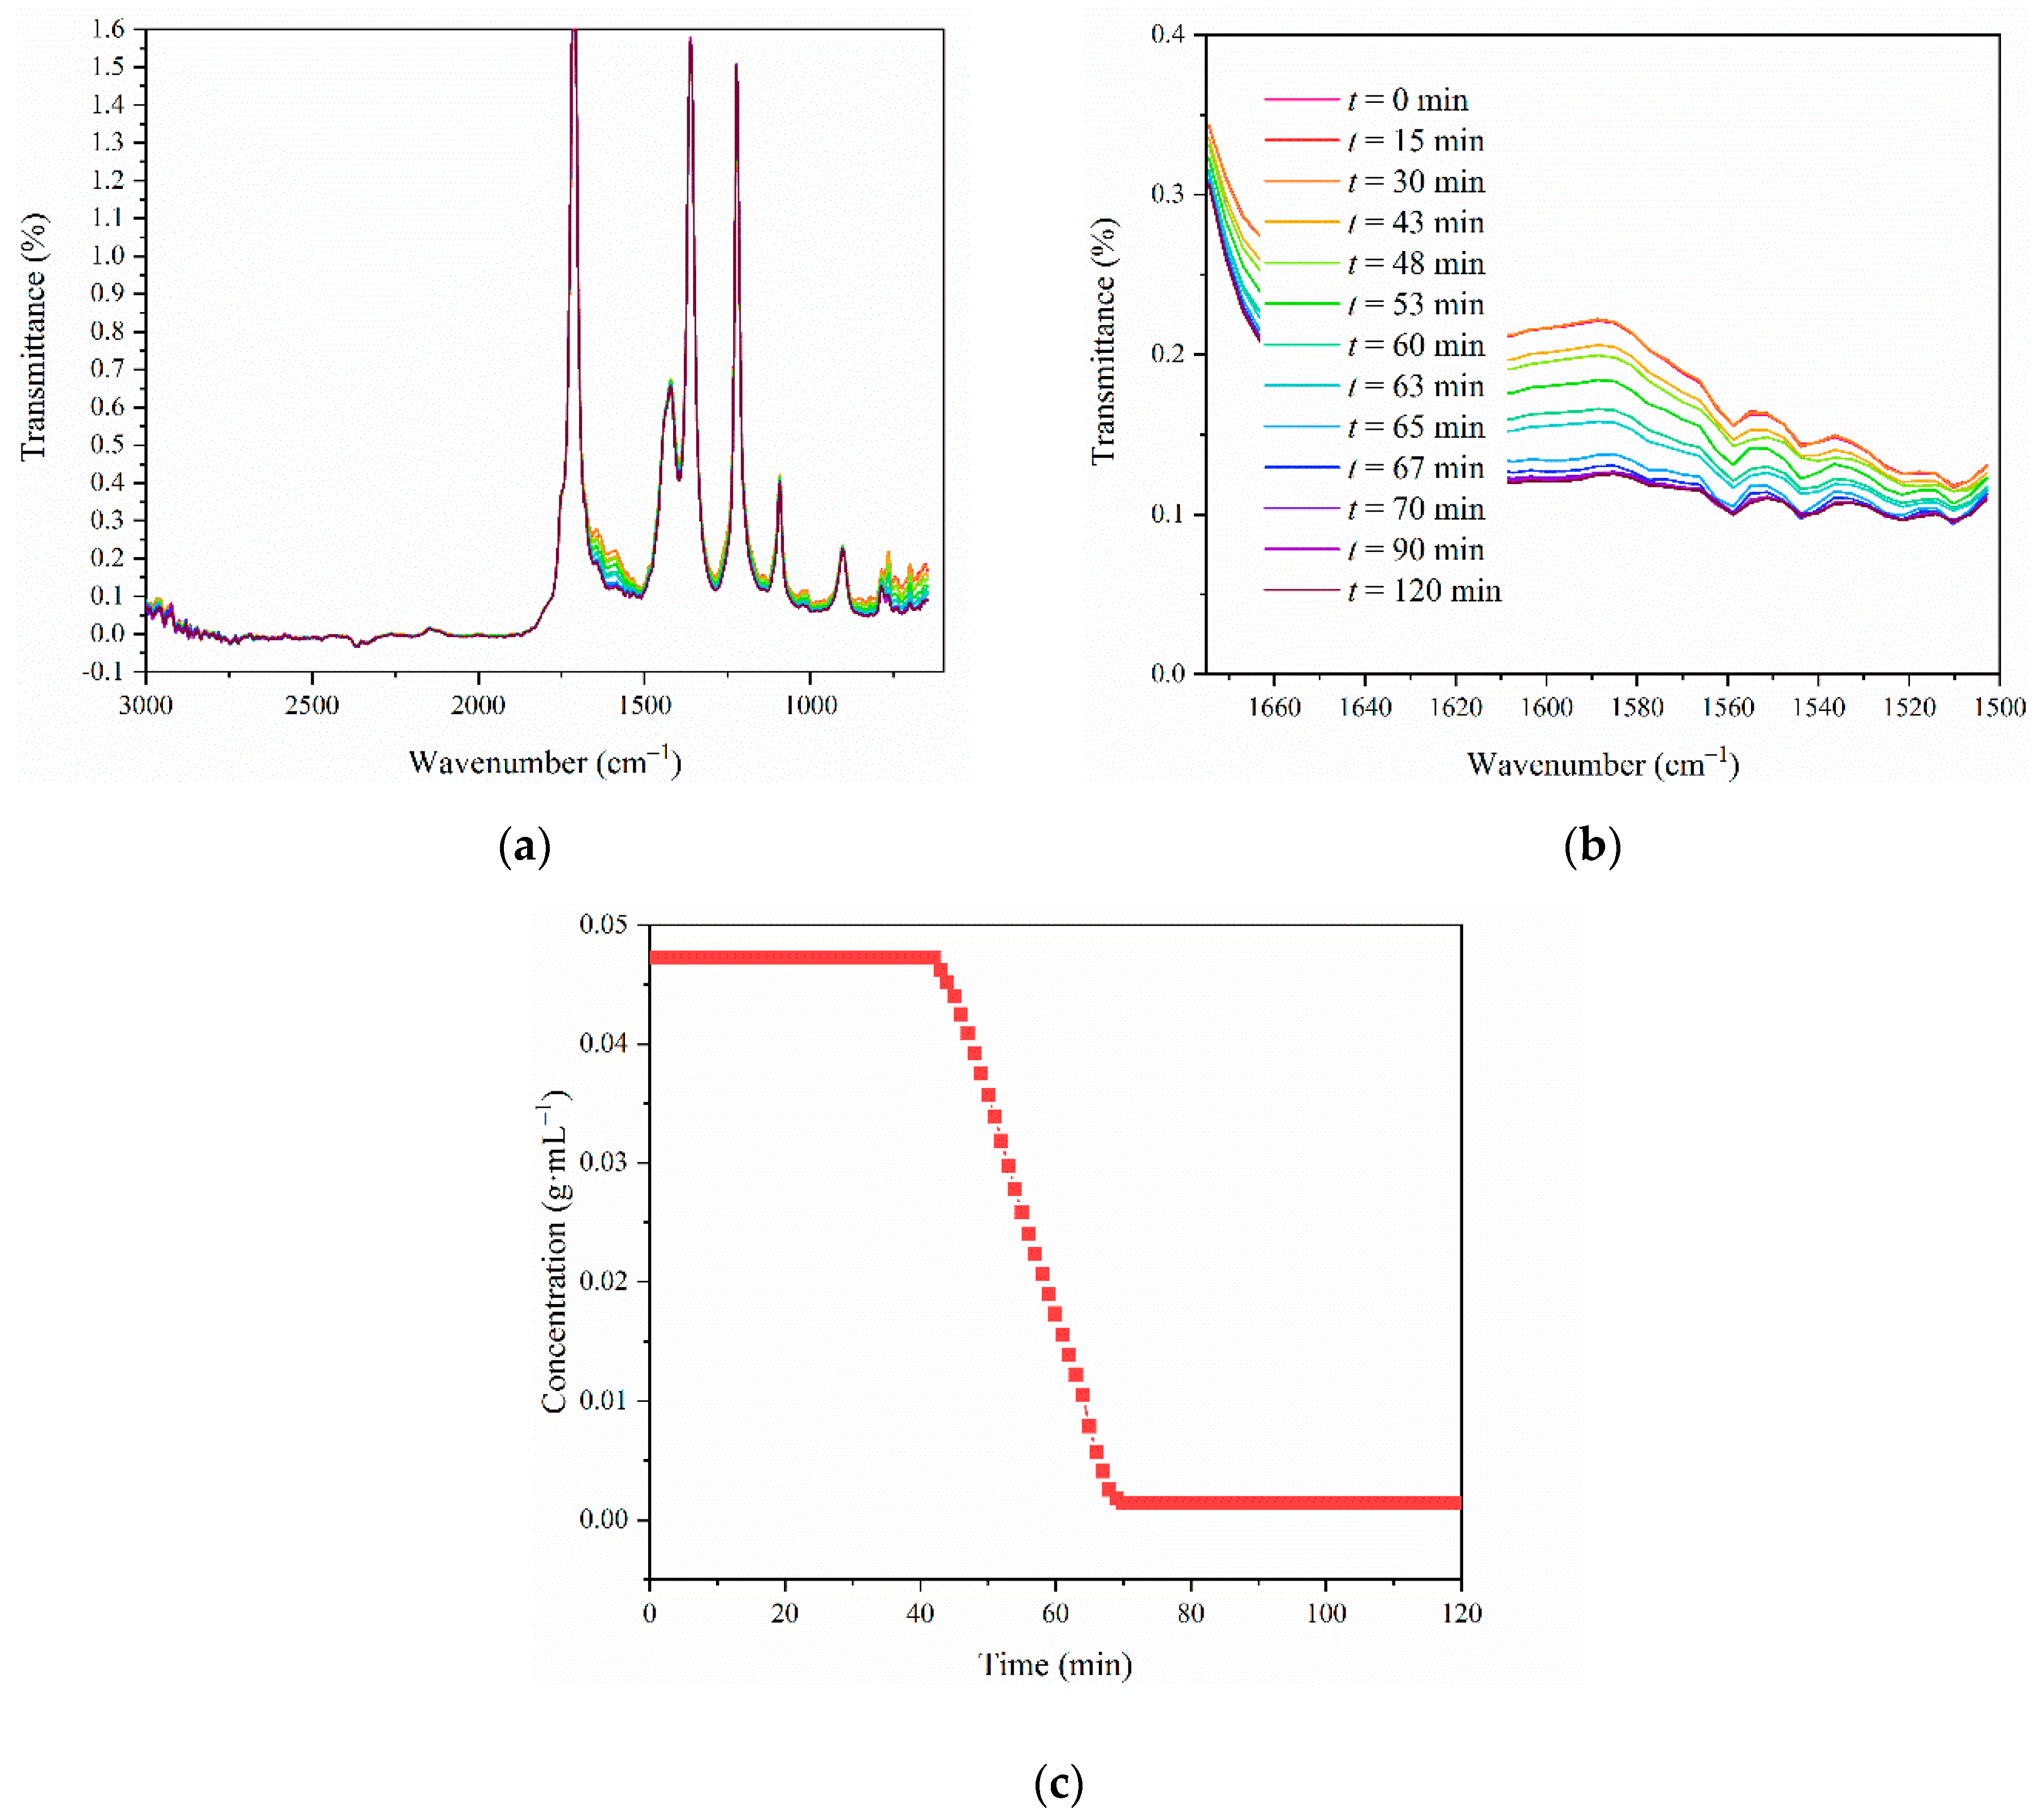
For studying the co-crystallization of LCZ696, in situ monitoring ATR-FTIR was carried out under different experimental conditions in this paper. In situ monitoring ATR-FTIR spectra of the co-crystallization were collected over a 60 s interval. When the stirrer speed was 400 rpm and the quantity of seed crystals was 0 g, the ATR-FTIR spectra collected at t = 0, 15, 30, 43, 48, 53, 60, 63, 65, 67, 70, 90 and 120 min were selected to show the changing process of the spectra, as shown in Figure 13. From Figure 13a,b, it can be concluded that ATR-FTIR spectra of the solution changed gradually as the experiment went on. The concentration variation of sacubitril during the co-crystallization (Figure 13c) was also consistent with the spectral variation. t = 0 min was the starting point that there was only completely dissolved S-valsartan and sacubitril in the solution, followed by the addition of sodium hydroxide and water. At t = 0, 15 and 30 min, ATR-FTIR spectra was unchanged, which demonstrated that co-crystallization didn’t start. At t = 43 min, peaks in the region of 1675~1500 cm−1 started to decrease, which were the overtone and combination bands of NH, CO-NH and C=N, C=O, respectively. In addition, peak at 1536 cm−1 chosen as the characteristic peak for sacubitril also changed due to the progress of the reaction. From t = 70 min to t = 120 min, the ATR-FTIR spectra didn’t change any more, which can be concluded that the co-crystallization reached the ending point.
Digital images were also captured by the two-dimensional imaging system at t = 0, 43, 48, 53, 60, 63, 65 and 70 min during the crystallization, as shown in Figure 14. Combined ATR-FTIR spectra with the images, it could be concluded that nucleation formation of LCZ696 happened at t = 43 min. Next it comes the growth phase of the crystal. At 130 min, the solution reached an equilibrium, indicating the growth velocity of crystal was very fast compared with the nucleation formation. As can be seen from the picture, LCZ696 is morphologically composed of very thin hexagonal plates, which can speculate that the crystal of LCZ696 grew in two dimensions.

3.4. Kinetics of the Co-Crystallization of LCZ696

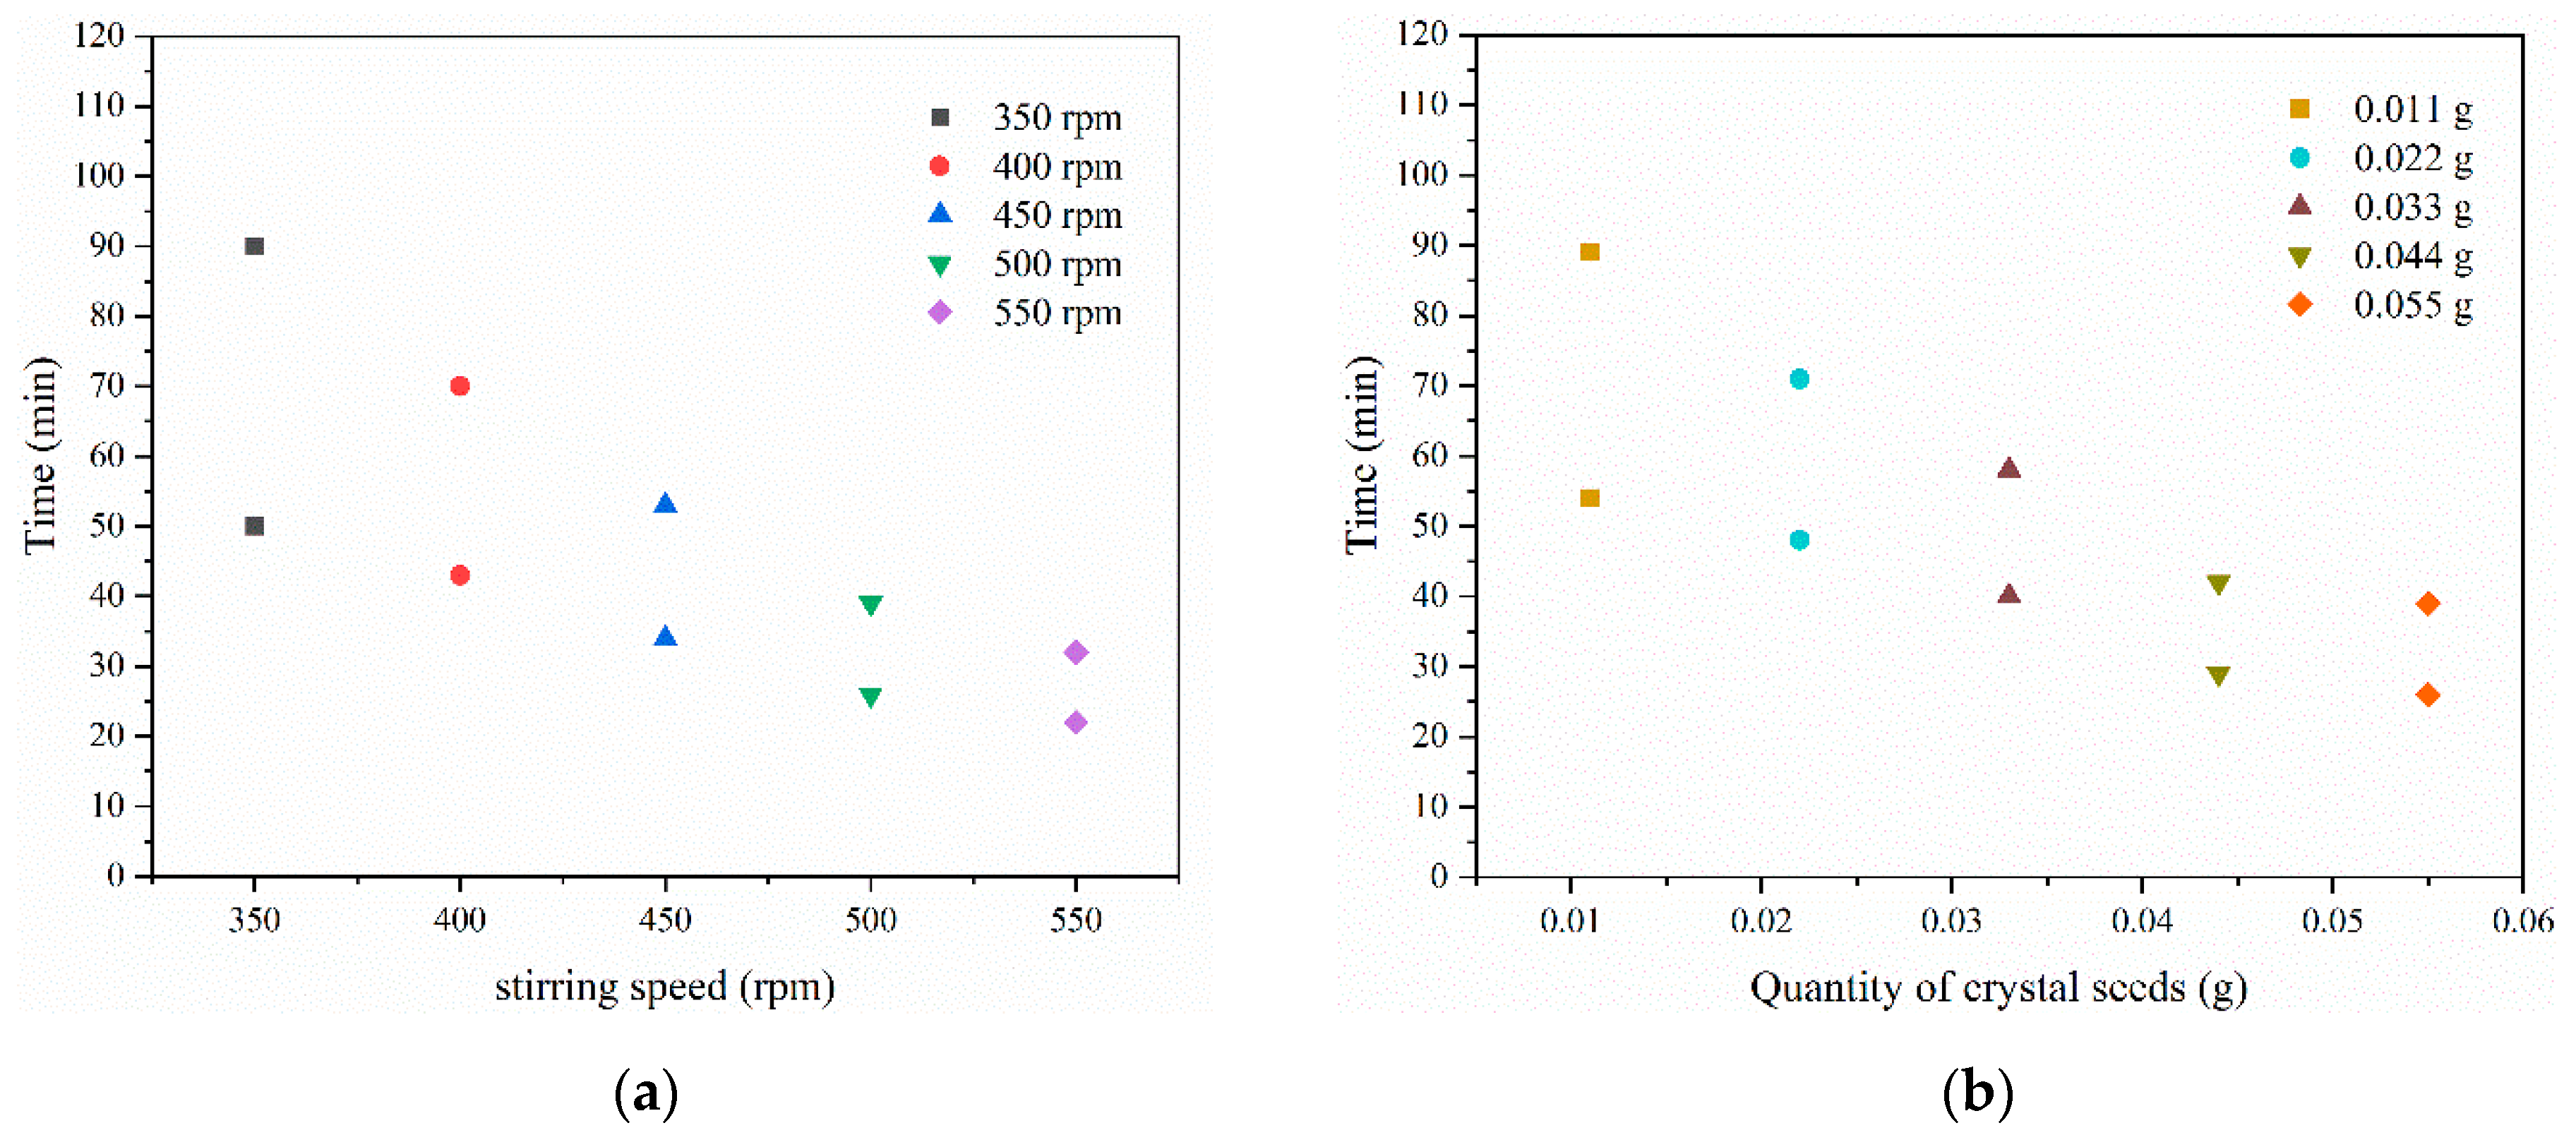
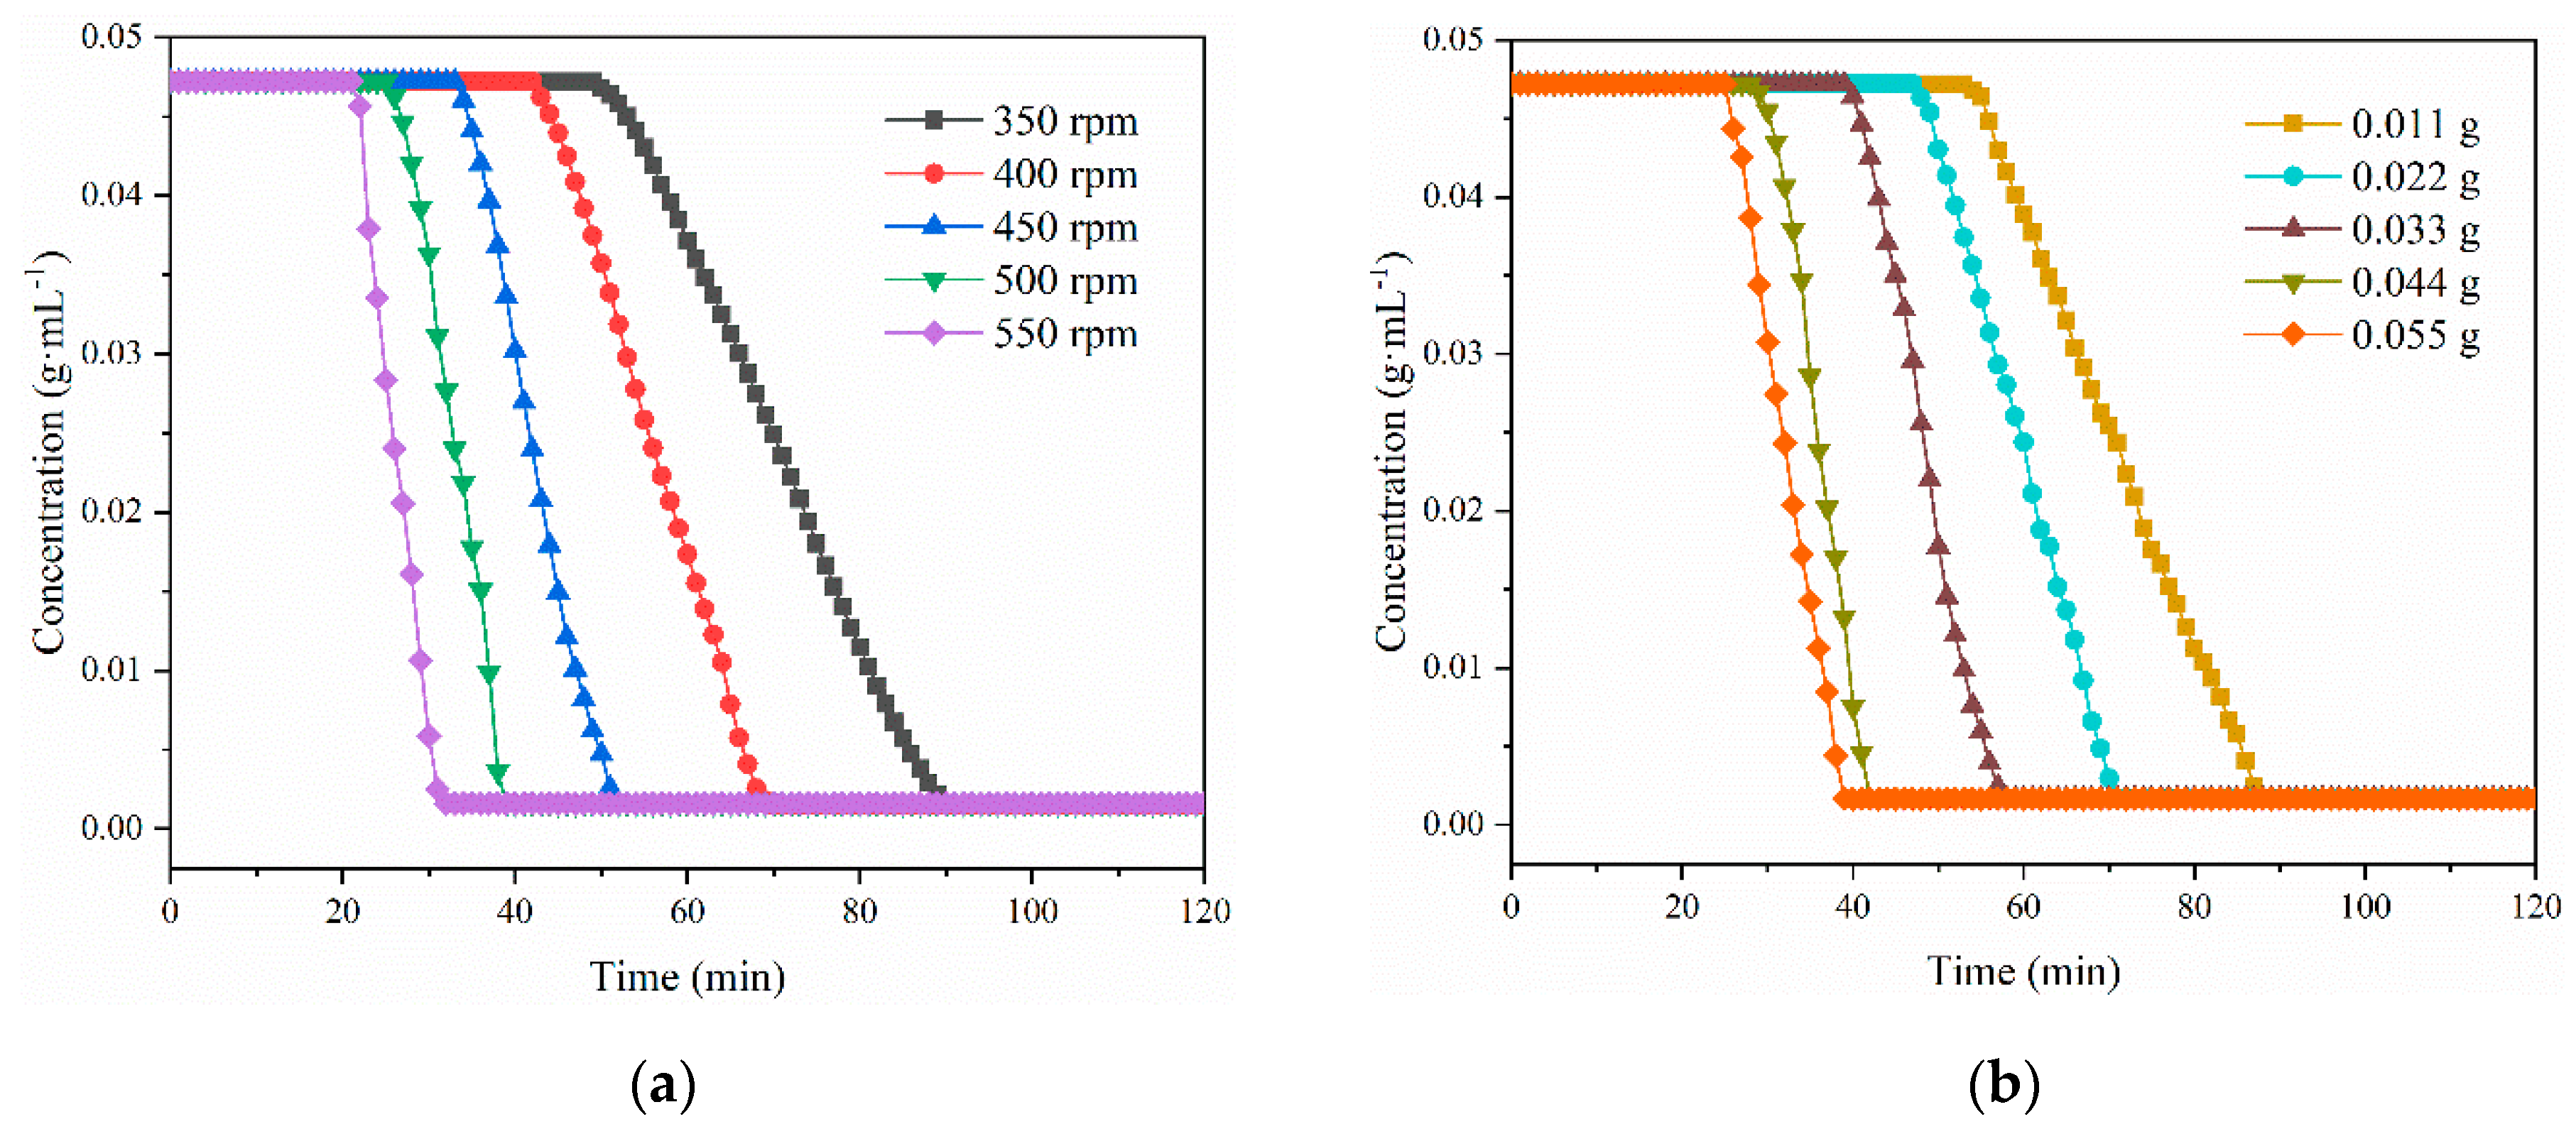
To study the kinetics of the co-crystallization of LCZ696, the stirrer speed of 350, 400, 450, 500, and 550 rpm were employed during the experiments. As listed in Figure 15a and Figure 16a, induction time and transformation time of the co-crystallization process of different stirrer speed were decreased as stirrer speed was increased. Induction time was defined as the time needed from the starting experiment point until the crystal came into view observed by the two-dimensional imaging system. Similarly, transformation time was defined as the time from the starting experiment point until sodium hydroxide and water were consumed completely. For example, when the stirrer speed was 350 rpm, induction time and transformation time were 50 min and 90 min, respectively. When the stirrer speed was 550 rpm, induction time reduced to 22 min and transformation time reduced to 32 min. According to the classic nucleation theory, the increase in stirrer speed can speed up the movement of molecules and reduces the interfacial energy between the solid and liquid phases, resulting in faster rate of nucleation and crystal growth. In addition, it was revealed that if the stirrer speed was less than 200 rpm, LCZ696 couldn’t be acquired.
In addition, the effect of seed crystals was also studied. When t = 15 min from the beginning of the experiment, different masses (0.011 g, 0.022 g, 0.033 g, 0.044 g, and 0.055 g) of seed crystals were added into the solution when the temperature was 298.15 K and the stirrer speed was 400 rpm. The seed crystals did not dissolve completely after being added and then a large number of crystals appeared in the solution. As shown in Figure 15b and Figure 16b, the transformation processes started on quickly as the seed crystals were added. In addition, the induction time and transformation time decreased with the increase of the quantity of seed crystals. For example, when the amount of seed crystals was 0.011 g, the induction time and transformation time were 54 min and 89 min respectively. But when the quantity of seed crystals was 0.055 g, the induction time and transformation time were decreased to 26 min and 39 min, respectively. The addition of seed crystals offered more crystal nucleus for the solution, shortening the nucleation time and the transformation time. It can be concluded that the co-crystallization of LCZ696 was controlled by nucleation. In addition, it can be seen that the induction time and transformation time at a stirring speed of 400 rpm without the addition of seed crystals were slower than that at a stirring speed of 400 rpm with the addition of 0.011 g and 0.022 g seed crystals. Actually, the co-crystallization process of LCZ696 can be regarded as a reactive crystallization. The addition of seed crystals will affect the co-crystallization process of LCZ696 together from two aspects: the nucleation mechanism and chemical equilibrium. Specifically speaking, when the quantity of seed crystals were too little (0.011 g, for instance), chemical equilibrium dominated in the influencing mechanism of the addition of seed crystals, which would increase the induction time.
In order to control the co-crystallization of LCZ696, Johnson-Mehl-Avrami (JMA) equation was used to model the kinetics of the process as follows [44]:
x ( t )   =   1     e x p (   ( K ( t     t ind ) ) n )
where x(t) is the transformation fraction of valsartan and sacubitril at time t; K is nucleation and growth rate dependent constant; tind is the induction time; n is a parameter representing the nucleation mechanism and growth dimension. As listed in Table 1, the value of fitted correlation coefficient R2 were also greater than 0.99, which indicated that JMA equation was suitable in explaining the co-crystallization process. K increased with the increase of stirrer speed and quantity of crystal seeds, consistent with what was observed in the experiment. Values of n that are not integers indicating that this process belongs to heterogeneous nucleation, which involved complex growth mechanism. When n = 1, the growth mode of the crystal belonged to one-dimensional growth and when n = 2 or 3, it belonged to two-dimensional or three-dimensional growth. For this experiment, the values of n were greater than 1 and less than 3, indicating that the crystal of LCZ696 grew in two-dimensional or three-dimensional growth. Combination with the pictures taken by the two-dimensional imaging system, it can be concluded that the crystals of LCZ696 grew in two-dimensional growth [45].

3.5. Effects on Crystal Size Distribution of LCZ696

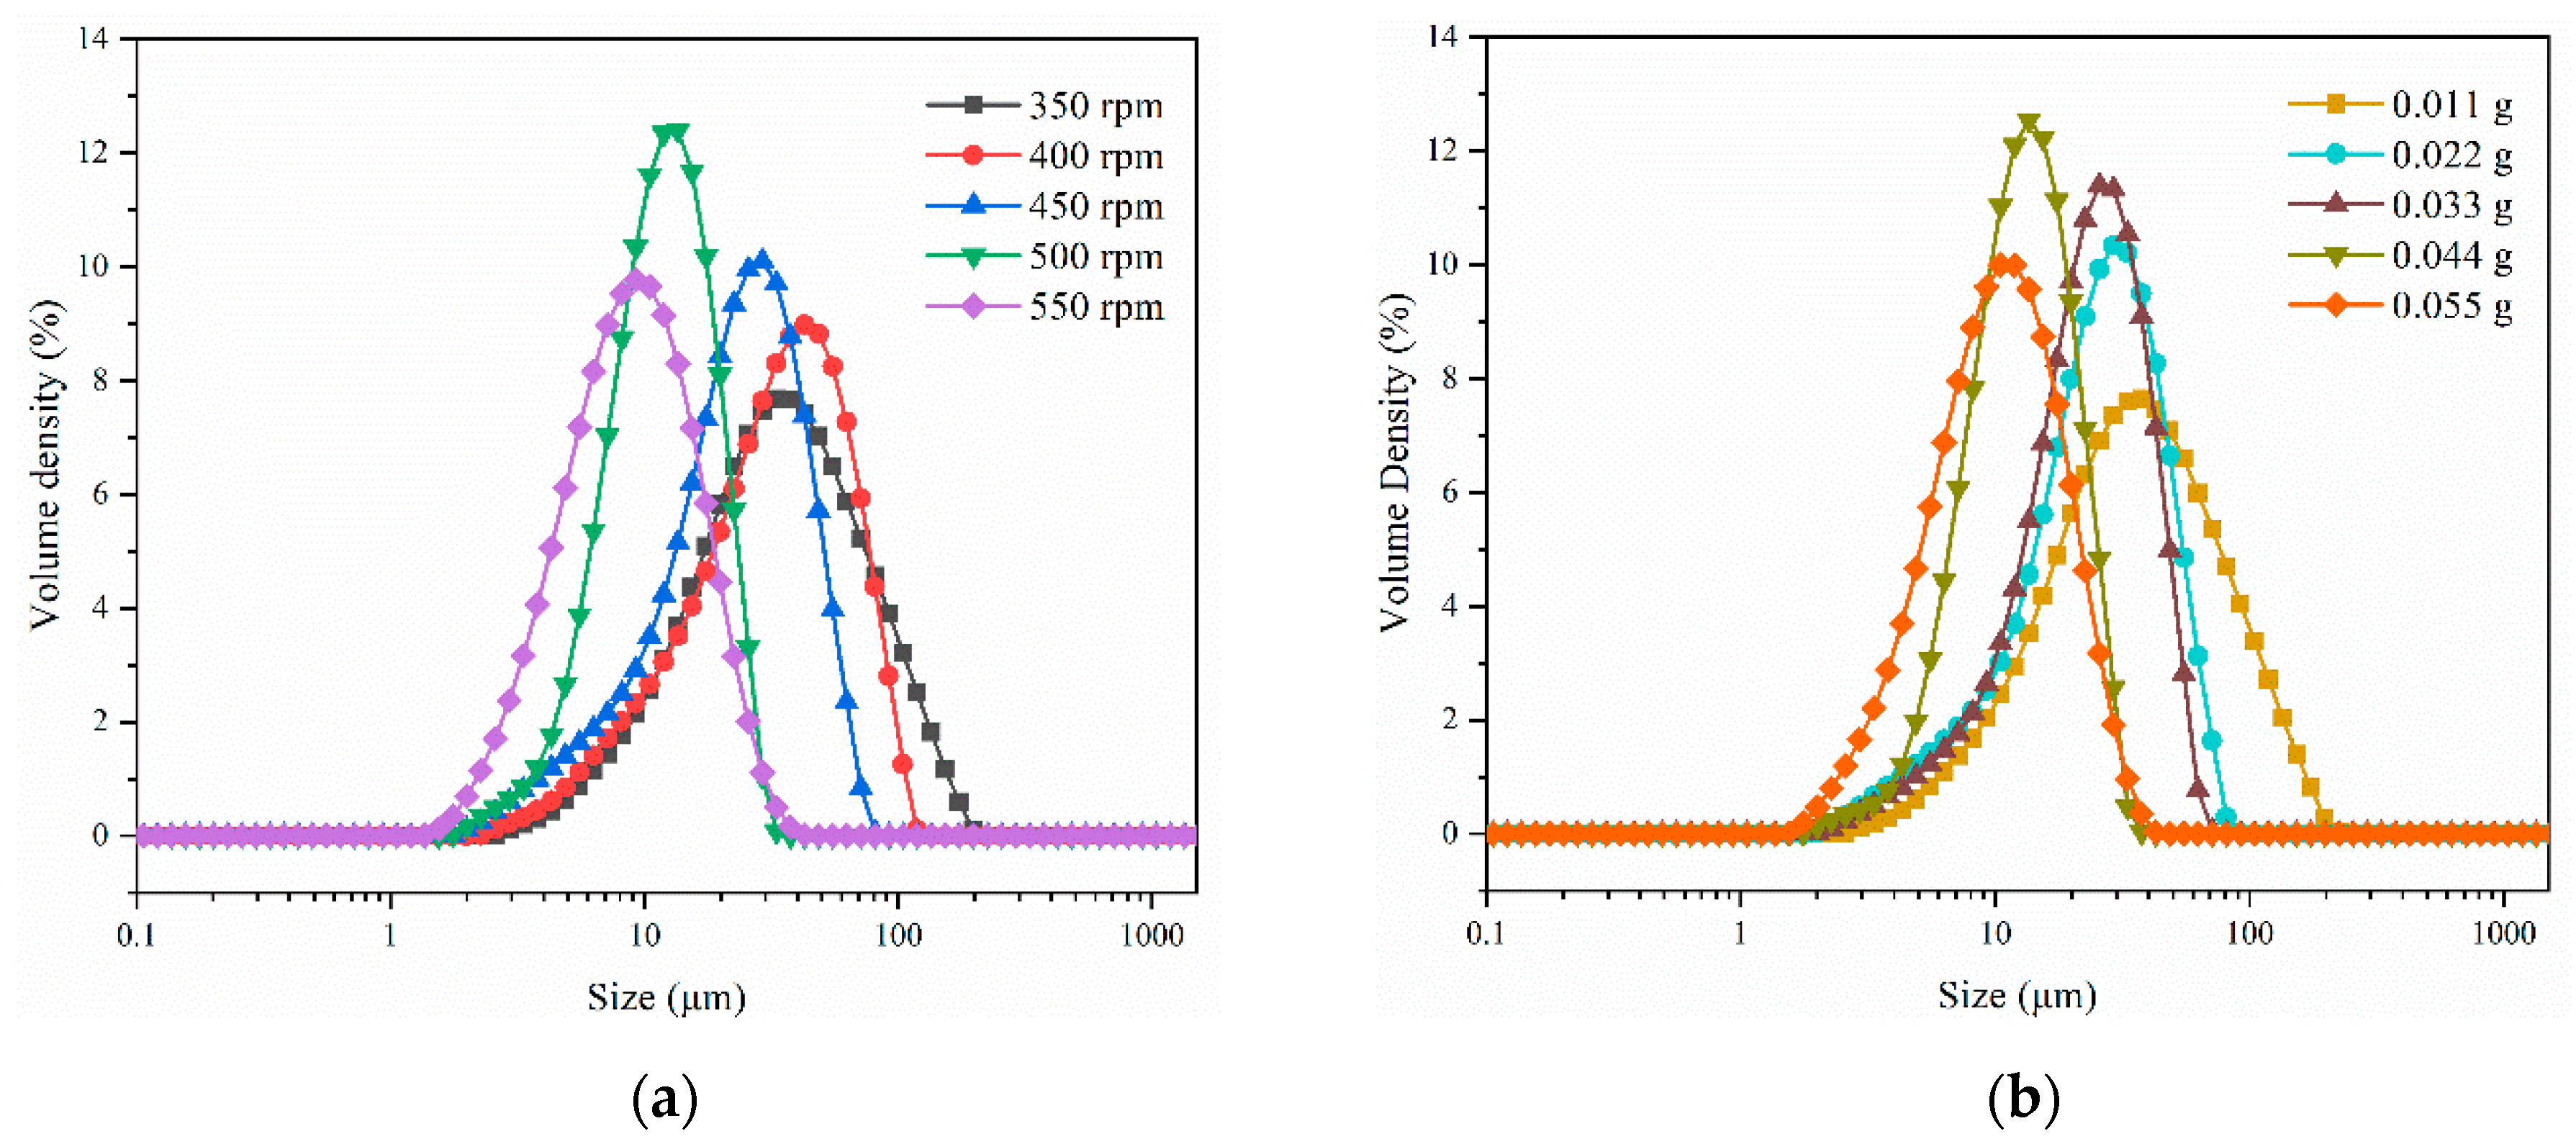
LCZ696 is easy to absorb moisture and agglomerate, resulting in difficulty in filtration, solvent wrapping, and low crystallinity. Good crystal shape, moderate average crystal size and uniform crystal size distribution (CSD) are beneficial to filtering, drying and subsequent processing. Crystal size distribution of LCZ696 crystals obtained by different stirrer speed and quantity of seeds were measured after the products were collected and dried, as shown in Figure 17 and Table 2. From Figure 17a, it can be observed that the average particle size decreased gradually as the stirrer speed increased from 350 rpm to 550 rpm, which resulted from the intensification of secondary nucleation by bigger stirrer speed. In addition, crystals are easily broken by high stirrer speed, resulting in a reduction of the average particle size. Meanwhile, when the stirrer speed was 500 rpm, the particle size was the most uniform, which can be shown by the value of Span [46] in Table 2:
Span   =   ( D 90     D 10 ) / D 50
where D90, D10, D50 are the size of crystals, whose volume fraction are less than 90%, 10%, 50 %, respectively. The smaller is the Span, the narrower is the crystal size distribution.
From Figure 17b and Table 2, it also can be seen that the addition of seeds also had an important effect on CSD of LCZ696 crystals. Obviously, when the quantity of seeds increased from 0.011 g to 0.055 g, the particle size showed a decreasing trend. In addition, the particle size showed the most uniform when the quantity of seeds was 0.044 g. Compared with spontaneous nucleation, addition of seeds has advantages on the control of crystal shape and crystal size, which can significantly reduce the primary nucleation not easy to control. The particle size was the most uniform. For example, pictures of crystal morphology of LCZ696 of two different stirrer speed and two different quality of seeds are listed in Figure 18. As shown in Figure 18a,b, the results indicated that the dispersity of the crystals by 500 rpm was better than 350 rpm, which was similar to the two different quality of seeds (Figure 18c,d), which can effectively improve the problem of filtering. The follow-up experiment of filtering proved this point. For example, in the process of filtering, the filtration time of suspension by 500 rpm and 350 rpm were about 2 min and more than 3 min, respectively. In addition, for every product, three samples were taken for repeated CSD measurement using Malvern Mastersizer 3000. The relative standard deviation (RSD) was used to assessment the accuracy of results, which can be shown as:
RSD = 1 X ¯ i = 1 n ( X i X ¯ n 1 × 100 %
where Xi (i = 1, 2, … n) is the measured value every time; X ¯ is the arithmetic mean value of the values by n times measurement; n is the number of repeated measurements. As listed in Table 2, it can be seen that the RSD value of D50 ranged from 0.18~0.81, which demonstrated the reliability of the measurement results of CSD.

4. Conclusions

LCZ696 was prepared successfully by valsartan and sacubitril, which was characterized by SEM, XRPD, TG-DSC and ATR-FTIR. In situ ATR-FTIR spectroscopy and on-line microscopic imaging were effectively applied to monitoring concentration and studying the crystal formation mechanism of the co-crystallization process. The result revealed that the co-crystallization was controlled mainly by nucleation. LCZ696 is morphologically composed of very thin hexagonal plates, leading to reasonable speculation that the crystal of LCZ696 grew in two dimensions. Stirrer speed and crystal seeds were found to have effect on the process of co-crystallization significantly, including the induction time, transformation time and CSD. JMA equation was found to be suitable to explain the co-crystallization process. This study not only showed that in situ ATR-FTIR spectroscopy and on-line imaging and image analysis were able to study the mechanism of the co-crystallization process of the complex multicomponent pharmaceutical forms of LCZ696 but also offered the possibility for controlling and optimizing the co-crystallization process by the study of effects on CSD and crystal polymorph.

Author Contributions

Conceptualization, X.Z.W. and X.J.L.; methodology, X.J.L., Y.Z. and X.Z.W.; software, X.J.L.; validation, X.J.L., Y.Z. and X.Z.W.; formal analysis, X.J.L., Y.Z. and X.Z.W.; investigation, X.J.L.; resources, X.Z.W. and Y.Z.; data curation, X.J.L.; writing—original draft preparation, X.J.L.; writing—review and editing, X.Z.W. and Y.Z.; visualization, X.J.L.; supervision, X.Z.W. and Y.Z.; project administration, X.Z.W. and Y.Z.; funding acquisition, X.Z.W. and Y.Z. All authors have read and agreed to the published version of the manuscript.

Funding

This research was funded by National Natural Science Foundation of China (NNSFC) (grant number: 61633006, 91434126 and 21706075), the Natural Science Foundation of Guangdong Province (grant number: 2017A030310262, 2018A030313263), the Guangdong Provincial Science and Technology Projects under the Scheme of Applied Science and Technology Research Special Funds (grant number: 2015B020232007), the Fundamental Research Funds for the Central Universities (grant number: 2017MS092), Beijing Key Laboratory of Enze Biomass Fine Chemicals.

Acknowledgments

Thanks to Jianguo Cao of Pharmavision (Qingdao) Intelligent Technology Ltd. for providing instrument and support to the imaging and image analysis system.

Conflicts of Interest

The authors declare no competing financial interest.

References

  1. Wang, J.-R.; Wang, X.; Lu, L.; Mei, X. Highly Crystalline Forms of Valsartan with Superior Physicochemical Stability. Cryst. Growth Des. 2013, 13, 3261–3269. [Google Scholar] [CrossRef]
  2. Flesch, G.; Muller, P.; Lloyd, P. Absolute bioavailability and pharmacokinetics of valsartan, an angiotensin II receptor antagonist, in man. Eur. J. Clin. Pharmacol. 1997, 52, 115–120. [Google Scholar] [CrossRef] [PubMed]
  3. Lee, K.R.; Nguyen, N.T.; Lee, Y.J.; Choi, S.; Kang, J.S.; Mar, W.; Kim, K.H. Determination of the R-enantiomer of valsartan in pharmaceutical formulation by capillary electrophoresis. Arch. Pharmacal Res. 2015, 38, 826–833. [Google Scholar] [CrossRef] [PubMed]
  4. Koltai, T.; Malachi, O.; Sasson, N.; Gold, A.; Tamas, K.; Omer, M.; Nisim, S.; Amir, G. Preparation of Amorphous Valsartan Useful to Treat Diabetes Related Hypertension and Cancer, Comprising Preparing Solution of Valsartan in Solvent (e.g., Acetonitrile, Toluene and Water) and Removing Solvent. U.S. Patent 2006270723-A1, 30 November 2006. [Google Scholar]
  5. Yu, S.; Cheng, Y.; Xing, W.; Xue, F. Solubility determination and thermodynamic modelling of gliclazide in five binary solvent mixtures. J. Mol. Liq. 2020, 311, 113258. [Google Scholar] [CrossRef]
  6. De Matos Jensen, C.E.; Souza dos Santos, R.A.; Leite Denadai, A.M.; Ferreira Santos, C.F.; Goncalves Braga, A.N.; Sinisterra, R.D. Pharmaceutical Composition of Valsartan: β-Cyclodextrin: Physico-Chemical and Characterization Anti-Hypertensive Evaluation. Molecules 2010, 15, 4067–4084. [Google Scholar] [CrossRef] [Green Version]
  7. Yu, S.; Xing, W.; Xue, F.; Cheng, Y.; Li, B. Solubility and thermodynamic properties of nimodipine in pure and binary solvents at a series of temperatures. J. Chem. Thermodyn. 2020, 106259. [Google Scholar] [CrossRef]
  8. Reguri, B.R.; Sunkari, S. New Crystalline Polymorphic Forms (I) and (II) of (S)-N-(1-carboxy-2-methyl-prop-1-yl)-N-pentanoyl-N-(2′-(1H-tetrazol-5-yl)-bi-phenyl-4-yl methyl)amine Useful in the Treatment of e.g., Hypertension, Heart Failure. U.S. Patent 2004072886-A1, 15 April 2004. [Google Scholar]
  9. Rukhman, I.; Flyaks, E.; Koltai, T.; Aronhime, J. New Amorphous and Various Crystalline Forms of Valsartan Useful in the Treatment of Hypertension. Patent WO2004083192-A1, 30 September 2004. [Google Scholar]
  10. Burgbacher, J.; Hahn, B.T.; Rampf, F.A.; Schneeberger, R. New Highly Crystalline form of Valsartan, Useful for Treating Hypertension or Elevated Blood Pressure. Patent WO2012016969-A1, 9 February 2012. [Google Scholar]
  11. Yan, Y.-D.; Sung, J.H.; Kim, K.K.; Kim, D.W.; Kim, J.O.; Lee, B.-J.; Yong, C.S.; Choi, H.-G. Novel valsartan-loaded solid dispersion with enhanced bioavailability and no crystalline changes. Int. J. Pharm. 2012, 422, 202–210. [Google Scholar] [CrossRef]
  12. Yu, S.; Xu, X.; Xing, W.; Xue, F.; Cheng, Y. Solubility, thermodynamic parameters, and dissolution properties of gliclazide in seventeen pure solvents at temperatures from 278.15 to 318.15 K. J. Mol. Liq. 2020, 312, 113425. [Google Scholar] [CrossRef]
  13. Yu, S.; Xing, W.; Xue, F.; Cheng, Y.; Liu, Y.; Chen, H.; Hao, C.; Sun, Y. Measurement and Correlation of Solubility and Thermodynamic Properties of Fluoxetine Hydrochloride in 15 Pure Solvents and a Methanol + Water Binary Solvent System. J. Chem. Eng. Data 2020, 65, 4656–4668. [Google Scholar] [CrossRef]
  14. Bhattacharya, B.; Das, S.; Lal, G.; Soni, S.R.; Ghosh, A.; Reddy, C.M.; Ghosh, A. Screening, crystal structures and solubility studies of a series of multidrug salt hydrates and cocrystals of fenamic acids with trimethoprim and sulfamethazine. J. Mol. Struct. 2020, 1199, 127028. [Google Scholar] [CrossRef]
  15. Mazur, L.; Materek, I.; Bond, A.D.; Jones, W. Multicomponent Crystal Forms of a Biologically Active Hydrazone with Some Dicarboxylic Acids: Salts or Cocrystals? Cryst. Growth Des. 2019, 19, 2663–2678. [Google Scholar] [CrossRef]
  16. Du, M.; Zhang, Z.-H.; Guo, W.; Fu, X.-J. Multi-Component Hydrogen-Bonding Assembly of a Pharmaceutical Agent Pamoic Acid with Piperazine or 4,4′-Bipyridyl: A Channel Hydrated Salt with Multiple-Helical Motifs vs a Bimolecular Cocrystal. Cryst. Growth Des. 2009, 9, 1655–1657. [Google Scholar] [CrossRef]
  17. Atwood, J.L.; Lehn, J.M. Comprehensive supramolecular chemistry. Solid State Supramol. Chem. Cryst. Eng. 1996, 6, 199–206. [Google Scholar]
  18. Lehn, J. Supramolecular Chemistry: Concepts and Perspectives; Wiley: Hoboken, NJ, USA, 1995; Volume 34. [Google Scholar]
  19. Aakeröy, C.B.; Salmon, D.J. Building co-crystals with molecular sense and supramolecular sensibility. CrystEngComm 2005, 7, 439–448. [Google Scholar] [CrossRef]
  20. Feng, L.; Karpiński, P.H.; Sutton, P.; Liu, Y.; Hook, D.F.; Hu, B.; Blacklock, T.J.; Fanwick, P.E.; Prashad, M.; Godtfredsen, S.; et al. LCZ696: A dual-acting sodium supramolecular complex. Tetrahedron Lett. 2012, 53, 275–276. [Google Scholar] [CrossRef]
  21. Ayalasomayajula, S.; Langenickel, T.; Pal, P.; Boggarapu, S.; Sunkara, G. Clinical Pharmacokinetics of Sacubitril/Valsartan (LCZ696): A Novel Angiotensin Receptor-Neprilysin Inhibitor. Clin. Pharmacokinet. 2017, 56, 1461–1478. [Google Scholar] [CrossRef]
  22. Gu, J.; Noe, A.; Chandra, R.; Al-Fayoumi, S.; Ligueros, M.; Sarangapani, R.; Maahs, S.; Ksander, G.; Rigel, D.; Jeng, A.; et al. Pharmacokinetic and pharmacodynamic properties of LCZ696, a novel dual-acting angiotensin receptor neprilysin inhibitor (ARNI). J. Hypertens. 2009, 27, S9. [Google Scholar]
  23. Feng, L.L.; Godtfredsen, S.E.; Karpinski, P. Pharmeceutical Combinations of An Angiotensin Receptor Antagonist and An NEP Inhibitor. Patent WO2007056546, 18 May 2007. [Google Scholar]
  24. Kulmatycki, K.M.; Langenickel, T.; Ng, D.; Pal, P.; Zhou, W.; Lin, T.-H.; Rajman, I.; Chandra, P.; Sunkara, G. Pharmacokinetics and safety of sacubitril/valsartan (LCZ696) in patients with mild and moderate hepatic impairment. Int. J. Clin. Pharmacol. Ther. 2017, 55, 728–739. [Google Scholar] [CrossRef]
  25. Kobalava, Z.K.; Kotovskaya, Y.; Averkov, O.; Pavlikova, E.; Moiseev, V.; Albrecht, D.; Chandra, P.; Ayalasomayajula, S.; Prescott, M.F.; Pal, P.; et al. Pharmacodynamic and Pharmacokinetic Profiles of Sacubitril/Valsartan (LCZ696) in Patients with Heart Failure and Reduced Ejection Fraction. Cardiovasc. Ther. 2016, 34, 191–198. [Google Scholar] [CrossRef]
  26. Li, S.; Xu, W.; Zhai, H. Study on crystallization solvents of sacbitril/valsartan. Guangdong Chem. Ind. 2018, 45, 85–88. [Google Scholar]
  27. Chang, P.-C.; Lin, S.-F.; Chu, Y.; Wo, H.-T.; Lee, H.-L.; Huang, Y.-C.; Wen, M.-S.; Chou, C.-C. LCZ696 Therapy Reduces Ventricular Tachyarrhythmia Inducibility in a Myocardial Infarction-Induced Heart Failure Rat Model. Cardiovasc. Ther. 2019, 2019, 6032631. [Google Scholar] [CrossRef] [PubMed] [Green Version]
  28. Desai, A.S.; McMurray, J.J.; Packer, M.; Swedberg, K.; Rouleau, J.L.; Chen, F.; Gong, J.; Rizkala, A.R.; Brahimi, A.; Claggett, B.; et al. Effect of the angiotensin-receptor-neprilysin inhibitor LCZ696 compared with enalapril on mode of death in heart failure patients. Eur. Heart J. 2015, 36, 1990–1997. [Google Scholar] [CrossRef] [PubMed] [Green Version]
  29. Mandala, V.S.; Loewus, S.J.; Mehta, M.A. Monitoring Cocrystal Formation via In Situ Solid-State NMR. J. Phys. Chem. Lett. 2014, 5, 3340–3344. [Google Scholar] [CrossRef] [PubMed]
  30. Sarraguça, M.; Paisana, M.; Pinto, J.F.; Lopes, J.A. Real-time monitoring of cocrystallization processes by solvent evaporation: A near infrared study. Eur. J. Pharm. Sci. 2016, 90, 76–84. [Google Scholar] [CrossRef] [PubMed]
  31. Tanaka, R.; Hattori, Y.; Ashizawa, K.; Otsuka, M. Kinetics Study of Cocrystal Formation between Indomethacin and Saccharin Using High-Shear Granulation with In Situ Raman Spectroscopy. J. Pharm. Sci. 2019, 108, 3201–3208. [Google Scholar] [CrossRef] [Green Version]
  32. Kelly, A.; Gough, T.; Dhumal, R.; Halsey, S.; Paradkar, A. Monitoring ibuprofen–nicotinamide cocrystal formation during solvent free continuous cocrystallization (SFCC) using near infrared spectroscopy as a PAT tool. Int. J. Pharm. 2012, 426, 15–20. [Google Scholar] [CrossRef]
  33. Qiao, N.; Wang, K.; Schlindwein, W.; Davies, A.; Li, M. In situ monitoring of carbamazepine-nicotinamide cocrystal intrinsic dissolution behaviour. Eur. J. Pharm. Biopharm. 2013, 83, 415–426. [Google Scholar] [CrossRef]
  34. Watari, M. A Review of Online Real-Time Process Analyses of Melt-State Polymer Using the Near-Infrared Spectroscopy and Chemometrics. Appl. Spectrosc. Rev. 2013, 49, 462–491. [Google Scholar] [CrossRef]
  35. Griffin, D.J.; Grover, M.A.; Kawajiri, Y.; Rousseau, R.W. Combining ATR-FTIR and FBRM for feedback on crystal size. In Proceedings of the 2015 American Control Conference (ACC), Chicago, IL, USA, 1–3 July 2015; pp. 4308–4313. [Google Scholar]
  36. Yu, S.; Zhang, Y.; Wang, X.Z. Improved Understanding of Cefixime Trihydrate Reactive Crystallization and Process Scale-up with the Aid of PAT. Org. Process. Res. Dev. 2019, 23, 177–188. [Google Scholar] [CrossRef]
  37. Feng, Y.; Dang, L.; Wei, H. Analyzing Solution Complexation of Cocrystals by Mathematic Models and In-Situ ATR-FTIR Spectroscopy. Cryst. Growth Des. 2012, 12, 2068–2078. [Google Scholar] [CrossRef]
  38. Gagniere, E.; Mangin, D.; Puel, F.; Bebon, C.; Klein, J.-P.; Monnier, O.; Garcia, E. Cocrystal Formation in Solution: In Situ Solute Concentration Monitoring of the Two Components and Kinetic Pathways. Cryst. Growth Des. 2009, 9, 3376–3383. [Google Scholar] [CrossRef]
  39. Tong, Y.; Wang, Z.; Yang, E.; Pan, B.; Dang, L.; Wei, H. Insights into Cocrystal Polymorphic Transformation Mechanism of Ethenzamide-Saccharin: A Combined Experimental and Simulative Study. Cryst. Growth Des. 2016, 16, 5118–5126. [Google Scholar] [CrossRef]
  40. Soares, F.L.F.; Carneiro, R.L. In-line monitoring of cocrystallization process and quantification of carbamazepine-nicotinamide cocrystal using Raman spectroscopy and chemometric tools. Spectrochim. Acta Part A: Mol. Biomol. Spectrosc. 2017, 180, 1–8. [Google Scholar] [CrossRef] [PubMed]
  41. Rafferty, C.; Balss, K.; Hartnett, C.O.; Madden, F.; McCarthy, B.; Schaefer, E.; Barnthouse, K.; Rea, R.; O’Mahony, J.; Shivappa, R. Monitoring and Controlling Critical Components in Cell Culture Process Using PAT Tool, Raman Spectroscopy. In Abstracts of Papers of the American Chemical Society, Proceedings of the 257th National Meeting of the American Chemical Society (ACS), Orlando, FL, USA, 31 March–4 April 2019; Abstract 426; American Chemical Society: Washington, DC, USA, 2019; Volume 257. [Google Scholar]
  42. Yu, Z.-Q.; Chow, P.S.; Tan, R.B.H.; Ang, W.H. Supersaturation Control in Cooling Polymorphic Co-Crystallization of Caffeine and Glutaric Acid. Cryst. Growth Des. 2011, 11, 4525–4532. [Google Scholar] [CrossRef]
  43. Chen, J.; Yuan, J.-S.; Ulrich, J.; Wang, J.-K. Online Measurement of Hydrocortisone Particles and Improvement of the Crystallization Process. Chem. Eng. Technol. 2009, 32, 1073–1077. [Google Scholar] [CrossRef]
  44. Avrami, M. Granulation, Phase Change, and Microstructure Kinetics of Phase Change. III. J. Chem. Phys. 1941, 9, 177–184. [Google Scholar] [CrossRef]
  45. Ryšavá, N.; Spasov, T.; Tichý, L. Isothermal DSC method for evaluation of the kinetics of crystallization in the Ge-Sb-S glassy system. J. Therm. Anal. Calorim. 1987, 32, 1015–1021. [Google Scholar] [CrossRef]
  46. Azéma, E.; Linero, S.; Estrada, N.; Lizcano, A. Shear strength and microstructure of polydisperse packings: The effect of size span and shape of particle size distribution. Phys. Rev. E 2017, 96, 022902. [Google Scholar] [CrossRef]
Figure 1. Chemical structure of valsartan: (a) S-configure; (b) R-configure.
Crystals 10 00922 g001
Figure 2. Chemical structure of LCZ696.
Crystals 10 00922 g002
Figure 3. Synthetic route of LCZ696.
Crystals 10 00922 g003
Figure 4. Images obtained by microscope and SEM of (a) Solid I and (b) Solid II.
Crystals 10 00922 g004aCrystals 10 00922 g004b
Figure 5. The measured XRPD patterns of S-valsartan, R-valsartan, sacubitril, Solid I, Solid II and the simulated XRPD pattern of LCZ696.
Crystals 10 00922 g005
Figure 6. The DSC curve (red color), TG curve (black color) and DTG curve (blue color) of LCZ696.
Crystals 10 00922 g006
Figure 7. The DSC curve (red color), TG curve (black color) and DTG curve (blue color) of Solid II.
Crystals 10 00922 g007
Figure 8. Images obtained by the hot-stage at different temperatures: (a) 298.15 K; (b) 369.15 K; (c) 390.15 K; (d) 416.15 K.
Crystals 10 00922 g008aCrystals 10 00922 g008b
Figure 9. The ATR-FTIR spectra of S-valsartan, R-valsartan, sacubitril, LCZ696 and solid II in solid form.
Crystals 10 00922 g009
Figure 10. ATR-FTIR spectra of S-valsartan, sacubitril, and LCZ696 in acetone and acetone with sodium hydroxide aqueous solution.
Crystals 10 00922 g010
Figure 11. ATR-FTIR spectra of S-valsartan (C1: the concentration of S-valsartan, unit: g·mL−1) and sacubitril (C2: the concentration of sacubitril, unit: g·mL−1) in acetone of different concentration at a fixed temperature of 298.15 K.
Crystals 10 00922 g011
Figure 12. Calibration model of ATR-FTIR spectroscopy of sacubitril.
Crystals 10 00922 g012
Figure 13. Variation of ATR-FTIR spectra during the co-crystallization of LCZ696 in the regions of (a) 3000~1500 cm−1, (b) 1675~1500 cm−1; (c) the concentration variation of sacubitril during the co-crystallization of LCZ696.
Crystals 10 00922 g013
Figure 14. Real-time crystallization process images measured by the 2D imaging system (scale bar: 20 μm).
Crystals 10 00922 g014aCrystals 10 00922 g014b
Figure 15. The induction time and transformation time of the co-crystallization by (a) different stirrer speed and (b) different quality of crystal seeds, respectively.
Crystals 10 00922 g015
Figure 16. The concentration variation of sacubitril during the co-crystallization of LCZ696 by (a) different stirrer speed and (b) different quality of crystal seeds, respectively.
Crystals 10 00922 g016
Figure 17. Effect of stirrer speed and seeds on CSD by (a) different stirrer speed and (b) different quality of crystal seeds, respectively.
Crystals 10 00922 g017
Figure 18. Crystal morphology of LCZ696 during the co-crystallization: (a) 350 rpm, (b) 500 rpm; (c) 0.011 g, (d) 0.044 g.
Crystals 10 00922 g018
Table 1. Kinetics parameters of the co-crystallization process of experiments 1~10.
ExperimentStirrer Speed/rpmQuality/gtind/minttrans/minK/min−3nR2
1350050900.00071.82190.9958
2400043700.00101.38970.9954
3450034530.00142.12930.9973
4500026390.00231.59270.9959
5550022320.00341.43650.9955
64000.01154890.00081.65880.9958
74000.02248710.00121.87500.9955
84000.03340580.00161.76230.9915
94000.04429420.00241.78970.9979
104000.05526390.00272.77880.9939
Table 2. CSD of LCZ696 crystals obtained in experiments 1~10.
ExperimentStirrer Speed/rpmQuality/gD10D50RSD (D50)D90Span
1350011.4340.4289.92.308
240003.848.830.5318.41.648
345009.334.60.3868.31.705
450005.9311.80.8120.51.234
555007.8623.70.2946.41.626
64000.01111.735.10.3593.82.339
74000.02210.333.60.3770.41.788
84000.0334.4210.30.4320.71.580
94000.0446.5412.80.7022.31.231
104000.0559.4423.60.1842.81.413