Article

Influence of Crystallization Behavior of Gas Quenching Blast Furnace Slag on the Preparation of Amorphous Slag Beads

College of Metallurgy & Energy, North China University of Science and Technology, Tangshan 063009, China
*
Author to whom correspondence should be addressed.
Crystals 2020, 10(1), 30; https://doi.org/10.3390/cryst10010030
Submission received: 17 December 2019 / Revised: 2 January 2020 / Accepted: 6 January 2020 / Published: 10 January 2020

Abstract

:
Slag beads with different crystal content could be obtained through the gas quenching blast furnace slag (BFS) process. In order to increase the additional value of the slag beads as much as possible, it was necessary to restrain the crystallization of the slag beads as much as possible. In this paper, the mineral types and crystallization temperatures of BFS with different basicities and cooling rates were studied by using Factsage thermodynamic software, XRD, and differential scanning calorimeter (DSC) experiments, which obtained the gas quenching temperature and the cooling rate needed to restrain crystallization behavior in the gas quenching process; The crystallization mechanism was studied by calculating crystallization activation energy (Ec) using the DSC experiment, at the same time, the thermodynamic results were verified. The proper basicity and cooling rate of BFS were found to be conducive to the preparation of amorphous slag beads. The results showed that the initial crystallization temperature decreased with decreasing the basicity and increasing the cooling rate, which could increase the amorphous content of slag beads in the gas quenching process. The crystallization activation energy (Ec) increased with decreasing basicity, which increased the crystallization barrier.

1. Introduction

Blast furnace slag (BFS) is a type of by-product produced in the process of iron-making production, whose use has always been a matter of concern to the metallurgical sector. Because of the large amount of output, the abandoned slag will occupy a large area of land, resulting in environmental pollution. Thus, the high additional value of BFS has always been the focus of researchers [1,2,3]. Traditional water quenching BFS method cannot recover the BFS waste heat, at the same time, it consumes high quantities of new water. The hot water produced in the process is a low-quality heat source. Moreover, the water slag must be dried to be used as cement admixture, which will consume part of the energy and produce harmful gases such as H2S and SO2 which pollute the environment [4,5,6]. Therefore, the dry granulation process has attracted more and more attention from iron and steel industry for how it can overcome the shortcomings of the water quenching method [7,8]. In the process of granulation, a large number of slag waste heat can be recovered, and the phase quality of the slag beads can be ensured. Meanwhile, new water is not consumed, harmful gases are not produced, and the subsequent use of the slag beads does not need to be dried. The gas quenching method is a kind of dry granulation process, which has the characteristics of large treatment capacity and good granulation effect, and is a promising BFS treatment method. In order to obtain the slag beads with higher added value, the activity of the slag beads needs to be ensured. The greater the activity is, the higher the additional value. The activity of the BFS is mainly related to the amorphous degree of the BFS [9]. The gas quenching process is the cooling process of BFS, and inevitably causes crystallization of BFS. Therefore, it is necessary to study the crystallization behavior of BFS and to restrain the crystallization of BFS to obtain high-content amorphous slag beads. The degree of amorphousness of BFS is mainly affected by its components, so the effect of different slag components on crystallization behavior was studied by adding different conditioning agents, and the component structure conducive to the preparation of amorphous slag beads was studied.
Additionally, research on the crystallization behavior of BFS has been reported at present. Fredericci [10] has studied the crystallization process of BFS and the crystalline phase and crystallization peak were verified after heat treatment. Kashiwaya [11] studied the crystallization behavior of blast furnace slag by using a hot thermocouple technique, and the crystals phase have been observed. Francis [12] has studied the capability of the blast furnace slag to be vitrified and calculated the crystallization activation energy and the Avrami exponent. A value for the activation energy corresponding to structural relaxation has also been determined. However, there is little report on the study of gas quenching BFS amorphization. Therefore, this paper studied the mineral types and crystallization temperature of BFS using Factsage 7.1 thermodynamic software, X-ray diffraction (XRD), and differential scanning calorimetry (DSC) experiments, and found the initial crystal phase and its crystallization temperature, thus finding the conditioning direction and cooling rate conducive to inhibiting crystallization of BFS. The crystallization activation energy were calculated through DSC experiment to study the crystallization mechanism of BFS, which further verified the thermodynamic results.

2. Experimental Methods

2.1. Experimental Raw Materials

The main components of BFS are shown in the Table 1, the content of four oxides of CaO, SiO2, MgO, and Al2O3 accounted for more than 90% of BFS components, and the characteristics of BFS were mainly influenced by them. The BFS was selected from a HBIS iron manufacturing plant of Tangsteel in Tangshan, China. In order to ensure the raw BFS component, the pure chemical analysis reagent was used as conditioning agent to adjust the BFS component, and the final components of BFS with different basicities are shown in Table 2.

2.2. Experimental Methods

2.2.1. Thermodynamic Simulation

Factsage 7.1 thermodynamic software used Phase Digam module to draw a CaO-MgO-Al2O3-SiO2 quaternary slag system phase diagram. The Equilib module was used to calculate the types and quantities of crystals in equilibrium. Ftoxide was selected as a database [13,14], the system pressure set to 1 atm, and the simulated temperature was 1000–1600 °C.

2.2.2. Differential Scanning Calorimeter (DSC) Methods

Approximately 30 mg of BFS samples under 0.075 mm, prepared according to the experimental BFS component in Table 2, were placed in a platinum crucible in air to carry out the DSC (STA449F3 Juptiter, NETZSCH, Germany) experiment. Samples were heated to 1500 °C at the rate of 100 °C/min, and then maintained at 1500 °C for 30 min to homogenize the component. Samples were cooled to 25 °C at the rates of 20 °C/min, 30 °C/min, 45 °C/min, 55 °C/min, and 60 °C/min, respectively.

2.2.3. X-ray Diffraction (XRD) Analysis and Micro-Morphology Observation

About 140 g of BFS with different basicities were put into the crucible, and then put into a high temperature LMC directional solidification cooling equipment for heating up to 1500 °C. The samples were maintained at 1500 °C for 30 min to be fully melted. Samples were then cooled at a temperature of 5 °C/min with the furnace, and then taking out for water quenching at the specified cooling temperature. The obtained samples were tested for mineral phase analysis (D/MAX2500PC) and micro-morphology observation (S-480003040155).

3. Results and Discussion

3.1. Thermodynamic Analysis

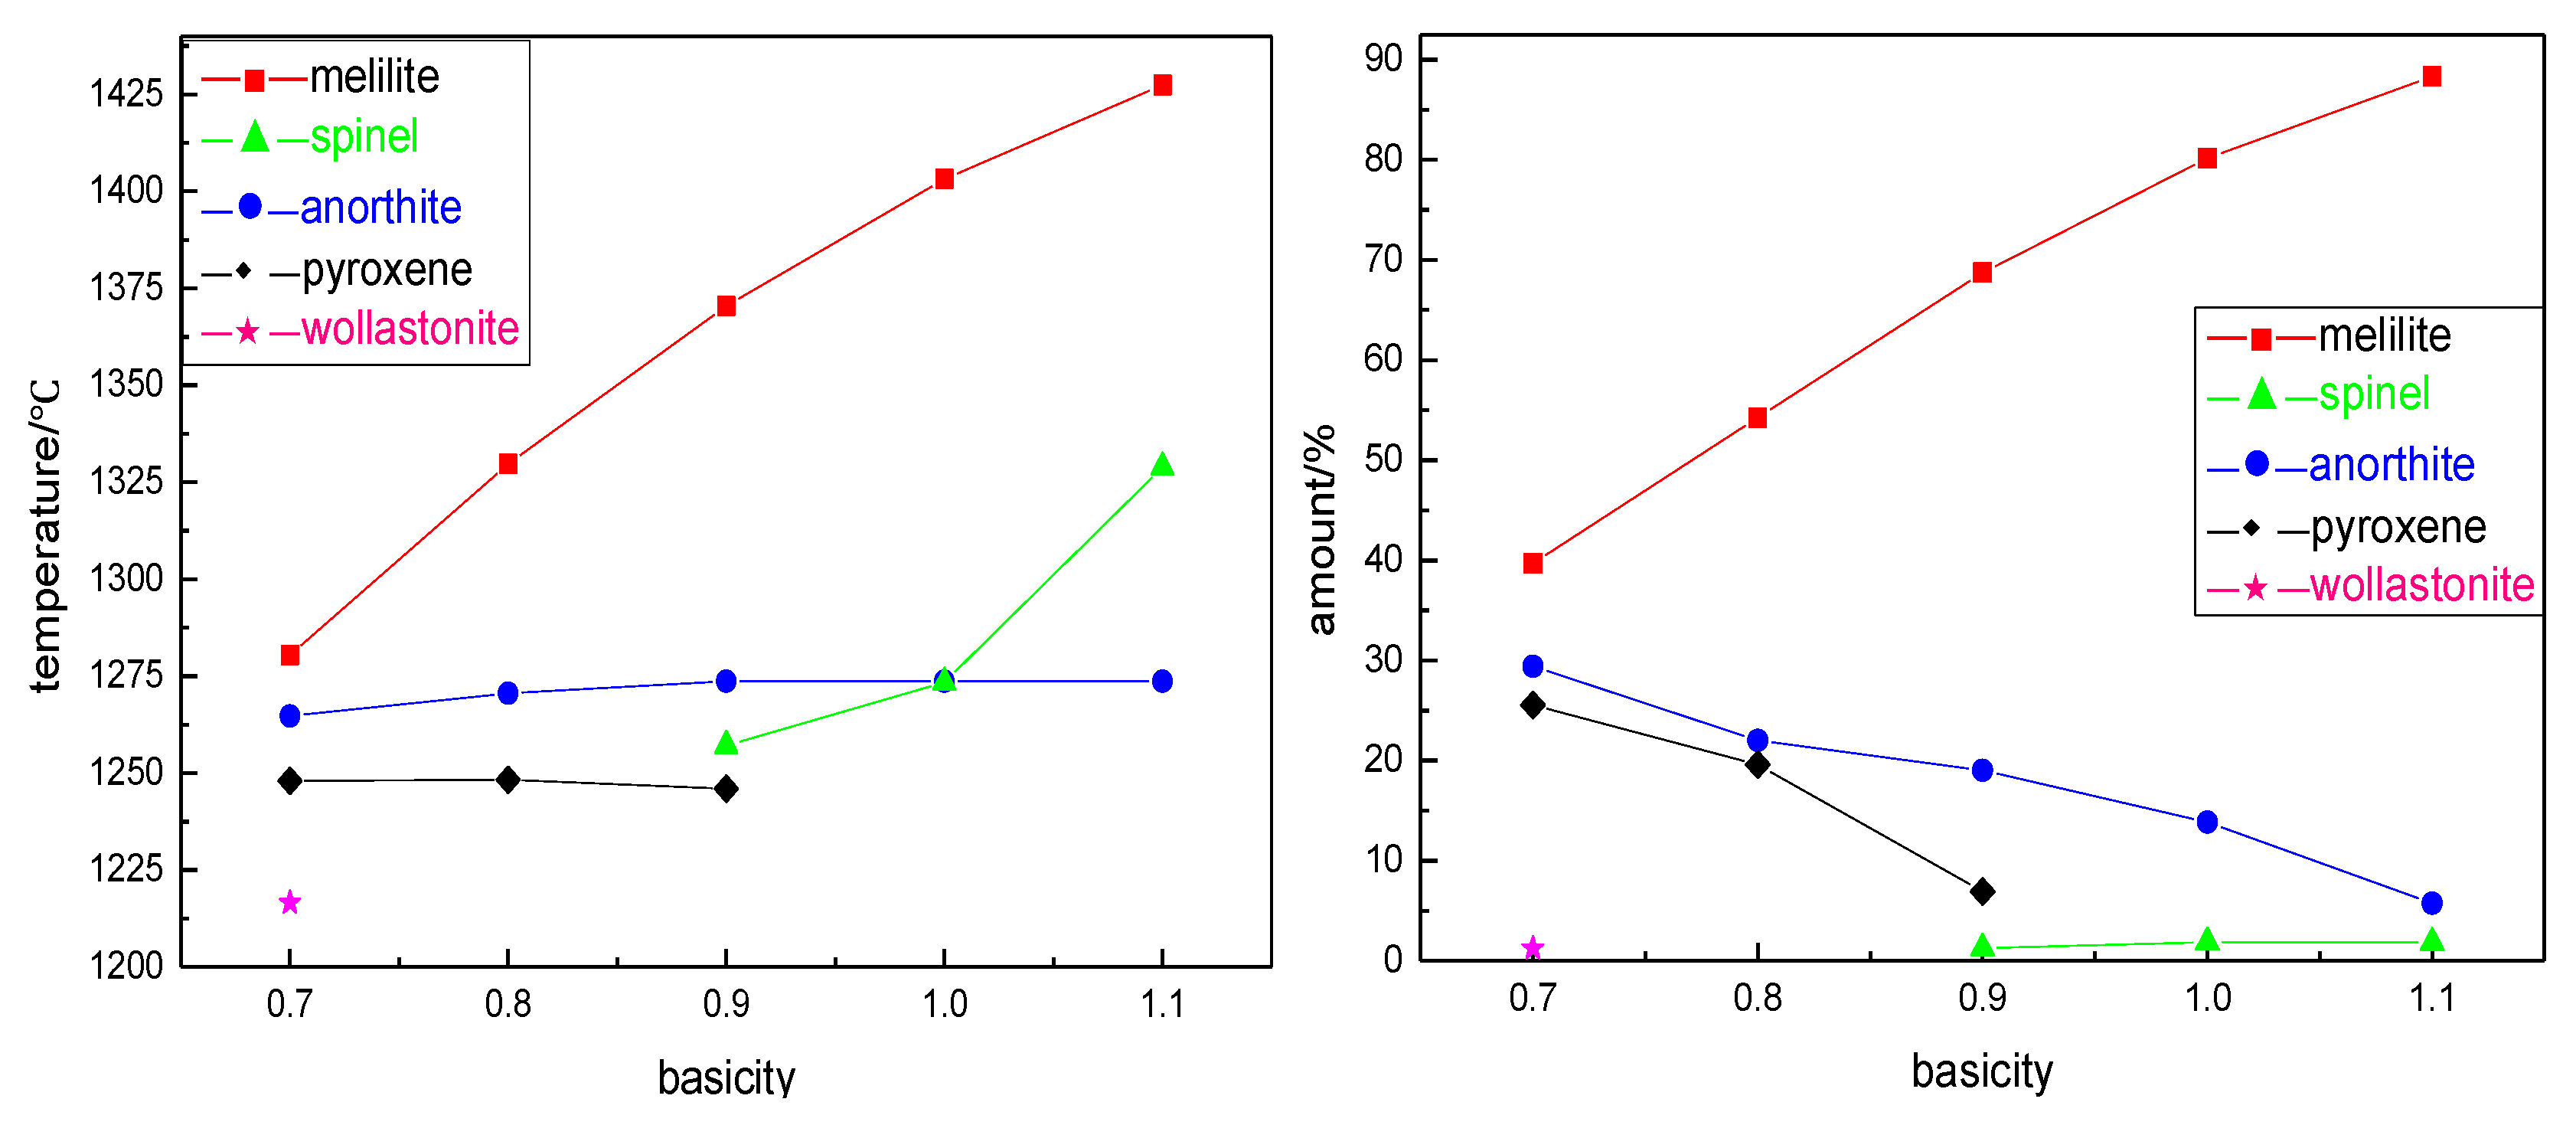
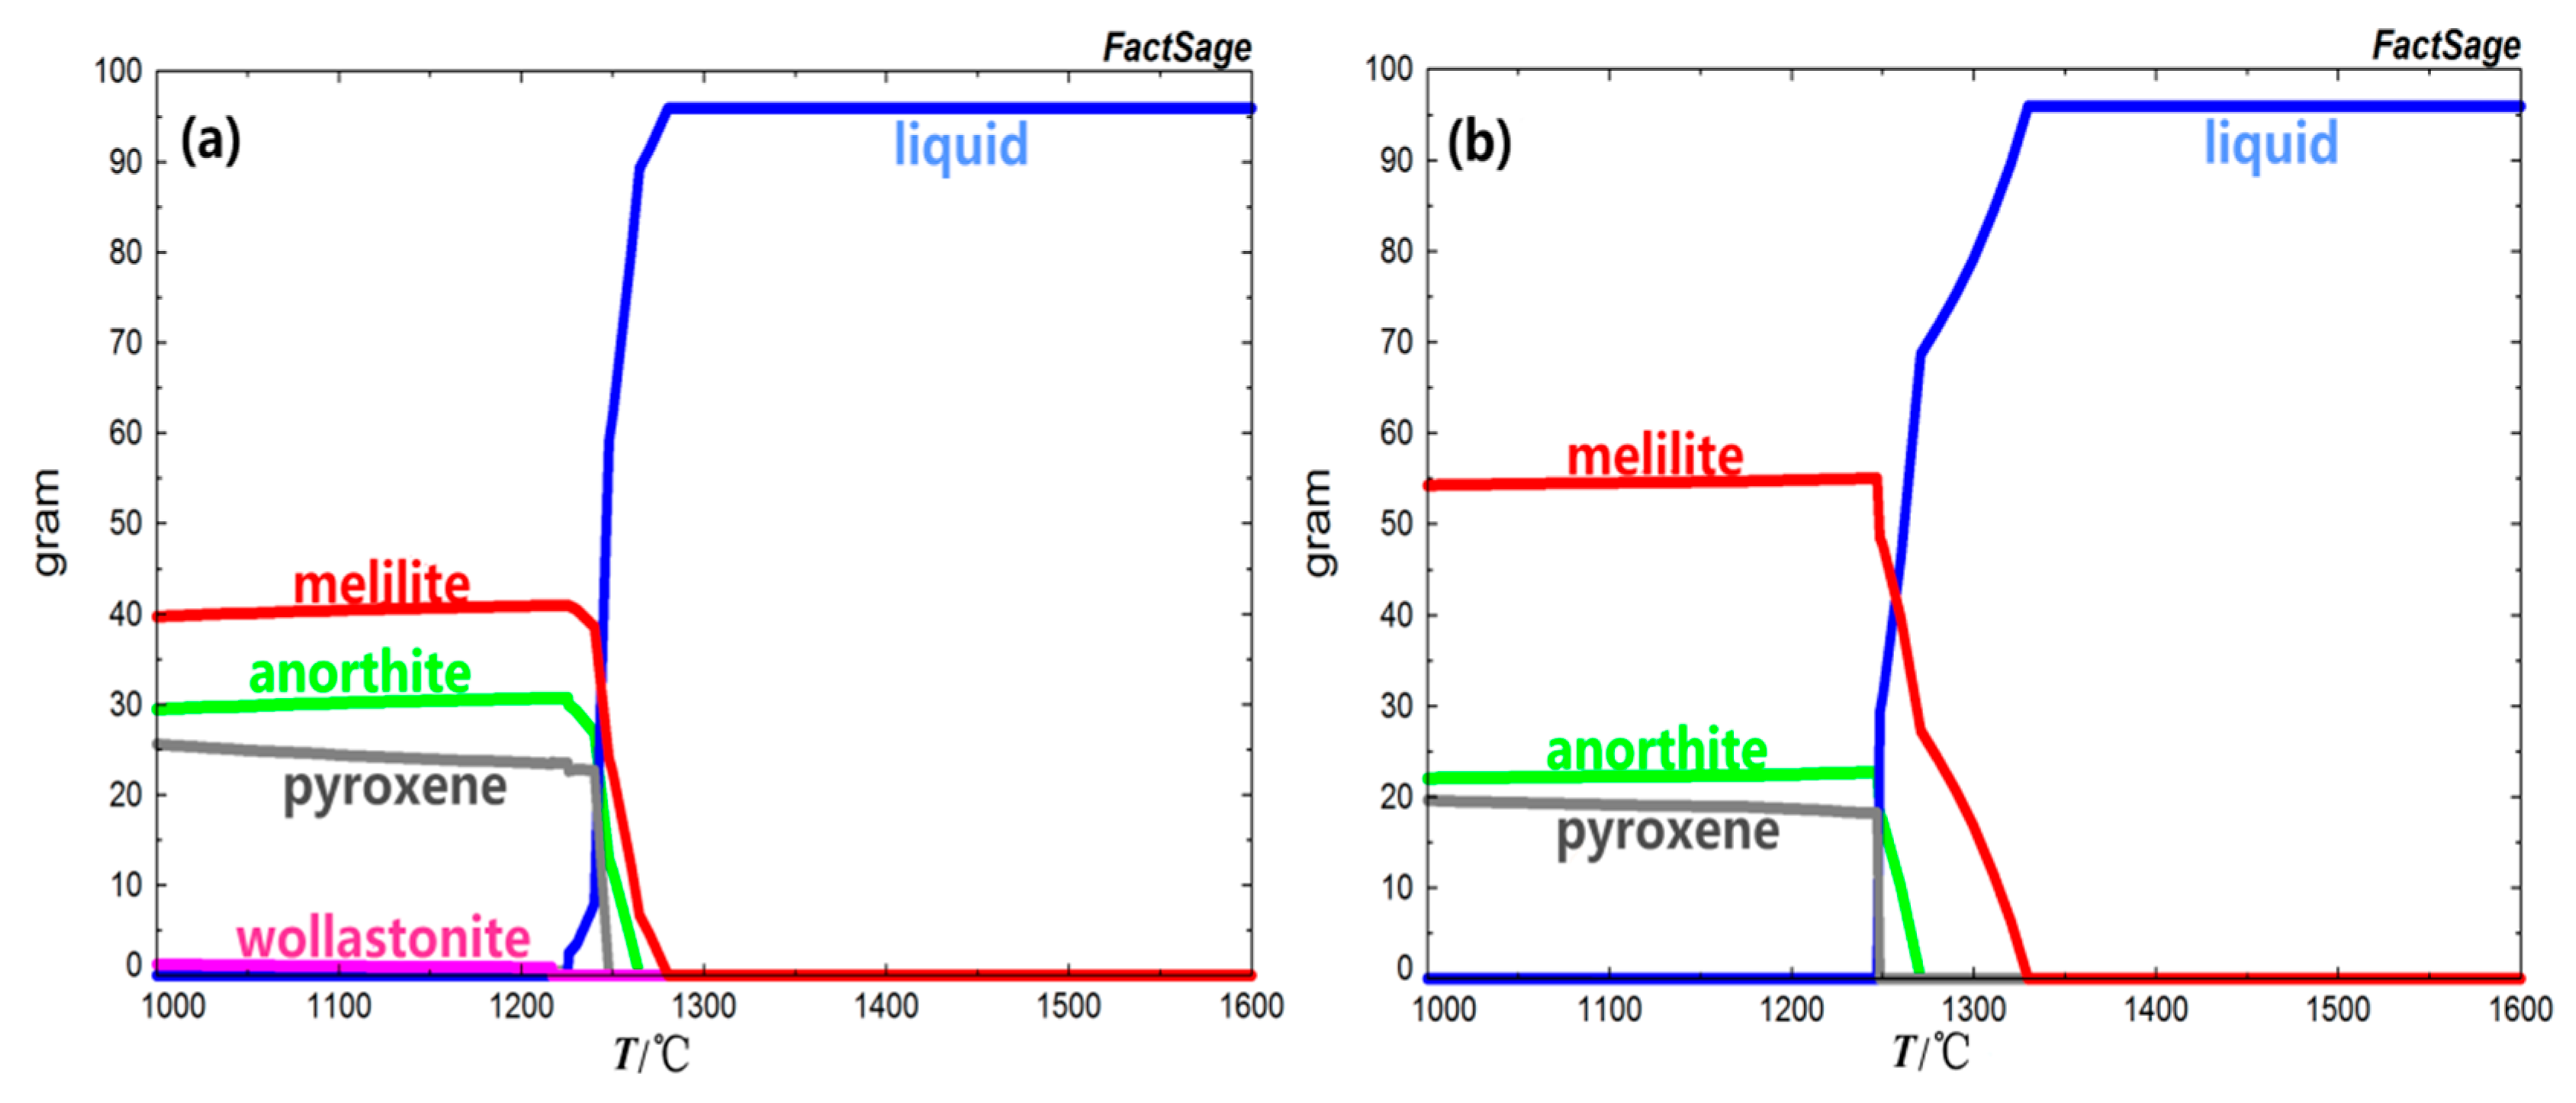
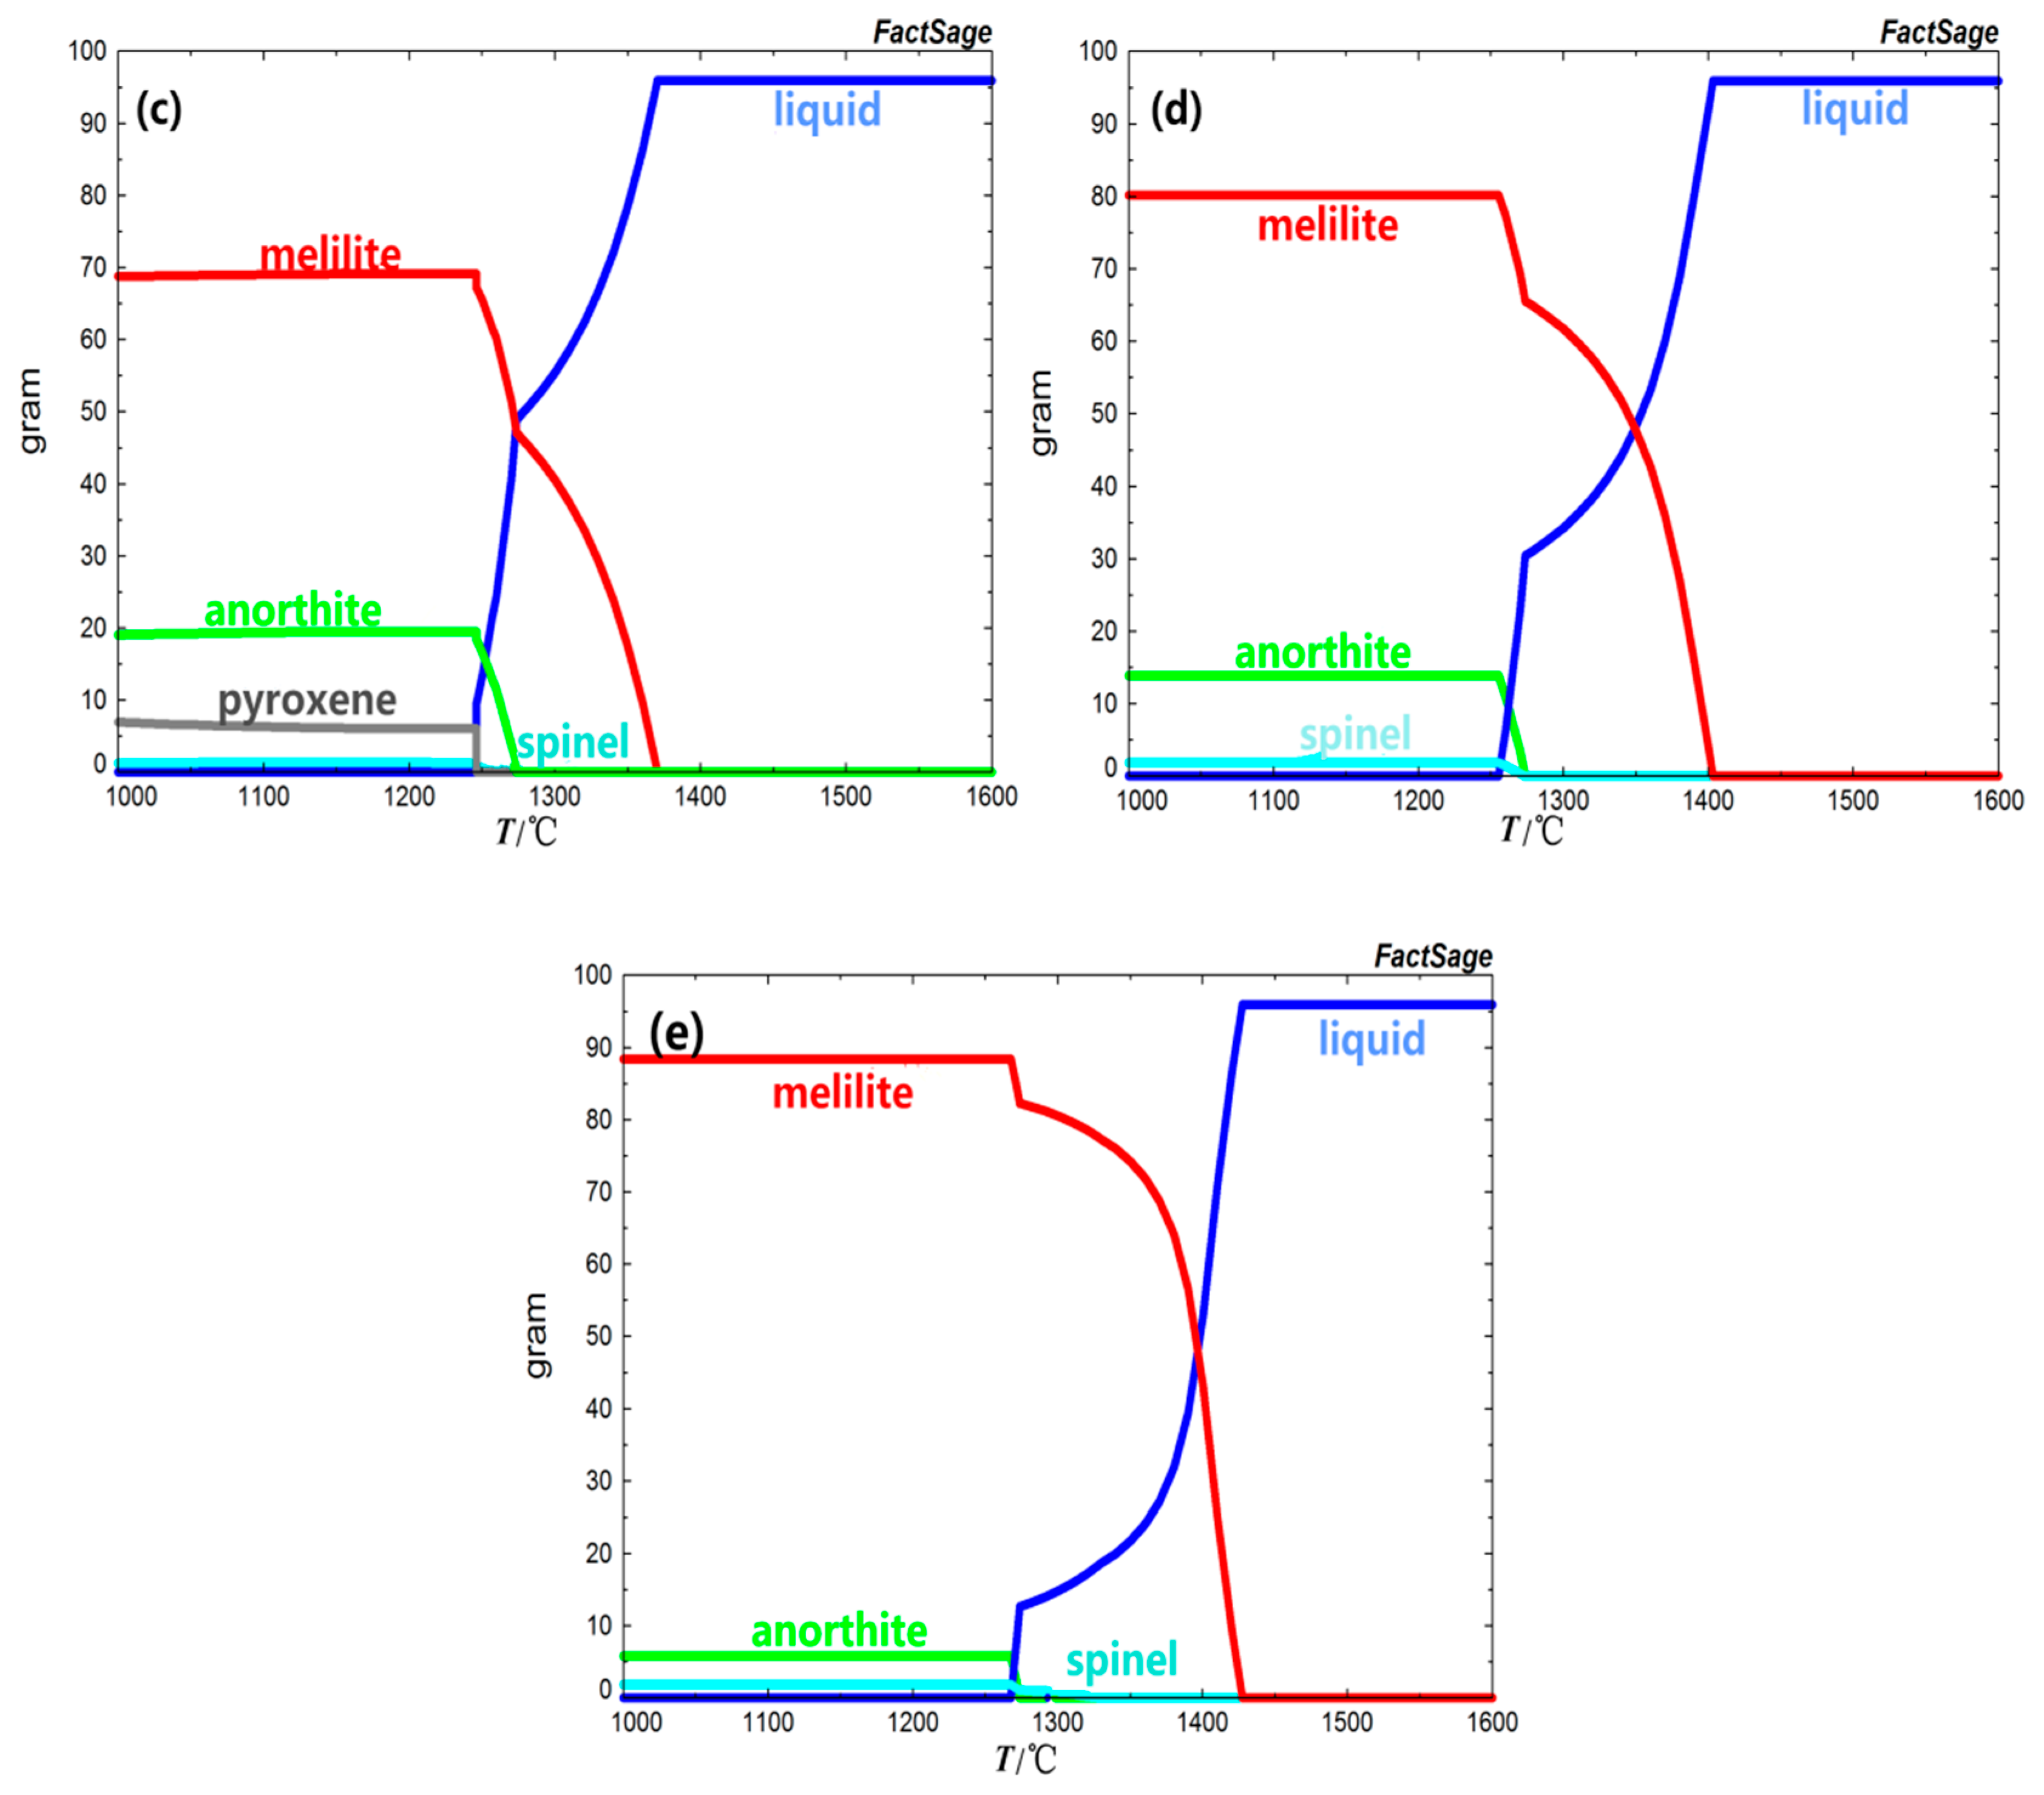
As shown in Figure 1 and Figure 2, when the basicity was 0.7, the liquid phase of BFS decreased gradually with the decrease of temperature. Finally, the liquid phase completely disappeared and the melilite (Ca2(MgAl)(AlSi)SiO7), anorthite (CaAl2Si2O8), pyroxene (Ca(Mg,Al)(Si,Al)2O6), and wollastonite (CaSiO3) were precipitated at the same time. The melilite phase was precipitated at 1280.40 °C firstly, and then the anorthite, pyroxene, and wollastonite were precipitated at 1264.70 °C 1248.00 °C, and 1216.60 °C respectively. At 1205.40 °C the crystallization phases were completely precipitated, and the precipitation amount of melilite, anorthite, pyroxene, and wollastonite was 39.69%, 29.42%, 25.53%, and 1.24%, respectively.
With the increase of basicity, due to the relative decrease of Mg2+ and Si2+ in the slag, the precipitation amount of pyroxene and wollastonite in BFS decreased gradually, and did not precipitate when the basicity was 0.9. The spinel began to crystallize when the basicity increased to 0.9. At the same time, the precipitation amount of melilite and spinel increased from 39.69% and 1.24% to 88.32% and 1.83% with the increase of basicity, respectively. The precipitation amount of anorthite decreased from 29.42% to 5.74%. The initial crystallization phases were all melilite and the crystallization temperature of BFS were 1280.40 °C, 1329.70 °C, 1370.4 °C, 1403.20 °C, and 1427.40 °C with the increase of basicity. The initial crystallization temperature increased with the increase of basicity. That was to say, the higher the basicity was, the easier it was to reach the crystallization temperature, and the faster the crystal precipitated in the cooling process. The crystallization precipitation in slag was closely related to the degree of polymerization of negative ion groups [15]. From Table 3, the slag viscosity had a significant decrease trend with the increase of basicity. Therefore, the increase of basicity was more likely to cause the relative movement between slag molecules, thus making the molecules structural unit rearrange. At the same time, the amount of the compound anionic group in the slag was relatively decreased, so that the degree of polymerization of the slag was obviously increased and promoted the precipitation of the crystals.
According to the Bowen’s reaction series [16], the precipitation of the crystallization phase in minerals has a certain order because of the gradual change of composition during gradual condensation of mineral temperature from high to low, thus the precipitation sequence of crystallization phase in slag was obtained by analyzing the components of slag. When the basicity was lower than 0.7, the melilite phase was precipitated firstly in the BFS, the slag consumed more Ca2+ and still had more Si2+, which promoted the precipitation of the anorthite phase, and then the pyroxene phase precipitated, and the final phase was wollastonite. When the basicity increased to 0.8, the initial crystal phase was still melilite, and then anorthite and pyroxene were respectively precipitated. Due to the increase of the basicity, the Si2+ content in the slag was relatively decreased, and the wollatonite was no longer precipitated in the slag. When the basicity of slag increased to 0.9, spinel appeared in the crystal phase of slag and the precipitation order was before pyroxene. The reason might be that the decrease of Si2+ content made it insufficient to provide enough Si2+ in slag to form pyroxene, and the Mg2+ and Al3+ contents in slag occupied the majority, which promoted the precipitation of spinel first. When basicity increased to 1.0, the slag first precipitated melilite, and then precipitated anorthite. With the further decrease of Si2+ content, there was no pyroxene precipitation in slag. When basicity increased to 1.1, the Ca2+ content in the slag increased relatively, which promoted the precipitation of melilite, but with the decrease of Si2+ content, it was not enough to precipitate anorthite in the slag. After the precipitation of melilite, the Mg2+ and Al3+ contents in the slag accounted for the majority, so the spinel precipitated first and the anorthite phase was precipitated last.
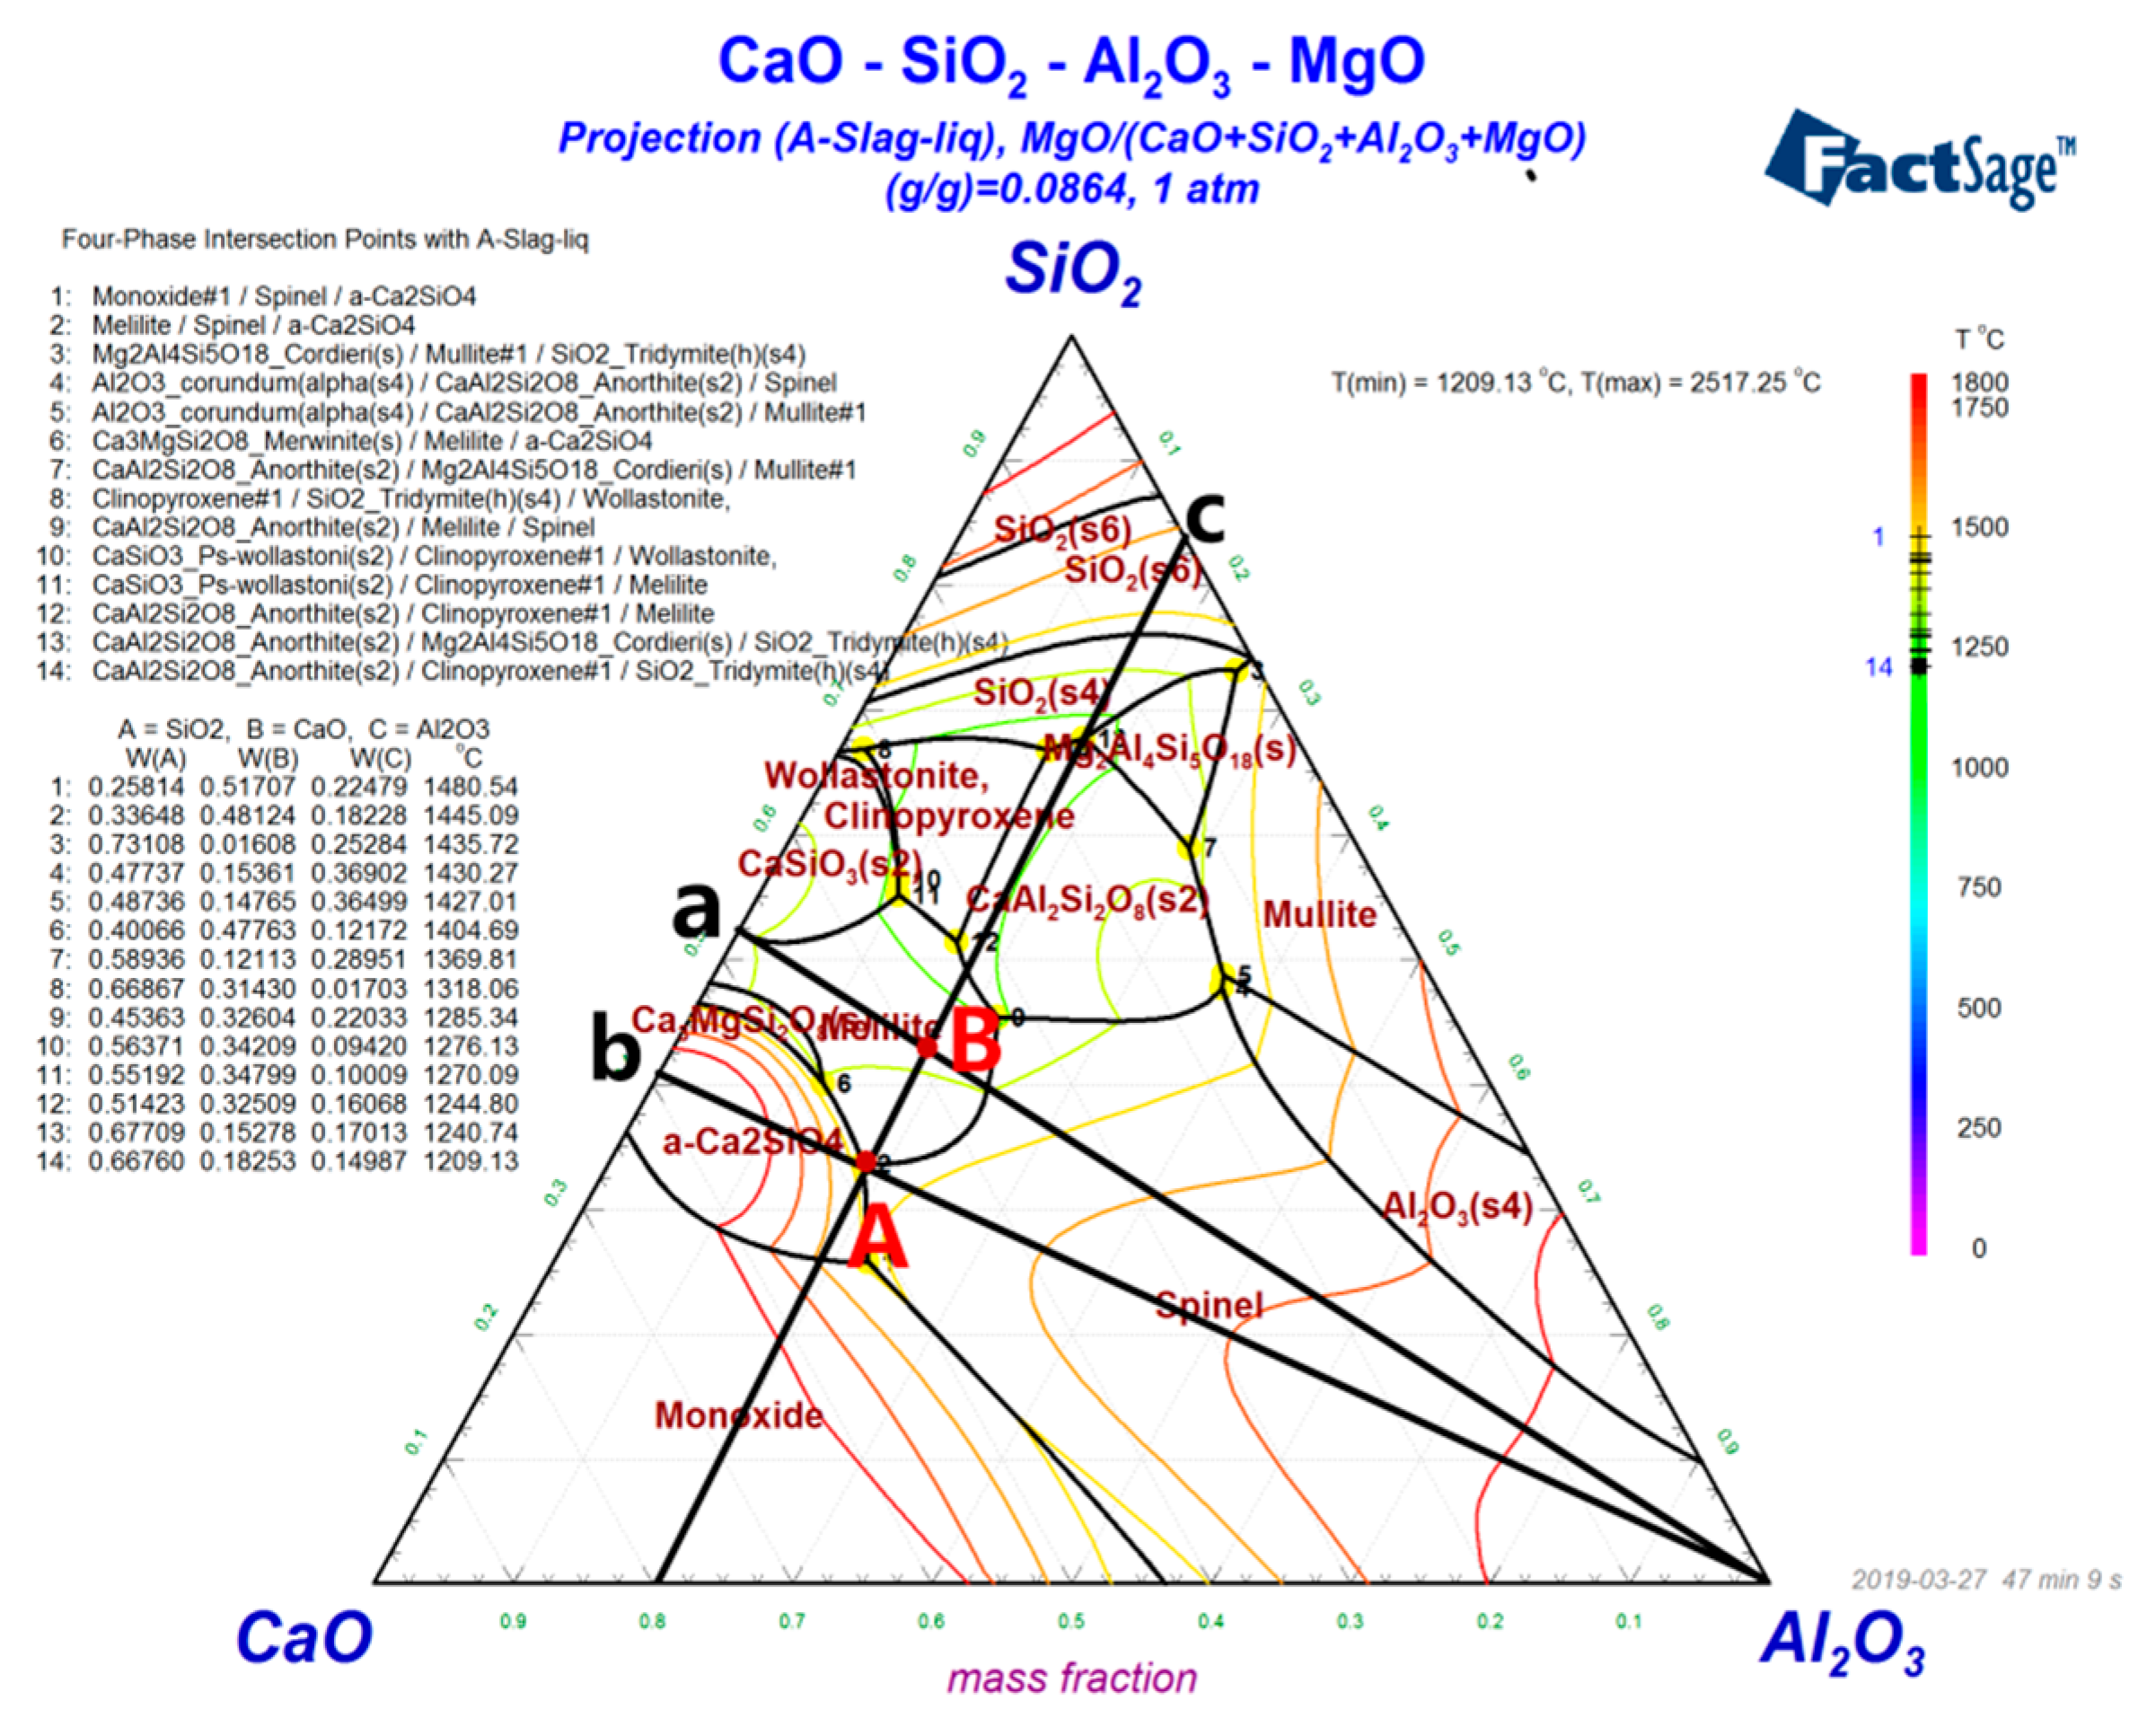
The phase diagram of BFS with different components was drawn using Factsage in order to better understand the influence of different basicities on crystallization. From Figure 3, with the basicity ranging 0.7–1.1, the BFS components region moved gradually from the B components’ point melilite low melting point region to the A components’ point dicalcium silicate high melting point region. From the temperature strip on the right, we could see that the isotherm of point B was lower than that of point A. Therefore, the precipitation temperature of the initial crystallization phase increased as the basicity increased from 0.7 to 1.1. In conclusion, the smaller basicity would be more beneficial to the preparation of amorphous slag beads.

3.2. Determination of the Mineral Phase

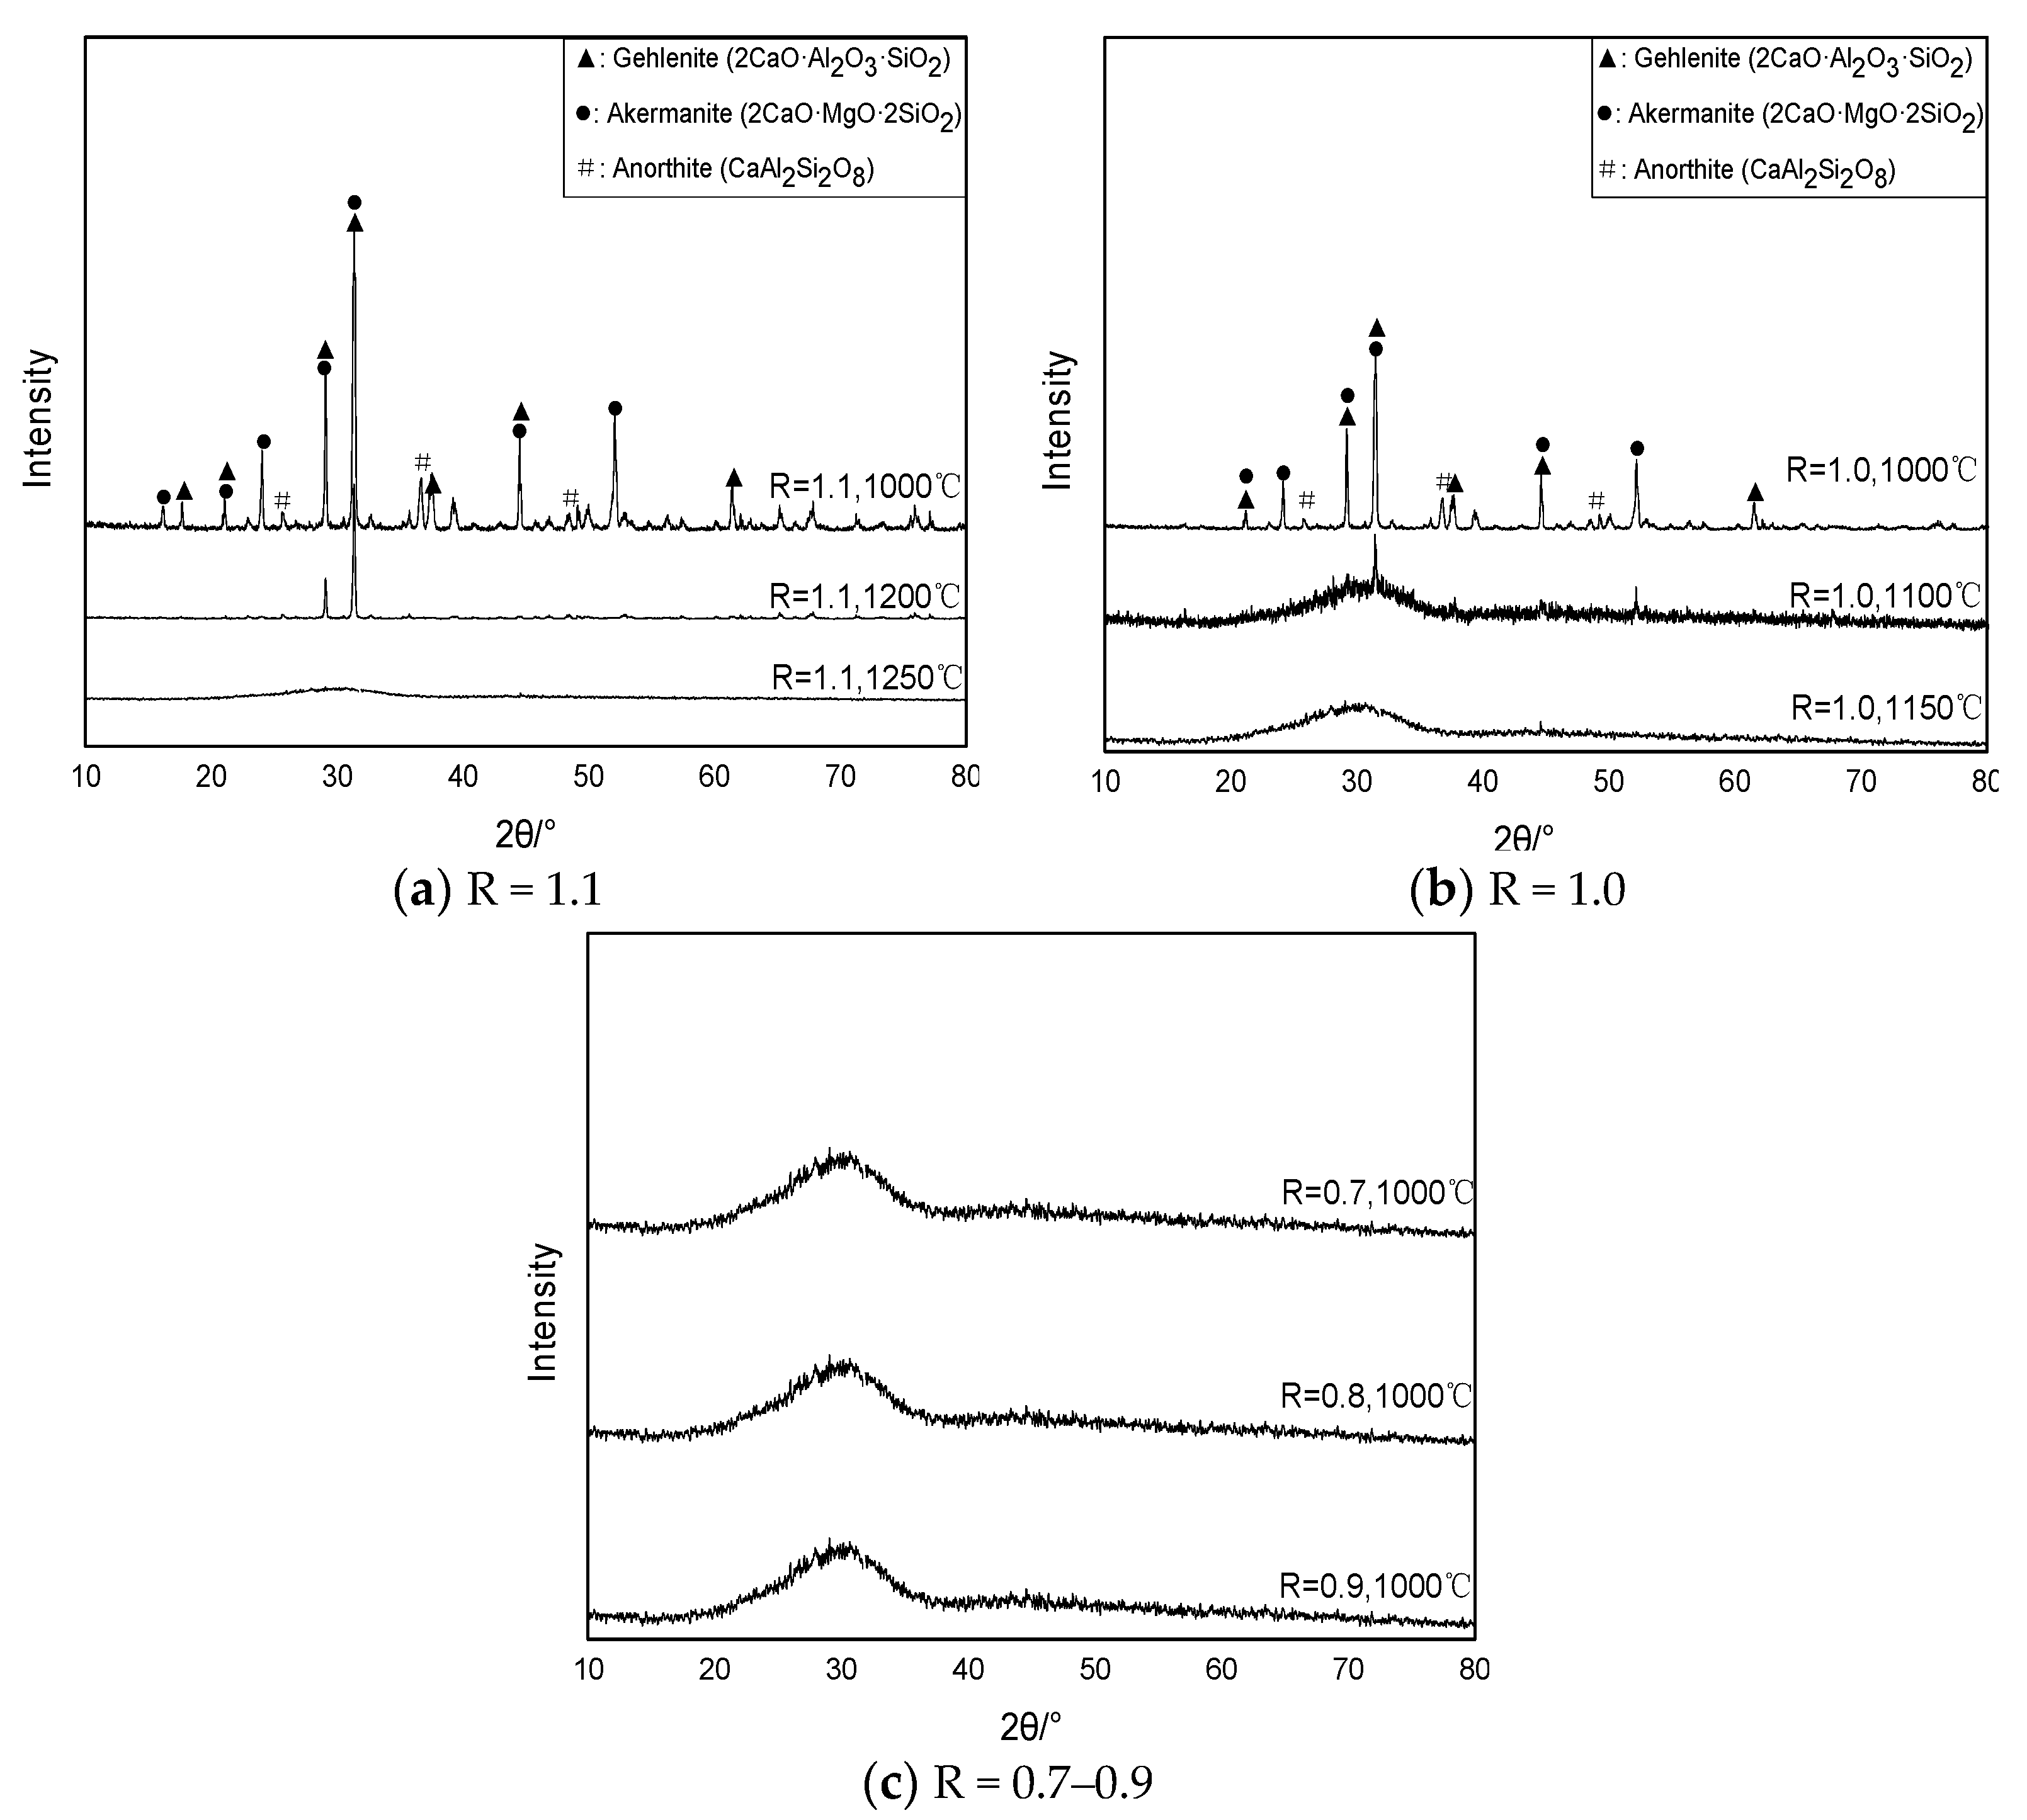
In order to verify the accuracy of thermodynamic simulation results, the BFS samples with different basicities were cooled at specified temperatures, and the mineral phase analysis was carried out. As can be seen from Figure 4a, when the sample with 1.1 basicity was cooled to 1250 °C, there was still no mineral phase precipitation, and the mineral phase was basically amorphous phase. When the temperature continued to cool down to 1200 °C, a small amount of gehlenite and akermanite phase began to precipitate. When the temperature continued to cool to 1000 °C, a large amount of crystallization phase began to precipitate, and the main crystallization phase was the melilite and the anothite. The intensity of the diffraction peak of the melilite was large and the quantity was high, and the precipitation amount occupied the majority. When the basicity decreased to 1.0 in Figure 4b, the precipitation phase was almost amorphous phase when the samples cooled to 1150 °C, and when the temperature continued to decrease to 1100 °C, the melilite phase began to precipitate; when the temperature decreased to 1000 °C, a large amount of crystallization phase was precipitated in the BFS, and the main crystallization phase was the melilite and the anothite. There was no spinel phase precipitation in the slag. It might be that at the specified temperature, spinel phase was not precipitated in the cooling process of basicity 1.0 and 1.1, or the diffraction peak was not formed for the lesser precipitation amount. When the basicity continued to decrease to 0.9–0.7, there was no crystallization precipitation of BFS in Figure 4c, which indicated that the precipitation temperature of the initial crystallization phase was below 1000 °C.
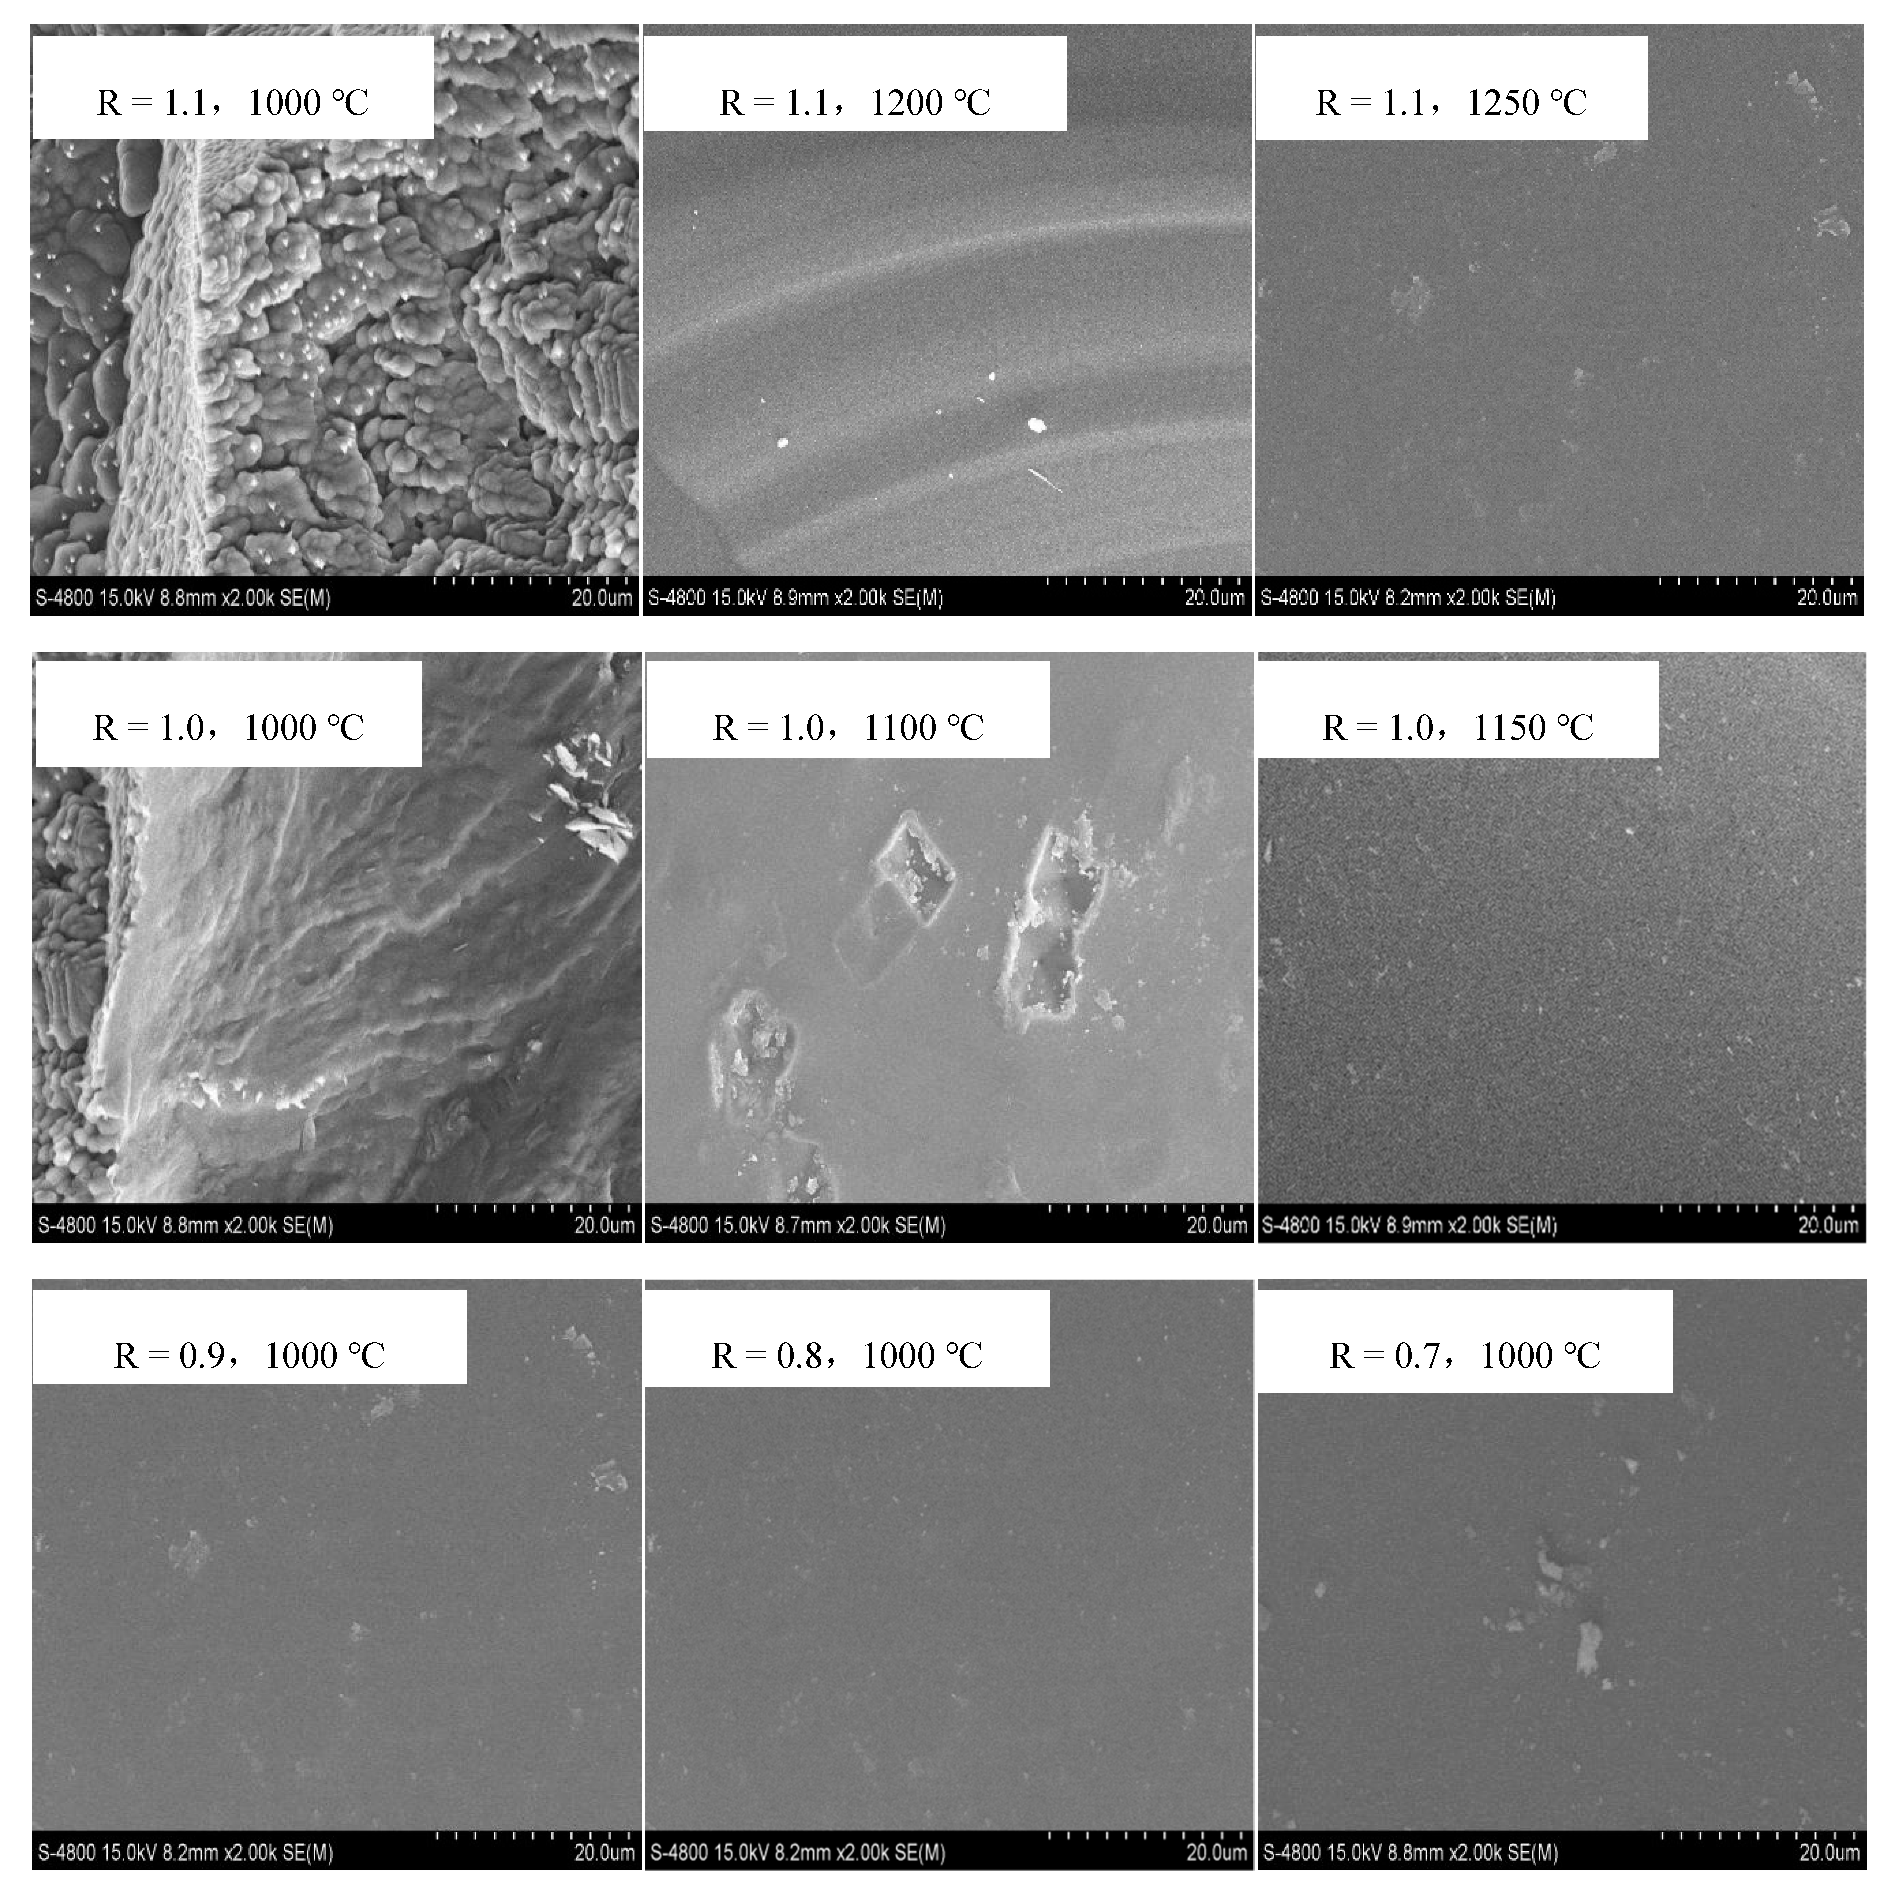
Figure 5 shows the microstructure of BFS with different basicities cooling to the specified temperatures. When the basicity was 1.1, there was basically no crystallization precipitation when the slag was cooled to 1250 °C, and the surface of the slag was smooth glass phase. When the temperature cooled to 1200 °C, the strip crystallization phase began to precipitate, but there were still more amorphous phases and the surface was still smooth. When the temperature decreased to 1000 °C, a large number of bulk crystallization phases were precipitated from the BFS, which indicated that the initial crystallization temperature of BFS should be 1200 °C. When the basicity decreased to 1.0, some of the crystallization phases began to precipitate when the temperature decreased to 1100 °C, which showed the initial crystallization temperature, and the temperature was lower than that of the BFS with basicity 1.1. When the basicity continued to decrease to 0.9–0.7, there was no crystallization phase when the temperature decreased to 1000 °C, and the microstructure was basically a smooth surface, which showed that the initial crystallization temperature of BFS was still below this temperature. The above results further confirmed that the initial crystallization temperature of BFS decreased gradually with the decrease of basicity, which matched with the thermodynamic simulation results. However, the temperature of the initial crystallization phase was slightly lower than that of the thermodynamic simulation temperature, mainly because the thermodynamic simulation was carried out under the condition of complete equilibrium, and the reaction was more equal. The mineral analysis experiment cooled the slag in the furnace at a specified temperature, the cooling process was faster, and the crystallization temperature was slightly lower.

3.3. DSC Analysis

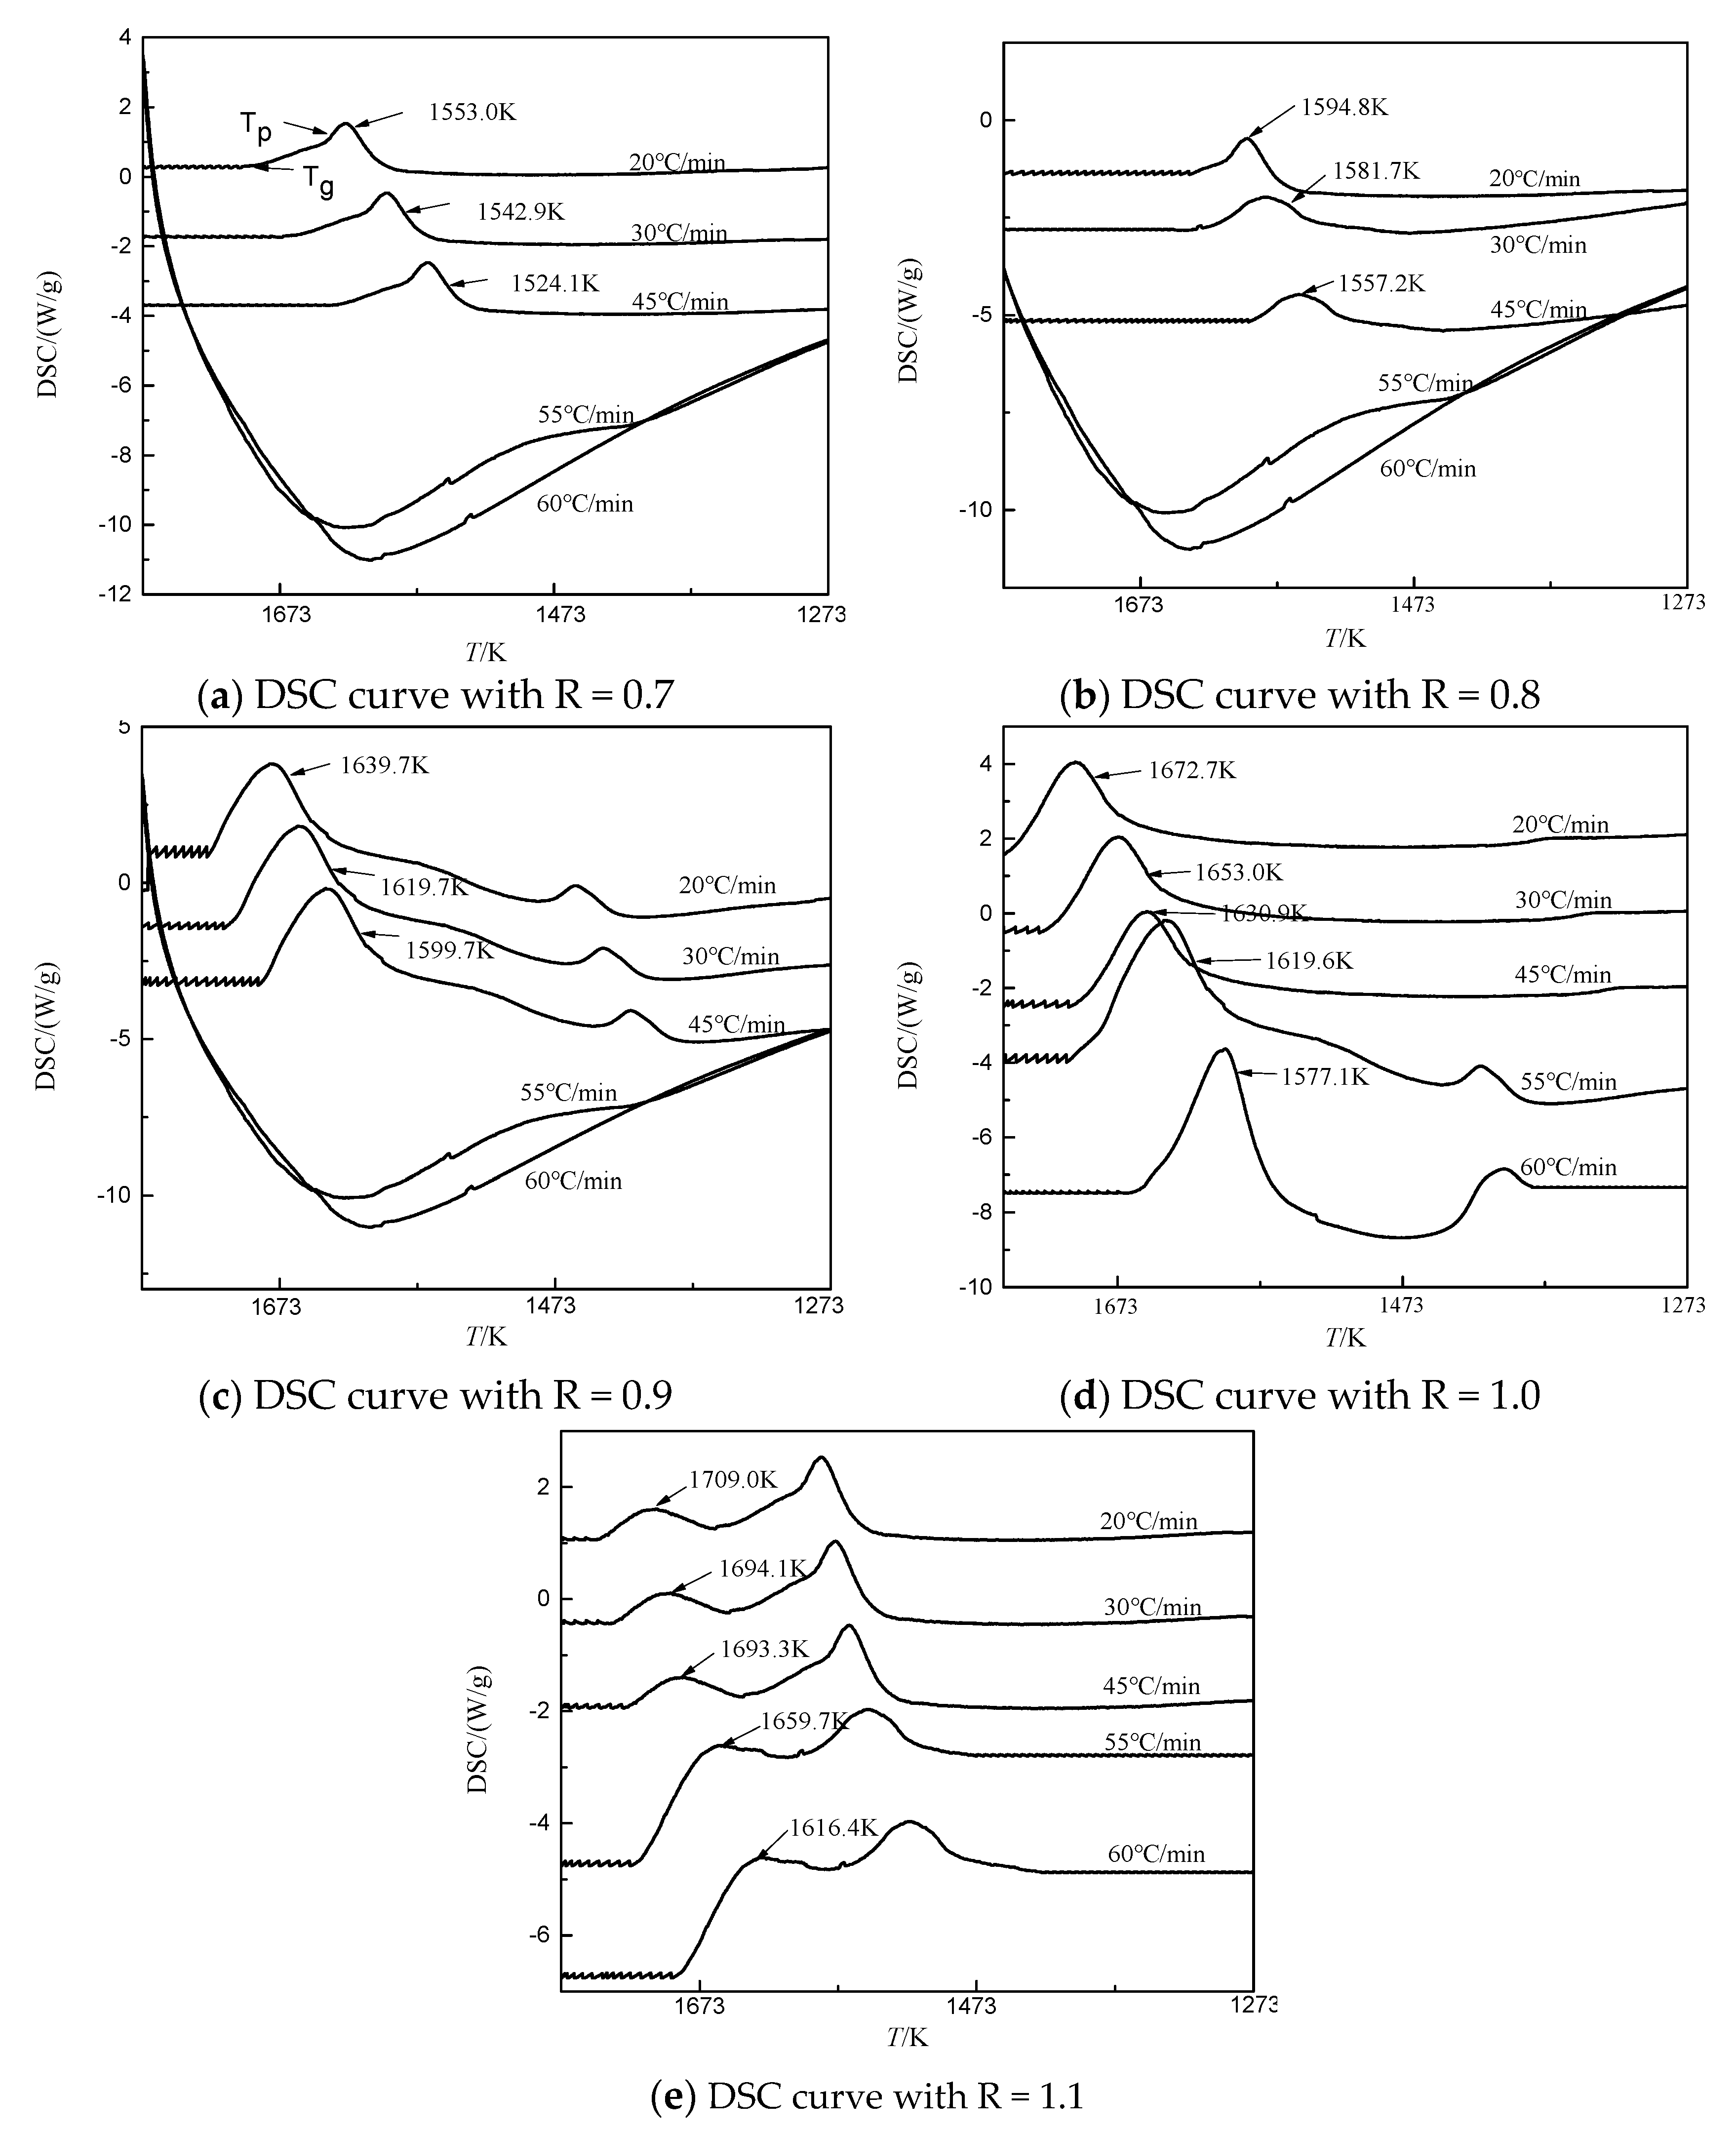
The crystallization ability of BFS with different basicities was further investigated using kinetic differential scanning calorimeter (DSC) methods, as shown in Figure 6. The DSC curve was characterized by the endothermic peak represented by Tg (glass transition temperature), and the exothermic peak represented by Tp (crystallization peak temperature). In order to restrain the precipitation of crystallization phase in BFS as much as possible and obtain more amorphous phase to increase the activity of slag beads, it was only necessary to study the precipitation temperature of the initial crystallization phase of BFS, thus determining the gas quenching temperature. So only the values of the first Tp for each curve were taken, analyzed using Proteus analysis software, and the values were listed in Table 4.
As shown in Figure 6a–e, there were obvious exothermic peaks at the cooling rates from 20 °C/min to 45 °C/min, whereas basically no peaks were observed when the cooling rate was higher than 55 °C/min with basicities lower than 0.9. The initial crystallization temperature, which was the first exothermic peak temperature, decreased with the basicity decreased at the same cooling rate, which indicated that the greater the basicity, the stronger the slag crystallization capability. It was mainly because the Ca2+ content increased with increase of the basicity, so that the main viscous flow unit SixOy2− disintegrated in the slag. The viscosity of BFS decreased, so that the atoms in the slag only needed a small amount of energy to overcome the crystallization barrier from one equilibrium position to another [17,18]. At the same basicity, the crystallization temperature of BFS decreased gradually with the increase of cooling rate. When the basicity was less than 0.9 and the cooling rate was greater than 55 °C/min, the crystallization of BFS could be restrained. Overall, the decrease of basicity could restrain crystallization precipitation, and the slag with higher basicity could obtain higher amorphous content by increasing the cooling rate.
The crystallization ability of melt in the DSC kinetics analysis is usually characterized by the crystallization activation energy (Ec). When a melt changes from the glass state to the crystalline state, it is necessary to overcome rearrangements of the structural units, and the energy required for this is usually characterized by the crystallization activation energy. The more energy required, the more difficult the crystallization. The Johnson–Mehl–Avrami (JMA) equation which is the classical theoretical equation usually used to analyze Ec, which is mainly used to study the crystallization kinetics of the melt.
The Kissinger method [19,20], in which crystallization is treated as a first-order reaction, is the method most commonly used to analyze crystallization kinetics based on the JMA equation, which is shown as follows:
In ( β T p 2 ) = Ec RTp + C
where β is defined as the cooling rate in DSC curves, Tp is the crystallization peak temperature of DSC curves, and R is the gas constant.
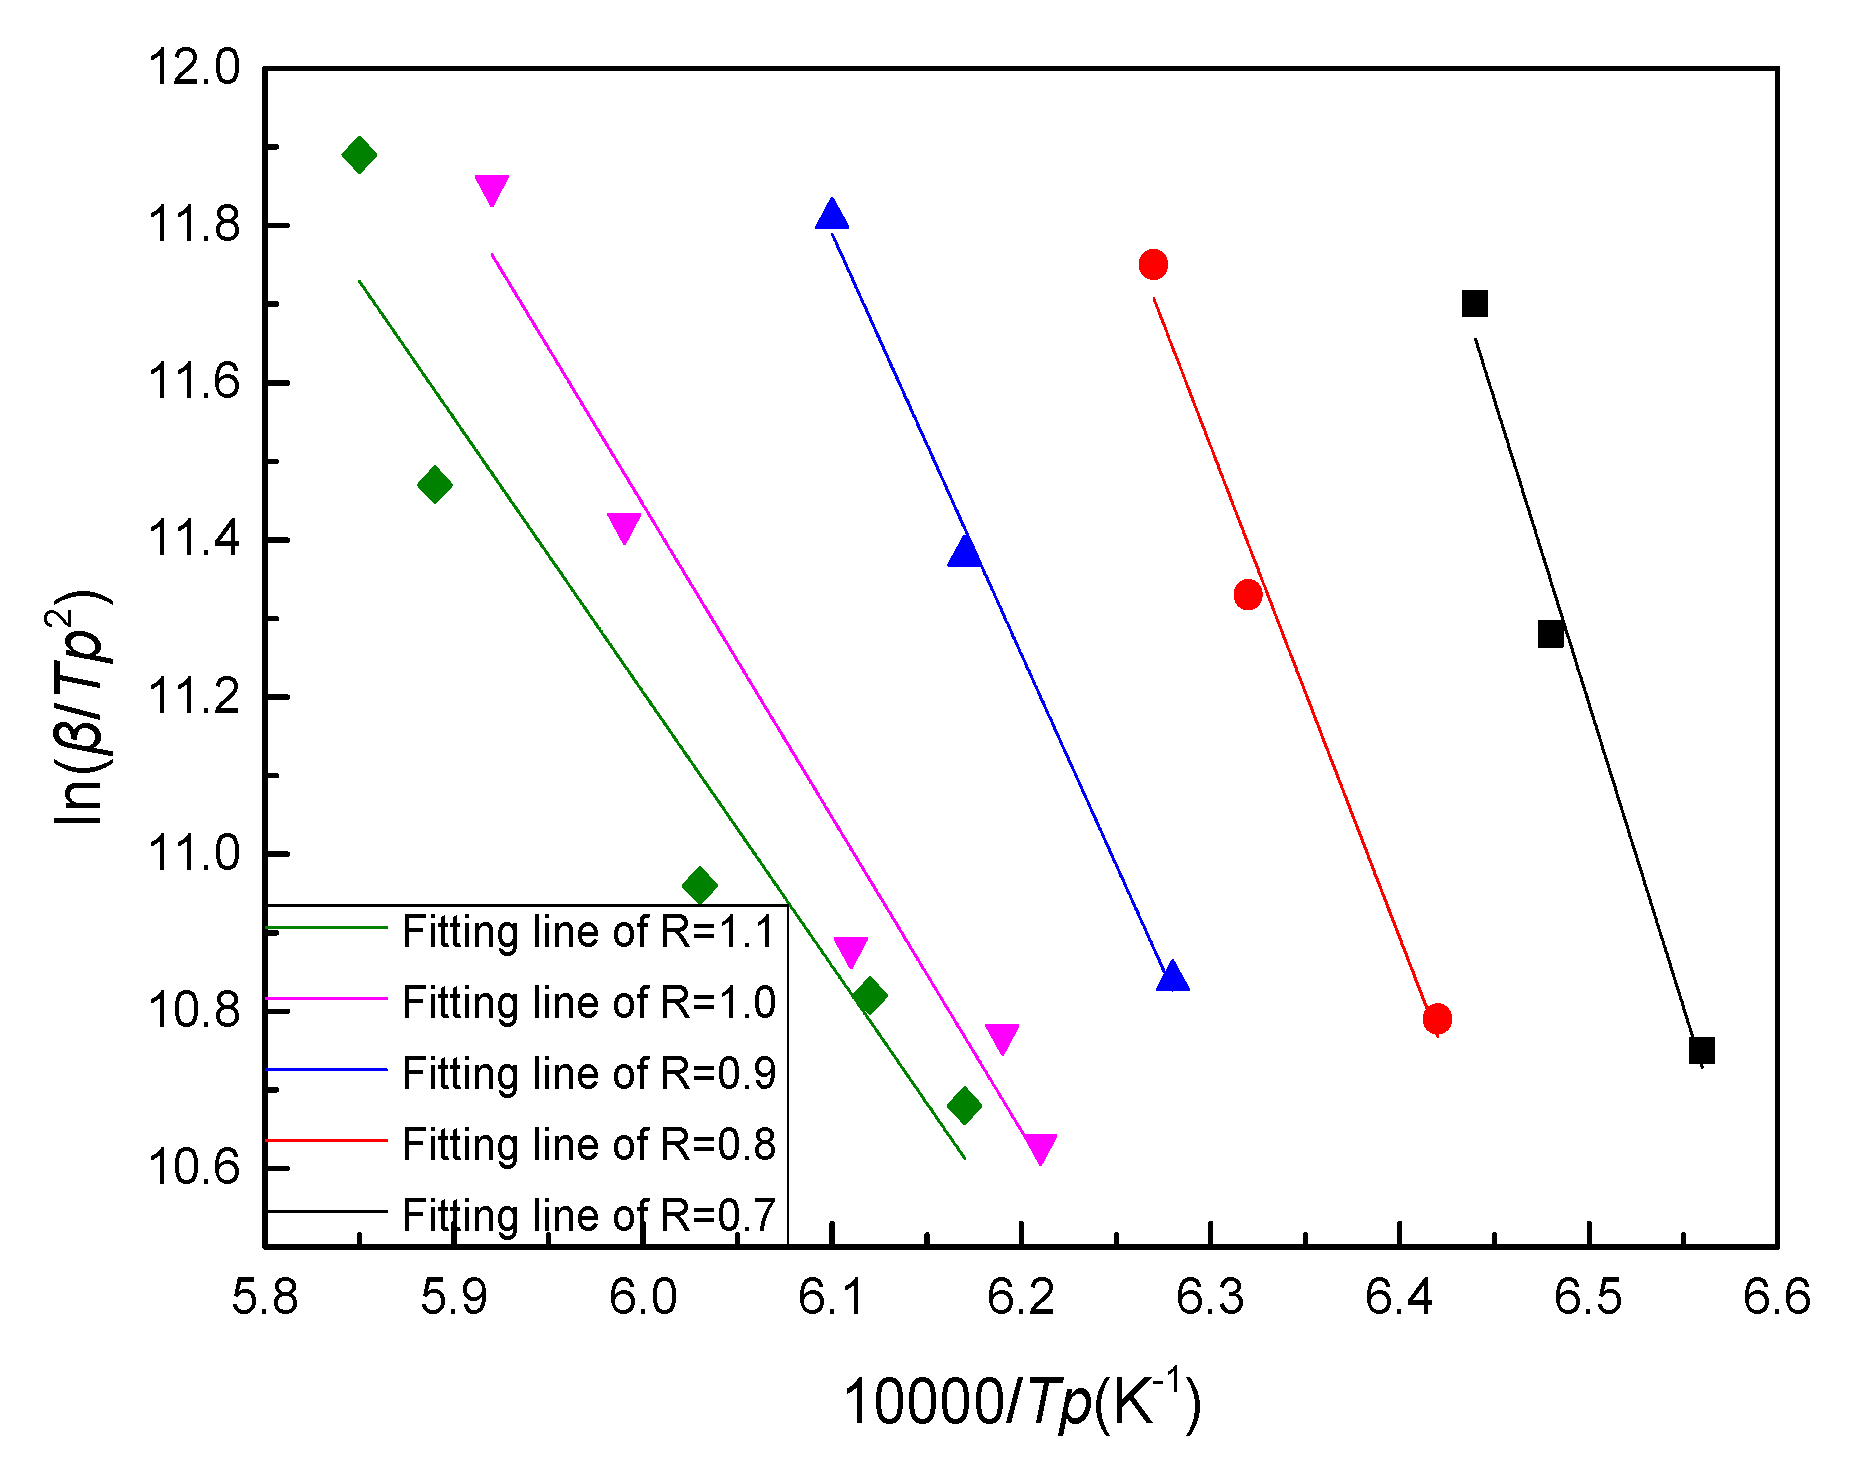
The Tp corresponding to different cooling rate β was obtained using Proteus analysis software in the DSC diagram, and then the ln(β/Tp2) values could be calculated separately. The corresponding ln(β/Tp2) values under different 10,000/Tp were plotted by Origin drawing software, and the fitting curves were obtained by fitting each numerical point. By plotting ln(β/Tp2) versus 10,000/Tp curves and fitting them to the straight lines shown in Figure 7, the fitting equations and R2 could be obtained as shown in Table 5. Ec could be calculated from the slopes of the fitting lines listed in Table 4.
The Ozawa [19] method is another method widely used to calculate Ec, the equation is as follows:
In β = Ec RTp + C
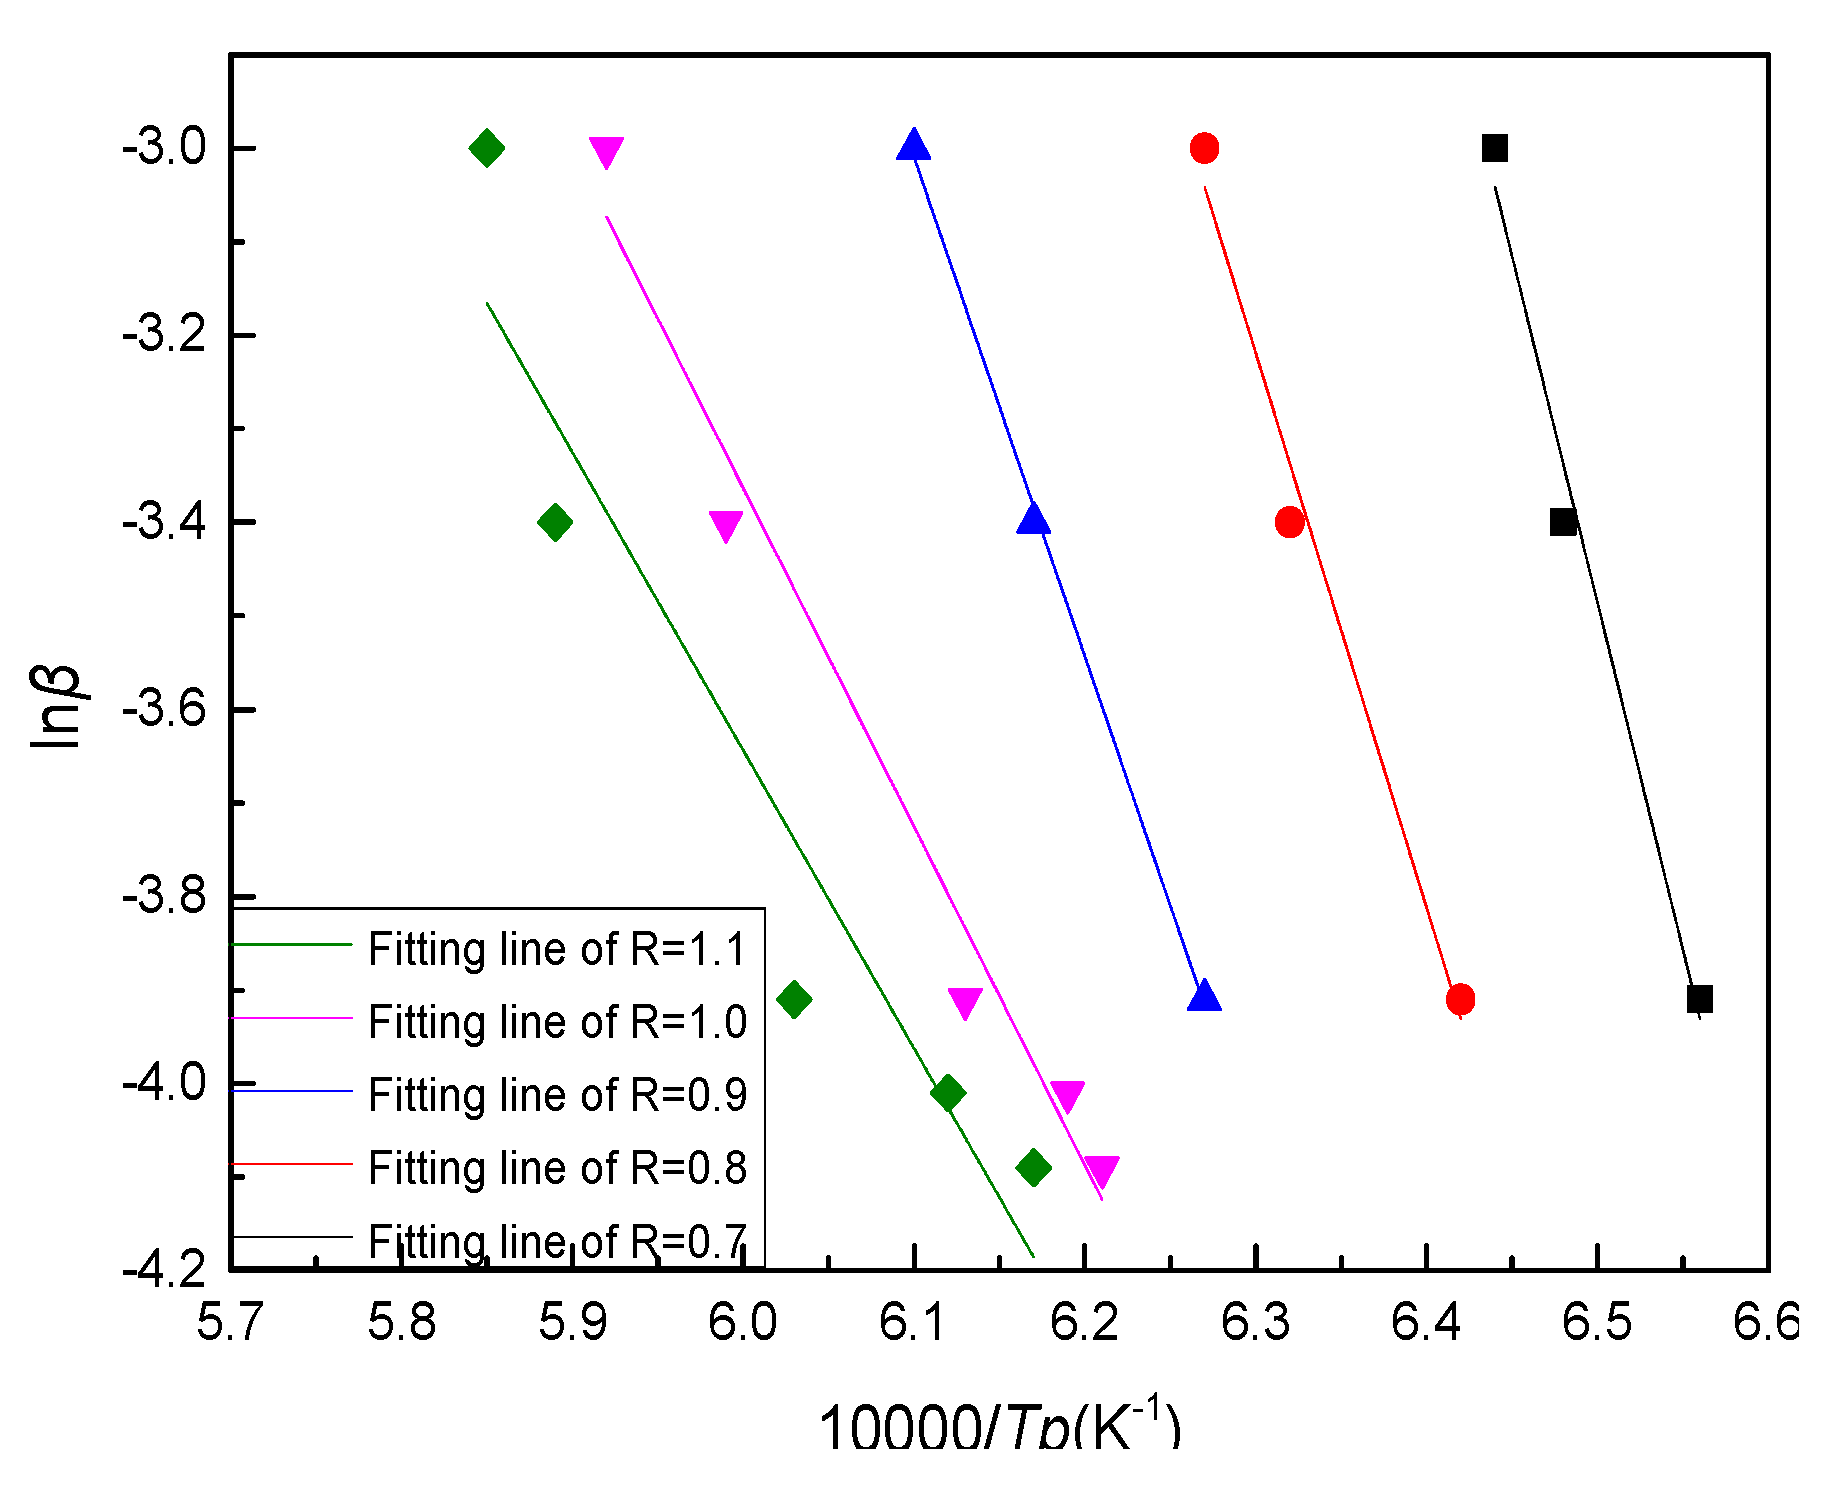
By plotting ln(β/Tp2) versus 10,000/Tp curves and fitting them to the straight lines shown in Figure 8, the fitting equations and R2 could be obtained as shown in Table 6. Ec could be calculated from the slopes of the fitting lines listed in Table 4.
As shown in Table 4, all the results showed that the Ec increased when basicity decreased. This indicated that when the basicity was small, the atom needed more energy to overcome increasingly large rearrangement barriers of structural units, so the state was not easy to change, therefore the crystallization of BFS could be restrained by decreasing basicity. All of these showed that decreasing basicity of BFS could effectively inhibit crystallization precipitation in BFS and prepare slag beads with high amorphous phase content.
3.4. Effect of Slag Beads with Different Basicities on Concrete Properties

The influence of different basicities of slag beads on the compression strength of concrete at different ages was studied by using slag beads as aggregate. As shown in Table 7, with the decrease of basicity, the compression strength of concrete increased gradually at different ages, thus could greatly improve the safety performance of concrete. This was mainly because with the decrease of basicity, the amorphous phase content of slag beads increased, which led to the activity of slag beads increasing gradually. Adding the slag beads as admixture to concrete, the active substance in slag beads and Ca(OH)2 produced by hydration of C2S in cement further reacted to produce hydrated calcium silicate, which could be used to fill the pores of concrete and increase its density, so as to enhance the strength of the concrete.

4. Conclusions

The components of the BFS with the basicity of 0.7–1.1 was different, and the type and quantity of the precipitated minerals were different in the whole cooling process. The initial crystallization phases were all melilite, and the crystallization temperature of BFS were 1280.40 °C, 1329.70 °C, 1370.4 °C, 1403.20 °C, and 1427.40 °C with the increase of basicity. The increase of basicity promoted the precipitation of melilite and spinel, and inhibited the precipitation of anorthite, pyroxene and wollastonite. The initial crystallization temperature of the BFS was determined by the melilite’s initial crystallization phase and it decreased gradually with the decrease of basicity, thereby decreasing the basicity could increase the gas quenching temperature range of BFS to obtain more amorphous phase. With the decrease of basicity, the activity of slag beads increased gradually, which significantly improved the compression strength of concrete.
The crystallization activation energy of BFS with basicity 0.7 was 643 kJ/mol, which was much higher than that of 290 kJ/mol of BFS with basicity 1.1. It could effectively inhibit the crystallization precipitation and was more beneficial to prepare amorphous slag beads by decreasing basicity and increasing cooling rate. There was basically no crystal precipitated when the cooling rate was higher than 55 °C/min with basicity lower than 0.9. The results of the XRD analysis and the results of the DSC dynamics verified with the results of the thermodynamic simulation.

Author Contributions

Y.K. wrote this draft and analyzed the results, C.L. performed the calculation, Y.Z. and H.X. provided suggestions and comments. All authors have read and agreed to the published version of the manuscript.

Funding

This research was funded by Hsebei Key Research and Development Program of China (19273806D).

Acknowledgments

The calculations and experiments were done with the help of the teachers in the research group.

Conflicts of Interest

The authors declare no conflict of interest.

References

  1. Murthy, I.N.; Rao, J.B. Granulated blast furnace slag: Potential sustainable material for foundry applications. J. Sustain. Metall. 2007, 3, 495–514. [Google Scholar] [CrossRef]
  2. Wu, J.J.; Wang, H.; Zhu, X.; Liao, Q.; Ding, B. Centrifugal granulation performance of liquid with various viscosities for heat recovery of blast furnace slag. Appl. Therm. Eng. 2015, 89, 494–504. [Google Scholar] [CrossRef]
  3. Liu, J.X.; Yu, Q.B.; Li, P.; Dou, C.X.; Hu, X.Z. Experimental study on dry-granulation of molten blast furnace slag. Iron. Steel. 2010, 45, 95–98. [Google Scholar]
  4. Zhou, Y.M.; Li, C.L.; Xu, L.; Luo, S.Y.; Yi, C.J. The Experimental study of molten blast furnace slag dry granulation. Adv. Mater. Res. 2012, 356, 1882–1885. [Google Scholar]
  5. Shen, H.T.; Forssberg, E. An overview of recovery of metals from slag. Waste Manag. 2003, 23, 933–949. [Google Scholar] [CrossRef]
  6. Usón, A.A.; López-Sabirón, A.M.; Ferreira, G.; Sastresa, E.L. Uses of alternative fuels and raw materials in the cement industry as sustainable waste management options. Renew. Sustain. Energy Rev. 2013, 23, 242–260. [Google Scholar] [CrossRef]
  7. Sadek, D.M. Effect of cooling technique of blast furnace slag on the thermal behavior of solid cement bricks. J. Clean. Prod. 2014, 79, 134–141. [Google Scholar] [CrossRef]
  8. Liu, J.; Yu, Q.; Zuo, Z. Blast furnace slag obtained from dry granulation method as a component in slag cement. Constr. Build. Mater. 2017, 131, 381–387. [Google Scholar] [CrossRef]
  9. Mostafa, N.Y.; Ei-Hemaly, S.A.S.; Al-Wakeel, E.I.; EI-Korashy, S.A.; Brown, P.W. Characterization and evaluation of the hydraulic activity of water-cooled slag and air-cooled slag. Cem. Concr. Res. 2001, 31, 899–904. [Google Scholar] [CrossRef]
  10. Fredericci, C.; Zanotto, E.D.; Ziemath, E.C. Crystallization mechanism and properties of a blast furnace slag glass. J. Non-Cryst. Solids. 2000, 273, 64–75. [Google Scholar] [CrossRef]
  11. Kashiwaya, Y.; Nakauchi, T.; Pham, K.S. Crystallization behaviors concerned with TTT and CCT diagrams of blast furnace slag using hot thermocouple technique. ISIJ Int. 2007, 47, 44–52. [Google Scholar] [CrossRef] [Green Version]
  12. Francis, A.A. Non-isothermal crystallization kinetics of a blast furnace slag glass. J. Am. Ceram. Soc. 2005, 88, 1859–1863. [Google Scholar] [CrossRef]
  13. Decterov, S.A.; Jung, I.H.; Jak, E.; Kang, Y.B.; Hayes, P.; Pelton, A.D. Thermodynamic modeling of the Al2O3-CaO-CoO-CrO-Cr2O3-FeO-Fe2O3-MgO-MnO-NiO2-SiO2-S system and applications in ferrous process metallurgy. In Proceedings of the Conference on Molten Slags, Fluxes and Salts, Johannesburg, South African, 24–28 January 2004; pp. 839–849. [Google Scholar]
  14. Jung, I.H.; Decterov, S.; Pelton, A.D. Thermodynamic modeling of the CaO-MgO-SiO2 system. J. Eur. Ceram. Soc. 2005, 25, 313–333. [Google Scholar] [CrossRef]
  15. Mysen, B.O.; Mysen, V.D.; Scarfe, C.M. Relations betweenthe anionic structure and viscosity of silicate melts-A ramanspectroscopic study. Am. Mineral. 1980, 65, 690–710. [Google Scholar]
  16. Shu, L.S. Physical Geology, 3rd ed.; Geological Publishing House: Beijing, China, 2010; pp. 8–20. [Google Scholar]
  17. Tang, X.L.; Zhang, Z.T.; Guo, M.; Zhang, M.; Wang, X.D. Viscosities Behavior of CaO-SiO2-MgO-Al2O3 Slag With Low Mass Ratio of CaO to SiO2 and Wide Range of A12O3 Content. J. Iron Steel Res. Int. 2011, 18, 1–6. [Google Scholar] [CrossRef]
  18. Zhang, Y.; Tang, J.; Chu, M.S.; Liu, Y.; Chen, S.Y.; Xue, X.X. Optimization of BF Slag for high Cr2O3 vanadium-titanium magnetite. J. Iron Steel Res. Int. 2014, 21, 144–150. [Google Scholar] [CrossRef]
  19. Ai, X.B.; Bai, H.; Zhao, L.H.; Cang, D.Q.; Tang, Q. Thermodynamic analysis and formula optimization of steel slag based ceramic materials by Factsage software. Int. J. Min. Met. Mater. 2013, 20, 379–385. [Google Scholar] [CrossRef]
  20. Gan, L.; Zhang, C.; Zhou, J.; Shangguan, F.Q. Continuous cooling crystallization kinetics of a molten blast furnace slag. J. Non-Cryst. Solids 2012, 358, 20–24. [Google Scholar] [CrossRef]
Figure 1. Mineral crystallization diagram of the BFS with different basicities. (a) R = 0.7; (b) R = 0.8; (c) R = 0.9; (d) R = 1.0; (e) R = 1.1.
Crystals 10 00030 g001aCrystals 10 00030 g001b
Figure 2. Crystallization temperature and crystallization amount for minerals with different basicities.
Crystals 10 00030 g002
Figure 3. Phase diagram of the BFS with different basicities.
Crystals 10 00030 g003
Figure 4. XRD analysis of BFS with different basicities.
Crystals 10 00030 g004
Figure 5. SEM analysis of BFS with different basicities.
Crystals 10 00030 g005
Figure 6. DSC curves of BFS at different basicities: (a) R = 0.7; (b) R = 0.8; (c) R = 0.9; (d) R = 1.0; (e) R = 1.1.
Crystals 10 00030 g006
Figure 7. Crystallization activation energy (Ec) calculated using the Kissinger method.
Crystals 10 00030 g007
Figure 8. Crystallization activation energy (Ec) calculated using the Ozawa method.
Crystals 10 00030 g008
Table 1. The components of blast furnace slag (BFS) (wt%).
ComponentsSiO2CaOMgOAl2O3Fe2O3TiO2K2ONa2OMnO
BFS33.5336.258.6415.821.571.380.540.320.17
Table 2. Components of BFS for experiment.
No.BFS/gAddition Amount/gR(wCaO)/(wSiO2)
CaOMgOAl2O3SiO2
11004.923.466.3325.290.7
21008.193.466.3322.020.8
310011.113.466.3319.100.9
410013.743.466.3316.471.0
510016.133.466.3314.081.1
Table 3. The viscosity of BFS with different basicities/(Pa·s).
R0.70.80.91.01.1
1350 °C1.9891.5121.2271.0811.048
1400 °C1.2590.9760.8120.7170.672
1450 °C0.8520.6690.5670.4970.493
1500 °C0.6030.4330.4220.3860.322
Table 4. Crystallization activation energy (Ec) calculated using different methods/(kJ/mol).
RKissingerOzawa
0.7643 ± 80616 ± 75
0.8520 ± 62493 ± 60
0.9445 ± 27417 ± 14
1.0331 ± 36301 ± 27
1.1290 ± 44265 ± 47
Table 5. The fitting equations and R2.
RFitting EquationsR2
0.7ln(β/Tp2) = −(7.73/Tp) + 61.450.96971
0.8ln(β/Tp2) = −(6.26/Tp) + 50.940.97224
0.9ln(β/Tp2) = −(5.35/Tp) + 44.400.99227
1.0ln(β/Tp2) = −(3.98/Tp) + 35.340.95537
1.1ln(β/Tp2) = −(3.49/Tp) + 32.130.91386
Table 6. The fitting equations and R2.
RR2Fitting Equations
0.70.97112lnβ = −(7.41/Tp) + 44.68
0.80.97112lnβ = −(5.93/Tp) + 34.13
0.90.99797lnβ = −(5.34/Tp) + 29.54
1.00.97037lnβ = −(3.62/Tp) + 18.37
1.10.90151lnβ = −(3.19/Tp) + 15.48
Table 7. Compression strength of concrete at different ages/MPa.
RAge
3d7d28d
0.722.129.134.1
0.821.328.833.6
0.920.925.931.2
1.018.524.230.1
1.117.323.729.6