Article

Pb(Er1/2Nb1/2)O3–Pb(Zn1/3Nb2/3)O3–PbTiO3 Single Crystals with High Curie Temperature

Shaanxi Key Laboratory of Photoelectric Functional Materials and Devices, School of materials and Chemical Engineering, Xi’an Technological University, Xi’an 710021, China
*
Author to whom correspondence should be addressed.
Crystals 2020, 10(1), 22; https://doi.org/10.3390/cryst10010022
Submission received: 27 December 2019 / Revised: 2 January 2020 / Accepted: 3 January 2020 / Published: 5 January 2020

Abstract

:
In this work, 0.15Pb(Er1/2Nb1/2)O3–0.63Pb(Zn1/3Nb2/3)O3–0.22PbTiO3 (15PEN–63PZN–22PT) single crystals with a pure perovskite structure are obtained through the flux method. The phase structure, dielectric, ferroelectric properties and upconversion photoluminescence of the crystals are studied. The ternary crystals along the [110] orientation have a high Curie temperature (Tc = 250 °C) and large coercive field (Ec = 11.0597 kV/cm) which are higher than those of crystals reported previously. Furthermore, the PEN–PZN–PT crystals are produced with a strong green light excited by a 980 nm laser. Being in the range 298–478 K, the emission intensity of all peaks decreases with increase in temperature. The absolute quantum yield (QY) for the crystals is 0.00059%. These excellent properties provide new possibilities for multifunctional materials of optoelectronic devices.

1. Introduction

In recent years, due to their remarkable piezoelectricity and dielectricity, relaxor ferroelectric materials have been widely investigated [1,2,3,4,5]. Pb(Zn1/3Nb2/3)O3xPbTiO3 (PZN–xPT) ferroelectric crystals with a composition near the morphotropic phase boundary (MPB) show a prominent piezoelectricity of d33 = 2000–2500 pC/N and electromechanical coupling factors of k33 = 90%–92% [6,7,8,9]. These remarkable electric performances make PZN–9PT single crystals a promising candidate for electromechanical devices, including underwater sonar, sensors, and medical imaging, etc. [10,11].
However, the Curie temperature (Tc ~170 °C) and coercive field (Ec ~3.5 kV/cm) of PZN-9PT single crystals are relatively low [12,13,14]. All of these shortcomings make PZN-PT unsuitable for high-power applications and high temperature working environments.
Lately, to meet the needs of high power and high temperature application, the coercive field and the Curie temperature of PZN–PT-based crystals have been increased to some extent by forming ternary solid solution systems such as Pb(Ni1/3Nb2/3)O3–Pb(Zn1/3Nb2/3)O3–PbTiO3 (PNN–PZN–PT) [15,16], Pb(In1/2Nb1/2)O3–Pb(Zn1/3Nb2/3)O3–PbTiO3 (PIN–PZN–PT) [17], Pb(Lu1/2Nb1/2)O3-Pb(Zn1/3Nb2/3)O3–PbTiO3 (PLN–PZN–PT) [18], and Pb(Yb1/2Nb1/2)O3–Pb(Zn1/3Nb2/3)O3–PbTiO3 (PYN–PZN–PT) [19]. A. Salak prepared Pb(Er1/2Nb1/2)O3 (PEN) ceramics with a perovskite structure under high temperature and high pressure condition without precedent [20]. The ceramics display an antiferroelectric phase at room temperature which transforms into a paraelectric phase when the temperature rises to about 347 °C [20]. PZN–PT together with PEN can form a ternary solid solution which contributes a lot to the increase in the coercive field and Curie temperature of the crystals. Furthermore, PEN can achieve upconversion luminescence. Hence, PZN–PT modified by PEN may have potential application in optical-electrical devices.
In this paper we incorporate PEN into PZN–PT single crystals to form a new system. It is anticipated that the new material possesses a high coercive field and Curie temperature, as well as good electric and optical properties. Firstly, we design the components of PEN–PZN–PT crystals using linear rules and grow PEN–PZN–PT single crystals using the flux technique. Secondly, we investigate the structure and electric (dielectric and ferroelectric) and optical (optical absorption, upconversion (UC) luminescence, and absolute quantum yield (QY) properties of PEN–PZN–PT crystals.

2. Experiments

The composition of 15PEN–63PZN–22PT crystals is determined by the linear rule, with the linear rule being that in a ternary system, the two components near the MPBs in PZN–9PT and PEN–50PT are connected by a straight line, and most compositions on a straight line have an MPB structure [21]. The crystals were obtained by the traditional flux method. In order to eliminate the pyrochlore phase and thereby increase the yield of perovskite, the precursors ZnNb2O6 (ZN) and ErNbO4 (EN) were pre-synthesized at 1050 °C for 6 h and 1150 °C for 10 h, respectively [22]. The raw materials ZN, EN, PbO, and TiO2 powder, with a PbO excess of 70 wt.%, were wet-milled with ethanol for 10 h. After drying, the mixed raw material was first loaded into a platinum crucible and then the filled platinum crucible was placed in a corundum (Al2O3) crucible. Following this, the gap between the two crucibles was filled with alumina powder. Then, the corundum crucible was put into an ultrahigh temperature furnace and the crystals were grown according to the preset processes. After the crystal growth was completed, the platinum crucible was boiled in dilute nitric acid at a concentration of 50% and the crystals were separated.
Ground crystal powder and crystal wafers with polished parallel surfaces were prepared. The phase structure of the crystals was measured using an X-ray diffractometer (XRD-6000, Tokyo, Japan) with Cu target Kα (λ = 1154 nm). Micro morphology of the crystals was performed using a scanning electron microscope (SEM, Quanta 400F, FEI, Holland) and an energy dispersive system (EDS) spectrum was used to measure the elemental homogeneity of the crystals. The silver paste was spread evenly on the surface of the crystals and fired at 550 °C for 40 min to obtain electrodes. The dielectric constant behavior was tested using an E4980/GJW-I system (Agilent E4980A, Agilent, NM, USA) equipped with a temperature control system from 25 °C to 400 °C. Polarization–electric field hysteresis loops of the crystals were performed using a ferroelectric testing system (Radiant Precision Premier Ⅱ, Radiant Technologies, Inc. Albuquerque, NM, USA) at room temperature. To realize the luminescence characteristics of the sample, the UC photoluminescence and absolute quantum yield of the crystal powder were explored through photoluminescence spectrometry (FLS980, Edinburgh, UK).

3. Results and Discussion

Figure 1a shows an XRD profile of the crystal powder at room temperature. The results indicate that there is no pyrochlore or any other secondary structure, indicating that all the XRD diffraction peaks of the crystals belong to a pure perovskite structure (ABO3). Figure 1b shows an XRD pattern of the exposed surface of the crystal sample; two strong diffraction peaks were detected, corresponding to the (110) and (220) crystal planes, respectively, indicating that the crystal surface direction is a strict [110] orientation [23]. An SEM image of the surface of the crystal sample is shown in Figure 1c. The surface of the crystals is uneven; a large number of irregular pits and parallel growth steps can be observed. Figure 1d shows an energy dispersive system of four random points on the surface of the crystals. After comparing the mass percentages of the elements at four different locations, we were able to arrive at the conclusion that the crystal sample shows excellent element homogeneity. The calculated composition of the grown crystals is 12PEN–45PZN–43PT, which deviates from the nominal composition due to element segregation during the crystal growth process.
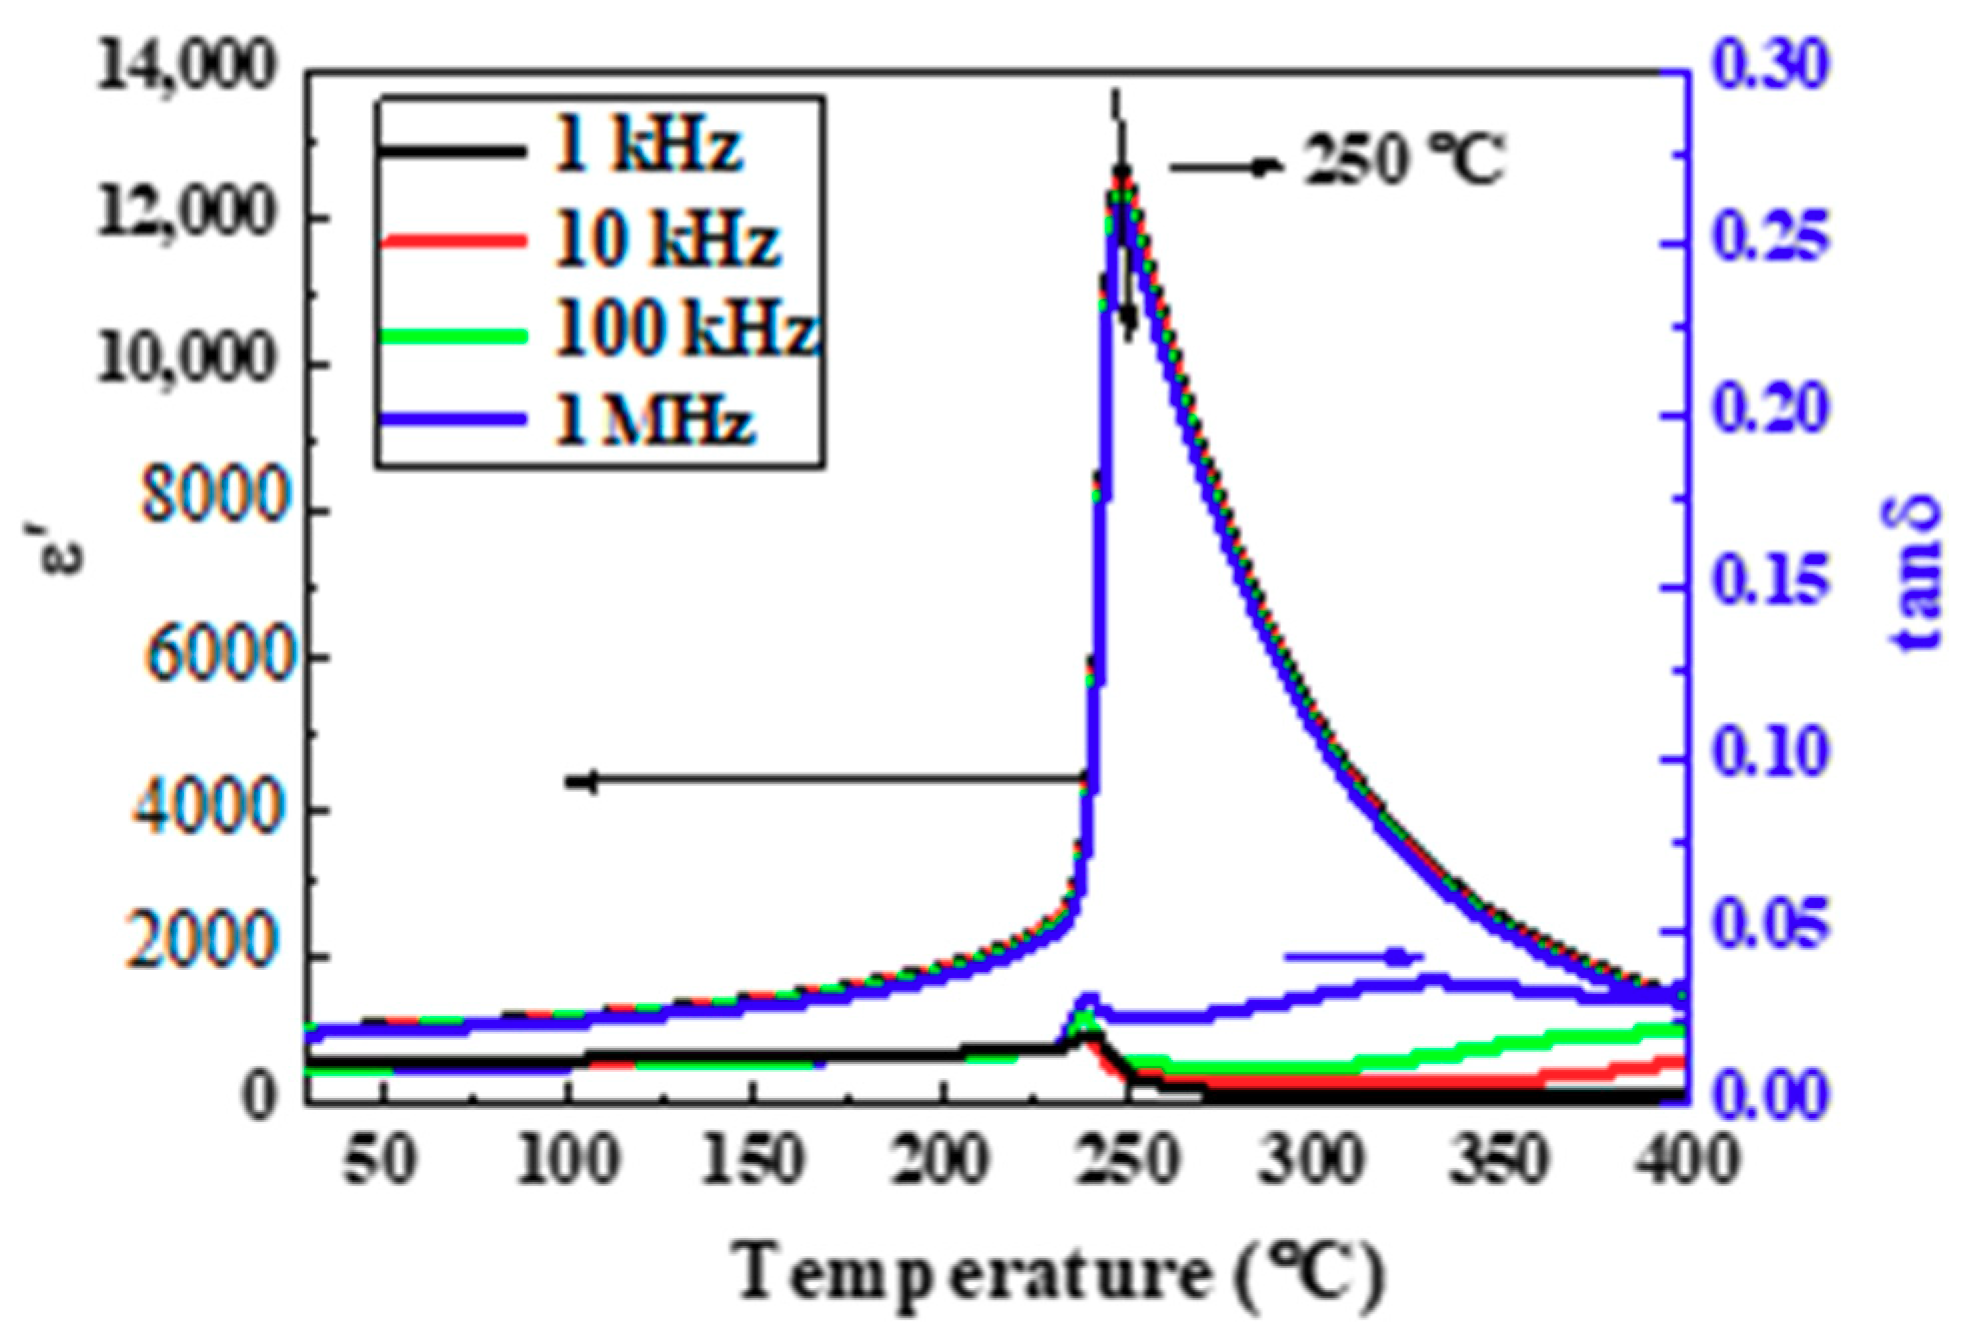
Figure 2 shows the dependence of the dielectric constant (ε′) and dielectric loss (tanδ) on the temperature of unpolarized crystals at different test frequencies (1 kHz to 1 MHz). The dielectric peak at 250 °C (Tc) is associated with the phase transition between ferroelectric and paraelectric phases, which is a significant improvement compared to the PZN–9PT system (Tc ~170 °C) [24] and the PEN–PMN–PT ternary system (Tc ~207 °C) [25]. Obviously, the existence of PEN can increase the Curie temperature of the PZN–PT system, due to the fact that Er3+ ions, which have a relatively large atomic radius, occupy the B position of the system, which makes the perovskite tolerance factor decrease in this system, and the rhombohedral or tetragonal phase to be relatively more stable.
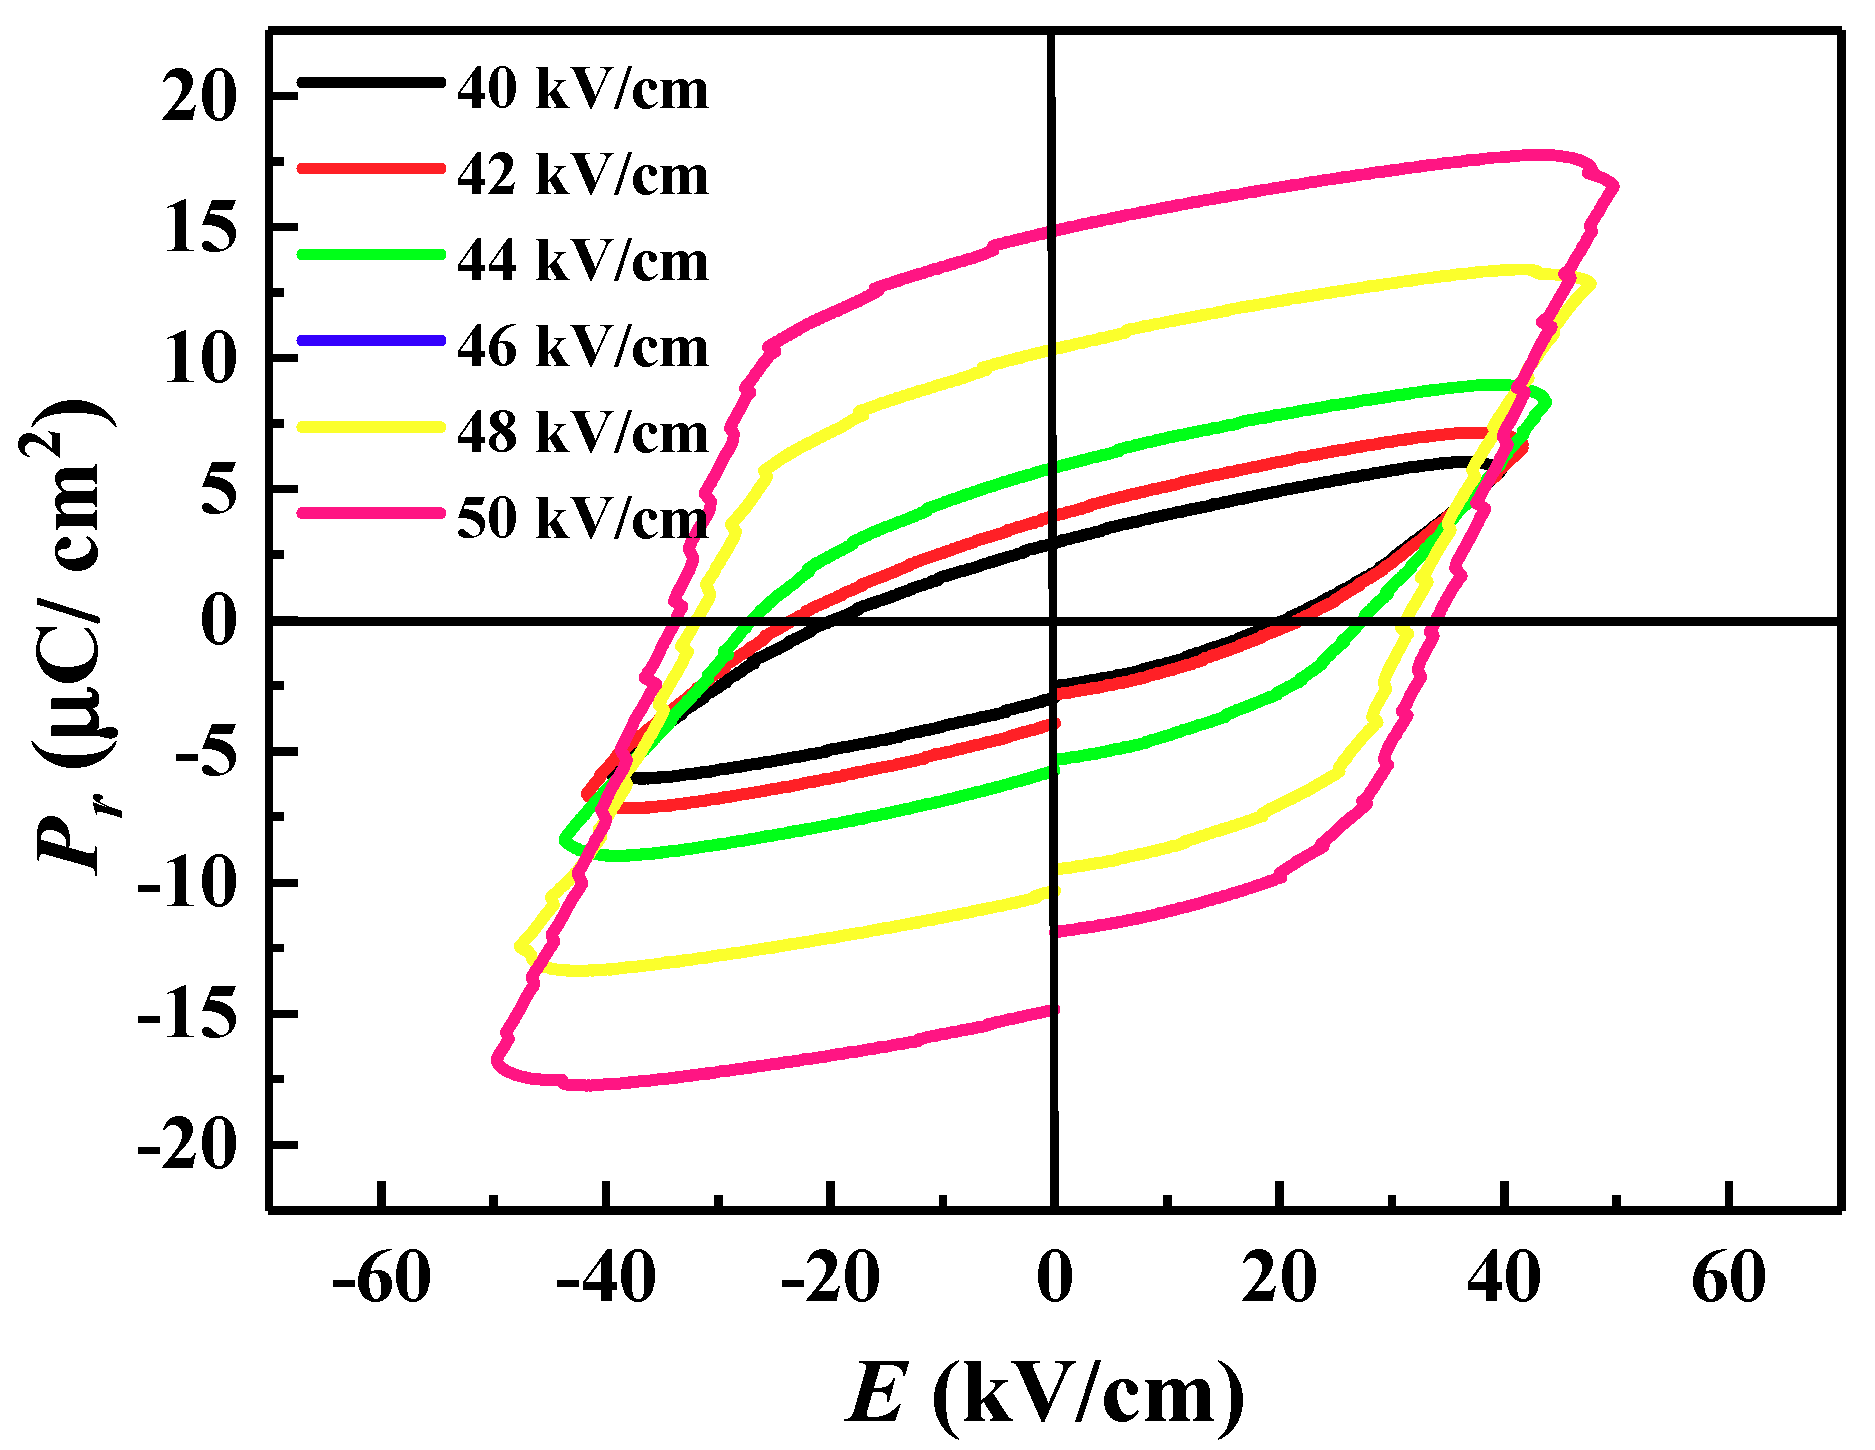
Polarization–electric field (P-E) hysteresis loops of crystals under different electric fields at room temperature are shown in Figure 3. At an electric field of 50 kV/mm, the residual polarization Pr and coercive field Ec are 14.88 μC/cm2 and 33.92 kV/cm, respectively. The Ec is about nine times higher than that of the PZN–9PT system, indicating that the ternary solid solution is an effective method with which to improve the coercive field for PZN–9PT crystals [23]. The higher coercive field gives the crystals potential application in high power piezoelectric devices [26].
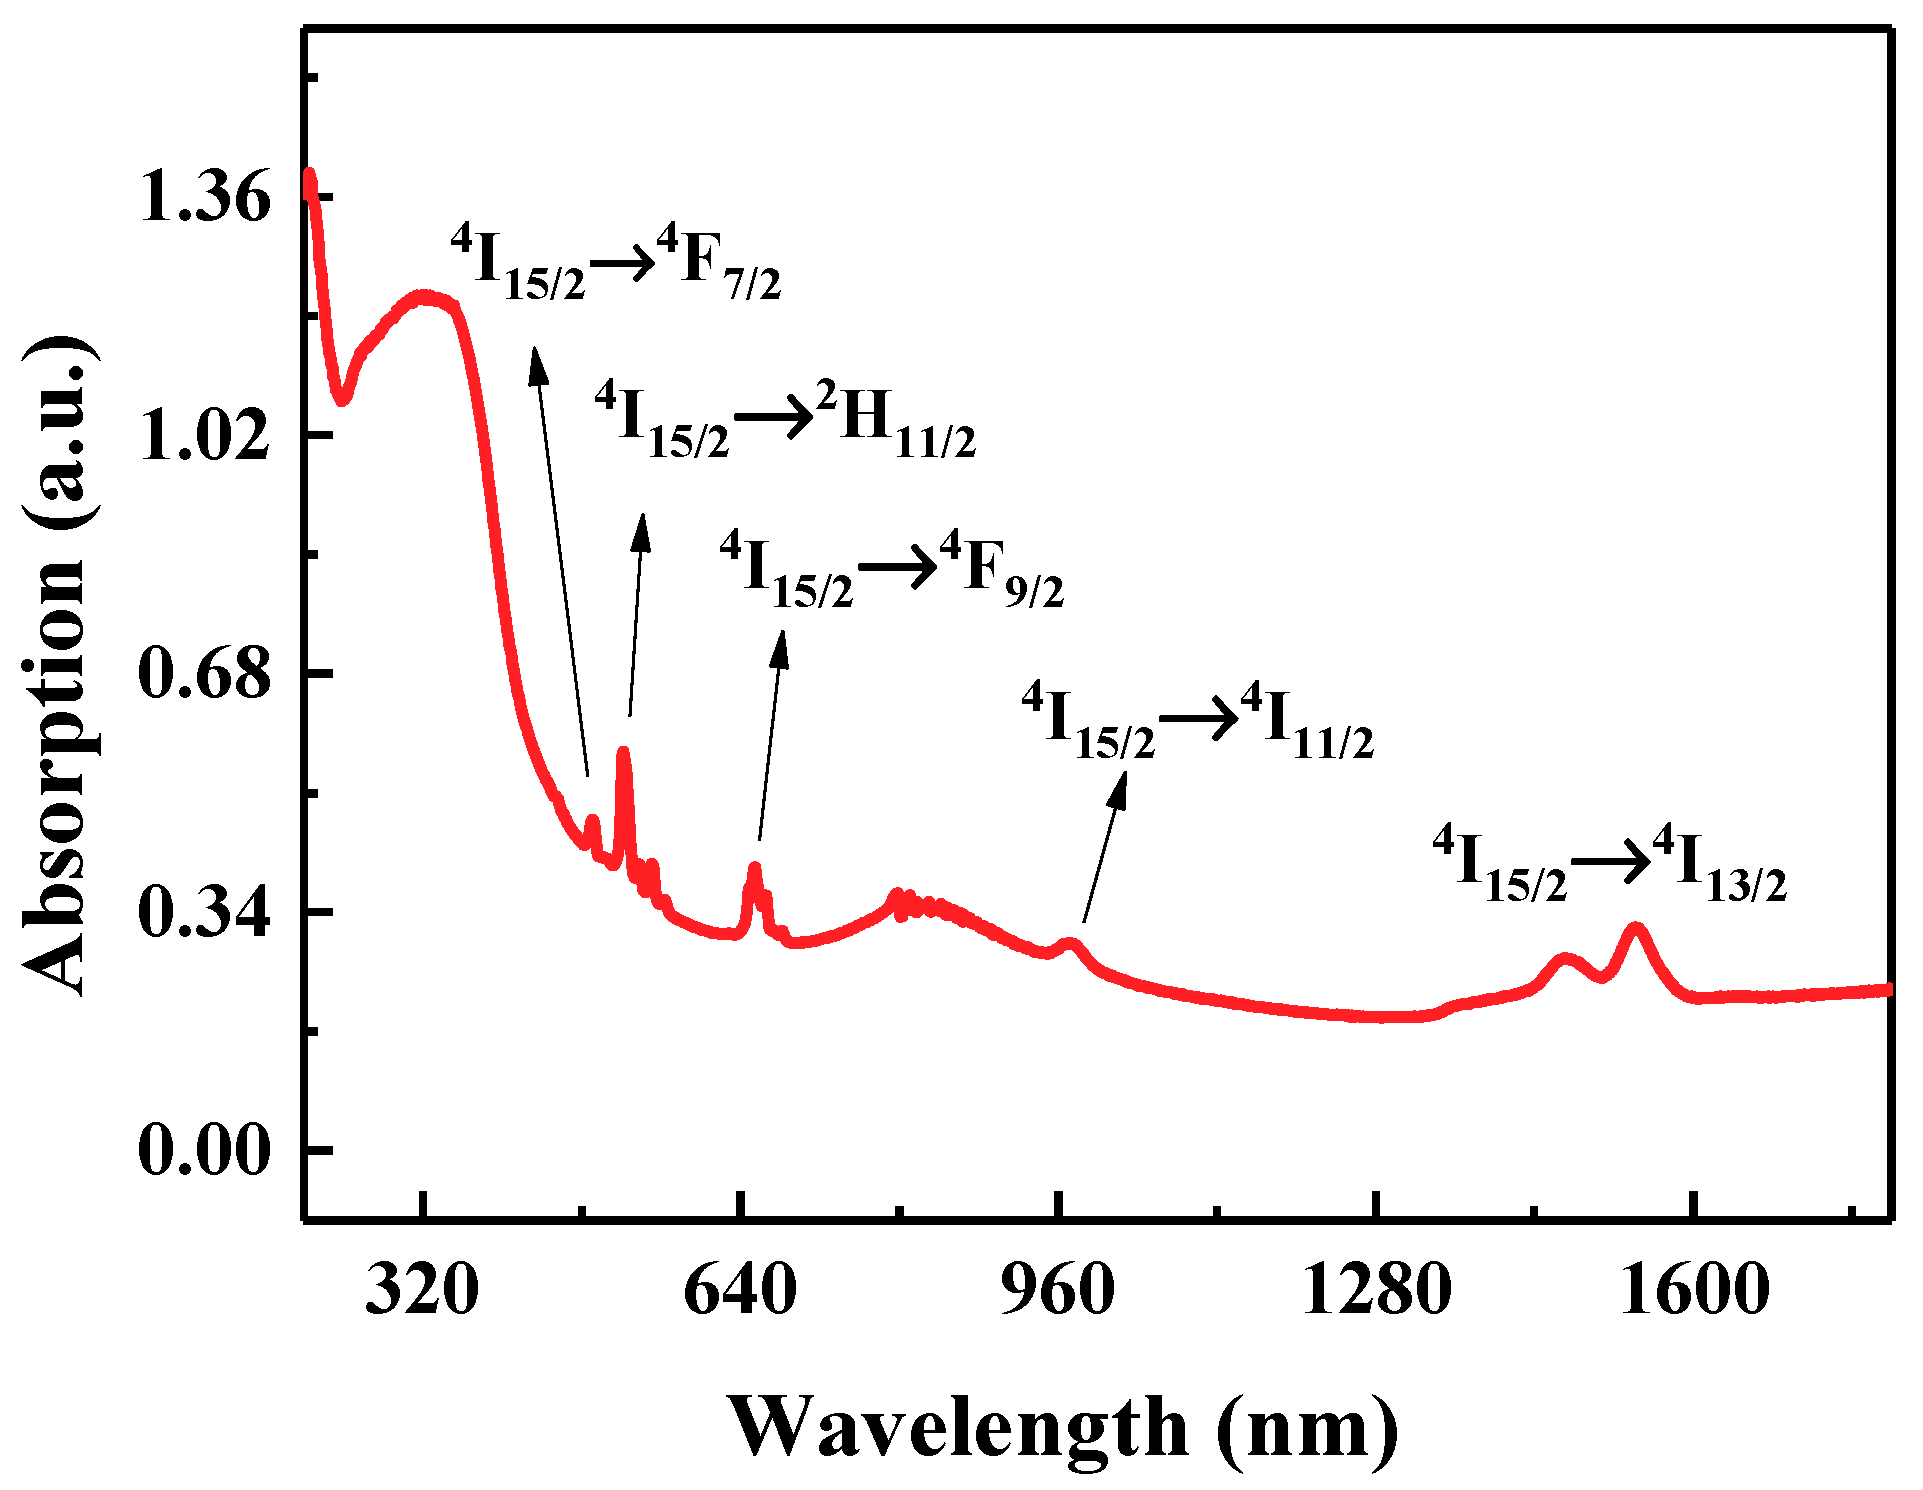
Figure 4 shows an optical absorption spectrum of the PEN–PZN–PT crystals for the wavelength range 200 to 1800 nm. The transition absorptions of Er3+ from the ground state 4I15/2 to the excited states 4F7/2, 2H11/2, 4F9/2, 4I11/2, and 4I13/2 were detected at 491 nm, 522 nm, 654 nm, 971 nm, and 1470 nm, respectively. The optical absorption spectrum of the 15PEN–63PZN–22PT crystals is similar to that of the Er3+ doped ferroelectric material reported previously [27].
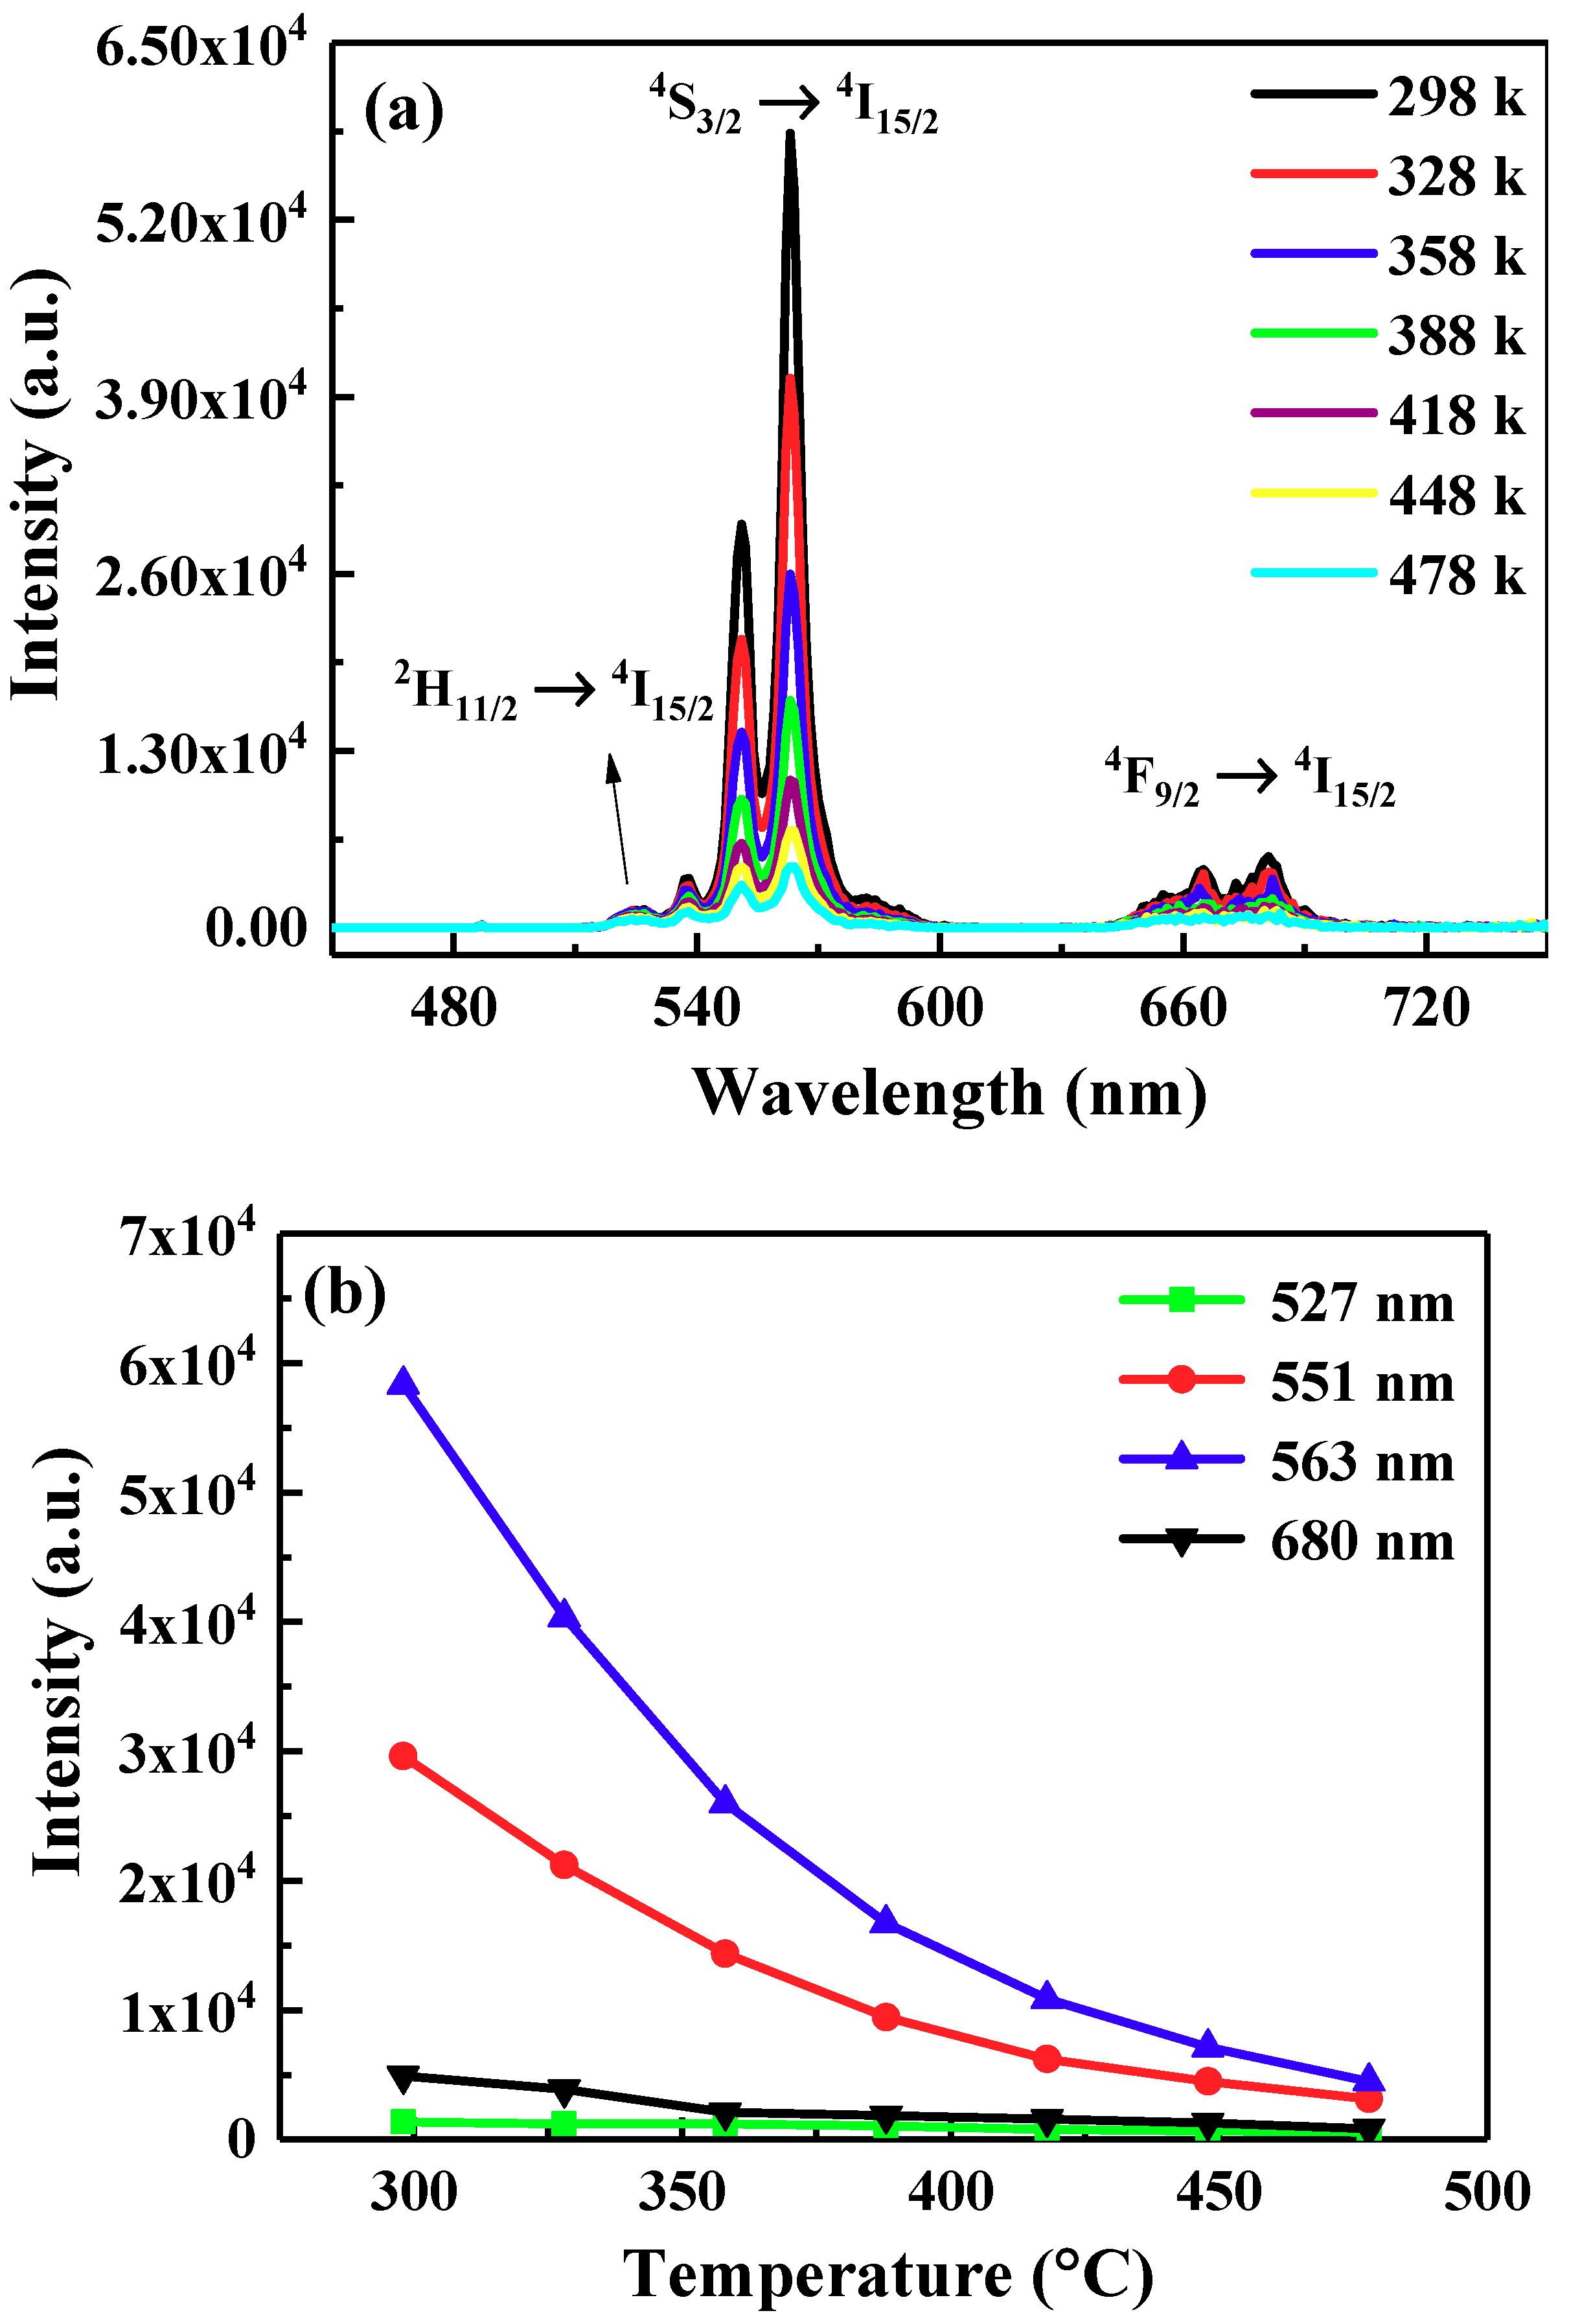
Figure 5a displays an upconversion photoluminescence (UC PL) spectrum of the crystals excited by a 980 nm laser at different temperatures. Three broad emission bands located at 527 (green), 563 (green), and 680 (red) nm were detected which are consistent with the energy level transitions of Er3+ from the excited states 2H11/2, 4S3/2, and 4F9/2 to the ground state 4I15/2, respectively [28]. In the temperature range 298–478 K, no difference in the location of the emission band can be observed as the temperature increases, but the luminescence intensity is significantly weakened. Figure 5b shows the emission intensity differences among the centers at 527, 551, 563 (green), and 680 (red) nm. It can be observed that 551 and 563 nm have the same downward trend and that no downward trend is observed at 527 nm, indicating that heating has little effect on the concentration of electrons at the 2H11/2 level, while the concentration of electrons at the 4S3/2 and 4F9/2 levels have a strong dependence on temperature [29].
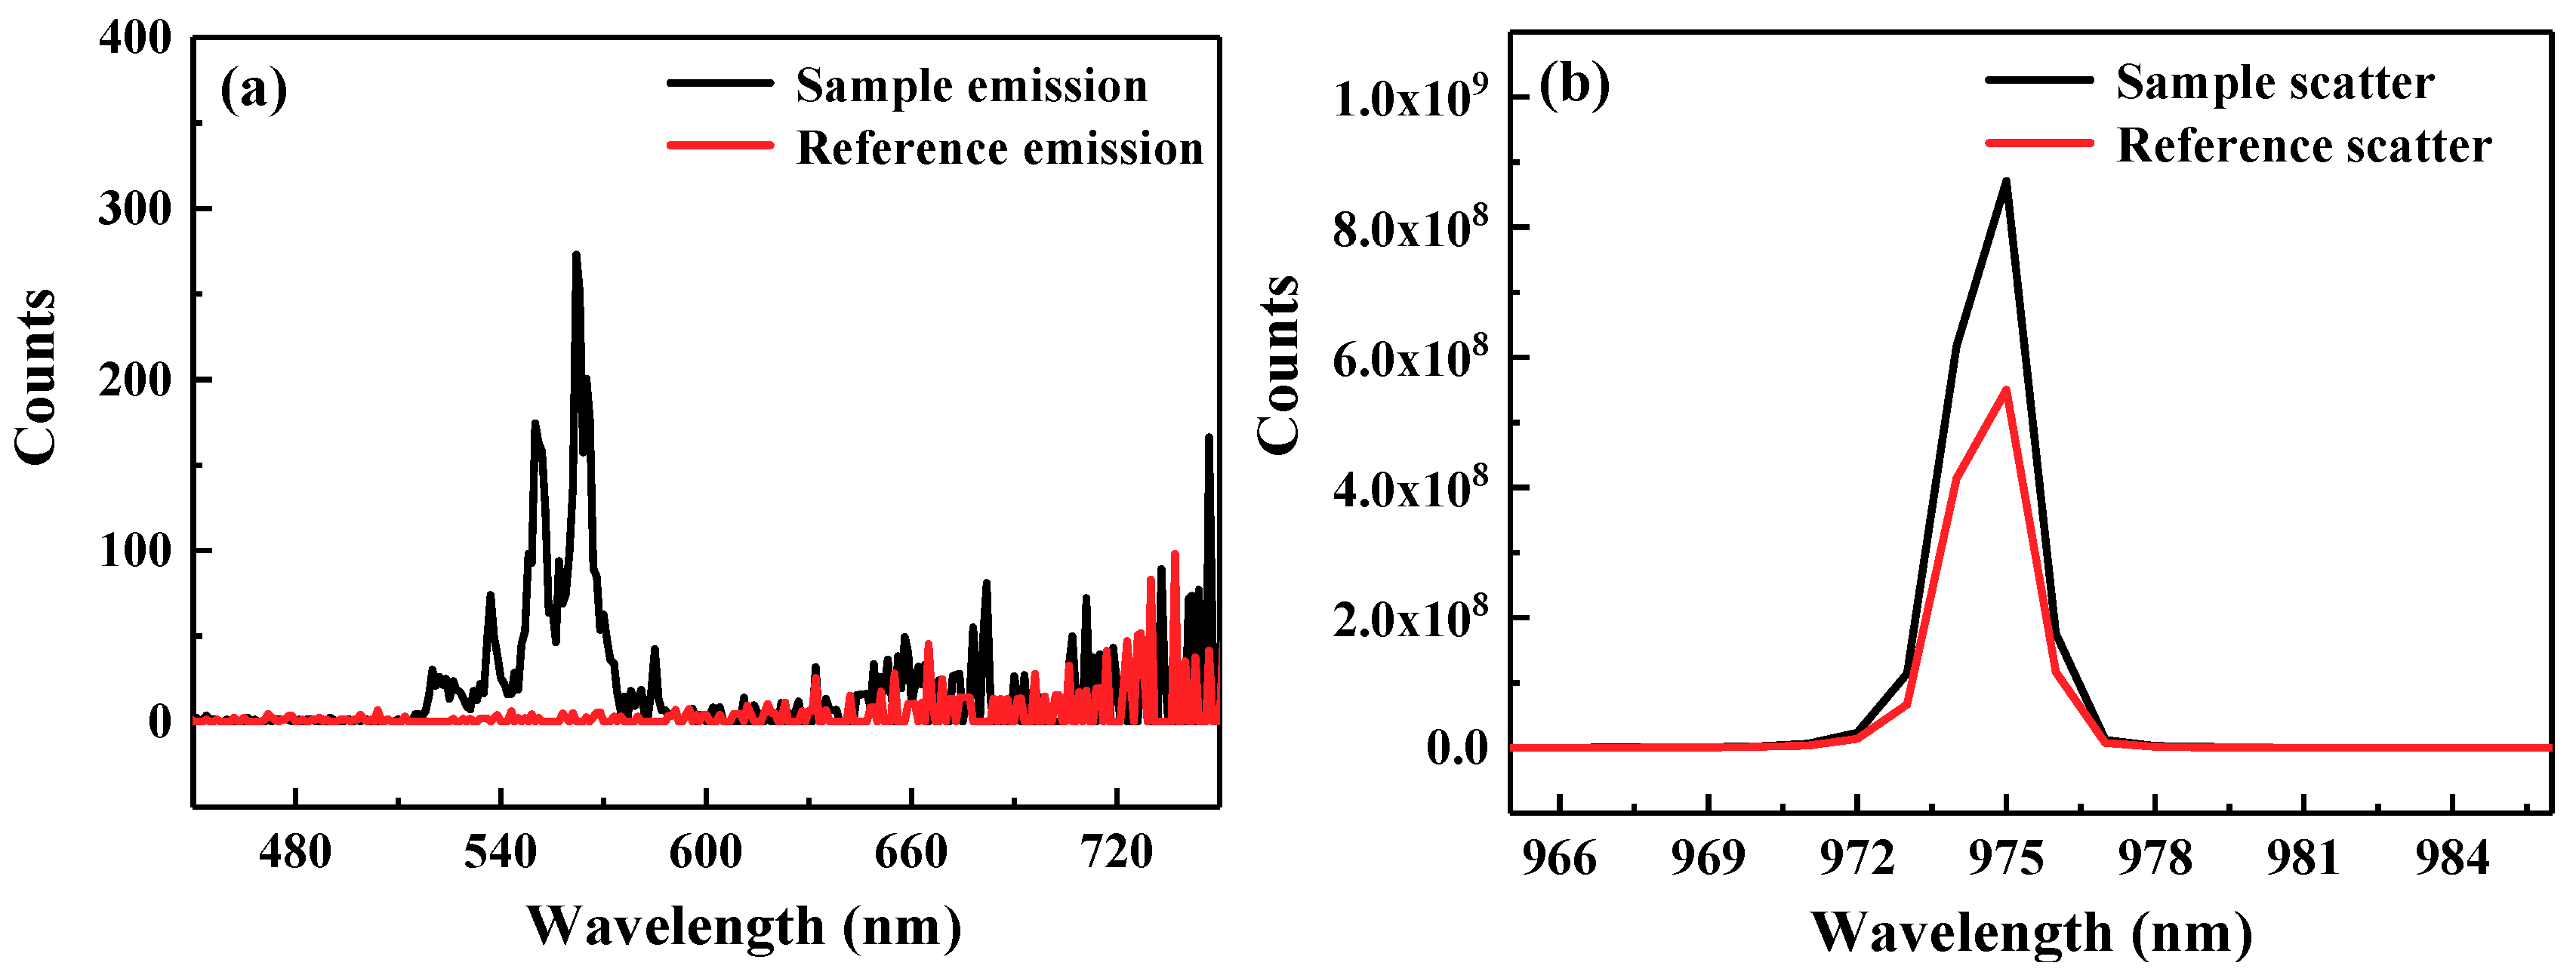
Quantum yield is the fraction of molecules that return to the ground state by emission of fluorescence out of the total number of excited molecules. The higher the quantum yield, the higher the efficiency of the fluorescent materials. The absolute QY of the crystals was excited using a 980 nm laser, with the results shown in Figure 6. The absolute quantum yield up conversion of the crystal can be computed using the formula:
Q Y = A e m / [ ( A s c a t r e f A s c a t s a m p l e ) * k Re d P M T / N I R P M T ]
where A is the fluorescence peak area, Aem is the area of the emission peak after spectral correction, and Ascatref and Ascatsample represent the area of the Rayleigh scattering peak of the reference sample and the measured sample, respectively. kRed-PMT/NIR-PMT denotes the proportion between the sensitivities of the red and near-infrared detectors. An integral calculation was performed to obtain the QY of the PEN–PZN–PT crystals, which was found to be 0.00059%. This value is higher than the quantum yield of the reported rare earth Er3+ modified glass system [30,31], and the glass-based material cannot obtain the same excellent electrical properties. Hence, the PEN–PZN–PT crystals have potential application in optical-electrical devices.
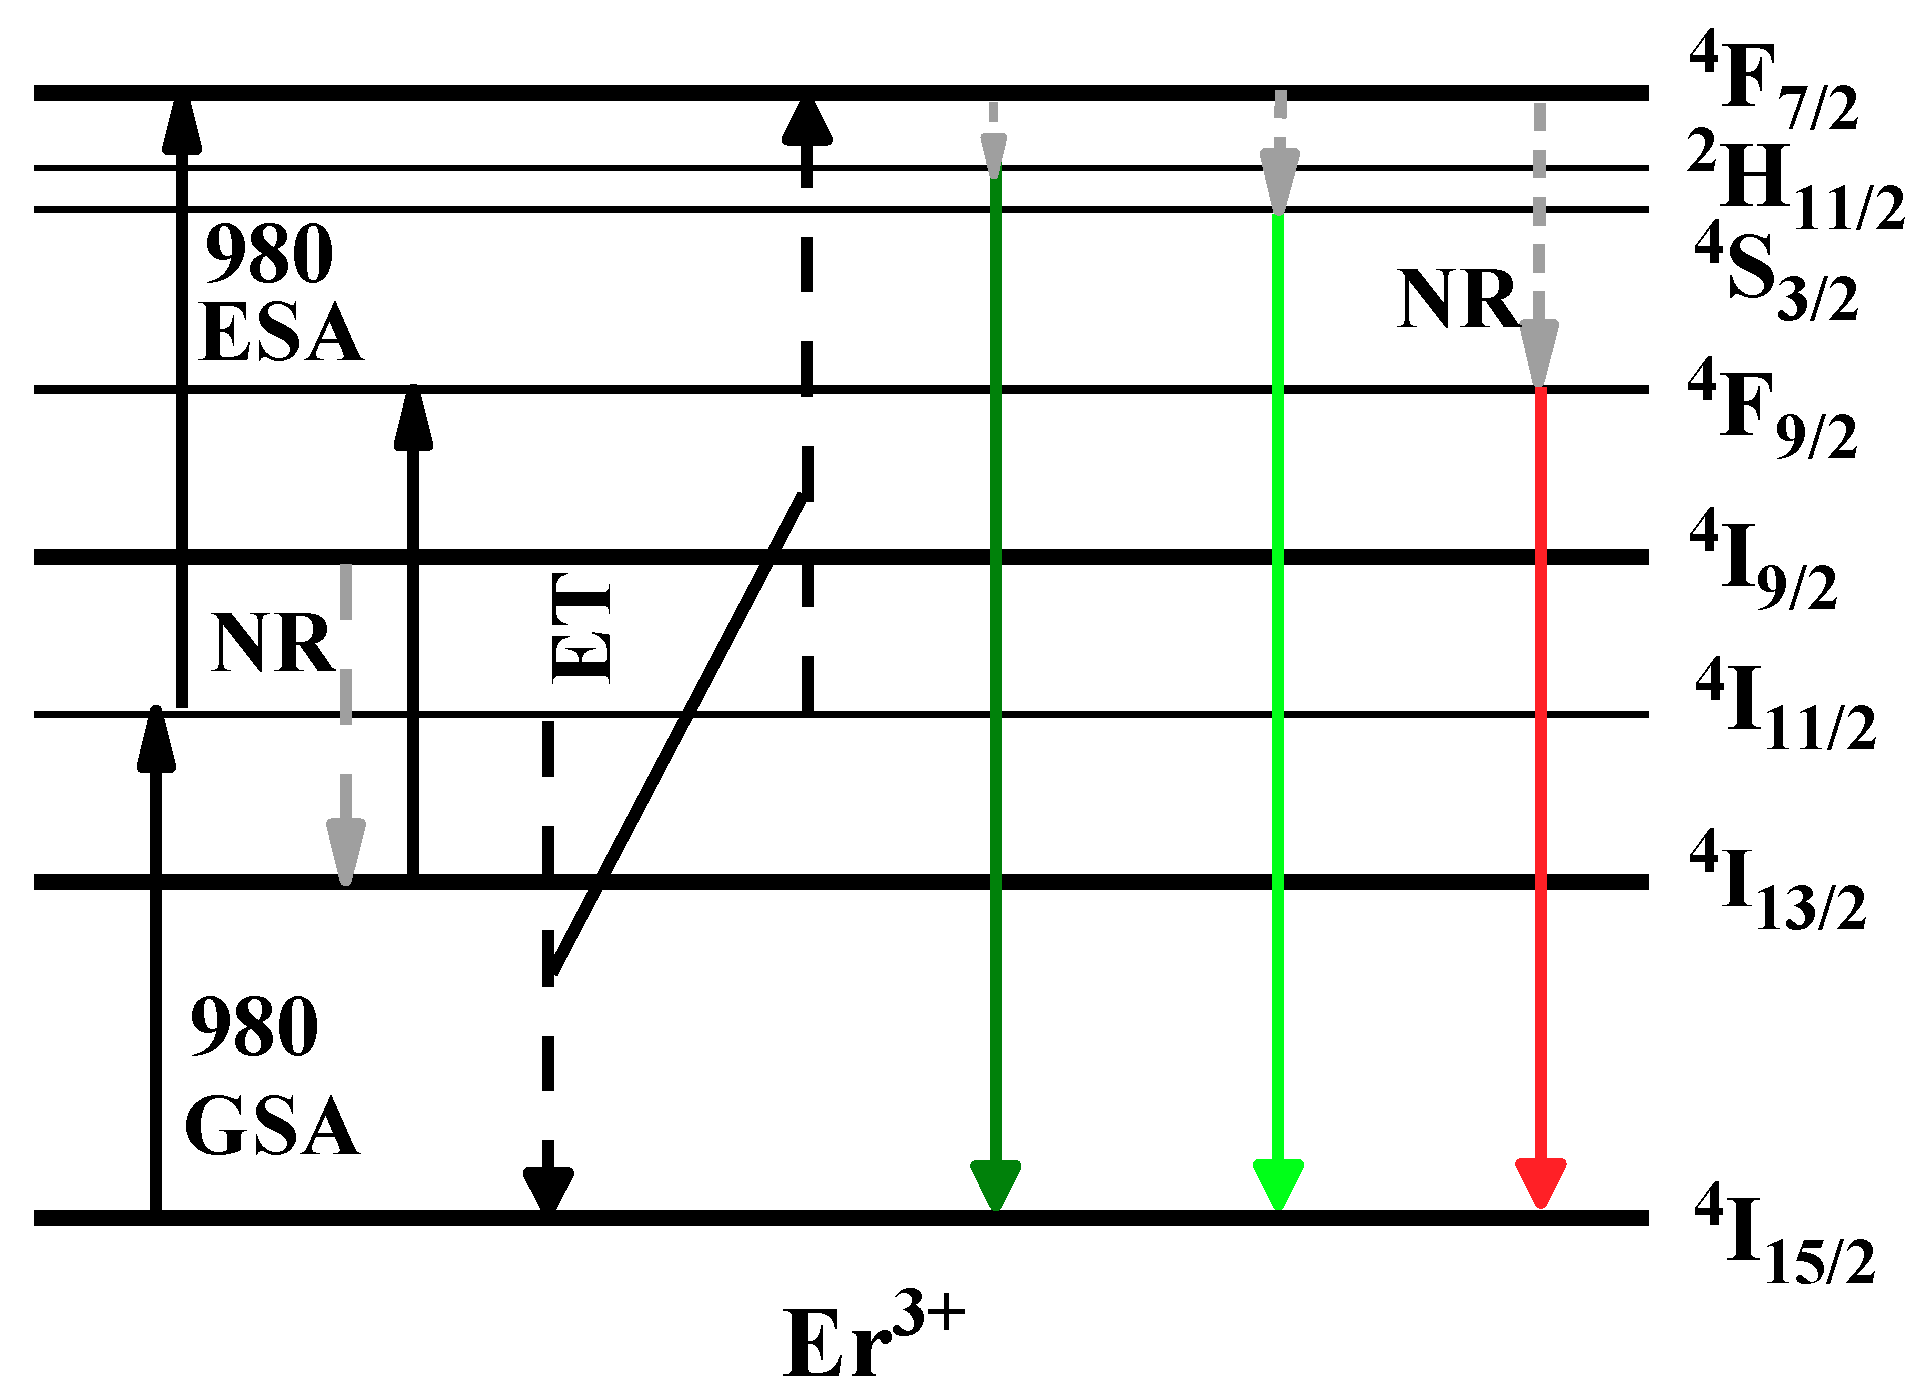
Figure 7 shows a possible luminescence mechanism and an energy level diagram of the PEN–PZN–PT crystals at 980 nm excitation. Firstly, the Er3+ located at the ground state 4I15/2 are excited to 4I11/2 through the ground state absorption (GSA) process and undergo small proportion relaxation to 4I13/2 by non-radiative (NR) transitions. The Er3+ at 4I11/2 and 4I13/2 level start absorbing photons and then get to the 4F7/2 and 4F9/2 levels through excited state absorption (ESA). Then, the Er3+ at 4I11/2 are excited to the 4F7/2 level through energy transfer (ET): 4I11/2 + 4I11/24I15/2 + 4F7/2. Afterwards, the Er3+ at the 4F7/2 level reach the 2H11/2, 4S3/2, and 4F9/2 levels by non-radiative transition. Finally, the Er3+ ions return to the ground state, with (2H11/2, 4S3/2) → 4I15/2 and 4F9/24I15/2 emitting green and red light, respectively. The above mechanism is a two-photon excitation process, which is consistent with other materials doped with Er3+ [32,33].

4. Conclusions

In this work, PEN–PZN–PT crystals with a pure perovskite structure were first obtained using the high-temperature flux method. The electric properties of the crystals have been greatly improved. The Curie temperature Tc increased from 170 °C for the PZN–9PT crystals to 250 °C for the PEN–PZN–PT crystals. The coercive field Ec of the PEN–PZN–PT crystals reached 33.92 kV/cm, which is about nine times higher than that of the PZN-9PT system. Furthermore, PEN–PZN–PT crystals produce a UC with a strong green light when excited by a 980 nm laser. The luminescence intensity of all the emission peaks decreased across an increasing temperatures range of 298 to 478 K. In addition, the absolute QY for the crystals was found to be 0.00059%. The results make PEN–PZN–PT crystals a potential candidate for optoelectronic devices.

Author Contributions

Conceptualization, Z.X.; methodology, Y.C.; formal analysis, Y.C.; investigation, Y.C.; resources, Z.X.; writing—original draft preparation, Y.C.; writing—review and editing, Z.X.; F.G.; P.F.; X.L.; W.L.; A.H.; Q.Z.; supervision, Z.X. All authors have read and agreed to the published version of the manuscript.

Funding

This work was supported by the National Natural Science Foundation of China (Grant Nos. 51772235 and 11704249) the Shaanxi Key Laboratory Fundament Research Foundation (14JK1333) and the Shaanxi Key Laboratory of Optoelectronic Functional Materials and Devices (Grant No. 2015SZSJ-59-5).

Conflicts of Interest

The authors declare no conflict of interest.

References

  1. Ye, Z.G. High-Performance piezoelectric single crystals of complex perovskite solid solutions. MRS Bull. 2009, 34, 277–283. [Google Scholar] [CrossRef]
  2. Park, S.E.; Shrout, T.R. Ultrahigh strain and piezoelectric behavior in relaxor based ferroelectric single crystals. J. Appl. Phys. 1997, 82, 1804–1811. [Google Scholar] [CrossRef]
  3. Yasuda, N.; Banno, T.; Fujita, K.; Ohwa, H.; Matushita, M.; Yamashita, Y.; Iwata, M.; Ishibashi, Y. Piezoelectric properties of relaxor ferroelectric solid solution single crystals PMN-PT and PZN-PT near MPB under pressures. Ferroelectricity 2007, 347, 44–49. [Google Scholar] [CrossRef]
  4. Wang, Z.J.; He, C.; Qiao, H.M.; Pang, D.F.; Yang, X.M.; Zhao, S.G.; Li, X.Z.; Liu, Y.; Long, X.F. In situ di-, piezo-, ferroelectric properties and domain configurations of Pb(Sc1/2Nb1/2)O3–Pb(Mg1/3Nb2/3)O3–PbTiO3 ferroelectric crystals. Cryst. Growth Des. 2018, 18, 145–151. [Google Scholar] [CrossRef]
  5. Sternberg, A.; Shebanovs, L.; Yamashita, J.Y.; Antonova, M.; Livinsh, M.; Shorubalko, I. Structure and properties of high piezoelectric coupling Pb(B′½Nb½)O3-PbTiO3 binary systems. Ferroelectricity 1999, 224, 137–144. [Google Scholar] [CrossRef]
  6. Kuwata, J.; Uchino, K.; Nomura, S. Dielectric and piezoelectric properties of 0.91Pb(Zn1/3Nb2/3)O3-0.09PbTiO3 single crystals. J. Appl. Phys. 1982, 21, 1298–1302. [Google Scholar] [CrossRef]
  7. Yin, J.H.; Jiang, B.; Cao, W.W. Determination of elastic, piezoelectric and dielectric properties of Pb(Zn1/3Nb2/3)O3-PbTiO3 single crystals. Proc. SPIE. 1999, 3664, 239–246. [Google Scholar] [CrossRef]
  8. Yamashita, Y. Large Electromechanical Coupling Factors in Perovskite Binary Material System. J. Appl. Phys. 1994, 33, 5328–5331. [Google Scholar] [CrossRef]
  9. Harada, K.; Hosono, Y.; Yamashita, Y.; Miwa, K. Piezoelectric Pb[(Zn1/3Nb2/3)0.91Ti0.09]O3 single crystals with a diameter of 2 inches by the solution Bridgman method supported on the bottom of a crucible. J. Cryst. Growth. 2001, 229, 294–298. [Google Scholar] [CrossRef]
  10. Zhang, S.J.; Li, F.; Jiang, X.N.; Kim, J.; Luo, J.; Geng, X.C. Advantages and challenges of relaxor-PbTiO3 ferroelectric crystals for electroacoustic transducers—A review. Prog. Mater. Sci. 2015, 68, 1–66. [Google Scholar] [CrossRef] [Green Version]
  11. Sun, E.W.; Cao, W.W. Relaxor-based ferroelectric single crystals: Growth, domain engineering, characterization and applications. Prog. Mater. Sci. 2014, 65, 124–210. [Google Scholar] [CrossRef] [PubMed] [Green Version]
  12. Li, T.; Long, X.F.; Ye, M.; Wang, H.R.; Huang, H.T.; Zeng, X.R.; Ke, S.M. Growth and properties of (1-x)Pb(Zn1/3Nb2/3)O3−xPbTiO3 (x = 0.07–0.11) ferroelectric single crystals by a top-seeded solution growth method. Ceram. Int. 2015, 41, 14427–14434. [Google Scholar] [CrossRef]
  13. Zhang, S.J.; Lebrun, L.; Jeong, D.Y.; Randall, C.A.; Zhang, Q.M.; Shrout, T.R. Growth and characterization of Fe-doped Pb(Zn1/3Nb2/3)O3-PbTiO3 single crystals. J. Appl. Phys. 2003, 93, 9257–9262. [Google Scholar] [CrossRef]
  14. Kuwata, J.; Uchino, K.; Nomura, S. Phase transitions in the Pb(Zn1/3Nb2/3)O3-PbTiO3 system. Ferroelectricity 1981, 37, 579–582. [Google Scholar] [CrossRef]
  15. Fang, B.J.; Sun, R.B.; Shan, Y.J.; Tezuka, K.; Imoto, H. Phase transition, structural and electrical properties of Pb(Zn1/3Nb2/3)O3-doped Pb(Ni1/3Nb2/3)O3-PbTiO3 ceramics prepared by solid-state reaction method. J. Phys. Chem. Solids 2009, 70, 893–899. [Google Scholar] [CrossRef]
  16. Pan, J.S.; Zhang, X.W. Dielectric and ferroelectric properties of Pb(Ni1/3Nb2/3)O3–Pb(Zn1/3Nb2/3)O3–PbTiO3 ternary ceramics. Mater. Sci. Eng. B 2006, 127, 6–11. [Google Scholar] [CrossRef]
  17. Li, T.; Li, X.Z.; Wang, Z.J.; Liu, Y.; He, C.; Shen, D.Q.; Long, X.F.; Tailor, H. A Pb(In1/2Nb1/2)O3-Pb(Zn1/3Nb2/3)O3–PbTiO3 ternary ferroelectric system with high TC and high piezoelectric properties. Mater. Res. Bull. 2013, 48, 127–130. [Google Scholar] [CrossRef]
  18. Li, T.; Long, X.F. Piezo-/dielectric properties of perovskite-structure high-temperature relaxor ferroelectrics: The Pb(Lu1/2Nb1/2)O3-Pb(Zn1/3Nb2/3)O3-PbTiO3 ternary ceramics. Mater. Res. Bull. 2014, 51, 251–257. [Google Scholar] [CrossRef]
  19. Ai, L.D.; Li, X.Z.; Wang, Z.J.; Liu, Y.; He, C.; Li, T.; Chu, T.; Pang, D.F.; Tailor, H.; Long, X.F. Preparation, structure, and electric properties of the Pb(Zn1/3Nb2/3)O3–Pb(Yb1/2Nb1/2)O3–PbTiO3 ternary ferroelectric system ceramics near the morphotropic phase boundary. J. Eur. Ceram. Soc. 2013, 33, 2155–2165. [Google Scholar] [CrossRef]
  20. Salaka, A.; Bushinsky, M.V.; Pushkarov, N.V.; Shilin, A.D.; Olekhnovich, N.M.; Vyshatko, N.P. A new ferroelectric PbEr1/2Nb1/2O3. Ferroelectricity 1999, 234, 123–127. [Google Scholar] [CrossRef]
  21. Chen, Y.; Zhang, X.W.; Pan, J.S.; Chen, K.P. Study of the structure and electrical properties of PMN-PNN-PT ceramics near the morphotropic phase boundary. J. Electroceram. 2006, 16, 109–114. [Google Scholar] [CrossRef]
  22. Kobor, D.; Lebrun, L.; Sebald, G.; Guyomar, D. Characterization of pure and substituted 0.955Pb(Zn1/3Nb2/3)O3-0.045PbTiO3. J. Cryst. Growth 2005, 275, 580–588. [Google Scholar] [CrossRef]
  23. Xi, Z.Z.; Han, A.M.; Fang, P.Y.; Li, X.J.; Long, W. Electrical properties and upconversion luminescence of the Er3+-modified PZN-9PT crystals. J. Mater. Res. 2016, 31, 3044–3049. [Google Scholar] [CrossRef]
  24. Xi, Z.Z.; Han, A.M.; Fang, P.Y.; Long, W.; Li, X.J.; Bu, Q.Q. Structural and electrical properties of Ho3+-modified Pb(Zn1/3Nb2/3)O3-9PbTiO3 single crystals. J. Mater. Sci. Mater. Electron. 2015, 27, 4223–4229. [Google Scholar] [CrossRef]
  25. Zhao, W.; Xi, Z.Z.; Fang, P.Y.; Li, X.J.; Long, W.; He, A.G.; Li, Y.; Zhang, Y.M. Electric and optical properties of Pb(Er1/2Nb1/2)-Pb(Mg1/3Nb1/3)-PbTiO3 crystals. Crystals 2018, 8, 426. [Google Scholar] [CrossRef] [Green Version]
  26. Srimathy, B.; Jayavel, R.; Bhaumik, I.; Ganesamoorthy, S.; Karnal, A.K.; Gupta, P.K.; Kumar, J. Role of dopant induced defects on the properties of Nd and Cr doped PZNT single crystals. Mater. Sci. Eng. B 2014, 185, 60–66. [Google Scholar] [CrossRef]
  27. Xi, Z.Z.; He, A.G.; Fang, P.Y.; Li, X.J.; Long, W. Electric and optical properties of Er3+ and Er3+/Yb3+modified PSN-PMN-PT crystals. J. Alloys Compd. 2017, 722, 375–380. [Google Scholar] [CrossRef]
  28. Wang, Y.H.; Junichi, O. New transparent vitroceramics codoped with Er3+ and Yb3+ for efficient frequency upconversion. Appl. Phys. Lett. 1993, 63, 3268–3270. [Google Scholar] [CrossRef]
  29. He, A.G.; Xi, Z.Z.; Li, X.J.; Long, W.; Fang, P.Y.; Zhang, J. The upconversion photoluminescence and temperature sensing abilities of Pb(Zn1/3Nb2/3)O3-9PbTiO3 crystals induced by Er3+/Yb3+ doping. J. Alloys Compd. 2019, 782, 936–942. [Google Scholar] [CrossRef]
  30. Lin, H.; Pun, E.Y.B.; Man, S.Q.; Liu, X.R. Optical transitions and frequency upconversion of Er3+ ions in Na2O·Ca3Al2Ge3O12 glasses. J. Opt. Soc. Am. B 2001, 18, 602–609. [Google Scholar] [CrossRef]
  31. Quimby, R.S.; Drexhage, M.G.; Suscavage, M.J. Efficient frequency up-conversion via energy transfer in flouride glasses. Electron. Lett. 1987, 23, 32–34. [Google Scholar] [CrossRef]
  32. Weng, F.Y.; Chen, D.Q.; Wang, Y.S.; Yu, Y.L.; Huang, P.; Lin, H. Energy transfer and up-conversion luminescence in Er3+/Yb3+ co-doped transparent glass ceramic containing YF3 nano-crystals. Ceram. Int. 2009, 35, 2619–2623. [Google Scholar] [CrossRef]
  33. Luo, L.H.; Du, P.; Li, W.P.; Tao, W.D.; Chen, H.B. Effects of Er doping site and concentration on piezoelectric, ferroelectric, and optical properties of ferroelectric Na0.5Bi0.5TiO3. J. Appl. Phys. 2013, 114, 124104. [Google Scholar] [CrossRef]
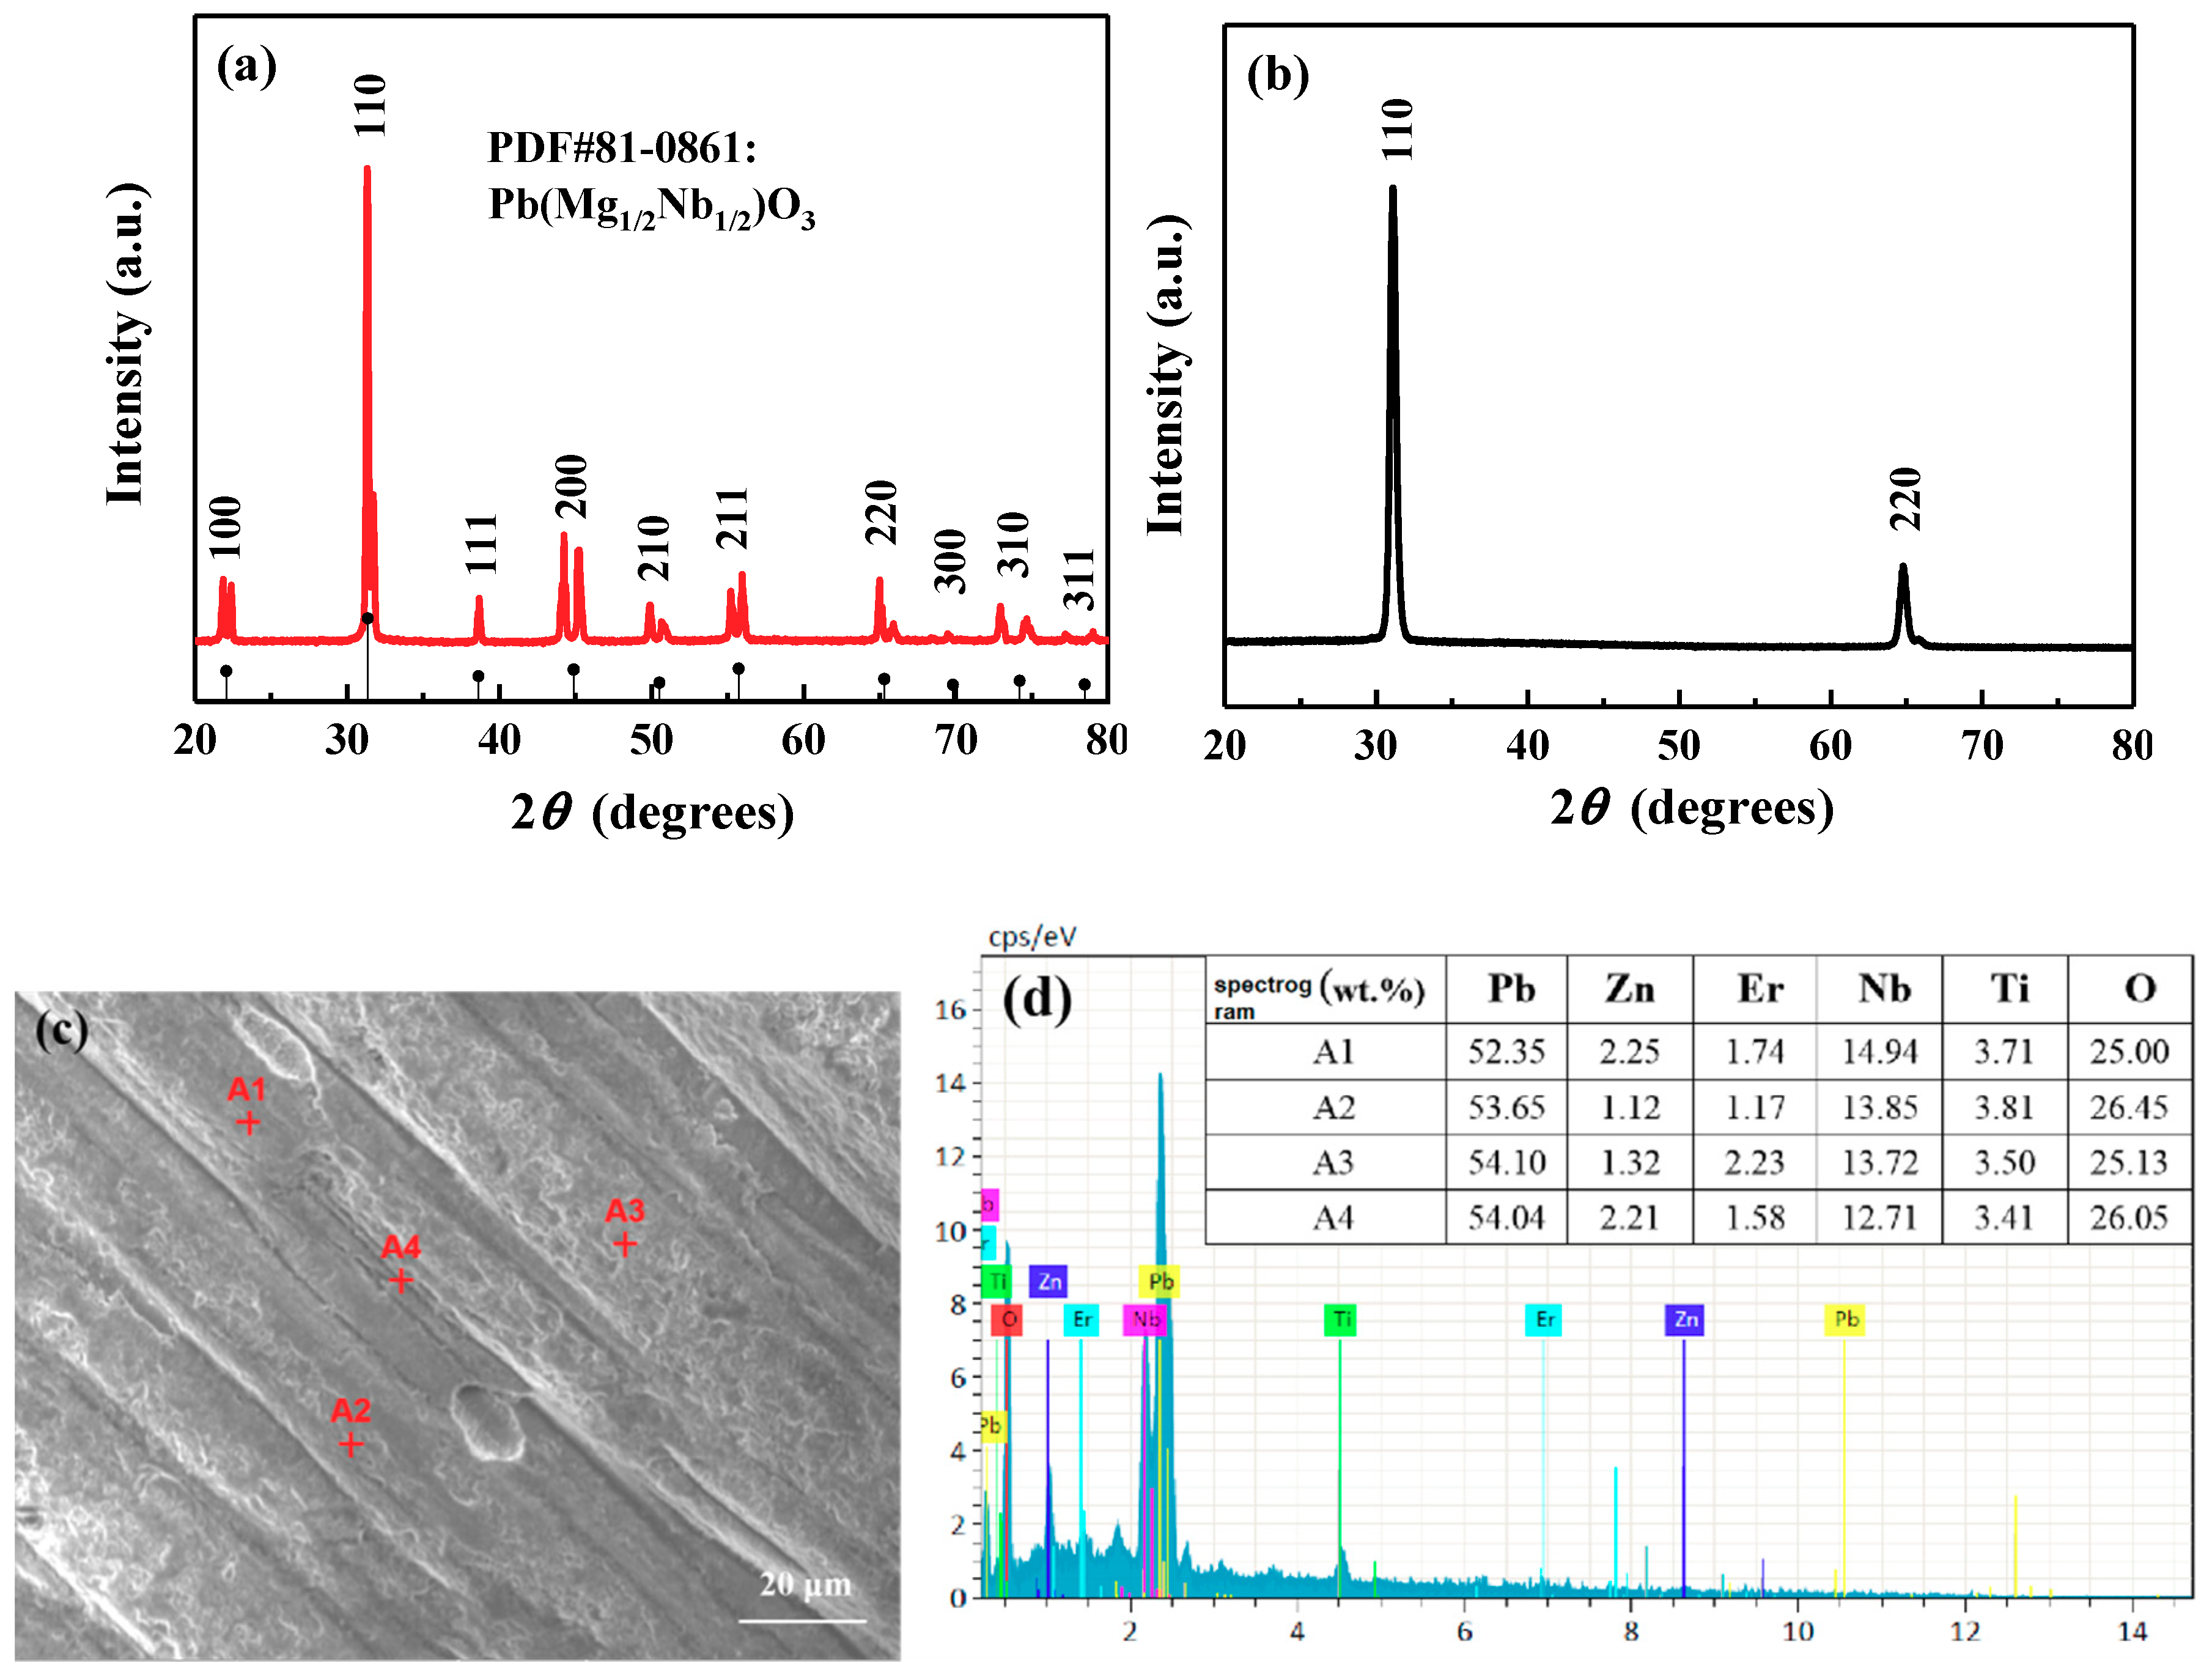
Figure 1. XRD profiles of (a) crystal powder and(b) [110]-oriented crystals. (c) An SEM image of the crystals. (d) An energy dispersive system (EDS) spectrum of crystals.
Crystals 10 00022 g001
Figure 2. The dependence of the dielectric constant (ε′) and dielectric loss (tanδ) on the temperature of [110] crystals at different frequencies (1 kHz to 1 MHz).
Crystals 10 00022 g002
Figure 3. Polarization-electric field (P-E) hysteresis loops for crystals under different electric fields at room temperature.
Crystals 10 00022 g003
Figure 4. The optical absorption spectrum of the 15PEN–63PZN–22PT crystals.
Crystals 10 00022 g004
Figure 5. (a) Upconversion photoluminescence (UL PL) (λex = 980 nm) spectra of the crystals at different temperatures. (b) The dependence of luminescence intensity on temperature located at different wavelengths.
Crystals 10 00022 g005
Figure 6. (a) The quantum yield (QY) emission spectra of the crystals under 980 nm excitation. (b) The QY scatter spectra of the crystals under 980 nm excitation.
Crystals 10 00022 g006
Figure 7. Energy level diagram of the crystals and possible luminescence mechanism under 980 nm excitation. Legend: ESA, excited state absorption; ET, energy transfer; GSA, ground state absorption; NR, non-radiative.
Crystals 10 00022 g007