Article

Novel High Efficiency Layered Oxide Photocatalyst Li2SnO3 for Rhodamine B and Tetracycline Degradation

1
Department of Chemistry and Chemical Engineering, Chongqing University of Education, Chongqing 400067, China
2
College of Chemistry and Chemical Engineering, Chongqing University of Technology, Chongqing 400054, China
3
Analytical and Testing Center of Chongqing University, Chongqing University, Chongqing 401331, China
4
Jiangsu Key Laboratory for Chemistry of Low-Dimensional Materials, Huaiyin Normal University, Huai’an 223300, China
*
Authors to whom correspondence should be addressed.
Catalysts 2019, 9(9), 712; https://doi.org/10.3390/catal9090712
Submission received: 30 July 2019 / Revised: 21 August 2019 / Accepted: 21 August 2019 / Published: 24 August 2019
(This article belongs to the Section Photocatalysis)

Abstract

:
The use of a layered Li2SnO3 material as an efficient photocatalyst for the degradation of environmental pollutants (Rhodamine B and tetracycline) was investigated. The structure and morphology of the material were characterized using powder X-ray diffraction, Fourier transform infrared spectroscopy, transmission electron microscopy, and field emission scanning electron microscopy. Optical measurements demonstrated that Li2SnO3 was a UV-light-responsive material with a band gap of 3.71 eV. The maximum kinetic rate constants of photocatalytic degradation of Rhodamine B and tetracycline solutions were 0.0155 min−1 and 0.0406 min−1 · L/mg, respectively, when exposed to UV-light irradiation within 120 min. Trapping experiments demonstrated that holes ( h + ) , hydroxyl radical ( · O H ) and superoxide radical ( · O 2 ) were the dominant active species during the degradation of Rhodamine B and tetracycline. Theoretical band structure calculations revealed that Li2SnO3 was a direct gap semiconductor with a large m h * / m e * value (4.7) near the band edge. Partial charge density near the top of the valence band indicated that the photocatalytic oxidation reaction occurred largely on the O-2p states. The excellent photocatalytic performance was attributed to the synergistic effect of the layered crystal structure and large m h * / m e * . This work represents an important contribution to the design and optimization of efficient oxide photocatalysts with layered crystal structures for environmental remediation.

Graphical Abstract

1. Introduction

The discharge of waste water containing harmful organic compounds and toxic substances has become a serious environmental problem. The efficient purification of polluted water has long been a hotly pursued challenge in the field of environmental remediation [1,2]. Semiconductor photocatalysts, which efficiently use light as a driving force, have played an increasingly major role in this area [3]. Many materials, such as TiO2 [4], CdS [5], and g-C3N4 [6,7,8], have attracted great research and industrial interest as potential photocatalysts. Despite the rapid development of these photocatalysts, they still face several significant challenges: (1) rapid charge recombination occurs during the migration of photogenerated carriers to the surface reactive sites; and (2) most of the reaction active sites are not exposed but remain hidden within the bulk materials. To overcome these challenges, the discovery of new and more efficient photocatalysts has become an active priority. Among the recently explored photoactive materials, layered metal oxides, offering high photocatalytic performance, low cost, resistance to photocorrosion and good photostability, are highly promising candidates.
Since the experimental realization of graphene, layered materials, including hexagonal boron nitride (h-BN) [9], transition metal dichalcogenides (such as MoS2) [10], and organic polymer semiconductors (such as g-C3N4) [11], have been successfully prepared and intensively researched in the area of photocatalysis and photoelectrocatalysis. Structurally, more active sites will be created, especially when these materials are fabricated in monolayer form. Additionally, the intrinsic electric field originating from the heterojunction effect between monolayers can boost the migration of photogenerated carriers to opposite sides of the layer, to the benefit of photocatalytic reactions.
Layered Aurivillius phases and perovskite-related oxides are used as photoactive materials for water splitting and degradation of environmental pollutants. For instance, the layered perovskite PbBi2Nb2O9 was applied as an efficient photocatalyst for the production of H2 and the photodegradation of isopropanol to CO2 [12]. Layered Pb2Bi4Ti5O18 exhibited excellent removal efficiency of NO [13] and the multi-ferric oxide Nd6Ti4Fe2O20 was used to degrade Rhodamine B [14]. However, these oxide photocatalysts suffered from the drawback that the layers, whether anionic or cationic, were relatively thick and consisted of multi-atomic packing with strong chemical bonds between the layers, which was not conducive to the fabrication of ultrathin and mono-layered materials. Moreover, the electronic densities of states near the band edge of the layers, consisting of diverse atomic bond types, were complex, making it difficult to optimize the photocatalytic properties by band engineering [15,16]. Layered metal oxides containing alkali ions in the interlayer, such as compounds of the form A-B-O (A: alkali ions, B: main group metal or transition group metal), contain relatively thin layers, where the O-B-O layer is only three atoms thick, and the intralayer interactions consist of strong BO bonds while the interlayer AO bonds are relatively weak [17]. In addition, the electronic density of states of alkali ions makes almost no contribution to the band edge, and the photogenerated carriers are generally delocalized in the metal oxide layer. Therefore, the relatively weak A-O bonding interactions between the layers are expected to facilitate the fabrication of the ultrathin, mono-layered materials, which can then be used to build layered heterojunction systems [18].
Li2SnO3 is a layered metal oxide compound that has received increasing attention for its applications as an anode material for lithium ion batteries and dielectric materials for use in the microwave range. Li-rich in layered lithium transition metal oxides Li2MO3 (M = Sn, Mn, and Ru) displayed high energy density [19,20,21,22,23,24,25]. Recently, the successful fabrication and favorable optical properties of elongated nanostructured Li2SnO3 indicated that it could be used as a basic building block for optoelectronic nano and micro-devices [26]. However, to the best of our knowledge, its photocatalytic performance has not been reported. In this work, we synthesized layered Li2SnO3 via a solid-state reaction and investigated its photocatalytic performance. Combining crystal and electronic structure analysis, the layered Li2SnO3 was suggested as an efficient photocatalyst under UV light irradiation.

2. Results and Discussion

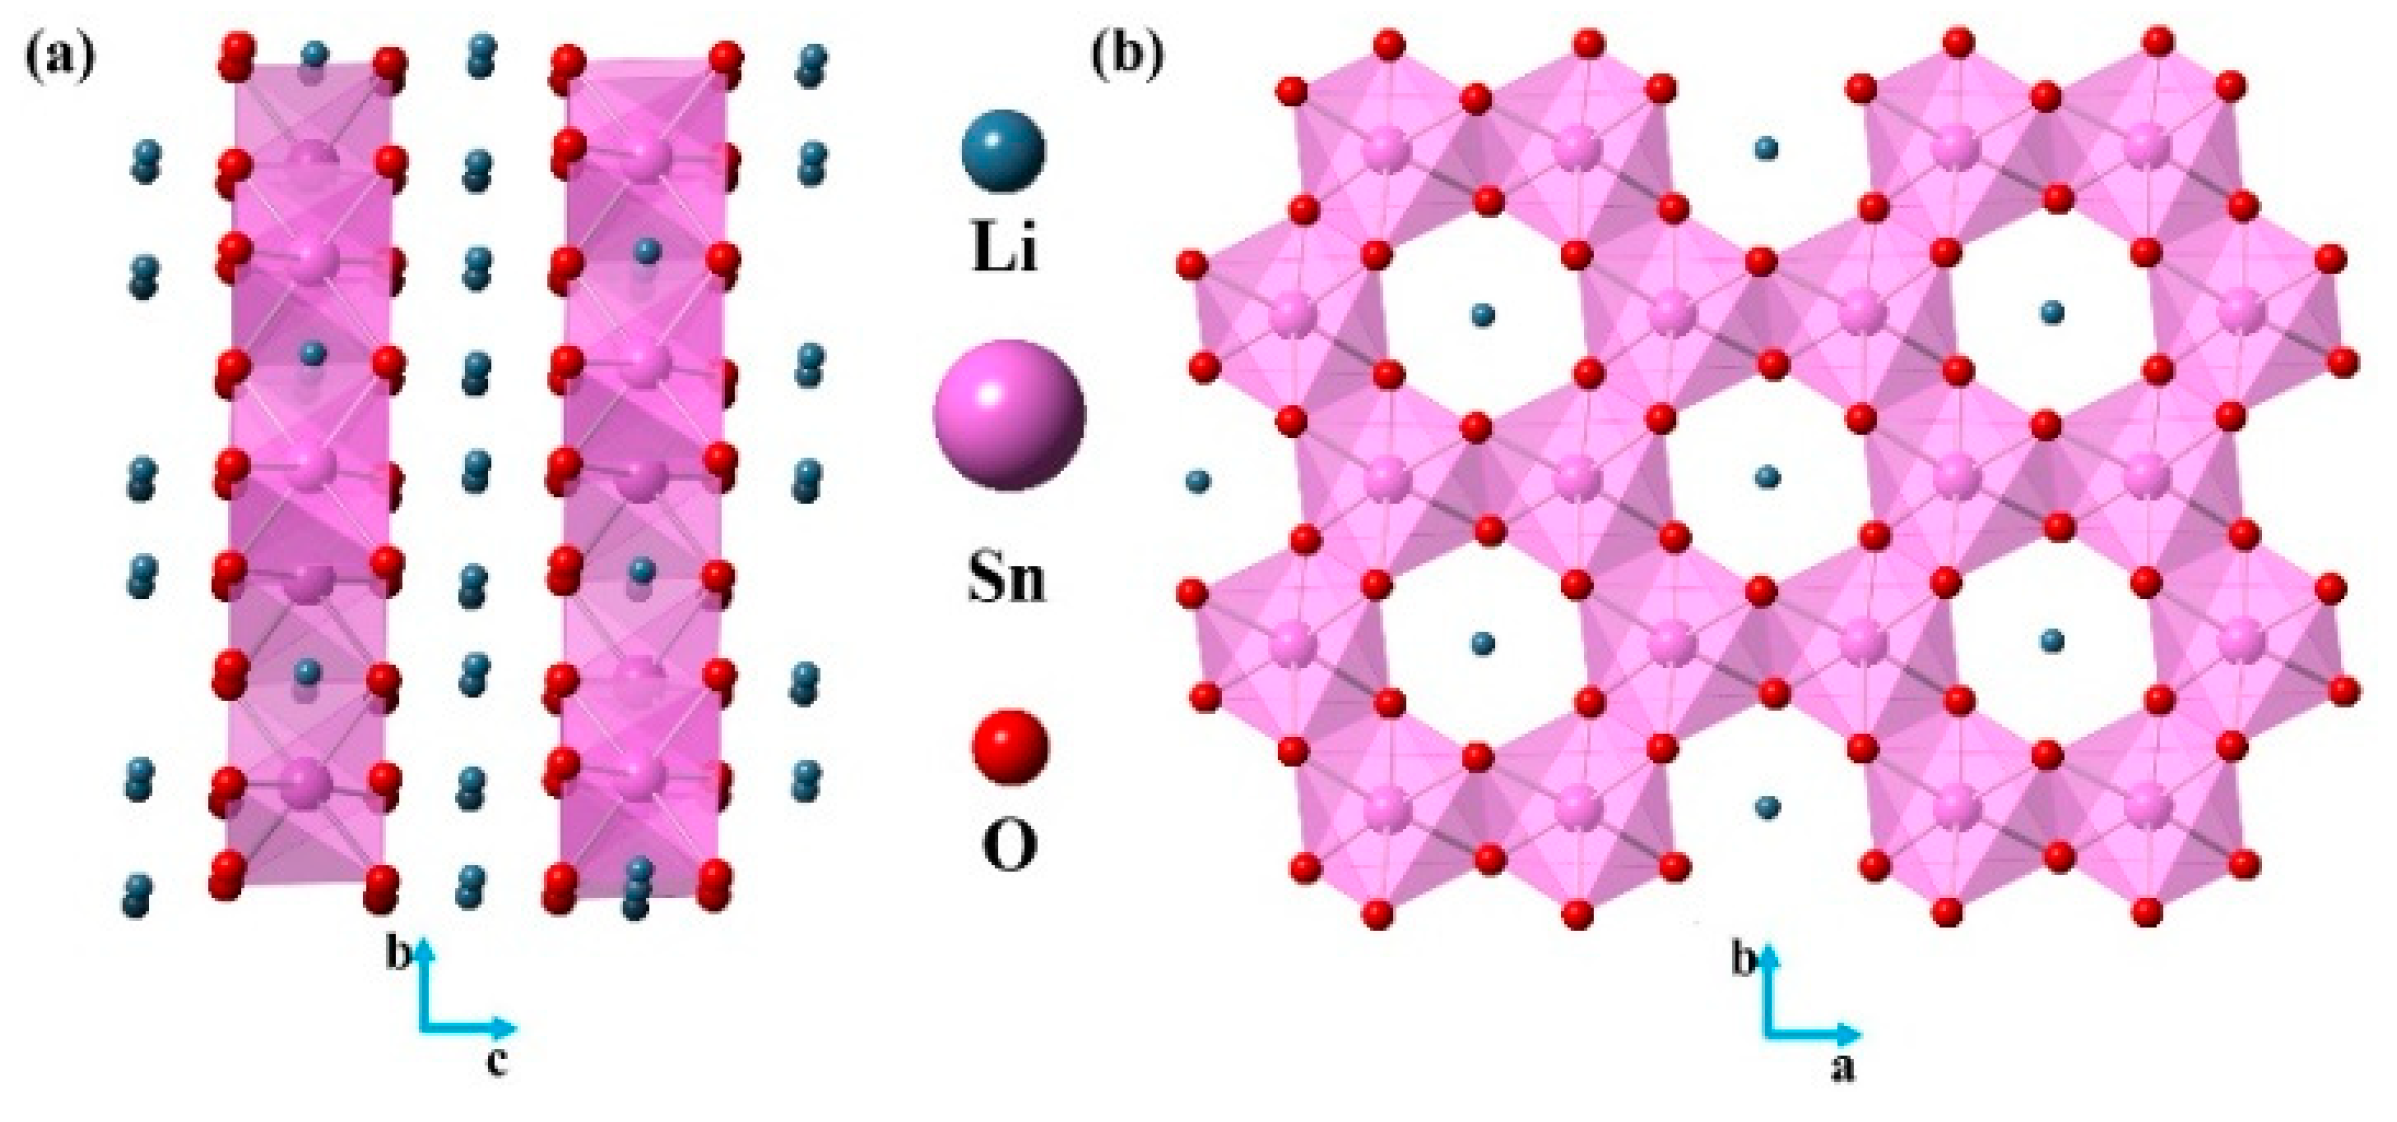
2.1. Crystal Structure and Powder XRD of Li2SnO3

Li2SnO3 belonged to the monoclinic phase and crystallized in the C2/c space group with cell parameters of a = 5.259 Å, b = 9.184 Å, c = 10.032 Å, β = 100.13 and Z = 2 [27]. The unit cell comprised one crystallographically independent Li atom, one Sn atom and three independent O atoms, and their Wyckoff sites were 4b, 8c and 8e, respectively. As shown in Figure 1a, Li2SnO3, featured a typical Li[Li1/3Sn1/3O2] layered structure in the a-b planes, where the “Li” written outside of the bracket denotes Li atoms located in the interlayer spaces to maintain the neutral charge of the crystal structure. In each layer (Figure 1b), one Sn atom was bound to six O atoms to form SnO6 octahedra, which were further connected by edge sharing to form the Kagome lattice, leaving the inner-bracket Li atoms located in the cavity.
The phase purity of the samples was characterized using powder X-ray diffraction analysis. As presented in Figure 2a, all diffraction peaks were in excellent agreement with the standard Li2SnO3 phase and no impurity phases were detected. In addition, the crystallographic parameters were also refined by the Rietveld method (Supplementary Figure S2), the results of which are listed in Supplementary Table S1. The obtained crystallographic parameters of all four samples were generally similar and were consistent with previous work [23]. The FT-IR spectra of the as-synthesized Li2SnO3 samples are shown in Supplementary Figure S3. Similar, characteristic absorption bands appeared in the ranges of 3000–4000 cm−1, 1000–2000 cm−1 and 500–800 cm−1 for all the samples. Among them, the peak located at around 500 cm−1 was assigned to the stretching vibration of Sn–O–Sn and Sn–O groups [20]. As shown in Figure 2b, the UV-vis diffuse reflectance spectra were collected to evaluate the light absorption properties of the as-synthesized samples. All samples displayed typical absorption edges in the UV range, and the band energies were estimated at 3.71 (S1), 3.65 (S2), 3.69 (S3) and 3.63 eV (S4), respectively, which indicated that the Li2SnO3 samples could act as UV-light-harvesting photocatalytic materials
SEM was performed to study the morphology of the as-prepared photocatalysts (Figure 3). The as-prepared photocatalysts exhibited irregular bulk morphologies with a particle length of approximately 2–4   μ m. In addition, numerous pores appeared in the bulk samples of S1, S3, and S4. The porosity might have been caused by decomposition and evaporation of Li and Li2CO3 during sintering. The BET specific surface areas were measured by the nitrogen adsorption-desorption method. The specific surface areas of sample S1, S2, S3, and S4 are 11.9 m2/g, 3.1 m2/g, 11.1 m2/g and 10.3 m2/g, respectively (Supplementary Figure S4).
To further ascertain the crystal structure of the photocatalysts, sample S1 was investigated using TEM (Figure 4). As revealed in Figure 4b, the HRTEM image showed a lattice spacing of approximately 0.493 nm, close to that of the lattice plane (002) in Li2SnO3. The corresponding selected area electron diffraction (SAED) image indicated the poly-crystalline nature of the as-prepared sample, as shown in the inset in Figure 4b. The maps illustrated that both Sn and O were distributed homogeneously throughout the sample. Therefore, the TEM-based analysis was consistent with the successful formation of Li2SnO3.

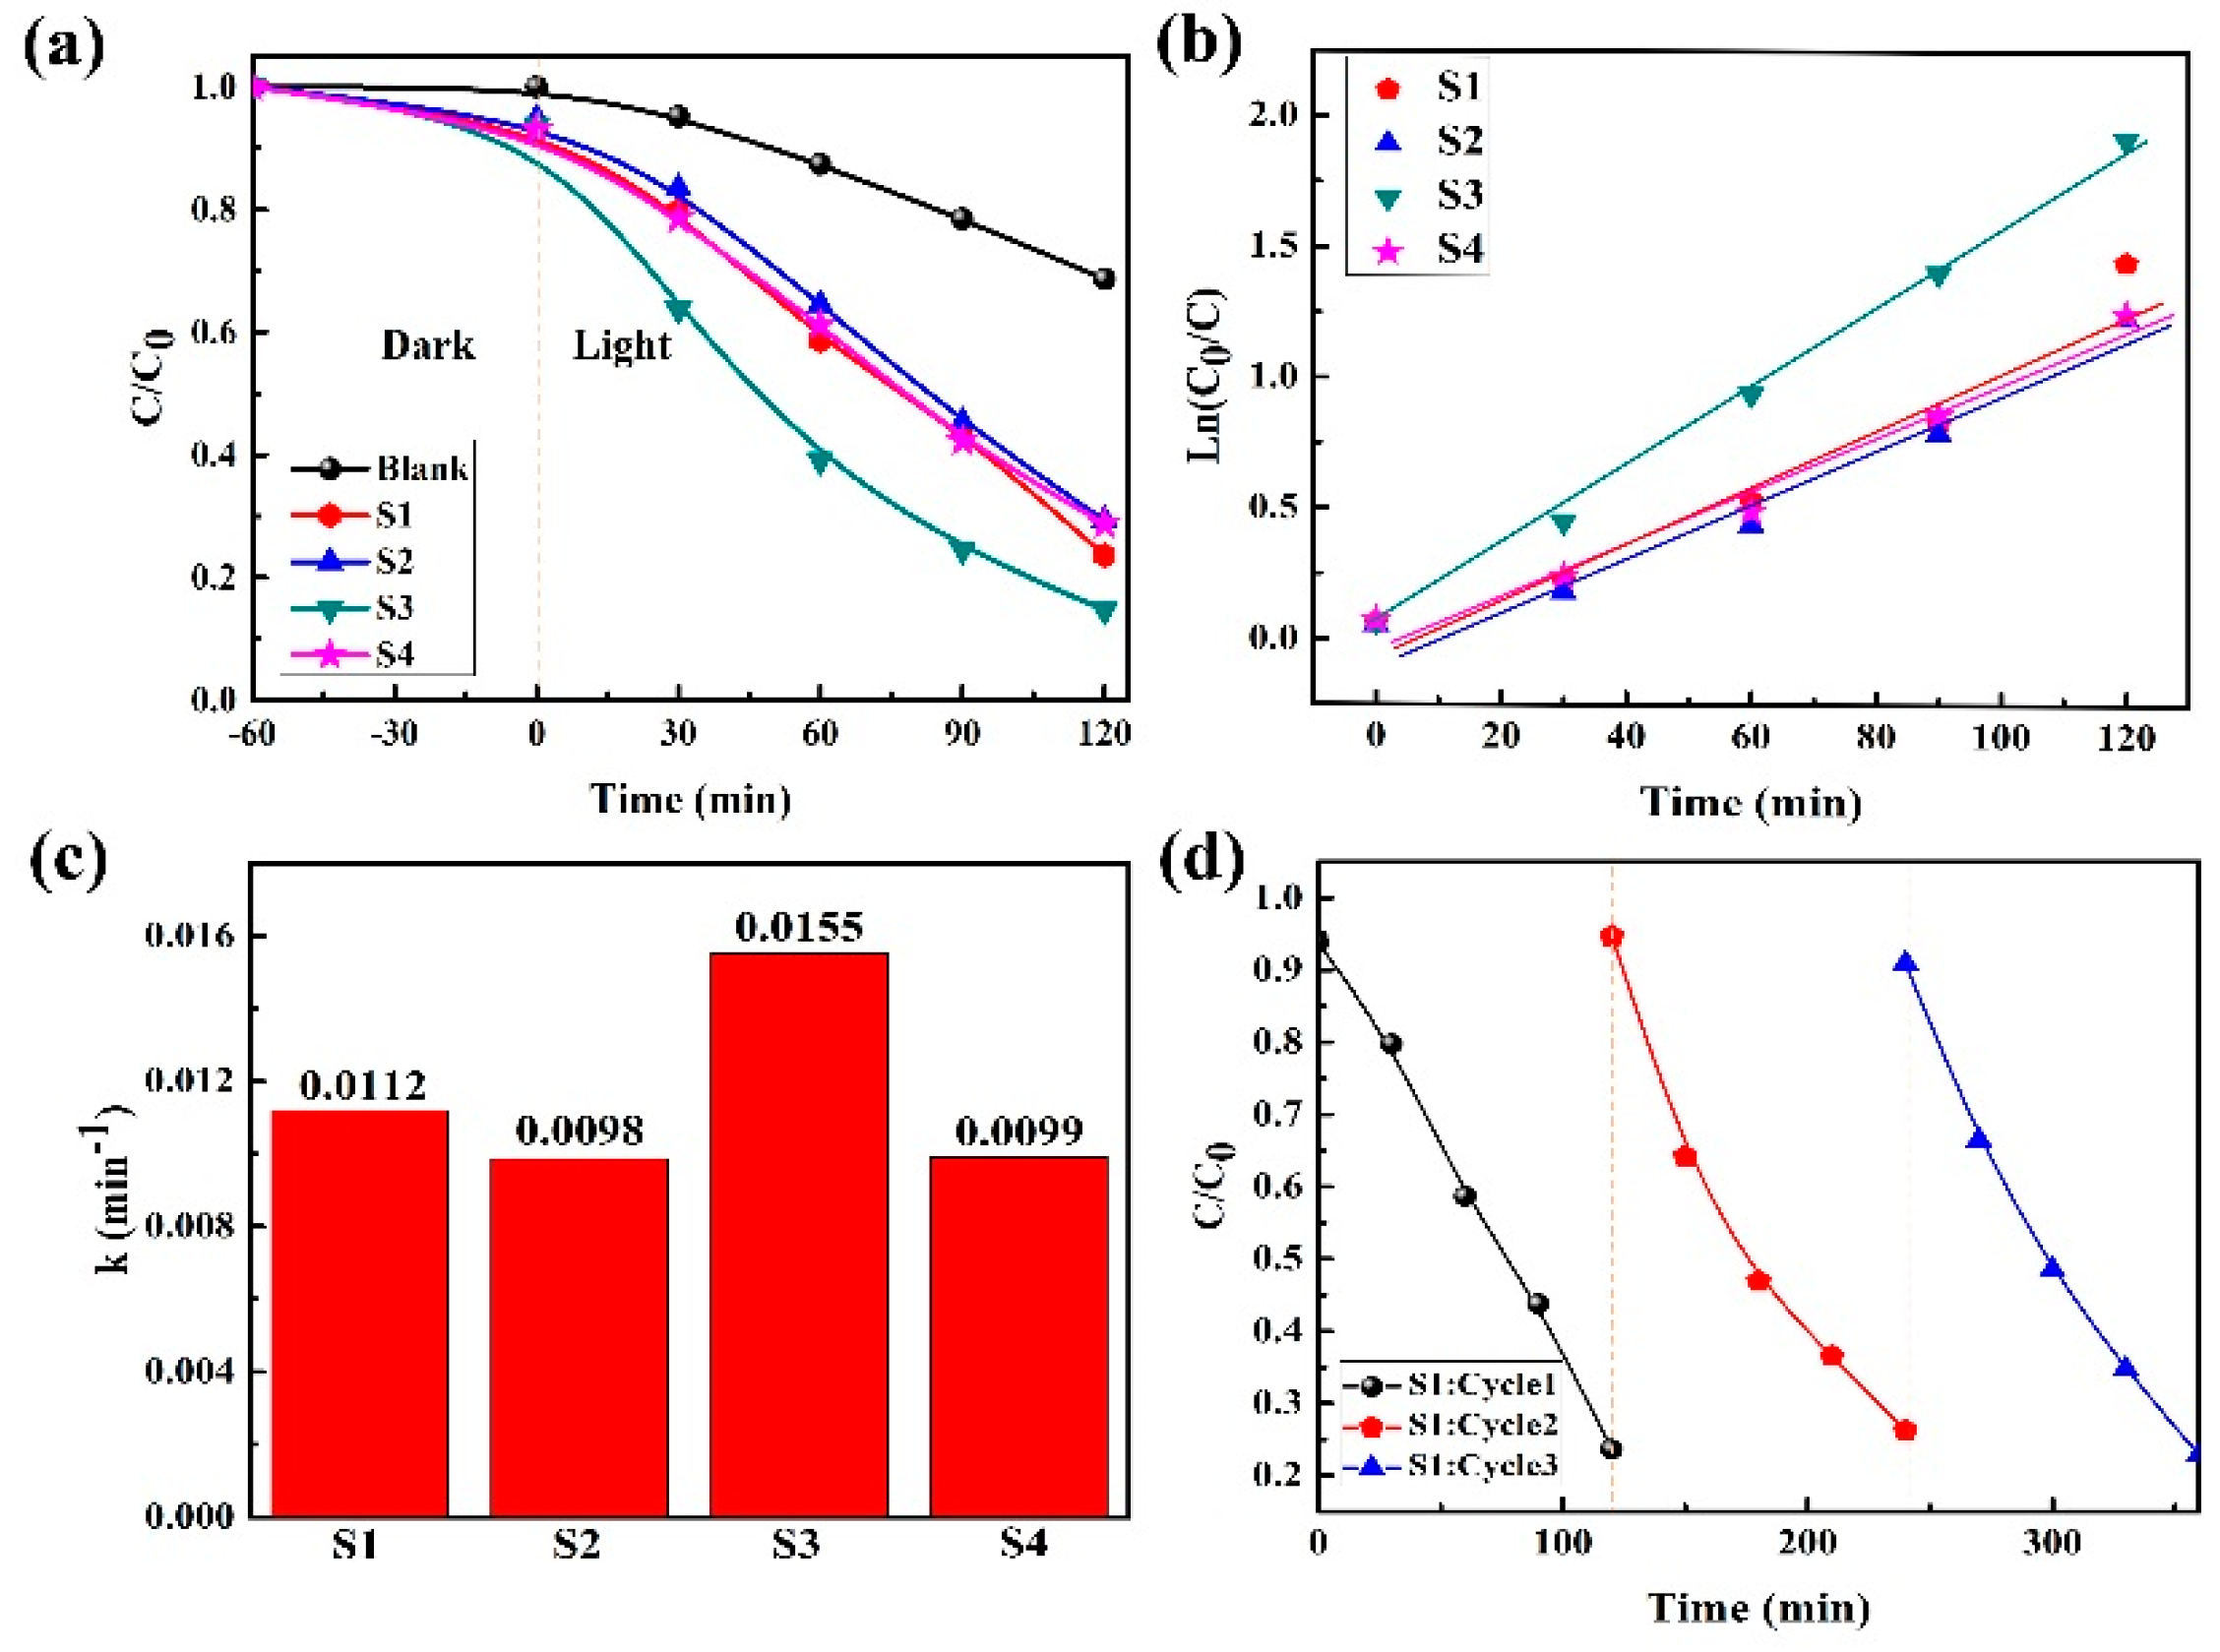
2.2. Photocatalytic Degradation Capability

The photocatalytic activities of the as-synthesized samples were evaluated by examining the degradation of RhB and TC solutions under UV light. The results of the photodegradation of RhB are presented in Figure 5. The Li2SnO3 photocatalyst exhibited impressive photocatalytic activities toward RhB solution, with photodegradation rates greater than 73% within 120 min of irradiation. Among the four samples, S3 displayed the highest activity, with a photodegradation rate reaching 86% within 120 min (Figure 5a). Meanwhile, the UV-vis absorption spectra demonstrated that the intensity of the colored solutions gradually decreased during treatment with the as-synthesized Li2SnO3 samples (Supplementary Figure S5). A pseudo-first-order kinetic model was adopted to quantitatively analyze the photocatalytic reaction kinetics [28]:
ln C C 0 = κ 1 t ,
where C ( mol · L 1 ) , C 0 ( mol · L 1 ) and κ 1 ( min 1 ) represented the instantaneous concentration of RhB at a given time t, the initial concentration of RhB solution at adsorption–desorption equilibrium, and the apparent reaction rate constant, respectively.
The corresponding dynamic curves ( ln C C 0 over time) of the as-synthesized photocatalysts are shown in Figure 5b. The dynamic curves of all the samples exhibited excellent linearity, revealing that the photodegradation conformed to ideal pseudo-first-order kinetics. As given in Figure 5c, the fitting kinetic constants ( κ 1 ) were 0.0112 (S1), 0.0098 (S2), 0.0155 (S3) and 0.0099 min−1 (S4), respectively, which were larger that than of blank RhB solution (0.003 min−1). The standard deviation of kinetic rate constant was calculated to be 0.0026. Evidently, the kinetic constant of sample S3 was slightly larger than those of the others.
Given that the ability of a photocatalyst to be recycled is critical for practical applications, cycling experiments and stability testing of samples S1 and S3 were performed. After three consecutive cycles, the photocatalytic performance remained almost stable (Figure 5d and Supplementary Figure S7a). In addition, as shown in Supplementary Figure S8a,c, the observed XRD patterns of samples S1 and S3 after three successive cycles of photocatalysis still matched well with pure phase Li2SnO3, indicating that both Li2SnO3 photocatalysts had outstanding stability and reusability during the photodegradation of RhB solution.
The photocatalytic rates for the photodegradation of TC solutions of all four as-synthesized samples were greater than 75% (Figure 6a), with the rate for sample S4 reaching a maximum of 83% within 120 min (Supplementary Figure S6). Figure 6b reveals that the photocatalytic degradation of the TC solutions followed a simple second-order kinetic model:
1 C 1 C 0 = κ 2 t ,
where C ( mol · L 1 ) and C 0 ( mol · L 1 ) represent the instantaneous concentration of TC solution at a given time t and the initial concentration of TC solution at adsorption–desorption equilibrium, and κ 2 (min−1 · L/mg) was the apparent second-order reaction rate constant. All samples displayed excellent linearity based on the second-order kinetic model. The corresponding kinetic rate constants (k2) were 0.0216(S1), 0.02(S2), 0.0268(S3) and 0.0406 min−1 · L/mg(S4), respectively, which were larger that than of blank TC solution (0.006 min−1 · L/mg). The standard deviation of kinetic rate constant was 0.0093. The kinetic constant of sample S4 was slightly greater than that of the others (Figure 6c).
The cycling ability of the photocatalysts during the degradation of TC solution was also examined. The photocatalytic performance of samples S1 and S4 showed no obvious loss after three cycles (Figure 6d and Supplementary Figure S7b), and the collected XRD patterns matched well with that of Li2SnO3 after the photocatalytic reactions, demonstrating that its structure remain unaltered. However, the crystalline peak intensity was slightly reduced. The results confirmed that Li2SnO3 was a relatively stable and reusable photocatalyst for the degradation of TC solution (Supplementary Figure S8b,d).

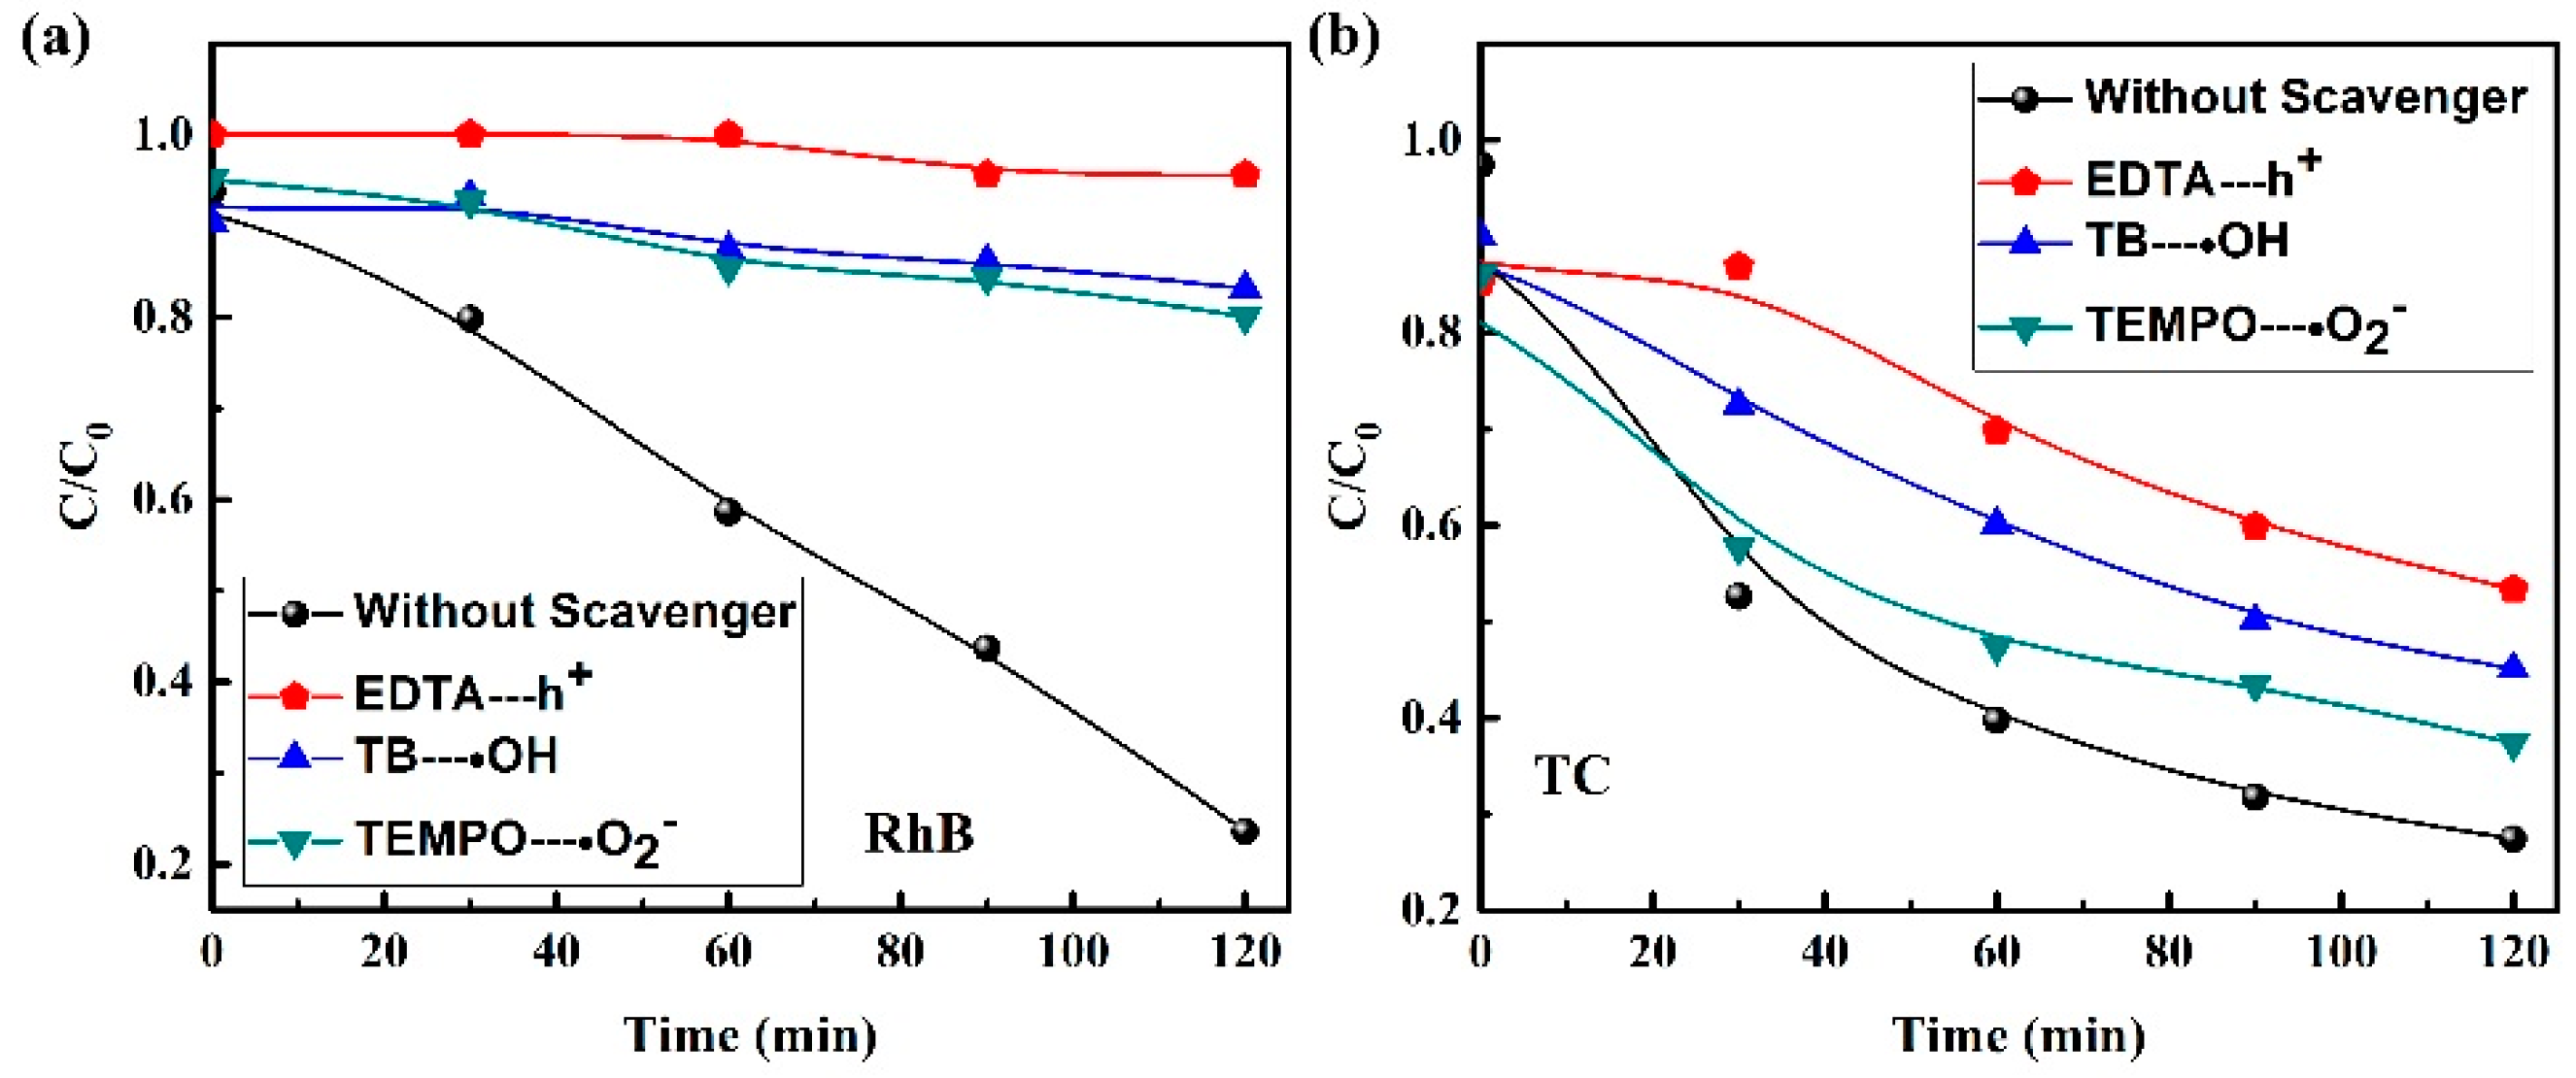
2.3. Mechanism of Photocatalytic Reaction

To further elucidate the photocatalytic oxidation mechanism, trapping experiments were performed to identify the active species that were present during the photodegradation of the RhB and TC solutions. IPA, EDTA and TEMPO are commonly used as scavengers to capture hydroxyl radicals ( · OH ), holes ( h + ) and superoxide radicals ( · O 2 ), respectively [29,30]. During the photodegradation of RhB (Figure 7a), the introduction of either IPA, EDTA or TEMPO significantly lowered the rate of photodegradation by 4%, 8% and 8.3%, respectively. This strong inhibiting action illustrated that h + , · OH and · O 2 all played crucial roles in the degradation of RhB. During the photodegradation of TC (Figure 7b), when EDTA was added, the degradation rate was reduced by 53%. In contrast, following the addition of IPA and TEMPO, the photodegradation rate decreased by 44% and 37%, respectively. These results indicated that h + was the dominant active species, while · OH played a secondary role and · O 2 a complementary role in the photodegradation of TC. Thus, the photodegradation of both RhB and TC solutions using the photocatalysts likely occurred via similar mechanisms, but with photogenerated active species that had different oxidation abilities.
A possible photocatalytic mechanism of Li2SnO3 was proposed based on the trapping experiments (Figure 8). The band edge positions of the valence band (VB) and conduction band (CB) were estimated by the following formulas [31]:
E V B = χ E e + 0.5 E g ,
E C B = E V B E g ,
where χ is the absolute electronegativity of the relevant semiconductor and could be calculated from the geometric mean of the absolute electronegativity of the individual atoms. E e is the energy of free electrons on the hydrogen scale (4.5 eV), and E g is the optical band gap. The calculated E V B and E C B of Li2SnO3 were 2.43 eV and −1.15 eV, respectively. The CB position was more negative than the redox couple O 2 / · O 2 (−0.33 eV vs NHE). Therefore, thermodynamically, O 2 could be reduced by electrons to produce · O 2 , which in turn could degrade RhB and TC in solution. Meanwhile, the calculated energy position of the VB was more positive than the redox couple · OH / O H (2.38 eV vs NHE). Thus, the h + could oxidize water to generate the active species · OH , which would further degrade the pollutants. The · OH reactive species were also detected using fluorescence spectroscopy. The increase of fluorescence intensity with prolonged irradiation time was consistent with the proposed model (Supplementary Figure S9). This thermodynamic analysis was in good agreement with the trapping experiments.

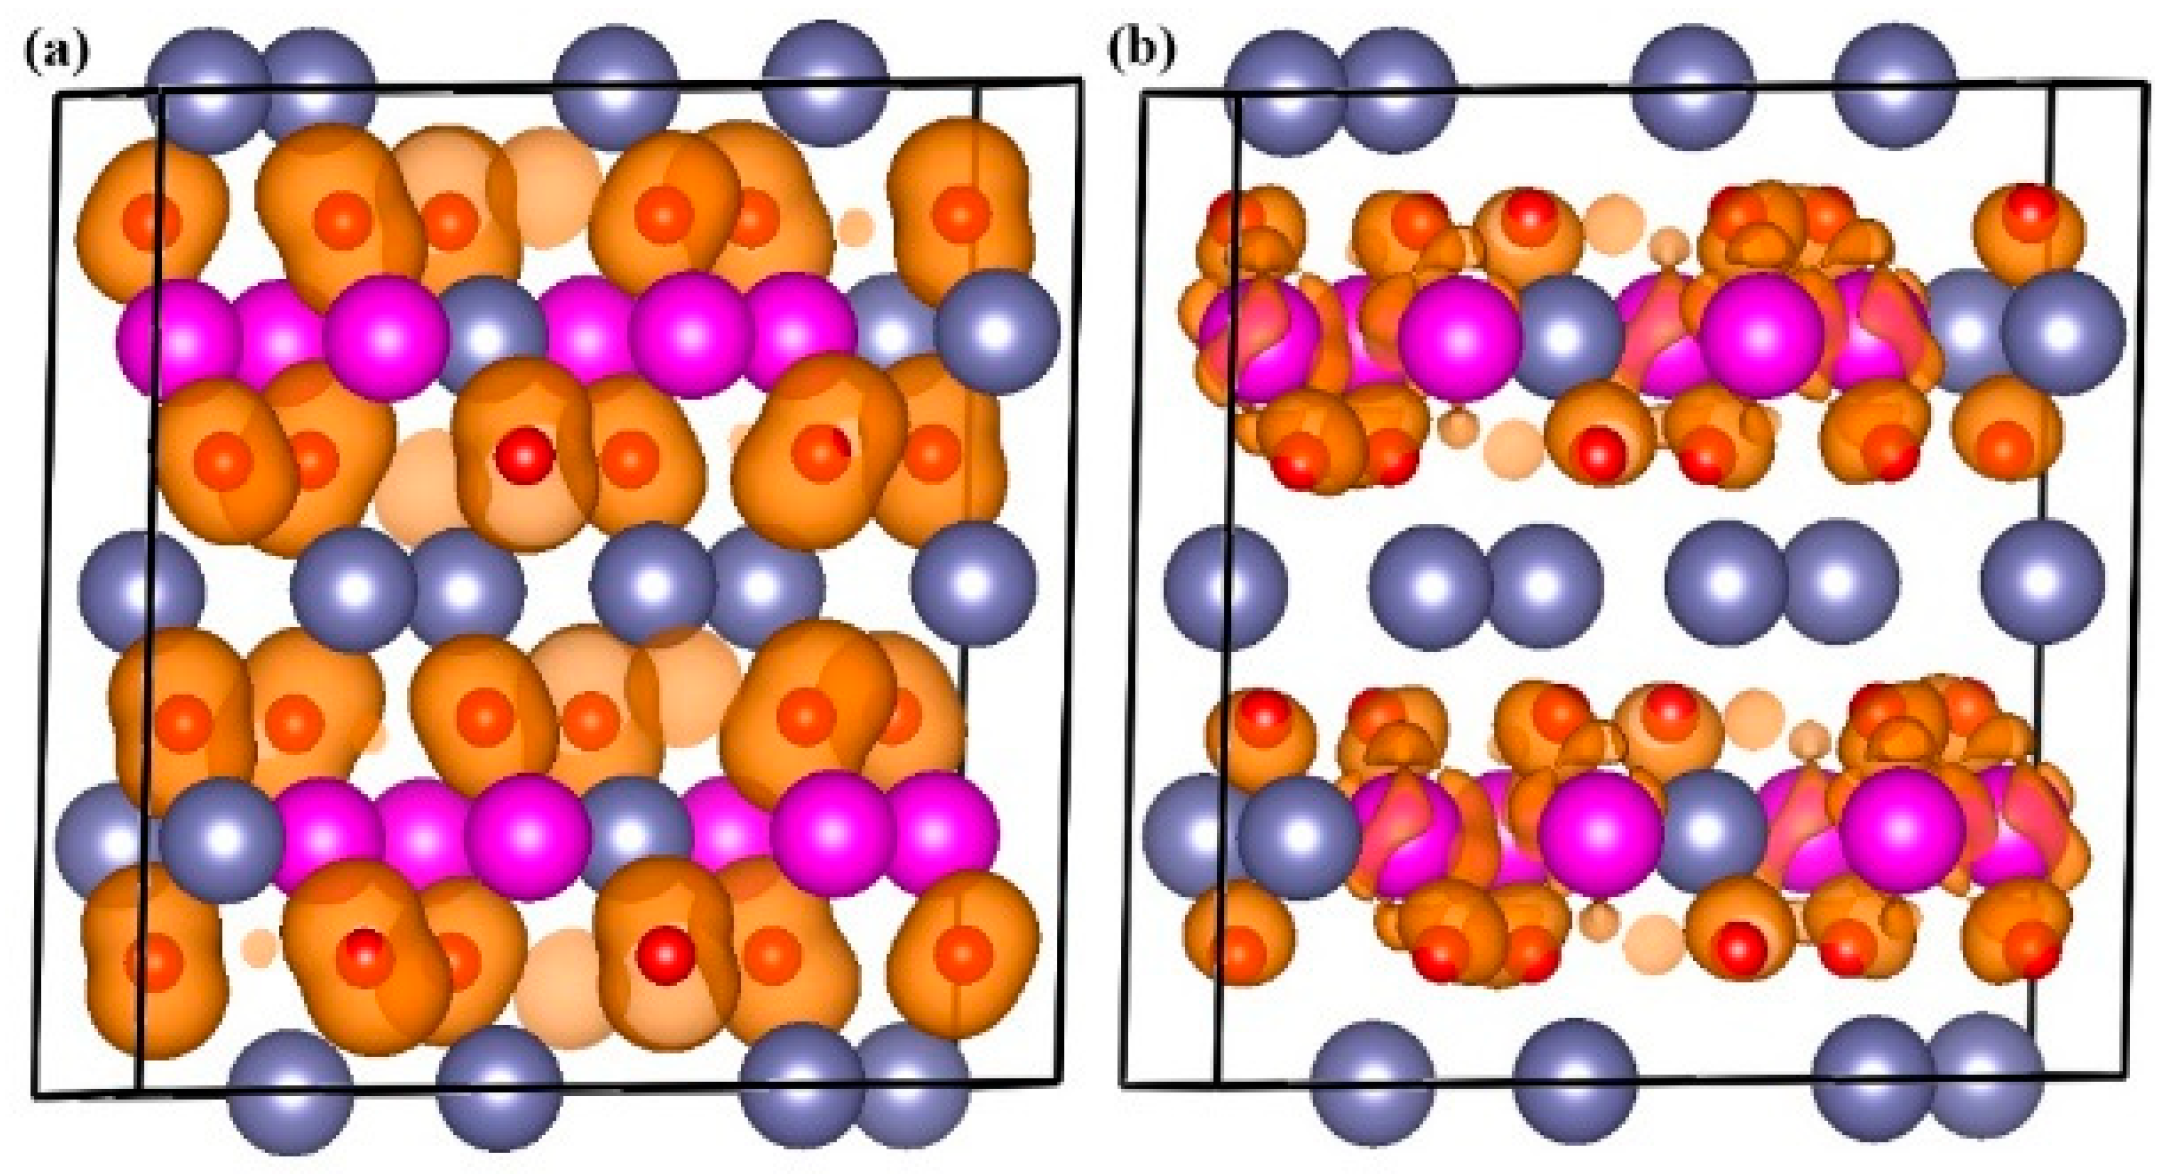
2.4. Theoretical Analysis

To gain an in-depth understanding of the excellent photocatalytic performance of Li2SnO3, we performed theoretical calculations using DFT. First, the phonon dispersion of Li2SnO3 was calculated to check the stability of the structure in terms of lattice dynamics. As presented in Supplementary Figure S10, there were 48 atoms in the unit cell. Hence, 144 phonon branches would be expected, where the lowest three branches were acoustic. No imaginary frequency was found at any q vectors in the entire Brillouin zone, which confirmed that the crystal structure of Li2SnO3 was dynamically stable.
We then calculated the electronic band structure of Li2SnO3. We limited our analysis to the electronic states near the band edge, where the photogenerated carriers were produced. As shown in Figure 9a, our calculations indicated that Li2SnO3 was a direct semiconductor in which the valence band maximum (VBM) and conduction band maximum (CBM) were located at the Γ point. The simulated band gap was 3.27 eV, which was smaller than the experimental value. To model the recombination of photogenerated electron-hole pairs, the effective mass was also calculated. In general, a larger m h * / m e * value indicates a greater difference in mobility between electrons and holes. This would imply a lower probability of recombination and improved photocatalytic performance. The effective mass was extracted from the second derivative of the energy level of the band edges using the following equation [32]:
m * = ± 2 ( 2 E n ( k ) k 2 ) 1
where E n ( k ) is the band energy for n-th band level in k-space. Herein, the fitted values of m h * and m e * were 1.5 me and 0.32 me, respectively. Our results were similar to those obtained for SnO2 [33], indicating that the binding energy in Li2SnO3 was relatively small. The value of m h * / m e * was approximately 4.7, which was much larger than that of another state-of-the-art photocatalyst, BiVO4 [34]. These results revealed that Li2SnO3 had intrinsically excellent band edge characteristics for the separation of electron-hole pairs.
Next, we examined the total and partial density of states near the band edge. As shown in Figure 9b, the VBM was primarily dominated by the O-2p states, while the CBM mainly originated from the Sn-4s and O-2p states. Intuitively, as exhibited by the partial density of charge in real space around the VBM and CBM (Figure 10), the holes were mostly located around the O atoms, offering photocatalytic reaction sites. In contrast, the electrons were primarily distributed along the Sn–O bonds.
On the basis of this analysis, we attributed the excellent photocatalytic properties of Li2SnO3 to the following: (1) the Li2SnO3 samples featured a porous, layered crystal structure, in which the photogenerated carriers could be easily transported to the edge of the surface to ensure effective spatial charge separation. (2) The electronic structure analysis revealed that the large m h * / m e * ratio was beneficial for the separation of the photo-induced electron-hole pairs. Despite these intrinsic advantages for photocatalysis, it is important to note that the sizes of the as-synthesized samples were on the micrometer scale, which means that the photocatalytic performance of these materials could be further optimized through microstructure engineering to increase the surface area. Other strategies, including defect introduction, doping, band engineering or building a hetero-junction, should also help improve these materials. The intrinsic electronic properties and crystal structure, excellent photodegradation performance and high stability means that Li2SnO3 is a promising candidate for use in photocatalysis.

3. Materials and Methods

3.1. Preparation of the Photocatalysts

Polycrystalline Li2SnO3 samples were prepared using a conventional solid-state reaction [26]. Considering the evaporation loss of lithium during sintering, different molar ratios of Li2CO3/SnO2 were used to synthesize Li2SnO3 (i.e., 1.11 mmol/1.00 mmol, 1.09 mmol/1.00 mmol, 1.07 mmol/1.00 mmol and 1.05 mmol/1.00 mmol). The resulting samples are denoted as S1, S2, S3, and S4, respectively. The reactants were mixed and ground together within a mortar for 30 min. Then, the mixture was heated at 850 °C for 6 h. After cooling to ambient temperature naturally, the final products were washed in water to remove any soluble impurities. Subsequently, the obtained samples were dried at 60 °C overnight for further characterization.

3.2. Characterizations and Computations

Powder XRD was performed on a PANalytical X’pert powder diffractometer equipped with a PIXcel detector and with CuKα radiation (40 kV and 40 mA). A scanning step width of 0.01° and a scanning rate of 0.1° s−1 were used to record the patterns in the 2θ range of 6–90°. A JEOL JSM-6700F field emission scanning electron microscope was employed to investigate the surface morphologies. The TEM and high-angle angular dark field (HAADF) images and energy dispersive spectrometry (EDS) of Li2SnO3 were recorded using a Talos F200S G2 Microscope to determine the microstructures of the samples. The UV-vis diffuse reflectance data were collected at ambient temperature using powder samples, with BaSO4 as a standard, on a Shimadzu UV-3150 spectrophotometer over the spectral range 200–800 nm. The Fourier transform infrared spectra (FT-IR) were obtained by using a Nicolet 360 spectrometer with a 2 cm−1 resolution in the range of 500–4000 cm−1. The BET specific surface areas were investigated by means of N2 adsorption-desorption at 77 K using a Quantachrome QuadraWin. Fluorescence spectra were measured on a Hitachi fluorescence spectrophotometer F-7000.
First-principles computations based on density functional theory (DFT) were performed with a plane wave basis set as implemented in the Vienna Ab initio Simulation Package (VASP). The projector-augmented wave (PAW) method was used to describe the ion–electron interaction. The generalized gradient approximation (GGA) was implemented using the functional of Perdew, Burke, and Ernzerhof (PBE) [35,36]. The geometry was fully relaxed until the maximum Hellmann–Feynman forces were less than 0.01 eV Å−1. The electronic structure, as well as the density of states and partial charge density, were obtained with an energy cut-off 400 eV. The Monkhorst–Pack K-point set of 9 × 9 × 9 in the Brillouin zone of the unit cell was adopted [37]. The lattice dynamics of Li2SnO3 was investigated using the frozen phonon method, which was implemented in the Phonony package.

3.3. Photocatalytic Activity Experiments

The photocatalytic performance of Li2SnO3 was evaluated via the degradation of solutions of RhB and TC. The external light irradiation source was a 500 W high-pressure mercury lamp (CEL-M500, Beijing Aulight) without cutoff filter. The mercury lamp had several spectral lines with different intensities and 365 nm spectral line presented the strongest output energy in UV region (Supplementary Figure S1). The light source was maintained at a distance of 20 cm from the reactant solution on the top of the reaction vessel and the reactant solution was maintained at ambient temperature by providing a flow of cooling water during the photocatalytic reaction. The light intensity on the surface of the suspension was approximately 57.80 mW/cm2. Before irradiation, the photocatalyst powder (30 mg) and RhB solution (10 mg L−1, 100 mL) or TC solution (20 mg L−1, 100 mL) were allowed to stir in the dark for 1 h to establish the adsorption–desorption equilibrium. Then, the reaction vessel was exposed to the light, and 5-mL aliquots of the suspension were taken at given time intervals and separated by centrifugation. The concentrations of the RhB or TC solutions were determined by UV-vis spectrometry at their maximum absorption peaks of 464 nm and 357 nm, respectively. Considering the small loss of the catalysts in the recycling process, several batches of repeated experiments for each cycle were performed. Then, the catalysts were collected and mixed to maintain the weight of 30 mg for each test. The trapping experiments to determine the active species were performed as follows: Li2SnO3 (30 mg) was added to the RhB (10 mg L−1, 100 mL) and TC (20 mg L−1, 100 mL) solution, respectively. Then, 2-propanol (IPA, 10 mL), disodium ethylenediaminetetraacetic acid (EDTA, 0.2 mmol) and 2,2,6,6-tetramethylpiperidine-1-oxyl (TEMPO, 0.2 mmol) were added in sequence to trap · OH , h + and · O 2 radicals, respectively. Additionally, · OH trapping experiments using fluorescence spectroscopy were performed as follows: Li2SnO3 (30 mg) and terephthalic acid (TA, 8.3 mg) were dissolved in NaOH solution (2 mmol L−1, 100 mL), which was stirred for 60 min in the dark and then irradiated by a 500 W mercury lamp. The fluorescence emission spectrum (excited at 316 nm) of the solution was measured every 30 min during the photocatalytic reaction.

4. Conclusions

In this work, layered Li2SnO3 was prepared via a solid-state method and used as an efficient photocatalyst for the first time. Structural characterization was performed using powder XRD, FT-IR, SEM and TEM. The optical band gap that was measured via UV-vis DRS was 3.71 eV, indicated that these materials should act as UV-light-driven photocatalysts. The dynamics of the photodegradation of RhB followed pseudo-first-order kinetics, while the degradation of TC was consistent with a simple second-order kinetic model. The maximum kinetic rate constants of photocatalytic degradation of RhB and TC solutions were 0.0155 min-1 and 0.0406 min−1 · L/mg, respectively. Trapping experiments revealed that h + , · OH and · O 2 were the main reactive species. Electronic structure calculations demonstrated that Li2SnO3 was a direct semiconductor and O-2p states were the reaction sites for the oxidative photodegradation of the pollutants. In addition, the value of m h * / m e * was found to be approximately 4.7, which indicated that the separation of photogenerated electron-hole pairs was effective. The layered crystalline structure and large m h * / m e * resulted in the Li2SnO3 materials acting as promising candidates for photocatalysis. This work will allow further improvements in the design of highly efficient oxide photocatalysts with layered crystal structures for environmental remediation.

Supplementary Materials

The following are available online at https://www.mdpi.com/2073-4344/9/9/712/s1, Figure S1. The spectrum of high pressure mercury lamp used in our experiment (CEL-M500, Beijing Aulight). Figure S2: Rietveld refinement plots of samples S1, S2, S3, and S4, respectively; Figure S3: FT-IR spectrum of Li2SnO3 samples: S1, S2, S3, and S4; Figure S4. The specific surface area performed by BET measurement with N2 adsorption-desorption. Figure S5: UV-visible absorption of RhB as a function of irradiation time for samples: S1, S2, S3, and S4, respectively; Figure S6: UV-visible absorption of TC solution as a function of irradiation time for samples: S1, S2, S3, and S4, respectively; Figure S7. (a) and (b) Cycling experiments of sample S3 for RhB and S4 for TC solution photo-degradation, respectively; Figure S8: (a) XRD patterns of sample S1 before and after the photocatalytic reaction of degrading RhB. (b) XRD patterns of sample S1 before and after the photocatalytic reaction of degrading TC. (c) XRD patterns of sample S3 before and after the photocatalytic reaction of degrading RhB. (d) XRD patterns of sample S4 before and after the photocatalytic reaction of degrading TC; Figure S9: Hydroxyl radical OH detecting photoluminescence (PL) spectra of Li2SnO3 in TA solution under UV light irradiation; Figure S10: Phonon band structure of Li2SnO3 along high symmetric points in the Brillouin zone. Table S1: The crystallographic parameters of the as-synthesized samples Li2SnO3 via Rietveld refinement.

Author Contributions

The work was completed by cooperation of all authors. Y.L., B.Z. and D.Y. were responsible for the study of concept and design of the project. M.W., H.Z., J.S. completed the experimental part, M.W., Q.L. and T.Z. analyzed the data, B.Z. completed the characterization. Y.L. and D.Y. drafted and revised the manuscript.

Funding

This project was supported by the National Natural Science Foundation of China (No. 21808076), the Basic and Frontier Research Project of Chongqing Science and Technology Commission (Nos. cstc2018jcyjAX0827, cstc2017jcyjAX0258), the project of Scientific and Technological Research Program of Chongqing Municipal Education Commission (Nos. KJQN201801135, KJQN201800110, KJ1601403). This project was funded by Children’s Research Institute of National Center for Schooling Development Programme and Chongqing University of Education (No. CRIKT201909) and the project of Science and Technology Collaborative Innovation Platform Construction of Chongqing University of Education (No. 2017XJPT01), the Cultivation for National Science Foundation of Chongqing University of Education (No. 18GZKP01).

Conflicts of Interest

The authors declare no conflict of interest.

References

  1. Chen, C.C.; Ma, W.H.; Zhao, J.C. Semiconductor-mediated photo-degradation of pollutants under visible light irradiation. Chem. Soc. Rev. 2010, 39, 4206–4219. [Google Scholar] [CrossRef] [PubMed]
  2. Haque, F.; Daeneke, T.; Zadeh, K.K.; Ou, J.Z. Two-Dimensional Transitional Metal Oxide and Chalcogenide Based Photocatalysts. Nano-Micro Lett. 2018, 10, 23–49. [Google Scholar] [CrossRef] [PubMed]
  3. Wang, H.L.; Zhang, L.S.; Chen, Z.G.; Hu, J.Q.; Li, S.J.; Wang, Z.H.; Liu, J.S.; Wang, X.C. Semiconductor Heterojunction Photocatalysts: Design, Construction and Photocatalytic Performances. Chem. Soc. Rev. 2014, 43, 5234–5244. [Google Scholar] [CrossRef] [PubMed]
  4. Schneider, J.; Matsuoka, M.; Takeuchi, M.; Zhang, J.L.; Horiuchi, Y.; Anpo, M.; Bahnemann, D.W. Understanding TiO2 Photo-catalysis: Mechanisms and Materials. Chem. Rev. 2014, 114, 9919–9986. [Google Scholar] [CrossRef] [PubMed]
  5. Cheng, L.; Xiang, Q.J.; Liao, Y.L.; Zhang, H.W. CdS Based Photocatalyst. Energy Environ. Energy Environ. Sci. 2018, 11, 1362–1391. [Google Scholar] [CrossRef]
  6. Wang, H.; Zhang, X.D.; Xie, Y. Photoresponsive Polymeric Carbon Nitride Based Materials: Design and Application. Mater. Today 2019, 23, 72–86. [Google Scholar] [CrossRef]
  7. Ong, W.J.; Tan, L.L.; Ng, Y.H.; Yong, S.T.; Chai, S.P. Graphitic Carbon Nitride (g-C3N4)-Based Photo-catalysts for Artificial Photo-synthesis and Environmental Remediation: Are We a Step Closer to Achieving Sustainability? Chem. Rev. 2016, 116, 7159–7329. [Google Scholar] [CrossRef] [PubMed]
  8. Wen, J.Q.; Xie, J.; Chen, X.B.; Li, X. A Review on g-C3N4 Based Photo-catalysts. Appl. Surf. Sci. 2017, 391, 72–123. [Google Scholar] [CrossRef]
  9. Jin, C.H.; Lin, F.; Suenaga, K.; Lijima, S. Fabrication of a Freestanding Boron Nitride Single Layer and Its Defect Assignments. Phys. Rev. Lett. 2009, 102, 195505–195508. [Google Scholar] [CrossRef]
  10. Wang, Q.H.; Zadeh, K.K.; Kis, A.; Coleman, J.N.; Strano, M.S. Electronics and Optoelectronics of Two Dimensional Transition Metal Dichalcogenides. Nat. Nanotechnol. 2012, 7, 699–712. [Google Scholar] [CrossRef]
  11. Wang, X.C.; Maeda, K.; Thomas, A.; Takanabe, K.; Xin, G.; Carlsson, J.M.; Domen, K.; Antonietti, M. A Metal Free Polymeric Photocatalyst for Hydrogen Production from Water under Visible Light. Nat. Mater. 2009, 8, 76–80. [Google Scholar] [CrossRef] [PubMed]
  12. Kim, H.G.; Hwang, D.W.; Lee, J.S. An Undoped Single Phase Oxide Photocatalyst Working under Visible Light. J. Am. Chem. Soc. 2004, 126, 8912–8913. [Google Scholar] [CrossRef] [PubMed]
  13. Hailili, R.; Dong, G.H.; Ma, Y.C.; Wang, S.J.C.Y.; Xu, T. Layered Perovskite Pb2Bi4Ti5O18 for Excellent Visible Light Driven Photocatalytic No Removal. Ind. Eng. Chem. Res. 2017, 56, 2908–2916. [Google Scholar] [CrossRef]
  14. Cheng, X.Y.; Meng, D.C.; Yang, H.S.; Ruan, K.Q.; Xu, X.L. Multiferroic and Visible Light Photo-catalytic Properties of Six-layered Perovskite Oxide Nd6Ti4Fe2O20. Appl. Phys. A 2017, 123, 301–306. [Google Scholar] [CrossRef]
  15. Rodionov, I.A.; Zvereva, I.A. Photocatalytic Activity of Layered Perovskite Like Oxides in Practically Valuable Chemical Reactions. Russ. Chem. Rev. 2016, 85, 248–279. [Google Scholar] [CrossRef]
  16. Muktha, B.; Priya, M.H.; Madras, G.; Row, T.N.G. Synthesis, Structure and Photo-catalysis in a New Structural Variant of the Aurivillius Phase: LiBi4M3O14 (M = Nb, Ta). J. Phys. Chem. B 2005, 109, 11442–11449. [Google Scholar] [CrossRef]
  17. Watanabe, K.; Iwase, A.; Nozawa, S.; Adachi, S.I.; Kudo, A. Effects of Coapplication of Rh-doping and Ag-substitution on Band Structure of Li2TiO3 and the Photocatalytic Property. ACS Sustain. Chem. Eng. 2019, 7, 9881–9887. [Google Scholar] [CrossRef]
  18. Zhou, Y.G.; Zhang, Y.F.; Lin, M.S.; Long, J.L.; Zhang, Z.Z.; Lin, H.X.; Wu, J.C.S.; Wang, X.X. Monolayered Bi2WO6 Nanosheets Mimicking Heterojunction Interface with Open Surfaces for Photocatalysis. Nat. Commun. 2015, 6, 8340–8347. [Google Scholar] [CrossRef]
  19. Shein, I.R.; Denisova, T.A.; Baklanova, Y.V.; Ivanovskii, A.L. Structural, Electronic Properties and Chemical Bonding in Protonated Lithium Metallates Li2-xHxMO3 (M = Ti, Zr, Sn). J. Struct. Chem. 2011, 52, 1043–1050. [Google Scholar] [CrossRef]
  20. Wang, Q.F.; Huang, Y.; Miao, J.; Zhao, Y.; Wang, Y. Synthesis and Properties of Li2SnO3/polyaniline Nanocomposites as Negative Electrode Material for Lithium-ion Batteries. Appl. Surf. Sci. 2012, 258, 9896–9901. [Google Scholar] [CrossRef]
  21. Liu, C.W.; Wu, N.X.; Mao, Y.L.; Bian, J.J. Phase Formation, Microstructure and Microwave Dielectric Properties of Li2SnO3-MO (Mg, Zn) Ceramics. J. Electroceramics 2014, 32, 199–204. [Google Scholar] [CrossRef]
  22. Sathiya, M.; Rousse, G.; Ramesha, K.; Laisa, C.P.; Vezin, H.; Sougrati, M.T.; Doublet, M.L.; Foix, D.; Gonbeau, D.; Walker, W.; et al. Reversible Anionic Redox Chemistry in High Capacity Layered Oxide Electrodes. Nat. Mater. 2013, 12, 827–835. [Google Scholar] [CrossRef] [PubMed]
  23. Howard, J.; Holzwarth, N.A.W. First Principles Simulations of the Porous Layered Calcogenides Li2+xSnO3 and Li2+xSnS3. Phys. Rev. B 2016, 94, 064108–064120. [Google Scholar] [CrossRef]
  24. Ben, Y.M.; Vergnet, J.; Saubanere, M.; Doublet, M.L. Unified Picture of Anionic Redox in Li/Na-ion Batteries. Nat. Mater. 2019, 18, 496–502. [Google Scholar] [CrossRef] [PubMed]
  25. Xu, J.; Sun, M.L.; Qiao, R.M.; Renfrew, S.E.; Ma, L.; Wu, T.P.; Hwang, S.; Nordlund, D.; Su, D.; Amine, K.; et al. Elucidating Anionic Oxygen Activity in Lithium Rich Layered Oxides. Nat. Commun. 2018, 9, 947–956. [Google Scholar] [CrossRef] [PubMed]
  26. Tecedor, M.G.; Bartolome, J.; Maestre, D.; Trampert, A.; Cremades, A. Li2SnO3 Branched Nano- and Microstructures with Intense and Broadband White Light Emission. Nano Res. 2019, 12, 441–448. [Google Scholar] [CrossRef]
  27. Kreuzburg, G.; Stewner, F.; Hoppe, R. Die Kristallstruktur von Li2SnO3. Z. Fuer Anorg. Und Allg. Chem. 1971, 379, 242–254. [Google Scholar] [CrossRef]
  28. Zhao, H.P.; Li, G.F.; Tian, F.; Jia, Q.T.; Liu, Y.L. Rg-C3N4 Surface-decorated Bi2O2CO3 for Improved Photocatalytic Performance: Theoretical Calculation and Photo-degradation of Antibiotics in Actual Water Matrix. Chem. Chem. Eng. J. 2019, 366, 468–479. [Google Scholar] [CrossRef]
  29. Li, H.P.; Liu, J.Y.; Hou, W.G.; Du, N.; Zhang, R.J.; Tao, X.T. Synthesis and Characterization of g-C3N4/Bi2MoO6 Heterojunctions with Enhanced Visible Light Photocatalytic Activity. Appl. Catal. B Environ. 2014, 160, 89–97. [Google Scholar] [CrossRef]
  30. Liu, C.; Zhu, H.J.; Zhu, Y.S.; Dong, P.Y.; Hou, H.J.; Xu, Q.X.; Chen, X.W.; Xi, X.G.; Hou, W.H. Ordered Layered N-doped KTiNbO5/g-C3N4 heterojunction with Enhanced Visible Light Photocatalytic Activity. Appl. Catal. B Environ. 2018, 228, 54–63. [Google Scholar] [CrossRef]
  31. Zhuang, H.L.; Hennig, R.G. Theoretical Perspective of Photocatalytic Porperties of Single Layer SnS2. Phys. Rev. B 2013, 88, 115314–115318. [Google Scholar] [CrossRef]
  32. Harb, M.; Cavallo, L. Suitable Fundamental Properties of Ta0.75V0.25ON Material for Visible Light Driven Photo-catalysis: A DFT Study. ACS Omega 2016, 1, 1041–1048. [Google Scholar] [CrossRef]
  33. Li, Y.Y.; Yang, Q.M.; Wang, Z.M.; Wang, G.Y.; Zhang, B.; Zhang, Q.; Yang, D.F. Rapid Fabrication of SnO2 Nanoparticle Photo-catalyst: Computational Understanding and Photo-catalytic Degradation of Organic Dye. Inorg. Chem. Front. 2018, 5, 3005–3014. [Google Scholar] [CrossRef]
  34. Ma, Z.J.; Yi, Z.G.; Sun, J.; Wu, K.C. Electronic and Photocatalytic Properties of Ag3PC4 (C = O, S, Se): A Systemic Hybrid DFT Study. J. Phys. Chem. C 2012, 116, 25074–25080. [Google Scholar] [CrossRef]
  35. Blochl, P.E. Projector Augmented Wave Method. Phys. Rev. B 1994, 50, 17953–17979. [Google Scholar] [CrossRef]
  36. Perdew, J.P.; Burke, K.; Ernzerhof, M. Generalized Gradient Approximation Made Simple. Phys. Rev. Lett. 1996, 77, 3865–3868. [Google Scholar] [CrossRef] [Green Version]
  37. Monkhorst, H.J.; Pack, J.D. Special Points for Brillouin Zone Integrations. Phys. Rev. B 1976, 13, 5188–5192. [Google Scholar] [CrossRef]
Figure 1. (a) Schematic image of Li2SnO3 viewed along a direction and (b) [Li1/3Sn1/3O2] layer structure (planar projection along c direction).
Catalysts 09 00712 g001
Figure 2. (a) Powder X-ray diffraction patterns and (b) UV-vis diffuse reflectance spectra of Li2SnO3 samples: S1, S2, S3, and S4.
Catalysts 09 00712 g002
Figure 3. SEM images of the as-synthesized Li2SnO3 samples. (a) S1 (b) S2 (c) S3 (d) S4.
Catalysts 09 00712 g003
Figure 4. TEM images of sample S1 (a) TEM, (b) HRTEM image recorded on the area marked by the red rectangle in (a) (insert: simulated selected area electron diffraction (SAED) image) and (c) energy dispersive spectrometry (EDS) elemental mappings.
Catalysts 09 00712 g004
Figure 5. (a) Photocatalytic degradation of RhB with as-prepared samples under UV light irradiation. (b) The pseudo-first-order reaction kinetics for RhB degradation with the as-synthesized samples S1, S2, S3, and S4. (c) Kinetic constants for photocatalytic degradation of RhB. (d) Cycling experiments for sample S1 for RhB degradation.
Catalysts 09 00712 g005
Figure 6. (a) Photocatalytic degradation of TC with as-prepared samples under UV light irradiation. (b) Plot based on simple second-order kinetic model for TC degradation with the as-synthesized samples S1, S2, S3, and S4. (c) Kinetic constants for photocatalytic degradation of TC. (d) Cycling experiments of sample S1 for TC degradation.
Catalysts 09 00712 g006
Figure 7. Trapping experiments to identify active species during the photocatalytic degradation of (a) RhB solution and (b) TC solution.
Catalysts 09 00712 g007
Figure 8. Schematic illustration of the proposed photocatalytic mechanism.
Catalysts 09 00712 g008
Figure 9. Calculated (a) band structure and (b) density of states of Li2SnO3.
Catalysts 09 00712 g009
Figure 10. Iso-surfaces of charge density with given energy window of 0.2 eV from the bottom and top of the band edge (a) VBM (iso-surface value 0.008) and (b) CBM (iso-surface value 0.00001).
Catalysts 09 00712 g010

